Embed Size (px)
Citation preview

Regulation in the US telecommunication sector and
its impact on risk
Daniel Grote
The Centre for Market and Public Organisation
University of Bristol
August 2006
Corresponding address:
Daniel Grote
The Centre for Market and Public Organisation
Bristol Institute of Public Affairs
University of Bristol
2 Priory Road
Bristol BS8 1TX
United Kingdom
Phone: +44 (0)117 33 10738
E-mail: [email protected]
Regulation in the US telecommunication sector and its impact on risk
Daniel Grote*
Abstract
From the 1980s onwards price-cap regulation replaced traditional rate-of-return
regulation as regulatory instrument in almost all network sectors. According to the
“new regulatory economics” rate-of-return regulation sets low incentives for cost
reductions and efficiency improvements, since the company could pass through any
cost changes to customers but is not allowed to retain additional profits. Shifting risk
from the customers to the company’s stockowners, via a switch to price-cap
regulation, should increase incentives and result in higher efficiency levels. However,
the empirical literature on the impact of regulation on company performance shows
quite mixed results (indicating increased, unchanged or even decreased incentives
under price-cap regulation) and there are very few empirical studies addressing the
risk-regulation relationship directly.
The US telecommunication sector is almost the only case where the regulatory
instruments for private companies have been changed. Since each state in the USA
can and does apply a different regulatory system for intrastate telephone calls, a huge
number of regulatory changes took place, with quite a few states reverting to rate-of-
return regulation after they had already switched to price-cap regulation. As all larger
companies operate in a number of states, we are able to estimate the impact of
regulation for each telecommunication company by weighting each state with the
number of lines the company owns within this state.
This paper analyses the relationship between regulation and risk regarding their effect
on incentives and discuss the strengths and weaknesses of the existing literature. We
provide a detailed overview on the large number of regulatory changes that took place
on state and federal level in the US local and long-distance telecommunication
markets. Furthermore we also present empirical evidence on whether the shift from
rate-of-return to price-cap regulation in the US telecommunication sector has indeed
resulted in an increase of market risk.
* I would like to thank Paul Grout and Anna Zalewska for many helpful comments and suggestions.

1
1. Introduction
Although the liberalisation and deregulation agenda started over 20 years ago,
regulation and competition in the network industries1 are still central concerns.
Workable competition has only been achieved in a few countries and sectors so far.
Partial (and even complete) public ownership of network companies is still
widespread.2 Equal access to and the regulation of the incumbents’ networks - which
are still characterised by sunk costs and economies of scale and scope - remain crucial
features in establishing effective competition. Even in sectors and countries, which
were amongst the first to establish competition (the electricity and telecommunication
sectors in the UK and the USA), incumbents continue to be largely regulated.
While there seems to be not much dissent on the theoretical impact of different
regulatory regimes on companies’ incentives (section 2), the empirical evidence is
much more mixed (section 3), showing increased, decreased as well as unchanged
incentives. No empirical study however has addressed the issue (properly) yet,
whether a change in the regulatory regime actually results in a significant change of
risk for the company.3 As pointed out by the “new regulatory economics” (1993,
Lewellen and Mauer, 1993) it is mainly the shift in risk – from the company’s
customers to its (stock-) owners – which follows a change from rate-of-return to
price-cap regulation, which is the main trigger of any changes in the company’s
incentives (for cost reductions, efficiency improvements, etc.).
This paper tries to fill this gap by investigating the relationship between regulation
and market risk regarding their effect on incentives in the context of the US
telecommunication sector. We discuss the strengths and weaknesses of the existing
1 The network industries describe the formerly natural monopolies in the telecommunication,
electricity, gas, railway and water sectors, which are based on a network of lines, pipes, rails and were
typically state-owned outside the USA. 2 Two of the largest European energy companies for example, EdF and Vattenfall, still remain largely
in government ownership. 3 The very few studies that do exist only compare risk levels under different regulatory regimes in
different countries (Alexander et al., 1996) estimate the impact of expected regulatory changes on risk
levels (Grout and Zalewska, 2006) or look at changes in risk within a system of price-regulation
(Buckland and Fraser, 2001a, b, Paleari and Redondi, 2005). See section 3 for a further assessment of
these studies.

2
literature (section 2 and 3) and provide a detailed overview on the large number of
regulatory changes that took place on state and federal level in the US local and long-
distance telecommunication markets (section 4). Section 5 describes the methodology
and section 6 gives an overview on the used data. Empirical evidence for the risk
increasing impact of a shift from rate-of-return to price-cap regulation in the US
telecommunication sector is presented in section 7.
Since each state in the USA can and does apply a different regulatory system for
intrastate telephone calls (which often varies for separate companies within one state
as well), a huge number of regulatory changes took place, with quite a few states
reverting to rate-of-return (RoR) regulation after they had already switched to price-
cap (PC) regulation. Covering regulation over a period of 20 years (1984-2004) for
one sector in one country with so many regulatory changes represents a quite unique
database. In addition telecommunication companies in the USA have always been
private companies (except from a few little rural companies), which allows analysing
the effects of regulation without any interference with privatisation and public
ownership issues. In fact the telecommunication sector in the USA and partly that of
Canada provide the almost only examples of regulatory changes for private network
companies.4
2. Theoretical effects of (de-) regulation
While economists developed a number of alternative instruments to rate-of-return
regulation, only a few were finally applied in practice. Although the characteristics of
the applied regimes do vary quite a lot between sectors and countries, regarding their
impact on risk almost all can broadly be assigned to rate-of-return regulation, price-
cap regulation or mechanisms of earnings- or profit-sharing.5
4 Most regulators in Europe for example introduced price-cap regulation for their incumbent network
operators, while they were still completely (or to a large extent) under government ownership. 5 Differences between the two principally contrary systems of rate-of-return and price-cap regulation
are usually much lower than described by theory, as the regulation authorities have seldom applied the
pure theoretical models and often applied more than one regulatory instrument at the same time. Rate-
of-return regulation as developed in the US was therefore rarely a pure cost-plus system, while price-
cap regulation as first applied in the UK did usually not go without some kind of cost and rate-of-return
estimation. Nonetheless, regarding their impact on market risk levels almost all regulatory regimes can
3
Rate-of-return regulation
Rate-of-return (RoR) regulation caps the firm’s profits by limiting the return on
capital to its “fair” value.6 This “fair” rate of return, as set by the regulator, then
determines the price level, which enables the firm to cover its operating costs plus a
“fair” return on its invested capital.
According to the “new regulatory economics” (Laffont and Tirole, 1993) rate-of-
return regulation sets only low incentives for the regulated firm to minimize its
operating costs or to improve its productivity, since – contrary to a competitive
market – the company would not earn any greater returns from such steps. As the
regulatory authority fixes the rate of return the company could earn, higher profits
have to be passed on directly to the customers instead of being retained or distributed
to the stockowners. In the same way cost changes are passed through to the firm’s
customers by adjusting prices, which makes the company quite independent of market
developments and results in a distinctively low market risk. In other words it is the
firms customers rather than the companies (stock-) owners, which bear the risk of
management decisions and market developments under RoR regulation.7
Earnings- / profit-sharing regulation
Under earnings-sharing (profit-sharing) regulation the regulator sets a target level of
earnings (respectively profits) the company is permitted to keep.8 If the earnings
(profits) of the company exceed this target within a limited range, they have to be
shared with the customers (often equally) under a pre-specified rule (through refunds
or lower prices). Equally if the earnings (profits) lie below the target, prices might be
broadly be attributed to rate-of-return regulation, price-cap regulation or mechanisms of earnings- or
profit-sharing regulation. 6 A detailed overview on traditional rate-of-return regulation can be found in: Berg and Tschirhart
(1988), Crew and Kleindorfer (1986) and Liston (1993). 7 Further commonly attributed drawbacks of RoR regulation include the high information requirements
for the regulator and an incentive for the regulated firm to exaggerate its operating costs or to
overinvest in its network and office facilities (“gold-plating”) (see for example Laffont and Tirole,
1993). 8 For a further discussion of sharing mechanisms see Mayer and Vickers (1996) and Sappington and
Weisman (1996).
4
adjusted upwards so that the company only bears part of the losses. Typically a
maximum and minimum level of earnings (profits) is specified, whereas earnings
(profits) above or below these levels have to be completely covered by the customers.
Depending on the size of the target range and the specification of the sharing rule the
firms’ incentives under earnings- / profit-sharing are quite similar to rate-of-return (in
case of a narrow band or a large fraction of shared earnings / profits) or closer to
price-cap regulation (in case of a wide band and a larger fraction of retained earnings /
profits). Equally to the earnings (respectively profits) risk is shared between the
customers and the company owner’s, which is expected to result in a higher market
risk for companies under sharing mechanisms than for those under rate-of-return
regulation (Grout and Zalewska, 2006).
Price-cap regulation
Price-cap regulation sets a maximum price level for a set of services for a period of 3-
5 years. Typically this price is adjusted by the inflation rate and the expected
productivity growth (commonly referred to as X-factor).9 Since the maximum price
for a certain regulatory period is fixed ex-ante, any (further) cost reductions during
this period enable the regulated firm to raise its profits. It is therefore generally
assumed that price-cap regulation sets good incentives in efficiency improvements
and cost reductions (Cabral and Riordan, 1989). It is sometimes noted that the
informational requirements under PC regulation are much lower than under RoR
regulation (as expected productivity growth (the X-factor) might be estimated in
comparison to a benchmark group of firms in the same sector). In practice however
regulators do not solely focus on price levels, but also on past cost and revenue levels
to estimate further productivity gains.10 It is also often questioned whether price-cap
9 Bernstein and Sappington (1999) provide a detailed analysis of price-cap regulation and the
determination of the X-factor. For a general overview of PC regulation see also: Beesley and
Littlechild (1989); Crew and Kleindorfer (1996); Vogelsang (2002). 10 It is also quite problematic to determine a universal level of possible productivity improvements for
all companies in one sector as firms might face quite different cost levels due to different geographic
conditions (service providers in sparsely populated rural or densely populated urban areas,
mountainous or flat areas) or different groups of customers (serving primarily large industrial
customers or small private households). After adjusting for these company specific factors the
benchmarking sample of similar companies might often be too narrow to make any reasonable
comparisons on efficiency levels (Bernstein and Sappington, 1999, Shuttleworth, 2003). Furthermore
performance benchmarking might also encourage strategic behaviour of the regulated firms (Jamasb et
al., 2004).

5
regulation does not go along with reductions in service quality and too little
investment in the network infrastructure (Burns and Riechmann, 2004).
Under pure price-cap regulation the company is not allowed to change prices due to
changes in demand or costs (company as price-taker). In fact it is the main intention
of PC regulation to mimic the competitive process by exposing the company to the
risk of market changes (Bernstein and Sappington, 1999). As a consequence, so the
argument of the “new regulatory economics”, it is the company’s (stock-) owners
(similar to a competitive market and contrary to RoR regulation) that now bear the
risk of management decisions and market developments. In particular it is this shift in
risk, which is supposed to follow a change from rate-of-return to price-cap regulation
that causes a corresponding shift in efficiency incentives.11 As a result market risk
should be significant higher under PC-regulation than under ROR-regulation.12
Deregulation
Due to technical progress (like the emergence of new transmission paths for telephone
calls as mobile phones, Voice over IP (internet telephony), the usage of TV cables or
(in the future) of low voltage electricity lines) and evolving competition, it might be
possible to phase out regulation completely and to allow telephone companies to set
their rates freely.13 In practice the number of cases where regulators abandoned
regulation completely is quite limited up to now. In many countries however
regulation has partially been removed for (new) service categories that are already
regarded as fully competitive.14 Companies operating in a (partly) deregulated
environment are directly exposed to market forces and are expected to face a higher
11 For a general overview on the role of the cost of capital in the regulatory process and the differences
to deregulated companies see Grout (1995). 12 It is however still an open question, whether companies operating under price-cap regulation face a
lower or higher market risk than unregulated companies facing competition. While, on the one hand,
the whole regulatory structure might provide a “safe environment”, which mitigates the impact of
market movements, regulation itself, on the other hand, can be a large risk factor actually resulting in a
larger market risk than comparable unregulated companies face. 13 However optimism in the marketability of some of the alternative transmission technologies like
transmission over electricity lines has recently slowed down, while at the same time most incumbent
telephone providers hold major shares in the mobile wireless market and also try to their business into
the upcoming internet telephony. For a discussion on the phasing out of regulation in the
telecommunication sector see Knieps (1997). 14 Nonetheless for most incumbents these deregulated parts account only for a small part of their
revenues, while the large revenues from network access charges, telephone rates, etc. still remain
regulated.

6
market risk than regulated companies.15 Nonetheless in cases where regulation is very
unstable, for example due to a lack of regulatory commitment or a large scope for
discretionary decisions, market risk for the regulated firm might actually be higher
than for a completely deregulated company.
3. Empirical effects of regulation
When incentive (price cap) regulation became popular as a regulatory instrument in
the late 1980s,16 first in the UK and then around the globe, a large number of
empirical studies were published on the effects of regulation on company
performance. Almost all empirical studies focus on the US and UK electricity and
telecommunication sectors, two countries and sectors that were on the forefront of
liberalisation and (de-) regulation. Initially the main interest was to investigate,
whether a change from rate-of-return to incentive (price-cap) regulation resulted in
the theoretically predicted increase of efficiency. While some studies confirm an
increase in efficiency following the introduction of price-cap regulation (Kridel et al.,
1996, Majumdar, 1997, Resende, 2000), others found no significant change at all
(Resende, 1999, Uri, 2001, 2002, 2003a).
More recently the consequences of different regulatory instruments on service quality,
profits, prices and innovation have gained more attention in research. Whereas the
number of new technologies, telephone rates and investment did seem to change in a
specific way after a shift to PC regulation (more technologies, unchanged telephone
rates and investment, see table 1), effects on service quality are not that clear-cut
(some studies indicate an increase, others no change or even a decrease in quality
levels after a switch to PC regulation).17
15 Basic evidence that regulated sectors face a distinctively lower market risk than unregulated sectors
can be found in Riddick (1992). However as Riddick compares the risk characteristics of completely
different sectors, differences in market risk might also be explained by industry specific characteristics,
rather than by the influence of regulation. 16 The concept of price-cap (or RPI-X) regulation dates back to the Littlechild report published in 1983
(Littlechild, 1983) although a number of his arguments can already be found in earlier papers. See
Vogelsang (2002) for a detailed overview of the roots of and the literature on incentive regulation. 17 One has to be careful however when comparing the individual empirical studies with each other, as
they partly vary regarding their methodology and their definitions of efficiency, quality or innovations.
7
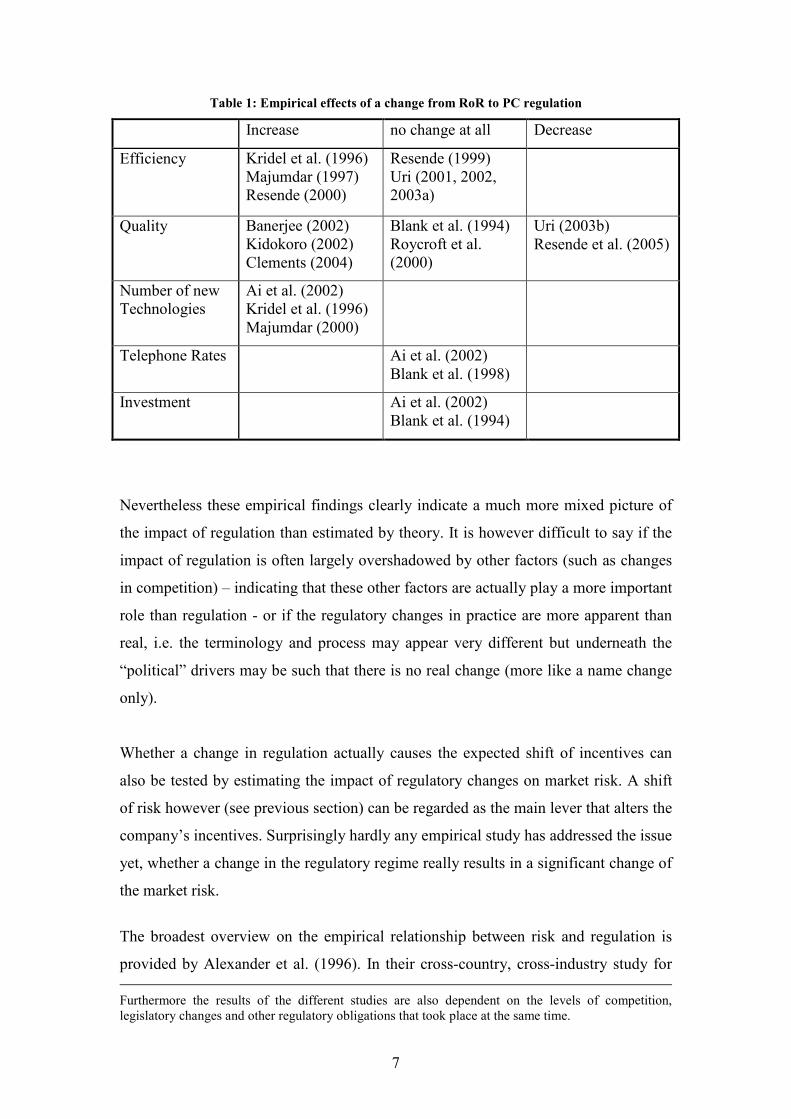
Table 1: Empirical effects of a change from RoR to PC regulation
Increase no change at all Decrease
Efficiency Kridel et al. (1996)
Majumdar (1997)
Resende (2000)
Resende (1999)
Uri (2001, 2002,
2003a)
Quality Banerjee (2002)
Kidokoro (2002)
Clements (2004)
Blank et al. (1994)
Roycroft et al.
(2000)
Uri (2003b)
Resende et al. (2005)
Number of new
Technologies
Ai et al. (2002)
Kridel et al. (1996)
Majumdar (2000)
Telephone Rates
Ai et al. (2002)
Blank et al. (1998)
Investment Ai et al. (2002)
Blank et al. (1994)
Nevertheless these empirical findings clearly indicate a much more mixed picture of
the impact of regulation than estimated by theory. It is however difficult to say if the
impact of regulation is often largely overshadowed by other factors (such as changes
in competition) – indicating that these other factors are actually play a more important
role than regulation - or if the regulatory changes in practice are more apparent than
real, i.e. the terminology and process may appear very different but underneath the
“political” drivers may be such that there is no real change (more like a name change
only).
Whether a change in regulation actually causes the expected shift of incentives can
also be tested by estimating the impact of regulatory changes on market risk. A shift
of risk however (see previous section) can be regarded as the main lever that alters the
company’s incentives. Surprisingly hardly any empirical study has addressed the issue
yet, whether a change in the regulatory regime really results in a significant change of
the market risk.
The broadest overview on the empirical relationship between risk and regulation is
provided by Alexander et al. (1996). In their cross-country, cross-industry study for
Furthermore the results of the different studies are also dependent on the levels of competition,
legislatory changes and other regulatory obligations that took place at the same time.
8
the World Bank they show that average asset betas for companies under price- or
revenue-cap regimes are significant higher than for companies in countries and
sectors that apply rate-of-return regulation.18 However the significance of their results
is limited due to a number of severe shortcomings. They apply only the basic capital
asset pricing model, whose evidence is quite mixed. They cover only a relatively
short, specific time-period (1990-1995) with markets at quite different levels of
competition. Furthermore it is quite problematic to compare the market risk factors of
different industries in different countries, as water companies for example usually
face a much lower market risk than telecommunication companies. Moreover
companies in the same sector face quite different obligations (besides price or return
regulation), market and ownership structures (a large number of European companies
in the sample where still partly under public ownership). In their sample price-cap
regulation is also only applied in a few cases, primarily in the UK, for the Swedish
Telecom and for AT&T in the USA, which further limits the explanatory power of
their findings.19
Almost all other studies that analyse the impact of regulation on systematic risk focus
on regulated industries in the United Kingdom. Buckland and Fraser investigate the
time-varying risk of the English and Welsh water and sewage (2001 a) and electricity
distribution companies (2001 b). They find evidence for a mean reverting pattern of
the individual company risk, but only weak indications for a cyclical variation across
the regulatory review cycle. In a similar approach Paleari and Redondi (2005)
estimated that a stricter (price-cap) regulation increased the risk for English and
Welsh electricity distributors, as both overall risk and market correlation increased.20
As the regulated privatised industries in the UK were largely controlled by a price-cap
regime, those studies hardly allow any conclusions on the risk characteristics of other
forms of regulation. In particular as those studies do not cover any regulatory changes
18 I.e. Alexander et al. don’t look at regulatory changes within a sector/country, but compare regulatory
regimes across countries. They estimate the average beta values for selected regulated companies in a
number of European countries, Australia, New Zealand, Japan, Argentina, Chile, the USA and Canada
for the period January 1990 to August 1995. Separating all investigated regulatory regimes into three
categories - high-powered (price- or revenue-cap), intermediate (discretionary) and low-powered (rate-
of-return) regimes – they calculated average betas of 0.71, 0.6 and 0.32 respectively. 19 Additionally they use small national stock market indices (Dow 65, DAX, FTSE 100, Nikkei 50),
which might not be very representative for the market. 20 For a basic analysis of the effects of regulatory reviews / announcements see also: (Antoniou and
Pescetto, 1997, Binder and Norton, 1999, Robinson and Taylor, 1998)

9
(e.g. from rate-of-return to profit-sharing or price-cap regulation or from regulation to
complete deregulation), so they do not answer how a change in regulation might
actually shift risk and incentives.
The only empirical study that estimates the impact of an expected change in
regulation on the market risk of regulated companies is the article by Grout and
Zalewska (2006). They analyse the changes of market risk for a sample of 15
regulated UK companies, applying both a single factor market (CAPM) and a three-
factor Fama-French model. They show that when the market expected a change from
price-cap to profit-sharing regulation (which was during a 25 month period following
the election of the Labour government in 1998) risk of regulated companies was
significant lower than during the comparison period (1993-1997 and 1999-2000,
where PC regulation was applied and expected). However their study only covers an
expected and not an actual change in regulation during a relatively short period of 25
months.
4. The US-American telecommunication sector
The history of the American telecommunication sector provides a very interesting
example of the interrelationship between changing (political) views on regulation and
the market structure in network industries. Reflecting popular concepts of particular
periods the US telephone industry went through a wide variety of systems ranging
from a patent monopoly, nationalisation and a private monopoly to regulated
competition, deregulation and relatively unrestricted competition. In that way –
although, contrary to the European telecommunication sector, American telephone
markets have almost always been controlled by private companies – their regulation
and restructuring often had been an anticipation of later developments elsewhere in
the world.
After Alexander Graham Bell invented the telephone in the 1870s he was granted a
patent monopoly for the US and Canadian telephone markets, which he controlled
through his National Bell Company (later AT&T) and its licensees. After the main
patents expired in 1893, US telephone markets, especially in the urban areas, saw an

10
intense competition with falling prices and a large increase in telephone
connections.21 AT&T tried to restore its market power through the acquisition of
independent competitors and the refusal to interconnect with other networks. When
the remaining competitors sought action against AT&T from the Department of
Justice, AT&T was forced to grant interconnection with independent networks and
refrain from further acquisitions (Kingsbury Commitment, 1913).
However at the end of World War I in August 1918 the entire telecommunication
industry was nationalised by the federal government with respect to national security
reasons (Henry and Matheu, 2001). Although the nationalisation lasted only one year
it established the basis to the later national (natural) monopoly of AT&T. On the one
hand public opinion increasingly opposed competition, which in their eyes had shown
not to be working in this industry (duplicate and waste investment, limited
interconnections) (Woroch, 2002). On the other hand AT&T now changed its tactics,
advocating regulation as a way of eliminating competition (Olufs, 1998). Successively
state public utility commissions where formed to regulate local and intrastate
telephone services22 and in 1934 the Federal Communications Commission (FCC)
was founded to control interstate telecommunication services.23 Since then the states
as well as the FCC adopted some form of rate-based rate-of-return regulation for all
telecommunication companies. Finally the acquisition restrictions were eased (Willis-
Graham Act of 1921) and in the end AT&T was controlling the complete long
distance and around 90% of the local telephone markets.24
Although the long distance and the equipment markets were already partly opened for
competition through court decisions and FCC orders in the 1970s, the general
structure of the telecommunication sector did not change much until 1984.25 After
21 See Woroch (2002) for an historical overview of the US telecommunication sector; a detailed survey
of the early years of the US telephone industry and its regulation can also be found in Gabel (1969) and
Trebing (1969) 22 By 1920, 45 of 48 states regulated local telephone service through public utility commissions
(Woroch, 2002). 23 The Communications Act of 1934 also implicitly considered the telecommunication business as a
natural monopoly (Brock, 2002). 24 This so-called “Bell System” consisted of 22 wholly owned Bell operating companies (controlling
local telephone markets), Western Electric (manufacturing company), Bell Labs (R+D organisation)
and a long line division (AT&T). 25 The FCC ‘Cartefone’ ruling in 1968 allowed competition in the equipment market, resulting in a
large drop of the AT&T market share for equipment manufacturing. The non-dominant carrier order of
11
several years of investigation the Department of Justice (DOJ) and AT&T signed a
consent decree (Modification of Final Judgment),26 which resulted in the separation of
the local telephone services (regarded as natural monopolies) from the long distance
services and the equipment manufacturing (considered as potentially competitive
segments). The DOJ regarded this as the easiest way to prevent uncompetitive cross-
subsidization (profits were particularly shifted from regulated local rates to long-
distance business and from urban telephone service to rural telephone service).27
While the long distance service (and the equipment manufacturing) remained under
the AT&T brand, local telephone service was organized in seven independent
Regional Bell Operating Companies (RBOCs).28 The country was subdivided into 160
Local Access Transport Areas (LATAs),29 each under the monopoly control of one of
the seven RBOCs. The Bell companies were excluded from equipment manufacturing
and long distance services and only allowed to use their own facilities within a
LATA. For calls between LATAs facilities of long-distance carriers (e.g. AT&T, MCI
or Sprint) must be used.30 AT&T and other long distance carriers on the contrary were
allowed to enter local exchange service markets (Woroch, 2002).
While long distance competition increased rapidly in the late 80s and early 90s, only
few states opened their local telephone markets for competition.31 After extensive
lobbying of the RBOCs, who particularly wanted to enter the long distance market,
US Congress passed the Telecommunication Act in 1996 (Brock 2002).32 The main
the FCC from 1980 gave competitive long distance companies ‘equal access’ to local networks
(Woroch, 2002). 26 The antitrust suit by the U.S. government against AT&T began in 1974, the consent decree was
signed on 1.1.1982 and put into effect on 1.1. 1984 (Brock, 2002). 27 Interestingly in the first half of the 20
th century this cross-subsidisation was promoted as a way to
increase the access and availability of telecommunication throughout the country (Woroch, 2002). 28 The initial seven RBOCs were Ameritech, Bell Atlantic, BellSouth Corporation, NYNEX, Pacific
Telesis Group, Southwestern Bell Corporation (SBC) and US West. 29 The LATAs are juridical boundaries, not oriented on the geography of economic markets. Most
states consist of several LATAs, although a few rural, sparsely populated states cover only one LATA. 30 This was even the case if both LATAs were controlled by the same Bell com pany.
31 The long distance market share of AT&T based on revenue fell from 90.1 % in 1984 to 65 % in 1990
and 51.8 % in 1995 (Federal Communications Commission, 2003). In 1995 over 450 companies were
competing in the long distance market, although the market was still highly concentrated, with AT&T,
MCI, WorldCom and Sprint together holding a market share of 86.2 % (Federal Communications
Commission, 2003). On the local exchange markets only 57 competitors with a market share of 0.7 %
(by revenues) faced 1347 incumbent local exchange carriers in 1995, while only the Bell operating
companies already held a nationwide market share of 72.4 % in 1995 (Federal Communications
Commission, 2000). 32 Crandrall and Hazlett (2000) argue that, before the 1996 Telecommunications Act was passed, the
telecommunication sector was largely shaped through the courts (in particular since the applicable law
12
objective of this new law was to open all telecommunication markets for competition.
In detail it allowed the RBOCs to enter the long distance markets, if they open their
own markets for local competition, which has to be certified by the states public
utility commission, as well as the FCC and the Department of Justice (by a 14-point
checklist).33 Furthermore the Telecommunication Act mandates from the incumbent
local exchange carriers that they provide access to their networks for any requesting
entrant “on an unbundled basis at any technically feasible point on rates, terms, and
conditions that are just, reasonable, and non-discriminatory….”.34 It also determines
that no state can exclude any company from providing any interstate or intrastate
telecommunications service.35
Since the regulation of the telecommunication sector falls under federal law and the
FCC as well as state law and the authority of state regulatory commissions, the
Telecommunication Act could only provide a national policy framework. In fact it
took several years, several reports, orders, meetings and hearings of the FCC and
several court decisions to define the exact rules and the practical implications of the
Act.36 As a consequence competition in the local telephone markets evolved quite
slowly in the first years. From 1995 to 1998 competitive local exchange carriers could
increase their market share from 0.7% to 2.4%, while at the end of 2000 they gained a
share of 7.7%, which increased to 14.6% in June 2003 (Federal Communications
Commission, 2000, 2005b). Amongst the incumbents the former RBOCs still
was still the Communications Act of 1934, which did not cover the changes of market conditions and
technology). By implementing the Act the Congress gained the control over telecommunication
companies back (through the FCC), which is seen by the fact that the political contributions by
telecommunications firms have increased quite remarkably (in absolutely and relatively terms) after the
Act was passed (Crandrall and Hazlett, 2000). For a further assessment of the Telecommunication Act
of 1996 see (Aufderheide, 1999, Lehman et al., 2000, Olufs, 1998). 33 In addition the FCC has to certify that RBOC entry in the long distance market is in the public
interest (United States Congress, 1996). 34 United States Congress (1996) Telecommunications Act of 1996, Sec. 251, “Interconnection”, 110
Stat. 62. 35 As part of the Telecommunication Act a universal service fund was set up to support high cost
companies serving rural areas, low-income customers, rural health care providers, schools and libraries.
All telecommunication providers of interstate and international services are required to pay a fixed
percentage of the interstate end-user revenues to the Universal Service Fund, which is calculated
quarterly by the National Exchange Carrier Organisation (NECA) and the Universal Service
Administration Company (USAC), a subsidiary of the FCC. The universal service contribution factor
ranged from 5% to 10% of interstate revenues in the years 2000 to 2004. Prior to 1996 only long-
distance providers were required to contribute to the Universal Service Fund. 36 Finally the Supreme Court rejected some of the initial FCC regulations stating that the governments
of the states through their regulatory commissions should determine prices for interconnection,
unbundled network elements and resold services (Brock, 2002). However this decision did not change
the main intention of the Act.
13
dominated the local-call market, with Verizon, Bell South, SBC and Qwest holding a
combined national share of 73.7% of local service revenues in 2002 (Federal
Communications Commission, 2005b). As a further consequence of the
Telecommunication Act several companies announced their mergers over the
following years, reducing the number of RBOCs from 7 to 4.37
Since it also took a few years till the RBOCs were finally allowed to enter the long
distance markets in their own regions,38 their market shares in the long distance sector
are still relatively small. At the same time competing long distance call providers
(primarily the large competitors MCI and Sprint) were able to increase their market
shares at the expense of AT&T.39 In the mobile wireless service market Cingular
(owned by SBC (now AT&T) and Bell South) now holds the largest market share
(27.5%), followed by Verizon (owned by Verizon and Vodafone, 22.4%), Sprint
(19.8%) and T-Mobile (7.8%) (Federal Communications Commission, 2005a).
The US telecommunication sector was not only shaped by federal and state laws, FCC
regulation and the public utility commissions in each state, but also to a large extent
by the courts, who had to judge over numerous disputes and appeals of regulatory
decisions of the states and the FCC. The FCC regulated the long distance incumbent
AT&T, incumbent local exchange providers (ILECs) were regulated by the state
commissions in each of the states they operated.
Traditionally all incumbent local exchange carriers (ILECs) and the long distance
incumbent AT&T were rate-of-return regulated. Beginning in the late 1980s an
increasing number of states started to shift their regulation from RoR to earnings-
sharing mechanisms (often in combination with RoR or PC regulation, see figure 1).
At the same time PC regulation was adopted for AT&T’s long distance rates by the
FCC (in 1989).
37 Verizon, Bell South, SBC and Qwest
38 The first RBOC that gets the approval of the FCC for offering in-region long distance services was
the Verizon subsidiary for New York in 1999, the last one Qwest Arizona at the end of 2003. 39 AT&Ts market share further dropped to 34.9% in 2002, followed by MCI (which had been acquired
by WorldCom and was later renamed back to MCI again) with a share of 22.4% and Sprint with a share
of 9% (Federal Communications Commission, 2005c).

14
In 1995 AT&T was classified as a non-dominant carrier and almost completely
deregulated. While RoR regulation decreased continuously over the 1990s, small local
incumbents as well as a few rural states continue to be rate-of-return regulated. In the
mid 1990s PC regulation became increasingly popular and from 1999 onwards almost
all states applied PC regulation for local call services.
Figure 1: Regulatory regimes of all US incumbent local exchange carriers based on the number
of telephone lines in each state40
Sources: FCC, NRRI, own calculations
40 For each incumbent local exchange carrier regulation in each state and year was classified into one
out of five regimes and weighted by the number of switched access lines the company operated in that
particular state. The shares of each instrument for the whole US local call market were then calculated
by weighting company regulation with the market share of each company in the local call market
(based on the access lines the company operated in relation to the total number of lines in the USA).
Unfortunately no data on regulation was available for 2001 (see section 6). For some states and years
information on regulation was also only available for the larger incumbents, although some of the
smaller ILECs operated a significant number of lines in that state as well; the regulatory shares of these
smaller ILECs were then covered as not applicable (n/a). All shares in figure 1 are based on data for
incumbent local exchange carriers, however the market shares of (unregulated) competitive local
exchange carriers however remained relatively low (with a share below 15% even in 2003).
0
10
20
30
40
50
60
70
80
90
100
1984
1985
1986
1987
1988
1989
1990
1991
1992
1993
1994
1995
1996
1997
1998
1999
2000
2001
2002
2003
2004
years
percent
ROR ROR+sharing PC+sharing
PC Deregulation n/a

15
5. Methodology
We analyse the impact of regulatory changes in the US telecommunication sector on
the risk of the regulated companies by applying the capital asset pricing model
(CAPM)41 and the three-factor model of Fama and French (FF3F).
42 Both models
divide the risk of holding a portfolio of different assets into components common to
all assets in the market that cannot be reduced by diversification (systematic risk) and
components specific to an individual asset, which are uncorrelated with general
market movements (unsystematic risk). By holding a portfolio representing the whole
market all specific risk can be diversified away. Investors are therefore only
compensated for holding the systematic risk (i.e. the risk of being in the market).
General market developments however affect individual companies to a quite
different extent, depending (for example) on the nature of the industry or, as described
above, on the system of regulation. If this individual market risk changes in a
systematic way after a particular change in regulation, e.g. increases after a shift from
RoR to PC regulation, then this also indicates whether and which impact the
regulatory changes had on the company’s incentives.
According to the CAPM the expected return of an individual asset (E (ri)) is equal to
the risk-free rate (rf) and its sensitivity to the excess return of the market portfolio
(beta (β) multiplied by the excess of the expected market return E(rm) over the risk-
free rate (rf )):43
E(ri) = rf + βi (E (rm)- rf))
Assuming equality between expected and actual returns, the equation can be rewritten
in the market model specification:44
41 The capital asset pricing model was first developed by Sharpe (1964) and Lintner (1965), for a
detailed discussion of the traditional CAPM see Perold (2004). 42 Fama and French (1993)
43 In other words no investor would be willing to hold a stock that offers a smaller expected risk
premium (over the risk-free rate) than β (E (rm) - rf). Beta factors larger than one indicate that the stock
amplifies the general market movement; while betas below one show that the company is less affected
by general market trends. 44 whereas αi ≡ rf (1 – βi)
16
ri = αi + βi rm + ε
Since the first publication of the capital asset pricing model (CAPM) by Sharpe
(1964) and Lintner (1965) its validity has been the subject of a long and fierce (still
ongoing) debate in finance. Various alternative asset pricing models to the CAPM
have been developed that extend the basic CAPM and claim to avoid some of its
observed or assumed shortcomings.45 However while the empirical evidence of the
traditional CAPM is quite mixed,46 evidence for many alternative models remains
quite weak as well.47 And even if the CAPM only partly explains variation in asset
returns, it might still be a rough proxy of the risk-return relationship. Furthermore it
still remains the general reference model widely applied in practice.48
In the empirical literature effects of firm size and book-to-market ratios have gained
much prominence. Testing for a number of observed stock market anomalies Fama
and French (1992, 1993) suggested to add two additional factors for firm size and
book-to-market ratios to the traditional CAPM:
ri = α + βi (rm) + γi (SMB) + δi (HML) + ε ,
where γi and δi describe the sensitivity of the portfolio to size (SMB) and value or
book-to-market (HML) effects.49
45 A good overview on the different asset pricing models as well as their empirical performance can be
found in Jagannathan and McGrattan (1995), Cochrane (1999), Campbell (2000) and Galagedera
(2004). 46 For a detailed survey of the empirical literature on the CAPM see Fama and French (2004).
47 Furthermore some characteristics of the alternative models (such as consumption or investment
opportunities in the consumption and intertemporal CAPM) are quite difficult to estimate, making
those models difficult to apply and far less popular in practice. Some supporters of the CAPM also
claim that most estimated effects, which seem to contradict the CAPM, could just result from “data
mining” or an inappropriate testing methodology (Clare et al., 1997, Malkiel, 2003, Park, 2004) and
conclude that there is still not enough evidence to fully reject the CAPM. 48 “We shall conclude that although the CAPM is not a perfect and complete representation of the real
world, it appears to be a fairly good representation of the real world and is, in many ways, the best tool
available to us.” (Lumby and Jones, 1999) 49 SMB stands for small-minus-big and describes the return differences between portfolios of small and
big stocks (adjusted for value effects), while HML or high-minus-low describes the return differences
between portfolios with a high and a low book to market ratio (adjusted for size effects).

17
Market risk, as measured by the beta factor in the CAPM, or the risk factors of the
three-factor FF model, is not stable over time. As has been well documented, changes
in beta can be quite significant over longer time periods.50 Problems of falsely
assumed beta stability can however be avoided by estimating the coefficients in
relation to a control sample. From the daily returns of each regulated
telecommunication company (or sample of telephone companies) the daily returns of
a sample of companies with similar industry respectively risk characteristics
(generally a sector index) were subtracted. Denoting the return for the regulated
telecommunication companies by rtel, t and the returns of the control sample by rcontrol, t
the regressions for the CAPM then takes the following form:
(1) rtel, t = αtel, t + βtel, t (rm, t) + εtel, t
(2) rcontrol, t = αcontrol, t + βcontrol, t (rm, t) + εcontrol, t
Subtracting (2) from (1) leads to the following ‘difference’ equation:
(3) rtel, t - rcontrol, t = (αtel, t - αcontrol, t) + (βtel, t - βcontrol, t) (rm, t) + (εtel, t - εcontrol, t),
which can be rewritten as:
(4) r diff, t = α diff, t + β diff, t (rm, t) + ε diff, t.
If the risk characteristics of the control sample follow the regulated telephone
company quite closely, the beta factor for the difference of both samples (βdiff) is
expected to be stable. The beta factors might shift quite significantly over the sample
period, but so long as the control sample shifts in the same way, the difference will be
constant. If regulation theory holds true in that a switch from rate-of-return (RoR)
regulation to price-cap (PC) regulation results in a higher risk (beta factor), one would
expect an immediate increase in the risk level of the regulated company from that
point onwards, while all other fluctuations of beta would still follow the same pattern
in both samples. This is illustrated in the following graph:
50 This time varying characteristic of beta has in fact often been put forward as one of the main
counterarguments against the validity of the CAPM. A good survey on the empirical literature on beta
stability can be found in Wells (1996). One of the first papers that identify the time varying
characteristics of the risk parameter was published by Blume (1971).

18
Beta Telecom sample
Control sample
RoR period PC period Years
Figure 2: time-varying beta factors, but constant beta differences
The difference of beta within the RoR and the PC period is constant, but the
difference between the now PC regulated telecom companies and the control sample
is much larger than in the RoR period, indicating an increase of market risk for the PC
companies.
Capturing the effect of regulation with a time dummy (DReg, whereas DReg takes the
value of 1 for the periods where RoR respectively PC regulation was applied) results
in the following regression:
(5) r diff, t = α diff + β diff (rm) + αdiff, Reg DReg + βdiff, Reg DReg (rm, t) + ε diff, t
The coefficient of the multiplicative variable of dummy and market index (βdiff, Reg of
equation (5) gives an estimate on how much lower (higher) market risk for the
telecommunication companies in the RoR (respectively PC) period had been
(compared to the control sample). The actual value of market risk in the RoR period
can then be calculated by subtracting the change in the slope coefficient (βdiff, Reg)
from the beta factor for the comparison (PC) period.
Principally one would expect that a change in regulation only affects the market risk,
i.e. the beta factor and not alpha. But if the market model is only a proxy of the
CAPM, one would expect regulation also to have an effect on alpha. Alpha in the
‘difference’ equation is equivalent to (βcontrol – βReg). If a change in regulation does
change the beta factor of the regulated company, alpha is expected to change as well.
19
While the beta factor is expected to be higher after a change to PC regulation, alpha is
expected to be lower in the PC period. Nonetheless as daily data is used (daily)
returns of the risk-free rate are extremely small. As a consequence the alpha
coefficients are almost zero as well, which makes it quite difficult to obtain significant
alpha coefficients.
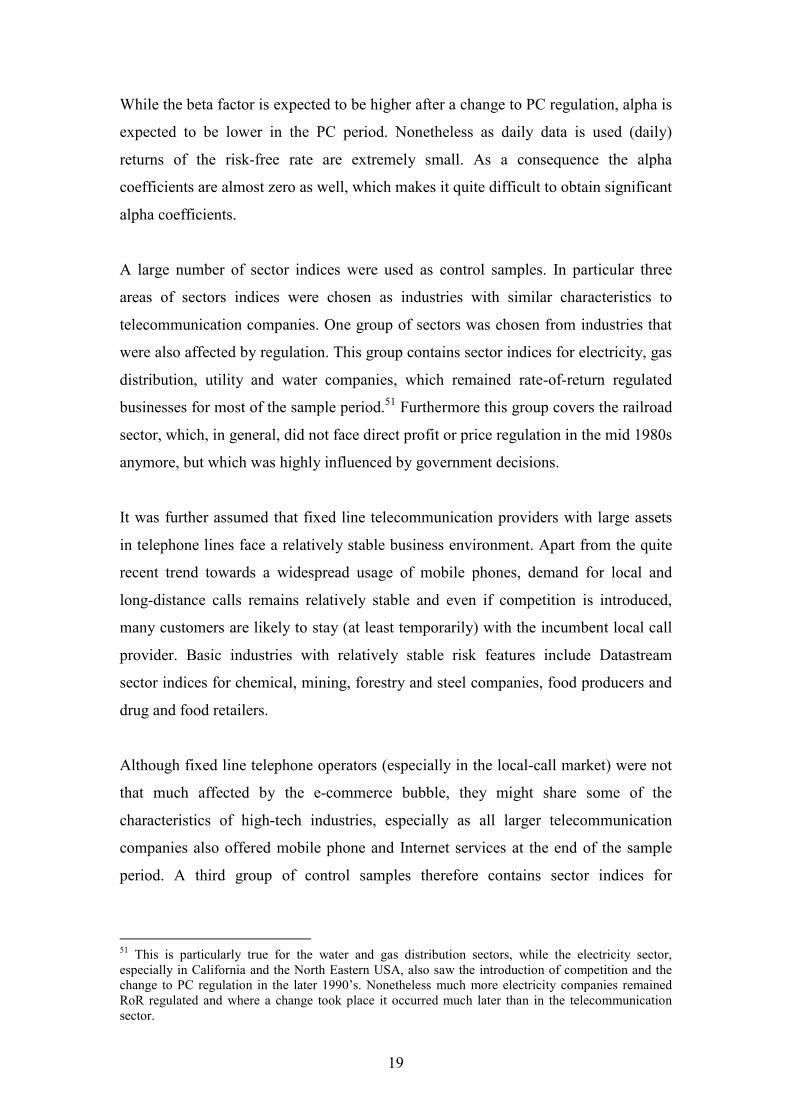
A large number of sector indices were used as control samples. In particular three
areas of sectors indices were chosen as industries with similar characteristics to
telecommunication companies. One group of sectors was chosen from industries that
were also affected by regulation. This group contains sector indices for electricity, gas
distribution, utility and water companies, which remained rate-of-return regulated
businesses for most of the sample period.51 Furthermore this group covers the railroad
sector, which, in general, did not face direct profit or price regulation in the mid 1980s
anymore, but which was highly influenced by government decisions.
It was further assumed that fixed line telecommunication providers with large assets
in telephone lines face a relatively stable business environment. Apart from the quite
recent trend towards a widespread usage of mobile phones, demand for local and
long-distance calls remains relatively stable and even if competition is introduced,
many customers are likely to stay (at least temporarily) with the incumbent local call
provider. Basic industries with relatively stable risk features include Datastream
sector indices for chemical, mining, forestry and steel companies, food producers and
drug and food retailers.
Although fixed line telephone operators (especially in the local-call market) were not
that much affected by the e-commerce bubble, they might share some of the
characteristics of high-tech industries, especially as all larger telecommunication
companies also offered mobile phone and Internet services at the end of the sample
period. A third group of control samples therefore contains sector indices for
51 This is particularly true for the water and gas distribution sectors, while the electricity sector,
especially in California and the North Eastern USA, also saw the introduction of competition and the
change to PC regulation in the later 1990’s. Nonetheless much more electricity companies remained
RoR regulated and where a change took place it occurred much later than in the telecommunication
sector.
20
biotechnology, computer hardware, software, electronic equipment and
telecommunication equipment companies.
In addition to individual sector control samples I also used aggregated control samples
for each of the three industry areas (regulated, basic, innovative industries), which are
calculated as equally weighted average of the individual sector samples and primarily
used in the following results.
6. Data
Data on the regulation of Incumbent Local Exchange Carriers (ILECs) in each state
and year (for the sample period of 1984 to 2004) is primarily based on the regulation
reports of the National Regulatory Research Institute (NRRI) at the Ohio State
University (National Regulatory Research Institute, 1998, 2000, 2002, 2003, 2004).52
Further information on regulation, especially for the long-distance provider AT&T,
was obtained from the Federal Communications Commission (FCC).
Regarding their impact on market risk the regimes of the NRRI were reclassified into
five groups:53 Rate-of-return (RoR) regulation, earnings-sharing regulation in
combination with (either) RoR or price-cap (PC) regulation, PC regulation and
complete deregulation.54
52 The NRRI groups the regulatory policies applied by the state utility commissions into one out of nine
regulatory systems. The nine regulatory regimes are: Ratebase rate-of-return, banded rate-of-return,
rate case moratoria, rate-of-return incentive (earnings-sharing), revenue-sharing, indexed price cap,
social contracts and rate freezes, pricing flexibility for competitive services, deregulation. However
state regulation for the large US incumbents mainly followed some type of rate-of-return, earnings-
sharing or price-cap regulation. Generally all classifications of regulation into specific groups can only
be a proxy as two regulatory regimes even within the same category of instruments are hardly exactly
the same. 53 State regulation for the large US incumbents mainly followed some type of rate-of-return, earnings-
sharing or price-cap regulation. 54 RoR regulation does contain the traditional ratebase rate-of-return regulation, as well as banded RoR
regulation and RoR regulation in combination with a rate freeze. Earnings-sharing regulation, which
was quite popular as a transitory regulatory regime in the mid 1990s, was regarded in two groups as it
often was combined with (either) RoR or price-cap (PC) regulation. The group labelled earnings-
sharing includes the pure sharing mechanism but also systems of (banded) RoR with earnings-sharing
and a combination of RoR regulation with rate freeze and an earnings-sharing mechanism. PC
regulation in conjunction with earnings-sharing also comprises a system of a rate freeze and earnings-
sharing. PC regulation includes as well regimes that combine PC with a rate freeze and pure rate
21
Unfortunately the NRRI does not provide any information on regulation in the year
2001. It is however reasonable to assume that US states stuck to the regulatory regime
applied in 2000 (comparing the classification of 2000 and 2002), as almost all
regulatory changes took place from the late 1980s to the late 1990s. Hence the year
was usually included in the aggregate samples.
For each company and year the shares of each regulatory instrument were calculated
by weighting the regulatory regime with the number of telephone (access) lines
operated in that state by the company.55 From this information time dummies for each
company and the whole sector were constructed for the RoR and PC periods. In
particular the years 1984 to 1989 were regarded as RoR regulated periods while for
the period 1999 to 2004 PC regulation was regarded as dominant regime.
From the NRRI data on state regulation the seven former Regional Bell Operating
Companies (RBOCs) and further nine larger local telephone companies were initially
included in the sample of regulated local exchange providers.56 This sample however
had to be reduced for two main reasons: Some of the small companies were either not
listed at the stock exchange or only listed for the last few years, where no regulatory
changes took place. In addition detailed information on the regulatory regimes over
the whole sample period was not available for many Non-Bell companies.57
freezes. Complete deregulation of incumbent local call providers – the 5
th group – has so far only been
realised by two US states. 55 Information about the number of switched access lines each company operated in each state and year
was obtained from the Automated Reporting Management Information System (ARMIS) of the FCC,
available online at: http://www.fcc.gov/wcb/armis/. 56 The companies are: BellSouth Corporation, Qwest Communications International (which mainly
consists of US West, which it acquired in 2000), SBC (formed from the Southwestern Bell Telephone
Company, the Pacific Telesis Group, the Southern New England Telecommunications Corp. and the
Ameritech Corporation), Verizon (created through mergers of Bell Atlantic with NYNEX and GTE),
the ALLTEL Corporation, CenturyTel, the C-Tec Corporation, Cincinnati Bell, Citizens
Communications, Concord Tel, Sprint and Iowa Telecom. 57 The size and the operating areas of some of the Non-Bell companies also changed significantly due
to a number of acquisitions and swaps of smaller companies with other operators. Some of these
companies also expanded their business into a number of states over the sample period, which, besides
a lack of information on the regulatory regimes in all of their states (particularly whether they were
regarded as RoR regulated incumbents or unregulated competitors in each state), might make it
difficult to identify the effect of regulation from all the changes in the firm structure that took place at
the same time.
22
On an aggregated level I used a sample of US fixed line telecommunication
companies provided by Datastream, consisting of the RBOCs, the three largest long-
distance providers and the three largest non-Bell incumbents operating on the local-
call markets. A further aggregated sample was constructed of an equally weighted
portfolio of the three former RBOCs, which operated over the whole sample period.
Daily stock price data for the regulated companies as well as daily data for different
market indices and control samples were obtained from Datastream.
7. Results
The impact of regulation on market risk could be shown for a sample of US fixed line
telecommunication companies (Table 2) and a sample of the three former Regional
Bell Operating Companies (RBOCs), Bell South, Verizon and SBC (Table 3).58 We
apply both the CAPM and the three-factor Fama-French model using control samples
for basic, regulated and innovative industries.
US Datastream fixed line telecom sample
Datastream provides a sample of US fixed line telecommunication companies for the
whole sample period 1984 to 2004, consisting of Alltel, AT&T, Bell South,
CenturyTel, Citizens Comms, MCI, NTL, Qwest Communications Intl., SBC
Communications, Sprint Nextel, Verizon Communications. The majority of these
companies operate primarily as incumbents in the local exchange markets.59 Over the
first five years of the sample (1984-1989) all companies, except MCI and NTL, were
almost completely rate-of-return (RoR) regulated. During the 1990s regulation of the
local exchange providers continuously shifted towards price-cap (PC) regulation, so
58 Due to the number of mergers and acquisitions in the US telecommunication sector those three
RBOCs were the only ones that operated as independent companies throughout the whole sample
period of 20 years. 59 AT&T and MCI are major players in the long distance markets; NTL is also a large provider of cable
and broadband connections.

23
that from 1999 onwards they were virtually completely PC regulated.60 AT&T was
price-cap regulated from mid 1989 to mid 1995 and then completely deregulated.
Table 2 shows the regression results for the control samples of basic, regulated and
innovative industries applying a time dummy for the period of rate-of-return (RoR)
regulation.61
Table 2: Regression results for US Datastream fixed line telecom (RoR dummy, CAPM,
aggregate control samples, DS US market index)
Control sample (DS US Indices) Constant
Market Index (DS US Market Index)
RoR Dummy
RoR Dummy * Market Index Observations
0 0.299 0.001 -0.241 5300 Basic Industries 0 (0.030)*** (0.000)** (0.056)***
0 0.384 0.001 -0.188 5300 Regulated Industries (0.000)** (0.027)*** (0.000)** (0.058)***
0 -0.604 0.001 0.441 5300 Innovative Industries 0 (0.034)*** (0.000)** (0.070)***
(robust standard errors in parentheses, * significant at 10%; ** significant at 5%; *** significant at 1%)
Compared to basic and regulated industries fixed line telecommunication companies
show a significant higher risk once rate-of-return regulation was abandoned in favour
of profit-sharing and price-cap regulation. The multiplicative coefficient of the RoR
Dummy and the market index (βdiff, Reg), which estimates the difference in risk
between the PC (and profit-sharing) period and the RoR period, is (as expected)
negative for the two sectors. In other words market risk for fixed line
telecommunication companies was significant lower during the RoR period than
during the period dominated by incentive regulation. The results also indicate that the
market risk for basic industries was slightly smaller in the RoR period than the risk
60 Almost all local-call companies were dominated by RoR regulation during the 1980s and dominated
by PC regulation from 1999 onwards. In the intermediate period of the 1990s however they often faced
RoR, PC and earnings-sharing regulation at the same time, depending on the decisions of the regulatory
commissions in each state they operated. 61 The values for R
2 are not presented in the following analysis. As all regressions are calculated on the
difference between the returns of the regulated telecommunication companies and the returns of the
control sample, which is assumed to be constant regardless of the returns of the market portfolio (apart
from the effect of the regulatory change), R2 values are quite low (usually below 10 %).

24
for fixed line telecommunication companies, while the market risk for other regulated
industries was more than twice as low than that for fixed line telecoms.62 Changes in
the level of alpha are also slightly positive, although these changes were minute,
which is exactly what is expected from theory (see section 5).
The regression results for the control sample of innovative industries show exactly the
opposite sign to the two other control samples. While innovative industries were
already more risky than fixed line telecommunication companies during the RoR
period, this difference increased even further during the period of incentive
regulation. However instead of lower risk levels of telecommunication companies
during the period of incentive regulation it might be that the results are caused by the
following: High-tech industries like biotechnology or software and computer
hardware companies showed a very large increase in market risk from the early 1990s
onwards. The companies in the ”innovative” control sample might have had quite
similar risk features as the telecommunication companies in the 1980s, but the impact
of the regulatory change in the telecommunication sector is probably overshadowed
by the huge increase of risk in the control samples in the comparison period (figure 3).
Market risk (β)
High-Tech
Telecom
RoR period PC period years
Figure 3: Changes in market risk for telecommunication and high-tech companies
62 The market index coefficient measures the difference in market risk between the fixed line
telecommunication sample and the control sample during the comparison period; adding the (negative)
RoR coefficient (RoR Dummy * Market Index) to the market index coefficient yields to the risk
difference between the telecommunication and control industry sectors in the RoR period.

25
Due to the larger increase of risk for the control sample of innovative industries the
regression coefficients then seem to indicate a larger difference in the beta factors for
the PC compared to the RoR period.
Figure 4 compares the development of stock prices for fixed line telecommunication
companies with the three groups of control samples. The pattern of the prices seems
to indicate that regulated and basic industries followed the characteristics of
telecommunication companies quite closely, while the innovative industries behaved
completely differently and are therefore not a useful control sample.63
Figure 4: Prices of the US telecommunication and the control samples indices
The impact of RoR and PC regulation was also tested against the individual
Datastream industry sectors (as control samples) and a number of alternative market
indices; the results remained however largely the same.
63 The graph also shows that the differences between the telecommunication and innovative industries
samples also existed in the pre- and post- e-commerce bubble periods.
0
2000
4000
6000
8000
10000
12000
14000
16000
1984
1985
1986
1987
1988
1989
1989
1990
1991
1992
1993
1994
1995
1995
1996
1997
1998
1999
2000
2001
2001
2002
2003
2004
years
index prices
fixed line telecom Regulated Industries
Basic Industries Innovative Industries

26
Regional Bell Operating Companies sample
As the Datastream fixed line telecommunication index also includes two unregulated
companies (out of 11 companies) regressions were also run for a sub-sample of the
three former Regional Bell Operating Companies (RBOCs), Verizon, SBC and Bell
South.64 The impact of the switch from RoR to incentive regulation for the sub-
sample of the three RBOC’s remained largely the same as for the fixed line
telecommunication sample (Table 3). Compared to basic and regulated industries
market risk was much lower for the RBOC’s during the RoR period, while the
coefficients for the control sample of innovative industries have the opposite sign.
However the increase in risk after the RoR period as well as the initial risk levels of
the three RBOC’s seem to be significant lower than that of the Datastream fixed line
index. But, as stated earlier, it is particular the fixed line local call business, which is
assumed to be a stable business of similar (low) risk as basic industries or other
regulated network industries. The risk for the three RBOCs is also expected to be
lower, as competition in the long distance market already had a significant impact in
the late 1980s and two of the companies in the Datastream fixed-line sample were not
regulated.
Table 3: Regression results for an equally weighted sample of the 3 big RBOC’s (Bell South,
SBC, Verizon; RoR dummy, CAPM, aggregate control samples, DS US market index)
Control sample (DS US Indices) Constant
Market Index (DS US Market
Index) RoR Dummy RoR Dummy * Market Index Observations
0 0.168 0.001 -0.174 5300 Basic Industries 0 (0.033)*** 0 (0.061)***
0 0.253 0.001 -0.12 5300 Regulated Industries 0 (0.030)*** 0 (0.069)*
0 -0.735 0.001 0.509 5300 Innovative Industries
0 (0.043)*** (0.000)* (0.074)***
(robust standard errors in parentheses, * significant at 10%; ** significant at 5%; *** significant at 1%)
64 MCI and NTL were not regulated; Sprint a main competitor of AT&T in the long-distance market
was only regulated in its local call markets. Alltel, CenturyTel and Citizens Communications operated
primarily in the local call markets, but remained relatively small before they acquired and merged with
a number of other local call providers in the second half of the 1990’s. However, as stated earlier, all
companies apart from MCI and NTL followed the same trend from RoR to PC regulation.
27
The risk increasing impact of PC regulation was also confirmed by applying a time
dummy for those years dominated by PC regulation for the Datastream fixed line and
the RBOCs samples (results not presented here). Furthermore it was also tested
whether the estimated increase in market risk could have been caused by the new
economy (e-commerce) bubble. For the US fixed line telecommunication sample
significant evidence of an increase of risk between July 1999 and December 2001 was
found for the basic industries control sample, while for the control sample of
regulated industries no significant difference was found. For the sample of the three
large former Regional Bell Operating Companies a risk increase was estimated for the
control sample of regulated industries, while against the control sample of basic
industries no significant difference was found. In any case only part of the risk
increase might be attributed to the influence of the e-commerce bubble, as the
regulation (RoR) dummy still remains highly significant (and of the same sign) for all
control samples, when accounting for the boom and burst of the new economy with a
separate dummy.
In addition to the CAPM the risk-regulation relationship was also tested for the three-
factor Fama-French model for the US Datastream fixed line index (Table 4). Adding
up the market factor with the additional factors for firm size (SMB) and book-to-
market ratio (HML) for the RoR period shows the total effect of the regulatory change
on risk. The market risk and the firm size factors for the Datastream fixed line sample
and the basic and regulated industries control samples still show a negative sign for
the RoR period, indicating lower levels of risk. These effects are however outweighed
by the highly significant HML factor, which has a positive sign for all three control
samples. For the fixed line telecommunication index and the basic industries control
sample the total effect is +0.576; the sample of regulated industries shows a total
effect of +0.139. This would indicate that the risk difference between fixed line
telecom firms and basic as well as other regulated industries was in fact larger during
the RoR period than in the period dominated by incentive regulation. However it is
difficult to say whether the shift to incentive regulation increased the overall market
risk or whether the value (HML) factor picks up something else (which is probably
more likely). It is generally quite difficult to interpret the additional Fama-French
factors as they are rather based on observed empirical regularities than on theoretical
explanations. Whether the size and value factors actually represent some underlying

28
theory or whether they are just a good approximation for other (unknown) market
trends is part of a fierce and ongoing debate.65
Table 4: Regression results for US Datastream fixed line telecom (RoR dummy, FF3F, aggregate control samples, DS US market index)
Control sample (DS US Indices) Constant
Market Index (DS US Market Index)
RoR Dummy
RoR Dummy * Market Index SMB
SMB * RoR
Dummy HML
HML * RoR
Dummy Obser-vations
0 0.048 0 -0.192 -0.377 -0.514 -0.584 1.282 5300 Basic Industries 0 -0.039 0 (0.073)*** (0.059)*** (0.189)*** (0.074)*** (0.126)***
0 0.133 0 -0.189 -0.388 -0.354 -0.581 0.682 5300 Regulated Industries 0 (0.034)*** 0 (0.074)** (0.053)*** (0.078)*** (0.068)*** (0.123)***
-0.001 -0.295 0.001 0.056 -0.747 -0.232 1.173 0.413 5300 Innovative Industries
(0.000)** (0.040)*** (0.000)* -0.069 (0.056)*** (0.137)* (0.072)*** (0.130)***
(robust standard errors in parentheses, * significant at 10%; ** significant at 5%; *** significant at 1%)
8. Conclusion
A large amount of theoretical literature has described the lack of incentives under
traditional rate-of-return (RoR) regulation and advocated price-cap (PC) regulation as
a superior instrument in setting incentives for efficiency improvements and cost
reductions. These increased incentives are achieved through a shift of risk from the
customers to the stockowners of the regulated firm, which is supposed to follow a
change from RoR to PC regulation. The empirical literature on the performance of
regulated companies under different regimes shows however quite mixed results.
Nonetheless hardly any empirical paper has addressed the issue yet, whether a change
in regulation actually results in a shift of risk.
In this paper we were able to show that the market risk of fixed line
telecommunication companies in the USA was significant lower during the period
when RoR regulation dominated, while it was significant higher over the period of PC
65 See for example Cambell and Vuolteenaho (2004).

29
regulation. These results were confirmed under the CAPM while results are slightly
more mixed under the three-factor Fama-French model. In addition the same results
were also shown for a sub sample of the former Regional Bell Operating Companies.
The effect also remains highly significant when accounting for possible effects of the
new economy bubble. All in all this does indicate that as a consequence of a shift
from RoR to PC regulation market risk did in fact increase, which should have
increased the companies incentives for cost reductions and efficiency improvements.
To draw further conclusions on the impact of regulation on market risk more evidence
from other sectors and countries is needed. However almost all countries and sectors
switched to PC regulation while the regulated companies were still completely or
largely owned by the government, so any potential changes in market risk cannot be
tested with asset pricing models. It would also be really interesting to test for the
(incentive and risk) effects of a change from PC regulation to deregulation. In the
analysed sample deregulation remains quite small, which does not allow to test for
such effects. A number of countries however already announced to phase out PC
regulation in the telecommunication sector over the next years.
30
References
Ai, Chunrong and Sappington, David E.M. "The Impact of State Incentive
Regulation on the U.S. Telecommunications Industry." Journal of Regulatory
Economics, 2002, 22(2), pp. 133-60.
Alexander, Ian; Mayer, Colin and Weeds, Helen. "Regulatory Structure and Risk
and Infrastructure Firms: An International Comparison." World Bank Policy Research
Working Paper No 1698, 1996.
Antoniou, Antonios and Pescetto, Gioia. "The Efect of Regulatory Announcements
on the Cost O Equity Capital of British Telecom." Journal of Business Finance and
Accounting, 1997, 24(1), pp. 1-25.
Aufderheide, Patricia. Communications Policy and the Public Interest: The
Telecommunications Act of 1996. New York: Guilford Press, 1999.
Banerjee, Aniruddha. "Does Incentive Regulation 'Cause' Degradation of Retail
Telephone Service Quality?" Information Economics and Policy, 2002, 15, pp. 243-
69.
Beesley, M.E. and Littlechild, S.C. "The Regulation of Privatized Monopolies in the
United Kingdom." RAND Journal of Economics, 1989, 20(3), pp. 454-72.
Berg, Sanford V. and Tschirhart, John. Natural Monopoly Regulation: Principles
and Practice. Cambridge University Press, 1988.
Bernstein, Jeffrey I. and Sappington, David E.M. "Setting the X Factor in Price-
Cap Regulation Plans." Journal of Regulatory Economics, 1999, 16(1), pp. 5-26.
Binder, John F. and Norton, Seth W. "Regulation, Profit Variability and Beta."
Journal of Regulatory Economics, 1999, 15, pp. 249-65.
Blank, Larry R.; Davis, Vivian Witkind and Reed, Catherine E. "Telecommunication Infrastructure Investments and State Regulatory Reform: A
Preliminary Look at the Data." NRRI Publications 94-27, 1994.
Blank, Larry R.; Kaserman, David L. and Mayo, John W. "Dominant Firm
Pricing with Competitive Entry and Regulation: The Case of Intralata Toll." Journal
of Regulatory Economics, 1998, 14, pp. 35-53.
Blume, Marshall E. "On the Assessment of Risk." The Journal of Finance, 1971,
26(1), pp. 1-10.
Brock, Gerald W. "Historical Overview," M. Cave, S. K. Majumdar and I.
Vogelsang, Handbool of Telecommunications Economics. Elsevier, 2002, 43-74.
31
Buckland, Roger and Fraser, Patricia. "Political and Regulatory Risk in Water
Utilities: Beta Sensitivity in the United Kingdom." Journal of Business Finance and
Acounting, 2001a, 28(7), pp. 877-904.
____. "Political and Regulatory Risk: Beta Sensitivity in Uk Electricity Distribution."
Journal of Regulatory Economics, 2001b, 19(1), pp. 5-25.
Burns, Phil and Riechmann, Christoph. "Regulatory Instruments and Investment
Behaviour." Utilities Policy, 2004, 12, pp. 211-19.
Cabral, Luis M.B. and Riordan, Michael H. "Incentives for Cost Reduction under
Price Cap Regulation." Journal of Regulatory Economics, 1989, 1, pp. 93-102.
Campbell, John Y. "Asset Pricing at the Millennium." The Journal of Finance, 2000,
55(4), pp. 1515-67.
Campbell, John Y. and Vuolteenaho, T. "Bad Beta, Good Beta." The American
Economic Review, 2004, 94(5), pp. 1249-75.
Clare, Andrew; Priestley, Richard and Thomas, Stephen. "Is Beta Dead? The Role
of Altenative Estimation Methods." Applied Economics Letters, 1997, 4, pp. 559-62.
Clements, Michael E. "Local Telephone Quality-of-Service: A Framework and
Empirical Evidence." Telecommunications Policy, 2004, 28, pp. 413-26.
Cochrane, John H. "New Facts in Finance." NBER working paper series, 1999,
7169.
Crandrall, Robert W. and Hazlett, Thomas W. "Telecommunications Policy
Reform in the United States and Canada." AEI-Brookings Joint Center for Regulatory
Studies Working Paper, 2000, 00-9.
Crew, Michael A. and Kleindorfer, Paul R. The Economics of Public Utility
Regulation. Houndmills: Macmillan Press, 1986.
____. "Incentive Regulaiton in the United Kingdom and the United States: Some
Lessons." Journal of Regulatory Economics, 1996, 9, pp. 211-25.
Fama, Eugene F. and French, Kenneth R. "The Cross-Section of Expected Stock
Returns." Journal of Finance, 1992, 47(2), pp. 427-65.
____. "Common Risk Factors in the Returns on Stocks and Bonds." Journal of
Financial Economics, 1993, 33, pp. 3-56.
____. "The Capital Asset Pricing Model: Theory and Evidence." Journal of Economic
Perspectives, 2004, 18(3), pp. 25-46.
Federal Communications Commission. "Local Telephone Competition." 2000,
08/00 release (as of 31.12.1999).
32
____. "Statistics of the Long Distance Telecommunications Industry." 2003, 1st
report, released 14.5.2003.
____. "10th Annual Cmrs Competition Report." 2005a, Report (FCC 05-173).
____. "Local Telephone Competition." 2005b, 07/05 release (as of 31.12.2004).
____. "Trends in Telephone Service." 2005c, 2005 report (released 06/05).
Gabel, Richard. "The Early Competitive Era in Telephone Communication, 1893-
1920." Law and Contemporary Problems, 1969, 34(2), pp. 340-59.
Galagedera, Don U.A. "A Review of Capital Asset Pricing Models." Working Paper
Series Monash University, 2004.
Grout, Paul A. "The Cost of Capital in Regulated Industries," M. Bishop, J. Kay and
C. Mayer, The Regulatory Challenge. Oxford University Press, 1995,
Grout, Paul A. and Zalewska, Anna. "The Impact of Regulation on Market Risk."
Journal of Financial Economics, 2006, 80(1), pp. 149-84.
Henry, Claude and Matheu, Michel. "New Regulations for Public Services in
Competition," C. Henry, M. Matheu and A. Jeunemaitre, Regulation of Network
Utilities: The European Experience. Oxford, New York: Oxford University Press,
2001,
Jagannathan, Ravi and McGrattan, Elen R. "The Capm Debate." Federal Reserve
Bank of Minneapolis Quarterly Review, 1995, 19(4), pp. 2-17.
Jamasb, Tooraj; Nillesen, Paul and Pollitt, Michael. "Strategic Behaviour under
Regulatory Benchmarking." Energy Economics, 2004, 26, pp. 825-43.
Kidokoro, Yukihiro. "The Effects of Reulatory Reform on Quality." Journal of the
Japanese and International Economics, 2002, 16, pp. 135-46.
Knieps, Günter. "Phasing out Sector-Specific Regulation in Competitive
Telecommunications." Kyklos, 1997, 50(3.), pp. 325-39.
Kridel, Donald J.; Sappington, David E.M. and Weisman, Dennis L. "The Effects
of Incentive Regulation in the Telecommunications Industry: A Survey." Journal of
Regulatory Economics, 1996, 9, pp. 269-306.
Laffont, Jean-Jacques and Tirole, Jean. A Theory of Incentives in Procurement and
Regulation. Cambridge, Massachusetts a.o.: MIT Press, 1993.
Lehman, Dale E.; Wiesman, Dennis and Weisman, Dennis L. The
Telecommunications Act of 1996: The Costs' of Managed Competition. Dordrecht:
Kluwer, 2000.
33
Lewellen, Wilburg G. and Mauer, David C. "Public Utility Valuation and Risk
under Incentive Regulation." Journal of Regulatory Economics, 1993, 5, pp. 263-87.
Lintner, John. "The Valuation of Risk Assets and the Selection of Risky Investments
in Stock Portfolios and Capital Budgets." Review of Economics and Statistics, 1965,
47(13 - 37).
Liston, Catherine. "Price-Cap Versus Rate-of-Return Regulation." Journal of
Regulatory Economics, 1993, 5, pp. 25-48.
Littlechild, S.C. "Regulation of British Telecommunications' Profitability: Report to
the Secretary of State," I. Bartle, Reprinted In: The Uk Model of Utility Regulation. A
20th Anniversary Collection to Mark the 'Littlechild Report' - Retrospect and
Prospect. Cri Proceedings 31 (2003). Bath: 1983,
Lumby, Steve and Jones, Chris. Investment Appraisal & Financial Decisions.
London: International Thomson Business, 1999.
Majumdar, Sumit K. "Incentive Regulation and Productive Efficiency in the U.S.
Telecommunication Industry." The Journal of Business, 1997, 70(4), pp. 547-76.
____. "With a Little Help from My Friends? Cross-Subsidy and Installed-Base
Quality in the U.S. Telecommunications Industry." International Journal of Industrial
Organisation, 2000, 18, pp. 445-70.
Malkiel, Burton G. "The Efficient Market Hypothesis and Its Critics." Journal of
Economic Perspectives, 2003, 17(1), pp. 59-82.
Mayer, Colin and Vickers, John. "Profit-Sharing Regulation: An Economic
Appraisal." Fiscal Studies, 1996, 17(1), pp. 1-18.
National Regulatory Research Institute. "A Time Series and Cross-Sectional
Classification of State Regulatory Policy Adopted for Local Exchange Carriers."
1998, NRRI 98-25.
____. "Forms of Regulation for Major Lecs in the U.S.States." 2000, as of October
2000.
____. "Retail Regulation of Local Telecommunication Providers." 2002, as of April
2002.
____. "State Retail Rate Regulation of Local Exchange Providers." 2003, as of June
2003.
____. "State Retail Rate Regulation of Local Exchange Providers." 2004, NRRI 04-
13.
Olufs, Dick W. The Making of Telecommunications Policy. Lynne Rienner
Publishers, 1998.
34
Paleari, Steano and Redondi, Renato. "Regulation Effects on Company Beta
Components." Bulletin of Economic Research, 2005, 57(4), pp. 317-46.
Park, Kwang Woo. "Time-Series Analysis of Return and Beta in the U.S." Journal
of the Academy of Business and Economics, 2004, 1(1).
Perold, André F. "The Capital Asset Pricing Model." The Journal of Economic
Perspectives, 2004, 18(3), pp. 3-24.
Resende, Marcelo. "Productivity Growth and Regulation in U.S. Local Telephony."
Information Economics and Policy, 1999, 11, pp. 23-44.
____. "Regulatory Regimes and Efficiency in Us Local Telephony." Oxford
Economic Papers, 2000, 52, pp. 447-70.
Resende, Marcelo and Facanha, Luis Otavio. "Price-Cap Regulation and Service-
Quality in Telecommunications: An Empirical Study." Information Economics and
Policy, 2005, 17, pp. 1-12.
Riddick, Leigh A. "The Effects of Regulation on Stochastic Systematic Risk."
Journal of Regulatory Economics, 1992, 4(2), pp. 139-57.
Robinson, T. A. and Taylor, Mark P. "The Effects of Regulation and Regulaory
Risk in the Uk Electricity Distribution Industry." Annals of Public and Cooperative
Economics, 1998, 63(3), pp. 331-46.
Roycroft, Trevor R. and Garcia-Murrilo, Martha. "Trouble Reports as an
Indicator of Service Quality: The Influence of Competition, Technology, and
Regulation." Telecommunications Policy, 2000, 24, pp. 947-67.
Sappington, David E. M. and Weisman, Dennis L. "Revenue Sharing in Incentive
Regulation Plans." Information Economics and Policy, 1996, 8, pp. 229-48.
Sharpe, William F. "Capital Asset Prices: A Theory of Market Equilibrium under
Conditions of Risk." The Journal of Finance, 1964, 19(3), pp. 425-42.
Shuttleworth, Graham. "Firm-Specific Productive Efficiency: A Response." The
Electricity Journal, 2003, 16(3), pp. 42-50.
Trebing, Harry M. "Common Carrier Regulation. The Silent Crisis." Law and
Contemporary Problems, 1969, 34(2), pp. 299-329.
United States Congress. "Telecommunications Act of 1996." Public Law 104–104,
104th Congress, 1996, Feb. 8, 1996.
Uri, Noel D. "Technical Efficiency, Allocative Efficiency, and the Implementation of
a Price Cap Plan in Telecommunications in the United States." Journal of Applied
Economics, 2001, IV(1), pp. 163-86.
35
____. "Measuring the Change in Productive Efficiency in Telecommmunications in
the USA." Jounal of Economic Studies, 2002, 29(2), pp. 150-67.
____. "The Adoption of Incentive Regulation and Its Effect on Technical Efficiency
in Telecommunications in the United States." International Journal of Production
Economics, 2003a, 86, pp. 21-34.
____. "Service Quality Effects of Incentive Regulation on Access Service in
Telecommunications in the United States." European Journal of Law and Economics,
2003b, 16, pp. 369-90.
Vogelsang, Ingo. "Incentive Regulation and Competition in Public Utility Markets: A
20-Year Perspective." Journal of Regulatory Economics, 2002, 22(1), pp. 5-27.
Wells, Curt. The Kalman Filter in Finance. Dordrecht, Boston, London: Kluwer,
1996.
Woroch, Glenn A. "Local Network Competition," M. E. Cave, S. K. Majumdar and
I. Vogelsang, Handbook of Telecommunications Economics. Elsevier, 2002, 641-716.