Embed Size (px)
Citation preview

Regression and Correlation

Bivariate Analysis
Can we say if there is a relationship between the number of hours spent in Facebook and the number of friends you have?
In this question, we have two seemingly unrelated variables– Number of hours spent in facebook– Number of facebook friends.
2

Bivariate AnalysisUnivariate Bivariate
Single variable Two variables
Does not deal with causes or relationship
Deals with causes or relationships
Main purpose is to describe Major purpose is to explain
Central tendency, dispersion, frequency distributions, graphs
Analysis of two variables simultaneously, correlations, comparisons, relationships, causes, explanations, independent and dependent variables
3

The question is:– How can we find a relationship between
the two? (assuming that there exists such a relationship)
Bivariate Analysis
4
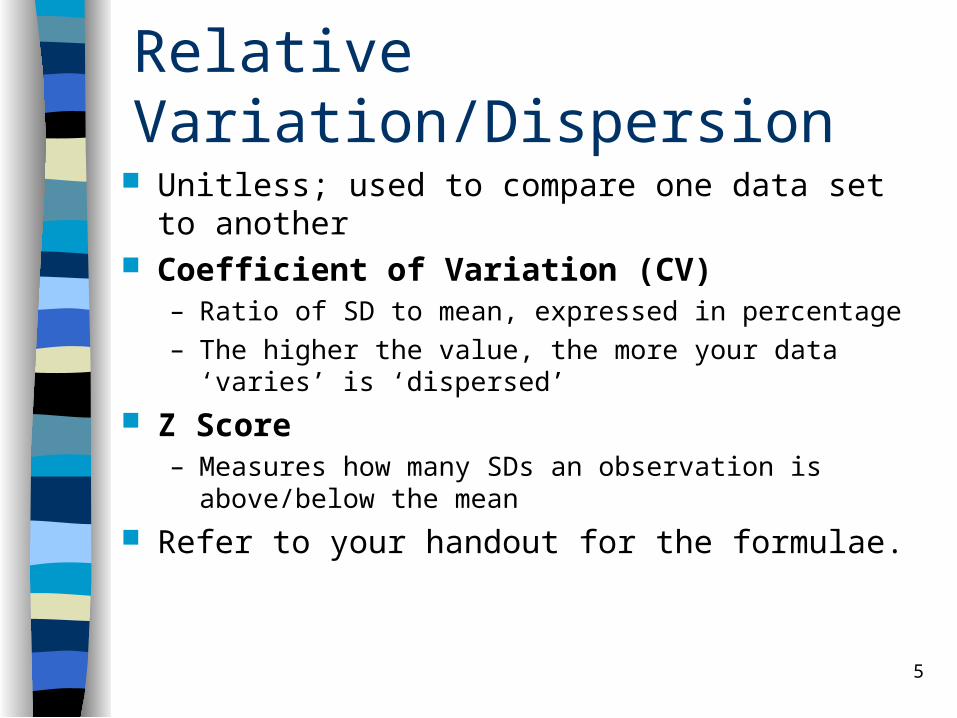
Relative Variation/Dispersion
Unitless; used to compare one data set to another Coefficient of Variation (CV)
– Ratio of SD to mean, expressed in percentage– The higher the value, the more your data ‘varies’ is
‘dispersed’
Z Score– Measures how many SDs an observation is above/below the
mean
Refer to your handout for the formulae.
5

Covariance

prepared by: Rose Ann V. Sale 7

Covariance
Measure of relationship between two variables Computed as below:
8
1
( )( )cov( , )
1
N
i ii
x X y Yx y
N

Example1
Covariance: 278.243
9

Example2
Covariance: -2.64
10
GPA TV in hours per week
3.1 14
2.4 10
2.0 20
3.8 7
2.2 25
3.4 9
2.9 15
3.2 13
3.7 4
3.5 21

cov(X,Y) > 0 X and Y are positively correlated
cov(X,Y) < 0 X and Y are inversely correlated
cov(X,Y) = 0 X and Y are independent
Interpreting Covariance
11

Correlation

prepared by: Rose Ann V. Sale 13

Correlation Measures the relative strength of the linear
relationship between two variables Unitless
Ranges between –1 and 1
The closer to –1, the stronger the negative linear
relationship
The closer to 1, the stronger the positive linear
relationship
The closer to 0, the weaker the linear relationship
14

Correlation Pearson r
– Used for quantitative data (remember interval & ratio levels?)
– Computed as below:
Spearman – Pearson r between ordinal variables, used for qualitative
data, and applies to quantitative as well!– Computed as below (if your data has no ties!):
In case of ties, Pearson r formula is applicable to ranked data, (tied values’ rank = Ave of their positions in ascending order)
15
cov( , )xy
x y
x yr
s s
2
12
61
1
N
ii
D
N N

Scatter Plots of Data with Various Correlation Coefficients
Y
X
Y
X
Y
X
r = -1 r = -.6
r = 016

Y
X
Y
X
r = +.3r = +1Y
Xr = 0
Scatter Plots of Data with Various Correlation Coefficients
17

Y
X
Y
X
Y
Y
X
X
Linear relationships Curvilinear relationships
Linear Correlation
18

Y
X
Y
X
Y
Y
X
X
Strong relationships Weak relationships
Linear Correlation
19

Linear Correlation
Y
X
Y
X
No relationship
20

Example 1
rxy = 0.934
21
= 0.786

Example2
rxy = -0.6284
22
GPA TV in hours per week
3.1 14
2.4 10
2.0 20
3.8 7
2.2 25
3.4 9
2.9 15
3.2 13
3.7 4
3.5 21
= -0.636

Linear Regression

Linear Regression
In correlation, the two variables are treated as equals.
In regression, one variable is considered independent (=predictor) variable (X) and the other the dependent (=outcome) variable Y.
24

Linear Regression
Independent variable cause Dependent variable effect Linear regression is a method of
predicting the value of dependent variable Y from the value of the independent variable X
25

What is “Linear”?
Remember this: y = mx + b
B
m
26

Line of Regression Prediction line or line of “best fit”
– This is where you find the expected value of one variable given the other.
Data points tend to cluster about this line (-1 < r < 1) General form given below:
Can you give the y = mx + b equivalent of the above?
27
yxy
x
sy Yr
sx X

Standard Error of Estimate Absolute difference from your line of regression
(“predicted”) to your actual measurements Calculated as follows:
Interpreted as “we can expect 68% of the time the true value of Y will lie in the band y units from the line of
regression.”
28
2
1
( )
2
N
i ii
y
Y y
N

Example1
Given the following ordered pair– (2,3) (5,5) (9,13) (12,7) (13,14)– Draw the scatter graph– Find the formula for the regression line– Draw an approximation of the regression
line– Compute for expected value (Ŷ) given X=9
29

Example1 Answer
30
Y= 0.8018x + 1.8249(Ŷ | x=9) = 9.0411

Example2
31
-Compute for the regression line- Predict the number of hours spent in Facebook of a person who has 400 fb friends

Example2 Answer
y = 0.0065x – 0.13 (y | x=400) = 2.47
32