Embed Size (px)
Citation preview

*For correspondence: [email protected]
Group author details:
Reproducibility Project: Cancer
Biology See page 36
Competing interest: See
page 36
Funding: See page 36
Received: 16 June 2015
Accepted: 29 October 2015
Published: 23 February 2016
Reviewing editor: Karen
Adelman, National Institute of
Environmental Health Sciences,
United States
Copyright Haven et al. This
article is distributed under the
terms of the Creative Commons
Attribution License, which
permits unrestricted use and
redistribution provided that the
original author and source are
credited.
Registered report: A chromatin-mediatedreversible drug-tolerant state in cancercell subpopulationsBabette Haven1, Elysia Heilig1, Cristine Donham1, Michael Settles1,Nicole Vasilevsky2, Katherine Owen3, Reproducibility Project: Cancer Biology*
1TGA Sciences, Medford, United States; 2Oregon Health and Science University,Portland, United States; 3University of Virginia, Charlottesville, United States
Abstract The Reproducibility Project: Cancer Biology seeks to address growing concerns about
reproducibility in scientific research by conducting replications of selected experiments from a
substantial number of high-profile papers in the field of cancer biology. The papers, which were
published between 2010 and 2012, were selected on the basis of citations and Altmetric scores
(Errington et al., 2014). This Registered Report describes the proposed replication plan of
experiments from “A chromatin-mediated reversible drug-tolerant state in cancer cell
subpopulations” by Sharma and colleagues, published in Cell in 2010 (Sharma et al., 2010). Sharma
and colleagues demonstrated that prolonged exposure of cancer cells to TKIs give rise to small
populations of “drug tolerant persisters” (DTPs) (Figure 1B-C) that were reversed during
subsequent maintenance under drug-free conditions (Figures 1E, 2B and 2E). DTPs exhibited
reduced histone acetylation and sensitivity to HDAC inhibitors (HDIs) (Figure 4A-B). Drug sensitivity
was restored with co-treatment of either HDIs or an IGF-1R inhibitor, in combination with TKIs
(Figure 5A-B). Inhibition of IGF-1R activation also led to decreased KDM5A expression and
restoration of H3K4 methylation, suggesting a direct link between the IGF-1R signaling pathway
and KDM5A function (Figure 7A, 7C, and 7I). The Reproducibility Project: Cancer Biology is a
collaboration between the Center for Open Science and Science Exchange and the results of the
replications will be published in eLife.
DOI: 10.7554/eLife.09462.001
IntroductionThe effectiveness of chemotherapy for the treatment of cancer is limited by the acquisition of drug
resistance. Intrinsic resistance, due to existing genetic alterations, as well as acquired resistance aris-
ing during treatment, can promote cross-resistance to structurally and functionally diverse drugs
(Kartal-Yandim et al., 2015). Numerous mechanisms are involved in the development of multidrug
resistance, including the overexpression of efflux proteins, decreased agent uptake, alterations in
drug targets and modification of cell cycle checkpoints (Engelman and Janne, 2008; Engelman and
Settleman, 2008; Kartal-Yandim et al., 2015; Krishnamurty and Maly, 2010). Moreover, it is
increasingly recognized that tumors contain a high degree of molecular heterogeneity (Greaves and
Maley, 2012), which can facilitate drug resistance through therapy-induced selection of resistant cell
subpopulations present in the original tumor (Swanton, 2012).
In the developed world, non-small cell lung cancer (NSCLC) is the predominant form of the dis-
ease, accounting for 85% of lung cancer cases (Allemani et al., 2015; Little et al., 2007). Activation
of the receptor tyrosine kinase epidermal growth factor receptor (EGFR) potentiates increased cell
proliferation, migration, and survival (Lynch et al., 2004; Paez et al., 2004; Pao et al., 2004;
Sharma et al., 2007). As a result, the EGFR gene has become an attractive target for small
Haven et al. eLife 2016;5:e09462. DOI: 10.7554/eLife.09462 1 of 38
REGISTERED REPORT

molecular inhibitors. Tyrosine kinase inhibitors (TKIs) that target EGFR, such as gefitinib and erlotinib
(Pao et al., 2004; Sequist et al., 2008; Stella et al., 2012), show initial clinical efficacy, however,
the majority of patients eventually develop resistance to these chemotherapeutic agents
(Maemondo et al., 2010; Rosell et al., 2012; Stewart et al., 2015). While a number of biological
mechanisms of acquired resistance in NSCLC have been described (Stewart et al., 2015), in up to
30% of patients, the mechanism of resistance remains unknown (Majem and Remon, 2013). Sharma
and colleagues have strongly implicated epigenetic changes as a key determinant in the mainte-
nance of subpopulations of cancer cells with high-level drug resistance and potent tumorigenic
capacity (Sharma et al., 2007).
In Figure 1B, the authors demonstrate that exposure of PC9 cells, a TKI-sensitive NSCLC cell line,
to high concentrations of TKIs can select for a small subpopulation of “drug tolerant persister” cells
(DTPs). The ability to generate PC9 persister cell populations in response to TKI treatment has been
confirmed and extended by others (Murakami et al., 2014; Ware et al., 2013). Furthermore, the
PC9 DTP phenotype was observed in a number of other TKI-sensitive cancer cells, including mela-
noma, colorectal, breast and gastric cancer-derived cell lines (Sharma et al., 2007). PC9 DTPs are
largely quiescent, with the majority of cells remaining in G1 phase as determined by flow cytometric
cell cycle analysis (Figure 1B). While not included in this replication attempt, prolonged exposure (30
+ days) of DTPs to TKIs resulted in the generation of proliferating expanded persisters (DTEPs), as
shown by colony outgrowth and cell cycle progression through S and G2/M phase (Sharma et al.,
2007). Unlike parental PC9 cells, DTPs acquire cancer stem cell markers, such as CD133
(Sharma et al., 2007; Figure 2B) and CD24 (Murakami et al., 2014). Perhaps most importantly, TKI
sensitivity was fully restored when PC9 DTPs were propagated in drug-free conditions (Figure 2E).
These data indicate that acquired TKI resistance might not require permanent genetic alterations, an
observation further supported by the fact that PC9 drug tolerance was not the result of genetic
alterations resulting in enhanced drug efflux (Figure 1E). These results will be replicated in Protocols
2–5.
Deregulation of the epigenome is recognized as a common feature of many types of cancers. Multi-
ple levels of epigenetic silencing have been defined in the alteration of gene expression, including
DNA methylation and chromatin deacetylation (Herman and Baylin, 2003; Shtivelman et al., 2014).
As shown in Figure 4A, PC9 DTPs exhibit reduced histone 3 acetylation compared to parental cells,
and treatment of these cells with the histone deacetylase inhibitor (HDI) trichostatin A (TSA) resensi-
tizes DTPs to apoptosis (Figure 4B). HDIs have been reported to induce a range of anticancer effects,
such as tumor cell apoptosis, cell cycle arrest, differentiation, senescence, modulation of immune
responses, and altered angiogenesis (Bolden et al., 2006). In Figure 5A,B, Sharma and colleagues
tested the efficacy of 13 pharmacological anti-cancer agents, including 9 kinase inhibitors and 4 HDIs,
in preventing the establishment of PC9 DTEPs. Inhibitors were used either as a single therapy or in
combination with erlotinib, and colony outgrowth was assessed. Of the compounds examined, the
combined treatment of HDIs (TSA, SAHA, scriptaid and MS275), together with erlotinib, prevented
the emergence of DTEPs (Figure 5A,B). The synergistic interaction between TKIs and HDIs in reducing
NSCLC viability has been described in several subsequent studies (Chen et al., 2013; Kurtze et al.,
2011; Nakagawa et al., 2013). In addition to histone deacetylase inhibitors, the IGF-1R TKI AEW541
was also capable of inhibiting the emergence of DTEPs. Sharma and colleagues observed high basal
expression of IGF binding protein 3 (IGFBP3), the high affinity binding partner of IGF-I and IGF-II, and
phosphorylated IGF-1R in PC9 DTPs (Figure 7A). IGF-1R inhibition completely abolished IGF-1R acti-
vation (Figure 7C) and led to a significant reduction in the expression of KDM5A, a histone demethy-
lase known to associate with histone deacetylases (Figure 7I), suggesting a direct link between the
IGF-1R signaling pathway and KDM5A function. Work by Murakami and colleagues demonstrated a
similar upregulation in IGF-1R activity in persistent TKI-selected NSCLC cells, although this phenotype
was not attributed to chromatin modifications (Murakami et al., 2014). These results will be replicated
in Protocols 4–9.
Haven et al. eLife 2016;5:e09462. DOI: 10.7554/eLife.09462 2 of 38
Registered report Biochemistry

Materials and methods
Protocol 1: Preliminary study of growth characterisitics of PC9 cells andPC9 “drug-tolerant persisters” (DTPs)This protocol describes the approach to determine growth characteristics of PC9 and PC9-derived
DTPs (DTPs) prior to the initiation of the reproducibility of the experiments listed in the subsequent
protocols. The experiments described will provide optimized parameters for subsequent protocols.
SamplingEach procedure will be performed once to access growth characteristics.
Materials and reagents
Reagent Type Manufacturer Catalog # Comments
PC9 Cells Cell line Sigma-Aldrich 90071810 Originally obtained fromDr. Kazuto Nishio(National CancerCenter Hospital, Tokyo)
10 cm dishes Labware Corning 430167 Original brand not specified.
Erlotinib Inhibitor Cayman Chemical 10483 Replaces originalobtained fromMGH pharmacy
DMSO Chemical Sigma-Aldrich D8418 Not originally reported.
RPMI 1640(4.5 g/l glucose)
Cell culture ATCC 30-2001 Original brandnot specified.
Fetalbovine serum (FBS)
Cell culture HyClone SH30910.03 Original brand not specified.
Penicillin-Streptomycin(5,000 U/ml)
Cell culture Life Technologies 15070-063 Not originally reported.
Trypsin Cell culture Life Technologies 25200-056 Not originally reported.
Accumax Cell culture InnovativeCell Technologies
AM-105 Not originally reported.
Cell titer Glo Cell viability assay Promega G7571 Not originally included.
96 well plates Labware Corning 3997, 3610 or 3917 Catalog # useddependson step of protocol
Procedure
Note& PC9 cells are grown in RPMI supplemented with 4.5 g/l glucose, 5% FBS and 1% penicillin/
streptomycin at 37˚C in a humidified atmosphere at 5% CO2.& Cells will be sent for mycoplasma testing and STR profiling.
1. Culture method:a. Thaw vial of PC9 cells in a 37˚C water bath for 2–2.5 min. Transfer cells to a 15 ml conical
tube containing 9 ml of pre-warmed growth medium.b. Pellet cells by centrifugation for 5 min at 100 x g. Aspirate the supernatant and resuspend
the cells in 1 ml of pre-warmed growth medium.c. Determine the cell density and percent viability using an automated cell counter. Seed
cells in T25, T75 or T175 cell culture flasks at a density of 20,000 cells/cm2.d. Incubate the cells in a 37˚C humidified incubator with 5% ambient CO2 for at least 2 pas-
sages after thaw prior to using them for further experiments. Subculture cells as necessaryto obtain the required number of cells for the procedures.
Haven et al. eLife 2016;5:e09462. DOI: 10.7554/eLife.09462 3 of 38
Registered report Biochemistry

2. Determining the doubling time of PC9 cells:a. Seed PC9 cells at 2,000 cells/cm2 in 10 cm dishes in 10 ml of growth medium/dish. Pre-
pare 12 dishes. Record the date and time of cell addition to the dishes. Incubate in a 37˚Chumidified incubator with 5% ambient CO2.
b. Every 24 hr after addition to the dishes, detach cells from 1 dish using 0.25% trypsin/EDTA and determine the cell density and percent viability using an automated cellcounter.
c. Generate a growth chart by plotting the number of live cells/flask verse the time inculture.
3. Assessing DMSO solvent toxicity on PC9 cells:a. Seed PC9 cells into 96 well plates:
i. Seed at 2500 cells/well in growth medium and incubate overnight to model theseeding density of cells during erlotinib IC50 determination (Protocol 3).
ii. Seed at 5800 cells/well in growth medium and incubate overnight to model theseeding density of cells during DTP generation (Protocol 2).
b. Dilute 100% DMSO to 0.0005-2% in growth medium.c. Aspirate growth medium from the plate containing PC9 cells and add 60 ml of each
DMSO dilution to the appropriate wells of the plate in triplicate. Add growth medium tothe untreated control wells.
d. Incubate the cells in the presence of DMSO dilutions for 3 days.e. Aspirate growth medium and add 100 ml/well of fresh growth medium to all wells contain-
ing cells and assay blank wells. Add 100 ml of CellTiter Glo to all wells containing growthmedium. Measure luminescence using the Synergy 2 multi-mode plate reader from Bio-Tek.
f. Subtract the assay blank value from all wells. Calculate the average RLU values of tripli-cate wells. Calculate the percent change in RLU values of the DMSO-treated wells fromthe untreated wells. Dilutions of DMSO that produce RLUs less than 95% of untreated willnot be used for cell treatment in future experiments.
4. Determining the percentage of erlotinib-treated PC9 cells that become DTPs and the toler-ance of DTPs and drug-withdrawn DTPs to trypsin or other detachment methods:a. Plate PC9 cells at 106 cells/dish (1.82 x 10⁴ cells/cm2) in a 10 cm tissue culture dish with
grids in 10 ml/dish of complete growth medium. Prepare 16 x 10 cm dishes. Incubate cellsfor 24 hr in a 37˚C/5% CO2 incubator to allow cells to attach.
b. Prepare erlotinib stock solution at the appropriate concentration in DMSO. If the resultsof step 3 allow, prepare a 60 mM erlotinib stock solution by dissolving 23.6 mg of erloti-nib in 1 ml of DMSO. Prepare 60 ml aliquots and store at -20˚C.
c. Prepare erlotinib working dilution by adding the appropriate volume of erlotinib stocksolution to 500 ml of growth medium for the appropriate final percentage of DMSO andso erlotinib is at a final concentration of 2 mM.
d. Aspirate the growth medium from dishes, and replace growth medium with 10 ml/dish oferlotinib working dilution.
e. Treat cells with erlotinib for 9 days, adding fresh medium and drug every 72 hr.f. At the end of 9 days of treatment, remove growth medium from the dishes and replace
with 10 ml/dish of fresh growth medium without erlotinib. The viable cells should remainattached to the plate and are considered DTPs. For 8 plates proceed directly to detach-ment methods (step g), while with the other 8 plates propagate PC9 DTPs for multipledoublings in growth medium without erlotinib and then proceed to detachment methods(step g).
g. Use the following methods to detach cells from 2 dishes each:i. 0.25% trypsin/EDTA at 37˚C for � 10 min.ii. 0.25% trypsin/EDTA at room temperature for � 10 min.iii. 0.025% trypsin/EDTA at 2–8˚C for � 10 min.iv. Accumax at room temperature for 5–30 min.
h. When cells have detached from the dishes, neutralize detachment enzymes as required,pool duplicates and pellet cell samples by centrifugation for 5 min at 100 x g.
i. Aspirate supernatants and resuspend cells in 35 ml of pre-warmed growth medium. Deter-mine cell density and viability using an automated cell counter and staining with trypanblue. The method with the highest yield and viability will be utilized.i. The confluency of the cells during the course of generating DTPs will be evaluated
and this procedure might be repeated with a higher seeding density in an effort to
Haven et al. eLife 2016;5:e09462. DOI: 10.7554/eLife.09462 4 of 38
Registered report Biochemistry

maximize the number of DTPs generated. The cells should always be sub-confluentthroughout the treatment period.
j. For drug-withdrawn PC9 DTPs, transfer 20 ml of each cell sample to one well of a 96-wellplate containing 80 ml of growth medium. Label the wells with the detachment methodand live cell by measuring staining with trypan blue. Incubate for 24 hr in a 37˚C/5% CO2
incubator. After 24 hr, check for cell attachment. Select the detachment method that hasthe least effect on cell viability, as measured by staining with trypan blue immediatelyafter detachment, and that allows for cell recovery and growth after seeding into a newplate.i. If the number of cells in each dish is so low that it seems likely there will be too few
cells to count with an automated cell counter, wait until drug-withdrawn DTPs beginto proliferate to perform this experiment.
5. Determining the doubling time of drug-withdrawn DTPs:a. Generate PC9 DTPs as described in step 4.b. Incubate DTPs in growth medium, without erlotinib, in a 37˚C/5% CO2 incubator, chang-
ing growth medium every 3 days.c. Using the detachment method selected in step 4, dissociate cells from 2 dishes every 24–
48 hr and determine the cell count and viability of each cell sample using an automatedcell counter and staining with trypan blue.
d. Dissociate cells from 2 plates every 24–48 hr until a complete growth curve is established.6. Assessing DMSO solvent toxicity on drug-withdrawn DTPs:
a. Generate drug-withdrawn PC9 DTPs as described in step 4.b. After determining the best detachment method in step 4, use this detachment method to
remove drug-withdrawn DTPs from dishes.c. Seed DTPs into the appropriate wells of a 96-well plate at 2,500 cells/well in growth
medium. Incubate the plate overnight in a 37˚C/5% CO2 incubator to allow cells toattach.
d. Dilute 100% DMSO to 0.0005-2% in growth medium.e. Aspirate growth medium from the plate containing drug-withdrawn PC9 DTPs and add 60
ml of each DMSO dilution to the appropriate wells of the plate in triplicate. Add growthmedium to the untreated control wells.
f. Incubate the cells in the presence of DMSO dilutions for 3 days.g. Aspirate growth medium and add 100 ml/well of fresh growth medium to all wells contain-
ing cells and assay blank wells. Add 100 ml of CellTiter Glo to all wells containing growthmedium. Measure luminescence using the Synergy 2 multi-mode plate reader from Bio-Tek.
h. Calculate the average values of triplicate wells. Subtract the assay blank value from allwells. Calculate the percent change in viability of the DMSO-treated wells from theuntreated wells. Dilutions of DMSO that produce RLUs less than 95% of untreated will notbe used for cell treatment in future experiments.
Deliverables
. Data to be collected:. Step 2/Step 5: Raw data and growth chart of PC9 cells and drug-withdrawn DTPs.. Step 3/Step 6: Raw data and percent cell survival of CellTiter Glo assay.. Step 4: Raw counts and percent DTP generation.. Step 4: Cell density and viability data from detachment methods.
Confirmatory analysis plan
� n/a
Known differences from the original studyAll known differences are listed in the materials and reagents section above with the originally used
item listed in the comments section. All differences have the same capabilities as the original and
are not expected to alter the experimental design.
Haven et al. eLife 2016;5:e09462. DOI: 10.7554/eLife.09462 5 of 38
Registered report Biochemistry

Provisions for quality controlAll of the raw data, will be uploaded to the project page on the OSF (https://osf.io/xbign) and made
publically available.
Protocol 2: Generation of PC9 DTPsThis protocol describes the generation of DTPs from PC9 cells treated with erlotinib. The percent of
cells surviving drug selection is calculated to replicate Figure 1C. The DTPs generated in the proto-
col will subsequently be used in protocols 3, 4, 5, 7, 8, and 9.
SamplingEach procedure will be performed for the following protocols:
& Protocol 3& Protocol 4& Protocol 5& Protocol 7& Protocol 8& Protocol 9
Materials and reagents
Reagent Type Manufacturer Catalog # Comments
PC9 Cells Cell line Sigma-Aldrich 90071810 Originally obtained fromDr. Kazuto Nishio(NationalCancerCenter Hospital, Tokyo)
10 cm dishes Labware Corning 430167 Original brandnot specified.
Erlotinib Inhibitor Cayman Chemical 10483 Replaces originalobtainedfrom MGH pharmacy
DMSO Chemical Sigma-Aldrich D8418 Not originally reported.
RPMI 1640(4.5 g/l glucose)
Cell culture ATCC 30-2001 Original brandnot specified.
Fetal bovine serum(FBS)
Cell culture HyClone SH30910.03 Original brandnot specified.
Penicillin-Streptomycin(5,000 U/ml)
Cell culture Life Technologies 15070-063 Not originally reported.
Procedure
Note& PC9 cells are grown in RPMI supplemented with 4.5 g/l glucose, 5% FBS and 1% penicillin/
streptomycin at 37˚C in a humidified atmosphere at 5% CO2.& Cells will be sent for mycoplasma testing and STR profiling.
1. Plate PC9 cells at 106 in 10 cm tissue culture dishes in media.a. Allow cells to become adherent before beginning drug treatment.b. Number of plates is dependent on percentage of erlotinib-treated PC9 cells that become
DTPs (protocol 1, step 4), and required number of DTPs in the assay used.2. Treat cells with 2 mM erlotinib (dissolved in DMSO) for 9 days, adding fresh media and drug
every 72 hr.
Haven et al. eLife 2016;5:e09462. DOI: 10.7554/eLife.09462 6 of 38
Registered report Biochemistry

a. Determine cell count with an automated cell counter before starting drug treatment toserve as a baseline for percent survival (based on time from plating and doubling time ofPC9 cells (protocol 1, step 2).
b. Stock concentration used will be determined from assessing DMSO solvent toxicity onPC9 cells (protocol 1, step 3) to determine final DMSO concentration.
3. At the end of 9 days of treatment, the viable cells should remain attached to the plate, andthese are considered DTPs. At the appropriate point indicated in each protocol, count thenumber of cells with an automated cell counter surviving after treatment to calculate the per-centage of cells surviving from the original population.a. Count the number of cells surviving after treatment in each dish and calculate the percent-
age of cells surviving from the original population. Calculate the average number ofDTPs/dish as well as the standard deviation.
Deliverables
. Data to be collected:. Count of number of cells surviving 9 days of drug treatment.. Quantification of the percent surviving cells from original population. (Figure 1C)
. Sample delivered for further analysis:. Erlotinib-resistant PC9-derived DTPs for protocols 3, 4, 5, 7, 8, and 9.
Confirmatory analysis plan& Meta-analysis of effect sizes:
. Compare the replication data (mean percent PC9-derived DTPs and 95% confidence inter-val) to the original data (mean percent PC9-derived DTPs and 95% confidence interval)and use a random effects meta-analytic approach to combine the original and replicationeffects, which will be presented as a forest plot.
Known differences from the original studyThe replication attempt will be restricted to only the PC9 cell line since this is the line utilized in the
other experiments of this replication attempt. All known differences are listed in the materials and
reagents section above with the originally used item listed in the comments section. All differences
have the same capabilities as the original and are not expected to alter the experimental design.
Provisions for quality controlAll of the raw data, will be uploaded to the project page on the OSF (https://osf.io/xbign) and made
publically available.
Protocol 3: Survival assay to determine the reversibility of DTP drugtoleranceThis protocol assesses the sensitivity of PC9-derived DTPs to erlotinib following prolonged drug
withdrawal. Erlotinib-resistant DTPs were generated as described in protocol 2, and then were cul-
tured in the absence of drug for nine doublings. They were then exposed to a range of erlotinib con-
centrations (~0–2 mM) for 72 hr and survival was assessed. Drug-naı̈ve PC9 cells were used as a
control. This protocol serves to replicate data described in Figure 2E.
SamplingThis experiment will be repeated 4 times.
. See Power Calculations section for details.
Experiment has 2 cohorts
. Cohort 1: Drug-naı̈ve PC9 cells
. Cohort 2: Erlotinib-resistant PC9 DTPs cultured in drug-free medium for nine doublings
Each cohort has 6 conditions to be performed with four technical repeats per experiment:
Haven et al. eLife 2016;5:e09462. DOI: 10.7554/eLife.09462 7 of 38
Registered report Biochemistry
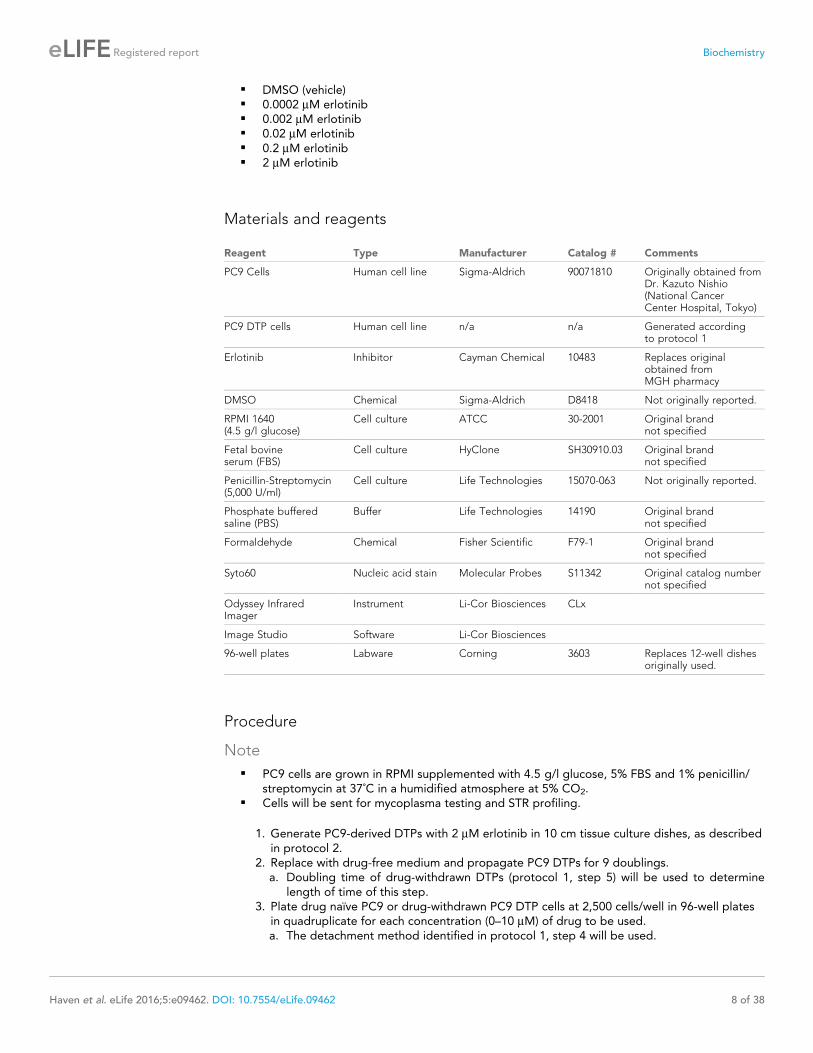
& DMSO (vehicle)& 0.0002 mM erlotinib& 0.002 mM erlotinib& 0.02 mM erlotinib& 0.2 mM erlotinib& 2 mM erlotinib
Materials and reagents
Reagent Type Manufacturer Catalog # Comments
PC9 Cells Human cell line Sigma-Aldrich 90071810 Originally obtained fromDr. Kazuto Nishio(National CancerCenter Hospital, Tokyo)
PC9 DTP cells Human cell line n/a n/a Generated accordingto protocol 1
Erlotinib Inhibitor Cayman Chemical 10483 Replaces originalobtained fromMGH pharmacy
DMSO Chemical Sigma-Aldrich D8418 Not originally reported.
RPMI 1640(4.5 g/l glucose)
Cell culture ATCC 30-2001 Original brandnot specified
Fetal bovineserum (FBS)
Cell culture HyClone SH30910.03 Original brandnot specified
Penicillin-Streptomycin(5,000 U/ml)
Cell culture Life Technologies 15070-063 Not originally reported.
Phosphate bufferedsaline (PBS)
Buffer Life Technologies 14190 Original brandnot specified
Formaldehyde Chemical Fisher Scientific F79-1 Original brandnot specified
Syto60 Nucleic acid stain Molecular Probes S11342 Original catalog numbernot specified
Odyssey InfraredImager
Instrument Li-Cor Biosciences CLx
Image Studio Software Li-Cor Biosciences
96-well plates Labware Corning 3603 Replaces 12-well dishesoriginally used.
Procedure
Note& PC9 cells are grown in RPMI supplemented with 4.5 g/l glucose, 5% FBS and 1% penicillin/
streptomycin at 37˚C in a humidified atmosphere at 5% CO2.& Cells will be sent for mycoplasma testing and STR profiling.
1. Generate PC9-derived DTPs with 2 mM erlotinib in 10 cm tissue culture dishes, as describedin protocol 2.
2. Replace with drug-free medium and propagate PC9 DTPs for 9 doublings.a. Doubling time of drug-withdrawn DTPs (protocol 1, step 5) will be used to determine
length of time of this step.3. Plate drug naı̈ve PC9 or drug-withdrawn PC9 DTP cells at 2,500 cells/well in 96-well plates
in quadruplicate for each concentration (0–10 mM) of drug to be used.a. The detachment method identified in protocol 1, step 4 will be used.
Haven et al. eLife 2016;5:e09462. DOI: 10.7554/eLife.09462 8 of 38
Registered report Biochemistry
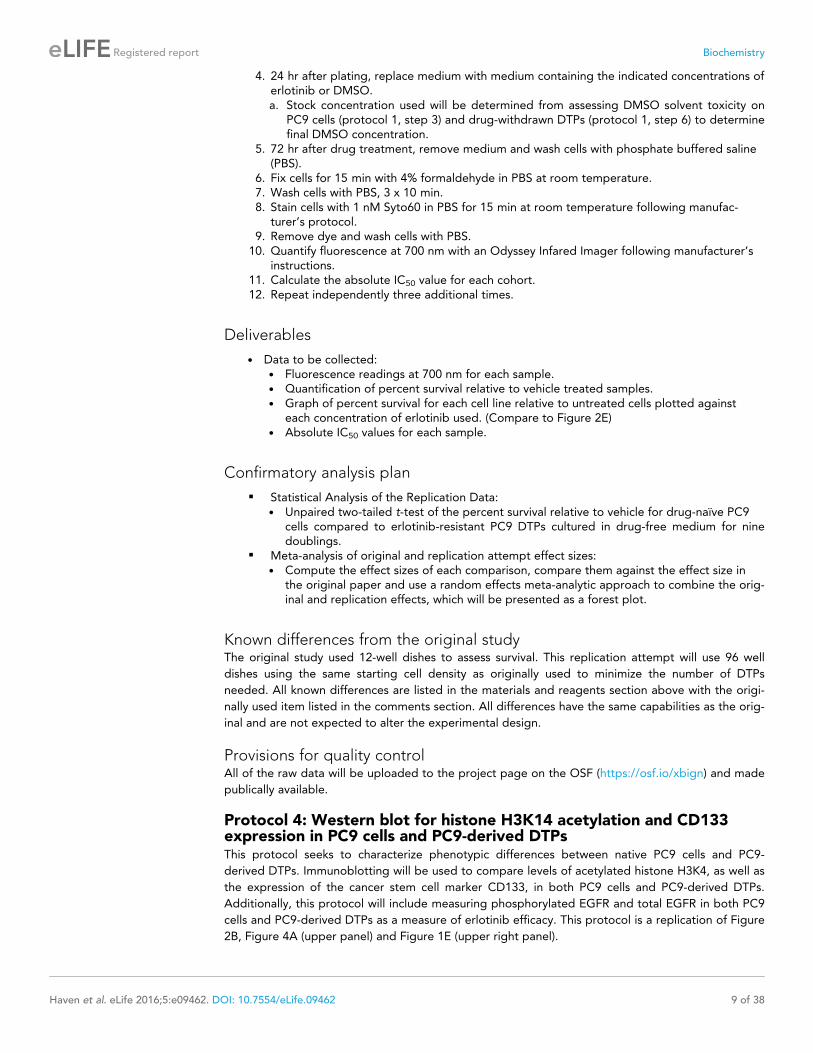
4. 24 hr after plating, replace medium with medium containing the indicated concentrations oferlotinib or DMSO.a. Stock concentration used will be determined from assessing DMSO solvent toxicity on
PC9 cells (protocol 1, step 3) and drug-withdrawn DTPs (protocol 1, step 6) to determinefinal DMSO concentration.
5. 72 hr after drug treatment, remove medium and wash cells with phosphate buffered saline(PBS).
6. Fix cells for 15 min with 4% formaldehyde in PBS at room temperature.7. Wash cells with PBS, 3 x 10 min.8. Stain cells with 1 nM Syto60 in PBS for 15 min at room temperature following manufac-
turer’s protocol.9. Remove dye and wash cells with PBS.
10. Quantify fluorescence at 700 nm with an Odyssey Infared Imager following manufacturer’sinstructions.
11. Calculate the absolute IC50 value for each cohort.12. Repeat independently three additional times.
Deliverables
. Data to be collected:. Fluorescence readings at 700 nm for each sample.. Quantification of percent survival relative to vehicle treated samples.. Graph of percent survival for each cell line relative to untreated cells plotted against
each concentration of erlotinib used. (Compare to Figure 2E). Absolute IC50 values for each sample.
Confirmatory analysis plan& Statistical Analysis of the Replication Data:
. Unpaired two-tailed t-test of the percent survival relative to vehicle for drug-naı̈ve PC9cells compared to erlotinib-resistant PC9 DTPs cultured in drug-free medium for ninedoublings.
& Meta-analysis of original and replication attempt effect sizes:. Compute the effect sizes of each comparison, compare them against the effect size in
the original paper and use a random effects meta-analytic approach to combine the orig-inal and replication effects, which will be presented as a forest plot.
Known differences from the original studyThe original study used 12-well dishes to assess survival. This replication attempt will use 96 well
dishes using the same starting cell density as originally used to minimize the number of DTPs
needed. All known differences are listed in the materials and reagents section above with the origi-
nally used item listed in the comments section. All differences have the same capabilities as the orig-
inal and are not expected to alter the experimental design.
Provisions for quality controlAll of the raw data will be uploaded to the project page on the OSF (https://osf.io/xbign) and made
publically available.
Protocol 4: Western blot for histone H3K14 acetylation and CD133expression in PC9 cells and PC9-derived DTPsThis protocol seeks to characterize phenotypic differences between native PC9 cells and PC9-
derived DTPs. Immunoblotting will be used to compare levels of acetylated histone H3K4, as well as
the expression of the cancer stem cell marker CD133, in both PC9 cells and PC9-derived DTPs.
Additionally, this protocol will include measuring phosphorylated EGFR and total EGFR in both PC9
cells and PC9-derived DTPs as a measure of erlotinib efficacy. This protocol is a replication of Figure
2B, Figure 4A (upper panel) and Figure 1E (upper right panel).
Haven et al. eLife 2016;5:e09462. DOI: 10.7554/eLife.09462 9 of 38
Registered report Biochemistry

SamplingThis experiment will be repeated a total of 4 times.
The original data is qualitative, thus to determine an appropriate number of replicates to initially
perform, sample sizes based on a range of potential variance was determined.
. See Power Calculations section for details.
Experiment has 2 cohorts:
& Cohort 1: Drug-naı̈ve PC9 cells& Cohort 2: Erlotinib-resistant PC9 DTPs
Western blotting is performed for the following proteins:
& Acetylated H3K14& CD133& pEGFR (Y1068)& H3 (total histone protein control) [additional]& EGFR (total EGFR protein control)& GAPDH (control)
Materials and reagents
Reagent Type Manufacturer Catalog # Comments
PC9 Cells Human cell line Sigma-Aldrich 90071810 Originally obtained fromDr. Kazuto Nishio (NationalCancer Center Hospital,Tokyo)
PC9 DTP cells Human cell line n/a n/a Generated accordingto protocol 2
10 cm dishes Labware Corning 430167 Original brand not specified.
RPMI 1640 (4.5 g/l glucose) Cell culture ATCC 30-2001 Original brandnot specified
Fetal bovine serum (FBS) Cell culture HyClone SH30910.03 Original brandnot specified
Penicillin-Streptomycin(5,000 U/ml)
Cell culture Life Technologies 15070-063 Not originally reported.
RIPA buffer Buffer Sigma-Aldrich R0278 From replicatinglab protocol
Complete mini proteaseinhibitor cocktail tablets
Inhibitor Roche Diagnostics 11 836 153 001 From replicatinglab protocol
Halt phosphataseinhibitor cocktail
Inhibitor Thermo Scientific 1862495 From replicatinglab protocol
Phenylmethanesulfonylfluoride solution
Inhibitor Sigma-Aldrich 93482
Pierce BCA ProteinAssay Kit
Protein Assay Thermo Fisher 23225 From replicatinglab protocol
NuPAGE LDS samplebuffer (4X)
Western blotreagent
Life Technologies NP0007 Replaces Laemmlisample buffer
cular weight markers Western blotreagent
Li-Cor 928-40000 Not originally reported.
NuPage Sample ReducingAgent (10X)
Western blotreagent
Life Technologies NP0004 From replicatinglab protocol
NuPAGE 4-12%Bis-Tris gels(10 well/15 well)
Western blotreagent
Life Technologies NP0335BOX/NP0336BOX
From replicatinglab protocol
Continued on next page
Haven et al. eLife 2016;5:e09462. DOI: 10.7554/eLife.09462 10 of 38
Registered report Biochemistry

Continued
Reagent Type Manufacturer Catalog # Comments
NuPAGE MES SDSRunning Buffer (20X)
Western blotreagent
Life Technologies NP0002 From replicatinglab protocol
NuPAGE MOPSSDS RunningBuffer (20X)
Western blotreagent
Life Technologies NP0001 From replicatinglab protocol
iBlot gel transferstacksnitrocellulose
Western blotreagent
Life Technologies IB301002 From replicating lab protocol
Rabbit anti-H3K14Acantibody
Antibodies Active Motif 39698 Original catalog numbernot specified. Note thateach new batch isassociated with a newcatalog number.
Rabbit anti-GAPDHantibody
Antibodies Life Technologies PA1-988 Original was from BiosourceInternational (acquired by LifeTechnologies)1:500-1:5000suggested dilution
Mouse anti-GAPDHantibody (clone GA1R)
Antibodies Life Technologies MA5-15738 Original was from BiosourceInternational (acquired byLife Technologies)1:1000-1:10,000 suggested dilution
Mouse anti-H3antibody (clone 1B1-B2)
Antibodies Active Motif 61476 Original catalog number notspecified. Note that each new batchis associated with a newcatalog number.
Mouse anti-CD133antibody(clone 17A6.1)
Antibodies EMD Millipore MAB4399 Replaces Cell SignalingTechnology brand (discontinued)
Rabbit anti-pEGFR (Y1068)antibody (clone D7A5)
Antibodies Cell Signaling Technology 3777 Original catalog number not specified.
Mouse anti-EGFRantibody(clone 1F4)
Antibodies Cell Signaling Technology 2239 Replaces Santa Cruz brand.
Donkey anti-mouseIRDye 680RD
Antibodies Li-Cor 926-68072 Replaces HRPconjugatedantibodies
Donkey anti-rabbitIRDye 800CW
Antibodies Li-Cor 926-32213
Odyssey InfraredImager
Instrument Li-Cor Biosciences CLx
Image Studio Software Li-Cor Biosciences
Procedure
Note& PC9 cells are grown in RPMI supplemented with 4.5 g/l glucose, 5% FBS and 1% penicillin/
streptomycin at 37˚C in a humidified atmosphere at 5% CO2.& Cells will be sent for mycoplasma testing and STR profiling.
1. Generate PC9-derived DTPs with 2 mM erlotinib in 10 cm tissue culture dishes, as describedin protocol 2.
2. Plate drug naı̈ve PC9 cells in 10 cm tissue culture dishes 2 days prior to harvest at sparsedensity.a. Seed cells at a density that will allow sufficient cells for analysis while remaining sub-
confluent.
Haven et al. eLife 2016;5:e09462. DOI: 10.7554/eLife.09462 11 of 38
Registered report Biochemistry

3. Dissociate cells from plates and count. Harvest drug naı̈ve PC9 and PC9-derived DTPs incomplete lysis buffer following replicating labs standard procedure.a. The detachment method identified in protocol 1, step 4 will be used.b. Complete lysis buffer: RIPA lysis buffer supplemented with 1X phosphatase inhibitor,
protease inhibitor cocktail, 1 mM PMSF.4. Normalize gel loading to total cell number, add 4X LDS sample buffer supplemented with
reducing agent, and denature at 70˚C for 10 min.a. Determine protein concentration by BCA assay following manufacturer’s instructions for
lysates from drug-naı̈ve PC9 cells to determine the total protein concentrations relativeto total cell number. Since erlotinib-resistant PC9 DTPs are anticipated to be less abun-dant, the PC9 BCA results will be used to approximate the concentration of DTPs toensure enough protein is loaded.
5. Separate equivalent number of cells (~10–60 mg of protein) per lane with protein ladder andtransfer to a membrane using the replicating labs standard procedures.
6. After transfer, block non-specific binding and immunoblot membrane with the followingcombinations of primary antibodies at the dilution/concentration recommended by thesupplier.a. Rabbit anti-H3K14Ac (17 kDa) at 0.5-2 mg/ml and mouse anti-H3 (17 kDa) at 0.25 mg/mlb. Rabbit anti-H3K14Ac (17 kDa) at 0.5-2 mg/ml and mouse anti-GAPDH (37 kDa) at
1:1000-1:10,000c. Mouse anti-CD133 (97 kDa) at 0.2 mg/ml and rabbit anti-GAPDH (37 kDa) at 1:500-
1:5000d. Rabbit anti-pEGFR (Y1068) (175 kDa) at 1:1000 and mouse anti-EGFR (175 kDa) at
1:1000 dilution
Protocol 4 Western Blot Antibody Multiplexing
Protein of interest Loading control
Combination Description Working Conc. Description Working Conc.
1 Rabbit anti-H3K14Ac(17 kDa)
0.5–2 mg/ml Mouse anti-H3(17 kDa)
0.25 mg/ml
2 Rabbit anti-H3K14Ac(17 kDa)
0.5–2 mg/ml Mouse anti-GAPDH(37 kDa)
1:500–1:5000
3 Mouse anti-CD133(97 kDa)
0.2 mg/ml Rabbit anti-GAPDH(37 kDa)
1:500–1:5000
4 Rabbit anti-pEGFR (Y1068)(175 kDa)
1:1000 Mouse anti-EGFR(175 kDa)
1:1000
7. Wash and apply appropriate secondary antibodies for 1 hr at RT with constant agitation anddetect signal using Odyssey imaging system.
8. Analyze bands with Image Studio software and normalize to loading controls.a. H3K14Ac normalized to H3 (total) [additional]b. H3K14Ac normalized to GAPDHc. CD133 normalized to GAPDHd. pEGFR (Y1068) normalized to EGFR (total)
9. Repeat independently three additional times.
Deliverables
. Data to be collected:. Full scans for each Western blot with ladder. (Compare to Figure 4A (upper panel), Fig-
ure 1E (upper right panel), and Figure 2B). Raw data of band analysis and normalized bands for each sample.
Confirmatory analysis plan
. Statistical Analysis of the Replication Data:. The following three tests will be performed using the Bonferroni correction because the
Western blots are all from the same samples:
Haven et al. eLife 2016;5:e09462. DOI: 10.7554/eLife.09462 12 of 38
Registered report Biochemistry

. Unpaired two-tailed t-test of H3K14Ac levels normalized to GAPDH from drug-naı̈vePC9 cells compared to erlotinib-resistant PC9 DTPs.
. Unpaired two-tailed t-test of normalized H3K14Ac levels from drug-naı̈ve PC9 cellscompared to erlotinib-resistant PC9 DTPs.
. Unpaired two-tailed t-test of normalized pEGFR (Y1068) levels from drug-naı̈ve PC9cells compared to erlotinib-resistant PC9 DTP
. Meta-analysis of original and replication attempt effect sizes. The replication data (mean and 95% confidence interval) will be plotted with the original
reported data value, where possible, plotted as a single point on the same plot forcomparison.
. Additional exploratory analysis:. H3K14Ac levels will also be normalized to H3 (total) and the same analysis described
above will be performed, which serves as an independent normalization control notincluded in the original report.
Known differences from the original studyAn additional control, total H3, was added to this replication attempt that was not originally
reported in Figure 4A (top panel) to normalize the H3K14 acetylation levels. The original loading
control of GAPDH will also be utilized to allow for a direct comparison. This replication attempt will
prepare cells in RIPA lysis buffer, while it is unclear if the original study used a lysis buffer, lysed cells
directly in Laemmli sample buffer, or used acid extraction for histones. All known differences are
listed in the materials and reagents section above with the originally used item listed in the com-
ments section. All differences have the same capabilities as the original and are not expected to
alter the experimental design.
Provisions for quality controlThe samples will be normalized based on total cell number, similar to the original report, but protein
concentration will also be determined to ensure enough lysate is loaded to ensure detection of the
proteins of interest. All of the raw data will be uploaded to the project page on the OSF (https://osf.
io/xbign) and made publically available.
Protocol 5: Flow cytometry to analyze sensitivity of PC9 cells to HDACinhibitionThis protocol tests the sensitivity of PC9 cells or PC9-derived DTPs to the HDAC inhibitor Trichosta-
tin A (TSA). Flow cytometry is utilized following BrdU staining to analyze the cell cycle distribution of
cells treated with TSA. In particular, sub-G1 apoptotic cells are quantified. It is a replication of the
experiment presented in Figure 4B (upper panel). The additional cell-cycle data collected in this pro-
tocol will also serve as a replication of Figure 1B (lower panel), as a means to characterize pheno-
typic differences between native PC9 cells and PC9-derived DTPs.
SamplingThis experiment will be repeated a total of 3 times for a minimum power of 80%.
. See Power Calculations section for details.
Experiment has 2 cohorts
& Cohort 1: Drug-naı̈ve PC9 cells& Cohort 2: Erlotinib-resistant PC9 DTPs
Each cohort will be treated with the following
& DMSO (Vehicle control) [additional]& untreated& 50 nM TSA& 100 nM TSA
Flow cytometry will be performed with the following antibodies or controls
& Anti-BrdU
Haven et al. eLife 2016;5:e09462. DOI: 10.7554/eLife.09462 13 of 38
Registered report Biochemistry

& Unstained cells (negative control)& No anti-BrdU (secondary only control)
Materials and reagents
Reagent Type Manufacturer Catalog # Comments
PC9 Cells Human cell line Sigma-Aldrich 90071810 Originally obtained fromDr. Kazuto Nishio (NationalCancer Center Hospital, Tokyo)
PC9 DTP cells Human cell line n/a n/a Generated accordingto protocol 2
10 cm dishes Labware Corning 430167 Original brand not specified.
RPMI 1640 (4.5 g/l glucose) Cell culture ATCC 30-2001 Original brand not specified.
Fetal bovine serum (FBS) Cell culture HyClone SH30910.03 Original brand not specified.
Penicillin-Streptomycin(5,000 U/ml)
Cell culture Life Technologies 15070-063 Not originally reported.
Trichostatin A (TSA) Inhibitor Enzo Life Sciences(Biomol)
BML-GR309-0001 Original catalog numbernot specified
DMSO Chemical Sigma-Aldrich D8418 Not originally reported
Cell Labeling Reagent (BrdU) GE Healthcare RPN201 Original was from AmershamPharmacia (acquired byGE Healthcare)
Anti-BrdU antibody (clone B44) Antibodies Becton-Dickinson 347580 Original catalog numbernot specified.
FITC-conjugated goat anti-mousesecondary antibody
Antibodies Jackson Immunoreserach 115-095-146 Replaces Vector laboratoriesbrand
2 M HCl Chemical Sigma-Aldrich 71826-1L Original brand not specified.
0.5% Triton X-100 Chemical Fisher Scientific BP151-100 Original brand not specified.
0.1 M NaB4O7�10H2O (pH 8.5) Chemical Sigma-Aldrich B9876 Original brand not specified.
5ug/ml propidium iodide Chemical BD Biosciences 556463 Replaces Sigma-Aldrich brand
RNAse A Enzyme Sigma-Aldrich R6513 Original catalog numbernot specified.
Ethanol Chemical Sigma-Aldrich E7023 Original brandnot specified.
Flow cytometer Instrument Becton Dickinson FACScan
Cell Quest Software Becton Dickinson
Procedure
Note& PC9 cells are grown in RPMI supplemented with 4.5 g/l glucose, 5% FBS and 1% penicillin/
streptomycin at 37˚C in a humidified atmosphere at 5% CO2.& Cells will be sent for mycoplasma testing and STR profiling.
1. Generate PC9-derived DTPs with 2 mM erlotinib in 10 cm tissue culture dishes, as describedin protocol 2.
2. Plate drug naı̈ve PC9 cells in 10 cm tissue culture dishes 2 days prior to harvest at sparsedensity.a. Seed cells at a density that will allow sufficient cells for analysis while remaining sub-
confluent.3. Treat cells with DMSO (vehicle), 50 nM TSA, or 100 nM TSA, or leave untreated, for 20 hr.
Haven et al. eLife 2016;5:e09462. DOI: 10.7554/eLife.09462 14 of 38
Registered report Biochemistry

a. Stock concentration used will be determined from assessing DMSO solvent toxicity onPC9 cells (protocol 1, step 3) and drug-withdrawn DTPs (protocol 1, step 6) to determinefinal DMSO concentration.
4. Dissociate cells from plates and count.a. The detachment method identified in protocol 1, step 4 will be used.b. Include adherent and floating cells.
5. Incubate cells with Cell Labeling Reagent at 37˚C for 1 hr following manufacturer’sinstructions.a. Include unstained cells (negative control)b. No anti-BrdU control (secondary only control)
6. Fix and stain cells with anti-BrdU following manufacturer’s instructions with the followingmodifications:a. Wash all cells (adherent and floating) with PBS.b. Fix cells with 80% ethanol.c. Denature DNA for 30 min with 2 M HCl/0.5% Triton X-100.d. Neutralize DNA with 0.1 M NaB4O7�10H2O (pH 8.5).e. Incubate cells with an anti-BrdU antibody at 20 ml per 106 cells according to manufac-
turer’s instructions.f. Incubate cells with a FITC-conjugated goat anti-mouse secondary antibody diluted 1:50.
7. Treat cells with RNase A following manufacturer’s instructions.8. Stain cells with 5ug/ml propidium iodide following manufacturer’s instructions.9. Analyze cells using two-dimensional FACS analysis and CELLQUEST software.
a. Determine percentage of cells in the various phases of the cell cycle (G1, S, and G2M)including the sub-G1 population.
10. Repeat independently two additional times.
Deliverables
. Data to be collected:. All flow populations including each gating step plus histogram plots for final population. Analysis of cell cycle distribution. (Compare to Figure 1B). Bar graph depicting the percent sub-G1 population for each cohort. (Compare to Figure
4B)
Confirmatory analysis plan& Statistical Analysis of the Replication Data:
. Cochran-Mantel-Haenszel test (3x2x3 contingency table) of the percent of cells in the dif-ferent cell cycle phases (G1, S, and G2M) of drug-naı̈ve PC9 cells compared to erlotinib-resistant PC9 DTPs cells left untreated, while controlling for the number of times theexperiment is performed.
. Two-way ANOVA of percent of sub-G1 cells from drug-naı̈ve PC9 and erlotinib-resistantPC9 DTPs cells left untreated or treated with 50 nM TSA, or 100 nM TSA with the follow-ing planned comparisons using the Bonferroni correction:. Percent of sub-G1 cells from drug-naı̈ve PC9 cells untreated compared to 50 nM
TSA.. Percent of sub-G1 cells from drug-naı̈ve PC9 cells untreated compared to 100 nM
TSA.. Percent of sub-G1 cells from erlotinib-resistant PC9 DTPs untreated compared to 50
nM TSA.. Percent of sub-G1 cells from erlotinib-resistant PC9 DTPs untreated compared to
100 nM TSA.& Meta-analysis of original and replication attempt effect sizes:
. Compute the effect sizes of each comparison, compare them against the effect size inthe original paper and use a random effects meta-analytic approach to combine the orig-inal and replication effects, which will be presented as a forest plot.
Haven et al. eLife 2016;5:e09462. DOI: 10.7554/eLife.09462 15 of 38
Registered report Biochemistry
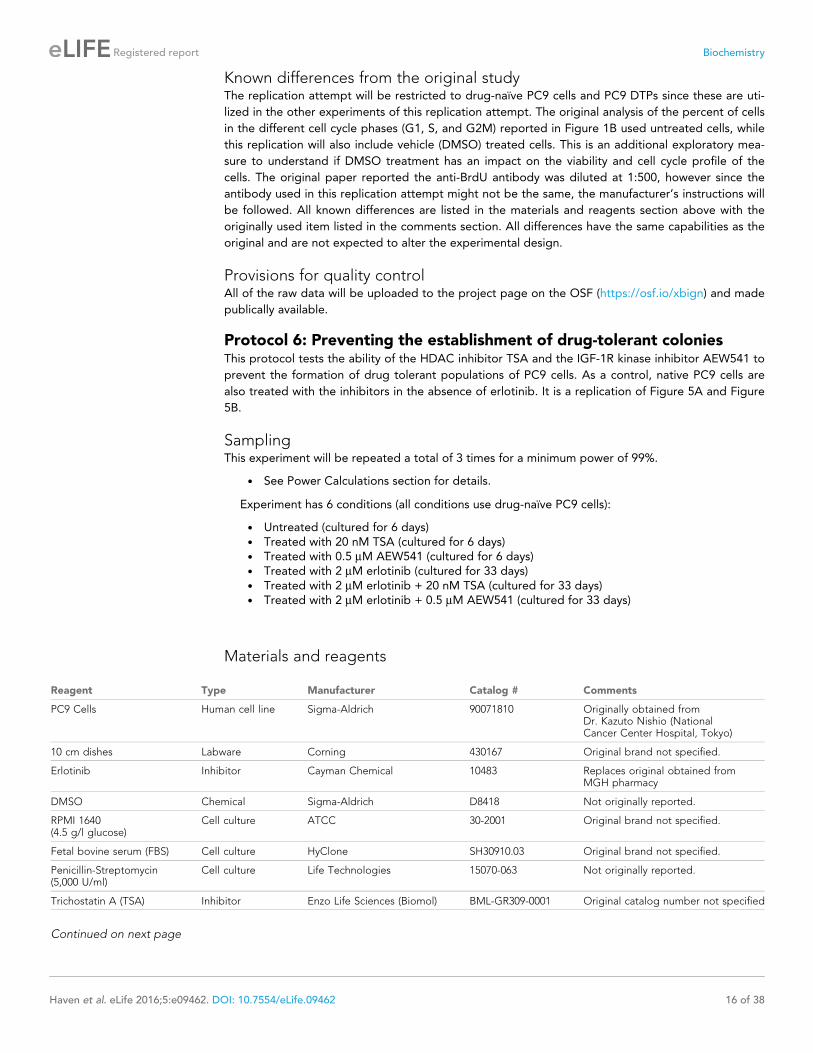
Known differences from the original studyThe replication attempt will be restricted to drug-naı̈ve PC9 cells and PC9 DTPs since these are uti-
lized in the other experiments of this replication attempt. The original analysis of the percent of cells
in the different cell cycle phases (G1, S, and G2M) reported in Figure 1B used untreated cells, while
this replication will also include vehicle (DMSO) treated cells. This is an additional exploratory mea-
sure to understand if DMSO treatment has an impact on the viability and cell cycle profile of the
cells. The original paper reported the anti-BrdU antibody was diluted at 1:500, however since the
antibody used in this replication attempt might not be the same, the manufacturer’s instructions will
be followed. All known differences are listed in the materials and reagents section above with the
originally used item listed in the comments section. All differences have the same capabilities as the
original and are not expected to alter the experimental design.
Provisions for quality controlAll of the raw data will be uploaded to the project page on the OSF (https://osf.io/xbign) and made
publically available.
Protocol 6: Preventing the establishment of drug-tolerant coloniesThis protocol tests the ability of the HDAC inhibitor TSA and the IGF-1R kinase inhibitor AEW541 to
prevent the formation of drug tolerant populations of PC9 cells. As a control, native PC9 cells are
also treated with the inhibitors in the absence of erlotinib. It is a replication of Figure 5A and Figure
5B.
SamplingThis experiment will be repeated a total of 3 times for a minimum power of 99%.
. See Power Calculations section for details.
Experiment has 6 conditions (all conditions use drug-naı̈ve PC9 cells):
. Untreated (cultured for 6 days)
. Treated with 20 nM TSA (cultured for 6 days)
. Treated with 0.5 mM AEW541 (cultured for 6 days)
. Treated with 2 mM erlotinib (cultured for 33 days)
. Treated with 2 mM erlotinib + 20 nM TSA (cultured for 33 days)
. Treated with 2 mM erlotinib + 0.5 mM AEW541 (cultured for 33 days)
Materials and reagents
Reagent Type Manufacturer Catalog # Comments
PC9 Cells Human cell line Sigma-Aldrich 90071810 Originally obtained fromDr. Kazuto Nishio (NationalCancer Center Hospital, Tokyo)
10 cm dishes Labware Corning 430167 Original brand not specified.
Erlotinib Inhibitor Cayman Chemical 10483 Replaces original obtained fromMGH pharmacy
DMSO Chemical Sigma-Aldrich D8418 Not originally reported.
RPMI 1640(4.5 g/l glucose)
Cell culture ATCC 30-2001 Original brand not specified.
Fetal bovine serum (FBS) Cell culture HyClone SH30910.03 Original brand not specified.
Penicillin-Streptomycin(5,000 U/ml)
Cell culture Life Technologies 15070-063 Not originally reported.
Trichostatin A (TSA) Inhibitor Enzo Life Sciences (Biomol) BML-GR309-0001 Original catalog number not specified
Continued on next page
Haven et al. eLife 2016;5:e09462. DOI: 10.7554/eLife.09462 16 of 38
Registered report Biochemistry

Continued
Reagent Type Manufacturer Catalog # Comments
AEW541 Inhibitor Cayman Chemical 13641 Replaces original obtainedfrom Novartis Pharmaceuticals
Giemsa stain Chemical Ricca Chemical Company 3250-4 Original brand not specified
Methanol Chemical Specific brand informationwill be left upto the discretionof the replicating lab and recorded later
Reagent needed fromGiemsa staining protocol
Phosphatebuffered saline (PBS)
Buffer Life Technologies 14190 Original brand not specified
Procedure
Note
. PC9 cells are grown in RPMI supplemented with 4.5 g/l glucose, 5% FBS and 1% penicillin/streptomycin at 37˚C in a humidified atmosphere at 5% CO2.
. Cells will be sent for mycoplasma testing and STR profiling.
1. Plate PC9 cells at 1 x 10⁵ in 10 cm tissue culture dishes in medium.a. Allow cells to become adherent before beginning drug treatment.
2. 24 hr after plating, treat cells with the pharmacological agents for the following times:a. Stock concentration used will be determined from assessing DMSO solvent toxicity on
PC9 cells (protocol 1, step 3) to determine final DMSO concentration.b. Untreated - 6 daysc. DMSO (vehicle) treated - 6 daysd. 20 nM TSA - 6 dayse. 0.5 mM AEW541 - 6 daysf. 2 mM erlotinib - 33 daysg. 2 mM erlotinib + 20 nM TSA - 33 daysh. 2 mM erlotinib + 0.5 mM AEW541 - 33 days
3. Replace with fresh media containing relevant drugs every 72 hr.4. After the appropriate length of drug treatment, remove media and fix cells with ice-cold
methanol for 5 min at room temperature. Stain with Giemsa following manufacturer’sinstructions.
5. Blindly analyze culture dishes by light microscopy (40X magnification) and manually count thenumber of individual colonies present.
6. Repeat independently two additional times.
Deliverables& Data to be collected:
. Images of plates after staining. (Compare to Figure 5A)
. Bar graph of number of resistant colonies formed after each treatment. (Compare to Fig-ure 5B)
Confirmatory analysis plan
. Statistical Analysis of the Replication Data:. Wilcoxon-Mann Whitney test of colony numbers of drug-naı̈ve PC9 cells treated with
erlotinib, erlotinib + TSA, and erlotinib + AEW541 with the following comparisons usingthe Bonferroni correction:. Number of colonies from drug-naı̈ve PC9 cells treated with erlotinib compared to
erlotinib + TSA.. Number of colonies from drug-naı̈ve PC9 cells treated with erlotinib compared to
erlotinib + AEW541.
Haven et al. eLife 2016;5:e09462. DOI: 10.7554/eLife.09462 17 of 38
Registered report Biochemistry

. Meta-analysis of original and replication attempt effect sizes:. Compute the effect sizes of each comparison, compare them against the effect size in
the original paper and use a random effects meta-analytic approach to combine the orig-inal and replication effects, which will be presented as a forest plot.
Known differences from the original studyThe replication attempt will be restricted to TSA and AEW541 inhibitors and not include the other
pharmacological agents originally reported since only these inhibitors are utilized in the other experi-
ments of this replication attempt. The original study used formaldehyde to fix the cells, while this
replication attempt will use methanol as recommended by the manufacturer. All known differences
are listed in the materials and reagents section above with the originally used item listed in the com-
ments section. All differences have the same capabilities as the original and are not expected to
alter the experimental design.
Provisions for quality controlAll of the raw data, will be uploaded to the project page on the OSF (https://osf.io/xbign) and made
publically available.
Protocol 7: Western blot for phosphorylation of IGF-1R and expressionof IGFBP3 in PC9-derived DTPsThis protocol utilizes Western blotting to compare the levels of phosphorylated IGF-1R and the
expression of IGFBP3 in PC9 cells and PC9-derived DTPs. Non-phosphorylated IGF-1R is included as
a loading control. It is a replication of Figure 7A.
SamplingThis experiment will be repeated a total of 3 times.
The original data is qualitative, thus to determine an appropriate number of replicates to initially
perform, sample sizes based on a range of potential variance was determined.
. See Power Calculations section for details.
Experiment has 2 cohorts:
. Cohort 1: Drug-naı̈ve PC9 cells
. Cohort 2: Erlotinib-resistant PC9 DTPs
Western blotting is performed for the following proteins:
. Phosphorylated IGF-1R (Y1165,1166)
. IGF-1R
. IGFBP3
Materials and reagents
Reagent Type Manufacturer Catalog # Comments
PC9 Cells Human cell line Sigma-Aldrich 90071810 Originally obtained fromDr. KazutoNishio (National CancerCenter Hospital, Tokyo)
PC9 DTP cells Human cell line n/a n/a Generated according toprotocol 2
10 cm dishes Cell culture Corning 430167 Original brand not specified.
RPMI 1640 (4.5 g/l glucose) Cell culture ATCC 30-2001 Original brand not specified.
Fetal bovine serum (FBS) Cell culture HyClone SH30910.03 Original brand not specified.
Penicillin-Streptomycin (5,000 U/ml) Cell culture Life Technologies 15070-063 Not originally reported.
Continued on next page
Haven et al. eLife 2016;5:e09462. DOI: 10.7554/eLife.09462 18 of 38
Registered report Biochemistry

Continued
Reagent Type Manufacturer Catalog # Comments
Phosphate buffered saline (PBS) Buffer Life Technologies 14190 Original brand not specified.
RIPA buffer Buffer Sigma-Aldrich R0278 From replicating lab protocol
Complete mini proteaseinhibitor cocktail tablets
Inhibitor Roche Diagnostics 11 836 153 001 From replicating lab protocol
Halt phosphatase inhibitorcocktail
Inhibitor Thermo Scientific 1862495 From replicating lab protocol
Phenylmethanesulfonyl fluoridesolution
Inhibitor Sigma-Aldrich 93482
NuPAGE LDS samplebuffer (4X)
Western blot reagent Life Technologies NP0007 Replaces Laemmlisample buffer
NuPage Sample ReducingAgent (10X)
Western blot reagent Life Technologies NP0004 From replicating lab protocol
Molecular weight markers Western blot reagent Li-Cor 928-40000 Not originally reported.
NuPAGE 4-12% Bis-Tris gels(10 well/15 well)
Western blot reagent Life Technologies NP0335BOX/NP0336BOX
From replicating lab protocol
NuPAGE MOPS SDS RunningBuffer (20X)
Western blot reagent Life Technologies NP0001 From replicating lab protocol
iBlot gel transferstacks nitrocellulose
Western blot reagent Life Technologies IB301002 From replicating lab protocol
Rabbit anti-human pIGF-1R(Y1165/1166) antibody
Antibodies Abcam ab192214 Original brand not specified.
Mouse anti-IGF-1R antibody(clone JBW902)
Antibodies EMD Millipore 05-656 Replaces GenScript(discontinued)
Rabbit anti-IGFBP3 antibody Antibodies Cell Signaling Technology 13216 Replaces GenScript(discontinued)
Donkey anti-mouseIRDye 680RD
Antibodies Li-Cor 926-68072 Replaced HRP conjugatedantibodies
Donkey anti-rabbitIRDye 800CW
Antibodies Li-Cor 926-32213
Odyssey Infrared Imager Instrument Li-Cor Biosciences CLx
Image Studio Software Li-Cor Biosciences
Procedure
Note
. PC9 cells are grown in RPMI supplemented with 4.5 g/l glucose, 5% FBS and 1% penicillin/streptomycin at 37˚C in a humidified atmosphere at 5% CO2.
. Cells will be sent for mycoplasma testing and STR profiling.
1. Generate PC9-derived DTPs with 2 mM erlotinib in 10 cm tissue culture dishes, as describedin protocol 2.
2. Plate drug naı̈ve PC9 cells in 10 cm tissue culture dishes 2 days prior to harvest at sparsedensity.a. Seed cells at a density that will allow sufficient cells for analysis while remaining sub-
confluent.3. Dissociate cells from plates and count. Harvest drug naı̈ve PC9 and PC9-derived DTPs in
complete lysis buffer following replicating labs standard procedure.a. The detachment method identified in protocol 1, step 4 will be used.b. Complete lysis buffer: RIPA lysis buffer supplemented with 1X phosphatase inhibitor,
protease inhibitor cocktail, 1 mM PMSF.4. Normalize gel loading to total cell number, add 4X LDS sample buffer supplemented with
reducing agent, and denature at 70˚C for 10 min.
Haven et al. eLife 2016;5:e09462. DOI: 10.7554/eLife.09462 19 of 38
Registered report Biochemistry

a. Determine protein concentration by BCA assay following manufacturer’s instructions forlysates from drug-naı̈ve PC9 cells to determine the total protein concentrations relativeto total cell number. Since erlotinib-resistant PC9 DTPs are anticipated to be less abun-dant, the PC9 BCA results will be used to approximate the concentration of DTPs toensure enough protein is loaded.
5. Separate equivalent number of cells (~10–60 mg of protein) per lane with protein ladder andtransfer to a membrane using the replicating labs standard procedures.
6. After transfer, block non-specific binding and immunoblot membrane with the followingcombinations of primary antibodies at the dilution/concentration recommended by thesupplier.a. Rabbit anti-phospho-IGF-1R (Y1165/1166) (95 kDa) at a 1:500-1:2000 and mouse anti-
IGF-1R (95 kDa) at 0.1–2 mg/ml.b. Rabbit anti-IGFBP3 (40 kDa) at a 1:1000 dilution and mouse anti-IGF-1R (95 kDa) at 0.1–
2 mg/ml.
Protocol 7 Western Blot Antibody Multiplexing
Protein of interest Loading Control
Combination Description Working Conc. Description Working Conc.
1 Rabbit anti-phospho-IGF-1R(Y1165/1166) (95 kDa)
1:500-1:2000 Mouse anti-IGF-1R(95 kDa)
0.1–2 mg/ml
2 Rabbit anti-IGFBP3 (40 kDa) 1:1000 Mouse anti-IGF-1R(95 kDa)
0.1–2 mg/ml
7. Wash and apply appropriate secondary antibodies for 1 hr at RT with constant agitation anddetect signal using Odyssey imaging system.
8. Analyze bands with Image Studio software and normalize to loading controls.a. pIGF-1R (Y1165/1166) normalized to IGF-1R (total)b. IGFBP3 normalized to IGF-1R (total)
9. Repeat independently two additional times.
Deliverables& Data to be collected:
. Full scans of each Western blot with ladder. (Compare to Figure 7A)
. Raw data of band analysis and normalized bands for each sample.
Confirmatory analysis plan& Statistical Analysis of the Replication Data:
. One-way MANOVA of normalized pIGF-1R and IGFBP3 levels of drug-naı̈ve PC9 anderlotinib-resistant PC9 DTPs cells with the following planned comparisons using the Bon-ferroni correction:. Normalized pIGF-1R (Y1165/1166) levels from drug-naı̈ve PC9 cells compared to
erlotinib-resistant PC9 DTPs.. Normalized IGFBP3 levels from drug-naı̈ve PC9 cells compared to erlotinib-resistant
PC9 DTPs.& Meta-analysis of original and replication attempt effect sizes:
. The replication data (mean and 95% confidence interval) will be plotted with the originalreported data value plotted as a single point on the same plot for comparison.
Known differences from the original studyThis replication attempt will prepare cells in RIPA lysis buffer while it is unclear if the original study
used a lysis buffer or lysed cells directly in Laemmli sample buffer. All known differences are listed in
the materials and reagents section above with the originally used item listed in the comments sec-
tion. All differences have the same capabilities as the original and are not expected to alter the
experimental design.
Haven et al. eLife 2016;5:e09462. DOI: 10.7554/eLife.09462 20 of 38
Registered report Biochemistry

Provisions for quality controlThe samples will be normalized based on total cell number, similar to the original report, but protein
concentration will also be determined to ensure enough lysate is loaded to ensure detection of the
proteins of interest. All of the raw data will be uploaded to the project page on the OSF (https://osf.
io/xbign) and made publically available.
Protocol 8: Western blot for phosphorylation of IGF-1R following IGF-1R inhibitionThis protocol utilizes Western blotting to compare the levels of phosphorylated IGF-1R upon treat-
ment of PC9-derived DTPs with the IGF-1R inhibitor AEW541. ERK1/2 is used as a loading control. It
is a replication of Figure 7C.
SamplingThis experiment will be repeated a total of 3 times.
The original data is qualitative, thus to determine an appropriate number of replicates to initially
perform, sample sizes based on a range of potential variance was determined.
. See Power Calculations section for details.
Experiment has 2 cohorts:
. Cohort 1: Erlotinib-resistant PC9 DTPs + vehicle
. Cohort 2: Erlotinib-resistant PC9 DTPs + 1 mM AEW541 for 2 hr
Western blotting is performed for the following proteins:
. Phospho-IGF-1R (Y1165/1166)
. IGF-1R [additional control]
. ERK1/2
Materials and reagents
Reagent Type Manufacturer Catalog # Comments
PC9 DTP cells Human cell line n/a n/a Generated according toprotocol 2
RPMI 1640 (4.5 g/l glucose) Cell culture ATCC 30-2001 Original brand not specified.
Fetal bovine serum (FBS) Cell culture HyClone SH30910.03 Original brand not specified.
Penicillin-Streptomycin(5,000 U/ml)
Cell culture Life Technologies 15070-063 Not originally reported.
Phosphate bufferedsaline (PBS)
Buffer Life Technologies 14190 Original brand not specified.
AEW541 Inhibitor Cayman Chemical 13641 Replaces original obtainedfrom Novartis Pharmaceuticals
DMSO Chemical Sigma-Aldrich D8418 Not originally reported.
RIPA buffer Buffer Sigma-Aldrich R0278 From replicating lab protocol
Complete mini proteaseinhibitor cocktail tablets
Inhibitor Roche Diagnostics 11 836 153 001 From replicating lab protocol
Halt phosphataseinhibitor cocktail
Inhibitor Thermo Scientific 1862495 From replicating lab protocol
Phenylmethanesulfonylfluoride solution
Inhibitor Sigma-Aldrich 93482
NuPAGE LDS samplebuffer (4X)
Western blot reagent Life Technologies NP0007 Replaces Laemmli samplebuffer
Continued on next page
Haven et al. eLife 2016;5:e09462. DOI: 10.7554/eLife.09462 21 of 38
Registered report Biochemistry
Continued
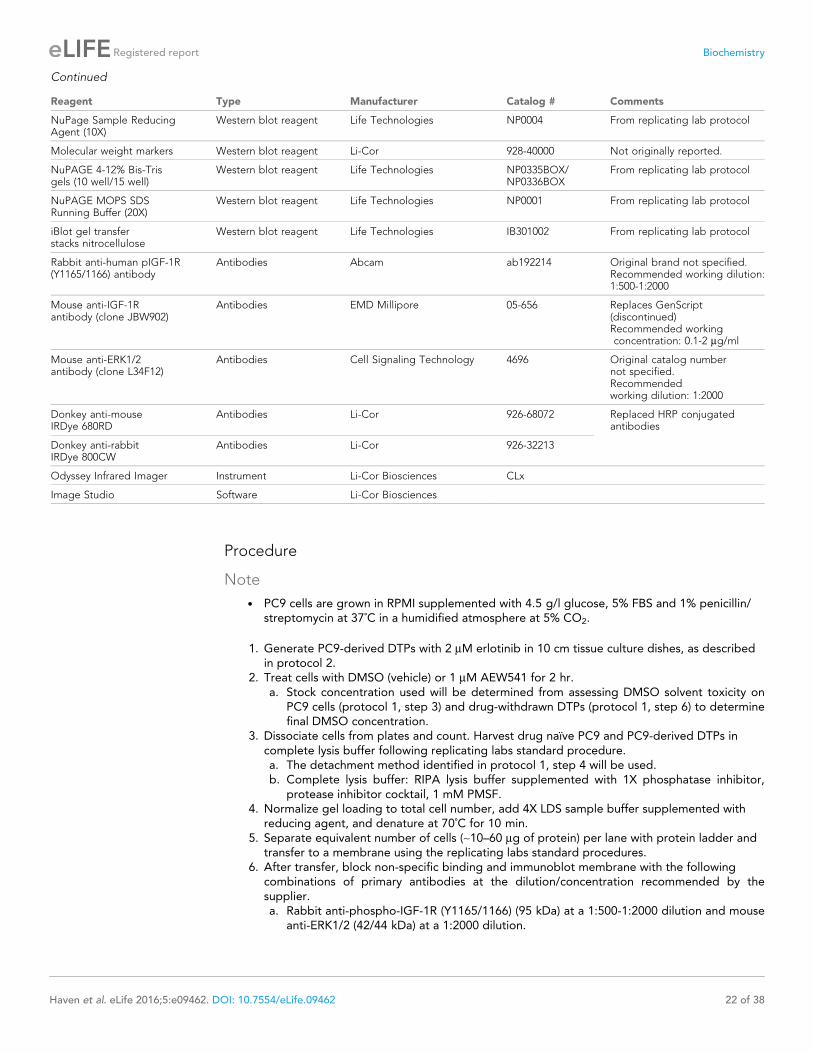
Reagent Type Manufacturer Catalog # Comments
NuPage Sample ReducingAgent (10X)
Western blot reagent Life Technologies NP0004 From replicating lab protocol
Molecular weight markers Western blot reagent Li-Cor 928-40000 Not originally reported.
NuPAGE 4-12% Bis-Trisgels (10 well/15 well)
Western blot reagent Life Technologies NP0335BOX/NP0336BOX
From replicating lab protocol
NuPAGE MOPS SDSRunning Buffer (20X)
Western blot reagent Life Technologies NP0001 From replicating lab protocol
iBlot gel transferstacks nitrocellulose
Western blot reagent Life Technologies IB301002 From replicating lab protocol
Rabbit anti-human pIGF-1R(Y1165/1166) antibody
Antibodies Abcam ab192214 Original brand not specified.Recommended working dilution:1:500-1:2000
Mouse anti-IGF-1Rantibody (clone JBW902)
Antibodies EMD Millipore 05-656 Replaces GenScript(discontinued)Recommended workingconcentration: 0.1-2 mg/ml
Mouse anti-ERK1/2antibody (clone L34F12)
Antibodies Cell Signaling Technology 4696 Original catalog numbernot specified.Recommendedworking dilution: 1:2000
Donkey anti-mouseIRDye 680RD
Antibodies Li-Cor 926-68072 Replaced HRP conjugatedantibodies
Donkey anti-rabbitIRDye 800CW
Antibodies Li-Cor 926-32213
Odyssey Infrared Imager Instrument Li-Cor Biosciences CLx
Image Studio Software Li-Cor Biosciences
Procedure
Note
. PC9 cells are grown in RPMI supplemented with 4.5 g/l glucose, 5% FBS and 1% penicillin/streptomycin at 37˚C in a humidified atmosphere at 5% CO2.
1. Generate PC9-derived DTPs with 2 mM erlotinib in 10 cm tissue culture dishes, as describedin protocol 2.
2. Treat cells with DMSO (vehicle) or 1 mM AEW541 for 2 hr.a. Stock concentration used will be determined from assessing DMSO solvent toxicity on
PC9 cells (protocol 1, step 3) and drug-withdrawn DTPs (protocol 1, step 6) to determinefinal DMSO concentration.
3. Dissociate cells from plates and count. Harvest drug naı̈ve PC9 and PC9-derived DTPs incomplete lysis buffer following replicating labs standard procedure.a. The detachment method identified in protocol 1, step 4 will be used.b. Complete lysis buffer: RIPA lysis buffer supplemented with 1X phosphatase inhibitor,
protease inhibitor cocktail, 1 mM PMSF.4. Normalize gel loading to total cell number, add 4X LDS sample buffer supplemented with
reducing agent, and denature at 70˚C for 10 min.5. Separate equivalent number of cells (~10–60 mg of protein) per lane with protein ladder and
transfer to a membrane using the replicating labs standard procedures.6. After transfer, block non-specific binding and immunoblot membrane with the following
combinations of primary antibodies at the dilution/concentration recommended by thesupplier.a. Rabbit anti-phospho-IGF-1R (Y1165/1166) (95 kDa) at a 1:500-1:2000 dilution and mouse
anti-ERK1/2 (42/44 kDa) at a 1:2000 dilution.
Haven et al. eLife 2016;5:e09462. DOI: 10.7554/eLife.09462 22 of 38
Registered report Biochemistry

b. Rabbit anti-phospho-IGF-1R (Y1165/1166) (95 kDa) at a 1:500-1:2000 dilution and mouseanti-IGF-1R at 0.1-2 mg/ml.
Protocol 8 Western Blot Antibody Multiplexing
Protein of interest Loading Control
Combination Description Working Conc. Description Working Conc.
1 Rabbit phospho-IGF-1R(Y1165/1166) (95 kDa)
1:500-1:2000 Mouse anti-ERK1/2(42/44 kDa)
1:2000
2 Rabbit phospho-IGF-1R(Y1165/1166) (95 kDa)
1:500-1:2000 Mouse anti-IGF-1R(95 kDa)
0.1–2 mg/ml
7. Wash and apply appropriate secondary antibodies for 1 hr at RT with constant agitation anddetect signal using Odyssey imaging system.
8. Analyze bands with Image Studio software and normalize to loading controls.a. pIGF-1R (Y1165/1166) normalized to ERK1/2 (total)b. pIGF-1R (Y1165/1166) normalized to IGF-1R (total) [additional]
9. Repeat independently two additional times.
Deliverables& Data to be collected:
. Full scans of each Western blot with ladder. (Compare to Figure 7C)
. Raw data of band analysis and normalized bands for each sample.
Confirmatory analysis plan& Statistical Analysis of the Replication Data:
. Unpaired two-tailed t-test of pIGF-1R (Y1165/1166) levels normalized to ERK1/2 fromerlotinib-resistant PC9 DTPs treated with vehicle compared to AEW541.
& Meta-analysis of original and replication attempt effect sizes:. The replication data (mean and 95% confidence interval) will be plotted with the original
reported data value plotted as a single point on the same plot for comparison.& Additional exploratory analysis:
. pIGF-1R levels will also be normalized to IGF-1R (total) and the same analysis describedabove will be performed, which serves as an independent normalization control notincluded in the original report.
Known differences from the original studyAn additional control, total IGF-1R, was added to this replication attempt that was not originally
reported in Figure 7C to normalize the phosphorylated IGF-1R levels. The original loading control
of ERK1/2 will also be utilized to allow for a direct comparison. This replication attempt will pre-
pare cells in RIPA lysis buffer, while it is unclear if the original study used a lysis buffer or lysed
cells directly in Laemmli sample buffer. All known differences are listed in the materials and
reagents section above with the originally used item listed in the comments section. All differences
have the same capabilities as the original and are not expected to alter the experimental design.
Provisions for quality controlAll of the raw data will be uploaded to the project page on the OSF (https://osf.io/xbign) and made
publically available.
Haven et al. eLife 2016;5:e09462. DOI: 10.7554/eLife.09462 23 of 38
Registered report Biochemistry

Protocol 9: Western blot for dimethylated H3K4 following IGF-1RinhibitionThis protocol utilizes Western blotting to compare the levels of the histone demethylase KDM5A in
PC9-derived DTPs in the presence or absence of the IGF-1R inhibitor AEW541. ERK1/2 protein is
included as a loading control. It is a replication of Figure 7I.
SamplingThis experiment will be repeated a total of 3 times.
The original data is qualitative, thus to determine an appropriate number of replicates to initially
perform, sample sizes based on a range of potential variance was determined.
. See Power Calculations section for details.
Experiment has 2 conditions:
. Cohort 1: Erlotinib-resistant PC9 DTPs + vehicle
. Cohort 2: Erlotinib-resistant PC9 DTPs + 1 mM AEW541 for 24 hr
Western blotting is performed for the following proteins:
. KDM5A
. ERK1/2
Materials and reagents
Reagent Type Manufacturer Catalog # Comments
PC9 DTP cells Human cell line n/a n/a Generated according toprotocol 2
RPMI 1640(4.5 g/l glucose)
Cell culture ATCC 30-2001 Original brandnot specified.
Fetal bovine serum(FBS)
Cell culture HyClone SH30910.03 Original brandnot specified.
Penicillin-Streptomycin(5,000 U/ml)
Cell culture Life Technologies 15070-063 Not originally reported.
Phosphate buffered saline(PBS)
Buffer Life Technologies 14190 Original brandnot specified.
AEW541 Inhibitor Cayman Chemical 13641 Replaces original obtainedfrom Novartis Pharmaceuticals
DMSO Chemical Sigma-Aldrich D8418 Not originally reported.
RIPA buffer Buffer Sigma-Aldrich R0278 From replicatinglab protocol
Complete mini proteaseinhibitor cocktail tablets
Inhibitor Roche Diagnostics 11 836 153 001 From replicatinglab protocol
Halt phosphataseinhibitor cocktail
Inhibitor Thermo Scientific 1862495 From replicatinglab protocol
Phenylmethanesulfonylfluoride solution
Inhibitor Sigma-Aldrich 93482
NuPAGE LDS samplebuffer (4X)
Western blot reagent Life Technologies NP0007 Replaces Laemmli sample buffer
NuPage Sample ReducingAgent (10X)
Western blot reagent Life Technologies NP0004 From replicatinglab protocol
Molecular weight markers Western blot reagent Li-Cor 928-40000 Not originally reported.
NuPAGE 4-12% Bis-Trisgels (10 well/15 well)
Western blot reagent Life Technologies NP0335BOX/NP0336BOX
From replicatinglab protocol
Continued on next page
Haven et al. eLife 2016;5:e09462. DOI: 10.7554/eLife.09462 24 of 38
Registered report Biochemistry

Continued
Reagent Type Manufacturer Catalog # Comments
NuPAGE MOPS SDSRunning Buffer (20X)
Western blot reagent Life Technologies NP0001 From replicatinglab protocol
iBlot gel transferstacks nitrocellulose
Western blot reagent Life Technologies IB301002 From replicatinglab protocol
Rabbit anti-KDM5Aantibody
Antibodies Bethyl Laboratories A300-897A Original catalog numbernot specified.
Mouse anti-ERK1/2antibody (clone L34F12)
Antibodies Cell Signaling Technology 4696 Original catalog numbernot specified.Recommended workingdilution: 1:2000
Donkey anti-mouseIRDye 680RD
Antibodies Li-Cor 926-68072 Replaced HRP conjugatedantibodies
Donkey anti-rabbitIRDye 800CW
Antibodies Li-Cor 926-32213
Odyssey InfraredImager
Instrument Li-Cor Biosciences CLx
Image Studio Software Li-Cor Biosciences
Procedure
Note
. PC9 cells are grown in RPMI supplemented with 4.5 g/l glucose, 5% FBS and 1% penicillin/streptomycin at 37˚C in a humidified atmosphere at 5% CO2.
1. Generate PC9-derived DTPs with 2 mM erlotinib in 10 cm tissue culture dishes, as describedin protocol 2.
2. Treat cells with DMSO (vehicle) or 1 mM AEW541 for 24 hr.a. Stock concentration used will be determined from assessing DMSO solvent toxicity on
PC9 cells (protocol 1, step 3) and drug-withdrawn DTPs (protocol 1, step 6) to determinefinal DMSO concentration.
3. Dissociate cells from plates and count. Harvest drug naı̈ve PC9 and PC9-derived DTPs incomplete lysis buffer following replicating labs standard procedure.a. The detachment method identified in protocol 1, step 4 will be used.b. Complete lysis buffer: RIPA lysis buffer supplemented with 1X phosphatase inhibitor,
protease inhibitor cocktail, 1 mM PMSF.4. Normalize gel loading to total cell number, add 4X LDS sample buffer supplemented with
reducing agent, and denature at 70˚C for 10 min.5. Separate equivalent number of cells (~10–60 mg of protein) per lane with protein ladder and
transfer to a membrane using the replicating labs standard procedures.6. After transfer, block non-specific binding and immunoblot membrane with the following
combinations of primary antibodies at the dilution/concentration recommended by thesupplier.a. Rabbit anti-KDM5A (200 kDa) at a 1:2000 to 1:10,000 dilution and mouse anti-ERK1/2
(42/44 kDa) at a 1:2000 dilution.
Protocol 9 Western Blot Antibody Multiplexing
Protein of interest Loading Control
Combination Description Working Conc. Description Working Conc.
1 Rabbit anti-KDM5A(200 kDa)
1:2000 to 1:10,000 Mouse anti-ERK1/2(42/44 kDa)
1:1000
7. Wash and apply appropriate secondary antibodies for 1 hr at RT with constant agitation anddetect signal using Odyssey imaging system.
Haven et al. eLife 2016;5:e09462. DOI: 10.7554/eLife.09462 25 of 38
Registered report Biochemistry

8. Analyze bands with Image Studio software and normalize to loading controls.a. KDM5A normalized to ERK1/2 (total)
9. Repeat independently two additional times.
Deliverables& Data to be collected:
. Full scans of each Western blot with ladder. (Compare to Figure 7I)
. Raw data of band analysis and normalized bands for each sample.
Confirmatory analysis plan& Statistical Analysis of the Replication Data:
. Unpaired two-tailed t-test of normalized KDM5A levels from erlotinib-resistant PC9 DTPstreated with vehicle compared to AEW541.
& Meta-analysis of original and replication attempt effect sizes:. The replication data (mean and 95% confidence interval) will be plotted with the original
reported data value plotted as a single point on the same plot for comparison.
Known differences from the original studyThis replication attempt will prepare cells in RIPA lysis buffer, while it is unclear if the original study
used a lysis buffer or lysed cells directly in Laemmli sample buffer. All known differences are listed in
the materials and reagents section above with the originally used item listed in the comments sec-
tion. All differences have the same capabilities as the original and are not expected to alter the
experimental design.
Provisions for quality controlAll of the raw data will be uploaded to the project page on the OSF (https://osf.io/xbign) and made
publically available.
Power CalculationsFor additional details on power calculations, please see analysis scripts and associated files on the
Open Science Framework:
https://osf.io/q9bxy/
Protocol 1Not applicable
Protocol 2Not applicable
Protocol 3The original data (Figure 2E) reported no difference between the absolute IC50 values (50% cell kill-
ing). Thus this is a sensitivity calculation to determine the detectable effect size with the planned
sample size.
Test family& Two-tailed t test, difference between two independent means, alpha error = 0.05
Power Calculations& Performed with G*Power software, version 3.1.7 (Faul et al., 2007).
Haven et al. eLife 2016;5:e09462. DOI: 10.7554/eLife.09462 26 of 38
Registered report Biochemistry

Group 1 Group 2
Detectable effectsize d (basedon sample size) A priori power
Group 1sample size
Group 2sample size
Drug-naı̈vePC9 cells
PC9 DTPs culturedin drug-free medium
2.38075 80.0% 41 41
1 The sample size is the same as originally reported.
Protocol 4The original data presented is qualitative (images of Western blots). We used Image Studio Lite v.
4.0.21 (LI-COR) to perform densitometric analysis of the presented bands to quantify the original
effect size where possible. The data presented in Figures 1E, upper right panel, and Figure 2B were
unable to be quantified for all bands and are thus considered exploratory in nature. Due to the lack
of raw original data, and inability to quantify some of the Western blots, we are unable to perform
power calculations for all comparisons. However, because the same samples will be used to detect
each protein of interest (3 total), the alpha error will be adjusted to account for multiple
comparisons.
Summary of original data quantified from the image reported in Figure 4A, upper panel:
CellsNormalized H3K14Acsignal (normalized to GAPDH)
Drug-naı̈ve PC9 cells 0.7245
PC9 DTPs 0.1674
The original data does not indicate the error associated with multiple biological replicates. To
identify a suitable sample size, power calculations were performed using different levels of rela-
tive variance using the values quantified from the reported image as the mean. At each level of
variance the effect size was estimated and used to calculate the needed sample size to achieve
at least 80% power with the indicated alpha error. The achieved power is reported.
H3K14Ac normalized signal:
Test family& Two-tailed t test, difference between two independent means, Bonferroni’s correction,
alpha error = 0.01667
Power calculations& Performed with G*Power software, version 3.1.7 (Faul et al., 2007).
2% variance:
Group 1 Group 2 Effect size d A priori powerGroup 1sample size
Group 2sample size
Drug-naı̈vePC9 cells
PC9 DTPs 52.97365 99.9% 2 2
15% variance:
Group 1 Group 2 Effect size d A priori powerGroup 1sample size
Group 2sample size
Drug-naı̈ve PC9 cells PC9 DTPs 7.06315 99.7% 3 3
Haven et al. eLife 2016;5:e09462. DOI: 10.7554/eLife.09462 27 of 38
Registered report Biochemistry

28% variance:
Group 1 Group 2 Effect size d A priori powerGroup 1sample size
Group 2sample size
Drug-naı̈ve PC9 cells PC9 DTPs 3.78383 94.4% 4 4
40% variance:
Group 1 Group 2 Effect size d A priori powerGroup 1sample size
Group 2sample size
Drug-naı̈ve PC9 cells PC9 DTPs 2.64868 84.5% 5 5
CD133 and pEGFR (Y1068) normalized signals:
Test family& Two-tailed t test, difference between two independent means, Bonferroni’s correction,
alpha error = 0.01667
Power calculations& Performed with G*Power software, version 3.1.7 (Faul et al., 2007).
Group 1 Group 2
Detectableeffect size d(based on sample size)
A prioripower
Group 1sample size
Group 2sample size
Drug-naı̈ve PC9 cells PC9 DTPs 3.037631 80.0%1 42 42
1 A sensitivity calculation was performed since the original data presented in Figures 1E, upper right panel, and
Figure 2B were unable to be quantified for all bands. This is the effect size that can be detected with 80% power
and the indicated sample size.2 The sample size is the number of replicates initially performed based on the H3K14Ac analysis.
In order to produce quantitative replication data, we will run the experiment four times. Each
time we will quantify band intensity. We will determine the standard deviation of band intensity
across the biological replicates and combine this with the reported value from the original study
to simulate the original effect size. We will use this simulated effect size to determine the num-
ber of replicates necessary to reach a power of at least 80%. We will then perform additional
replicates, if required, to ensure that the experiment has more than 80% power to detect the
original effect.
Protocol 5
Cell cycle analysisSummary of original data estimated from graph reported in Figure 1B, lower panel:
CellsCell cyclephase
Mean %of cells Stdev N
Haven et al. eLife 2016;5:e09462. DOI: 10.7554/eLife.09462 28 of 38
Registered report Biochemistry

Drug-naı̈ve PC9 cells G1 39 5 2
S 45 3 2
G2/M 12 2 2
PC9 DTPs G1 73 4 2
S 7 4 2
G2/M 3 1 2
Test family& Proportions: Cochran-Mantel-Haenszel test: alpha error = 0.05.
Power calculations& Performed with R software, version 3.1.2 (Team, 2014).
Group 1 Group 2Number ofsimulations A priori power
Group 1sample size
Group 2sample size
Drug-naı̈ve PC9 cells PC9 DTPs 10,0001 99.9% 22 22
1 The estimated data was used to create simulated data sets with preserved sampling structure assuming a normal
distribution. For a given n (the number of replicates) 10,000 simulations were run and Mantel-Haenszel chi-squared
value was calculated for each simulated data set. The power was then calculated by counting the number of times
p�0.05 and dividing by 10,000.2 A sample size of 3 per group will be used based on the percent of sub-G1 cells analysis.
Sub-G1 analysisSummary of original data estimated from graph reported in Figure 4B, upper panel:
CellsTSAconcentration
Mean % ofsub-G1 cells Stdev N
Drug-naı̈ve PC9 cells 0 nM 1.5 0.2 3
50 nM 2 0.8 3
100 nM 2.6 0.6 3
PC9 DTPs 0 nM 5.4 0.2 3
50 nM 17.5 1.5 3
100 nM 23.5 2 3
Test family& ANOVA: Fixed effects, special, main effects and interactions: alpha error = 0.05.
Power calculations& Performed with G*Power software, version 3.1.7 (Faul et al., 2007).& ANOVA F test statistic and partial h2performed with R software, version 3.1.2
(Team, 2014).
Haven et al. eLife 2016;5:e09462. DOI: 10.7554/eLife.09462 29 of 38
Registered report Biochemistry

Groups F test statistic Partial h2 Effect size fA prioripower
Totalsample size
Drug-naı̈ve PC9 cells and PC9DTPs left untreatedor treated withTSA (50 nM or 100 nM)
F(2,12) = 9.3683(interaction)
0.60959 1.24956 84.7%1 121
(6 groups)
1 18 total samples (3 per group) will be used based on the planned comparisons making the power 99.0%.
Test family& Two-tailed t test, difference between two independent means, Bonferorni’s correction:
alpha error = 0.0125
Power calculations& Performed with G*Power software, version 3.1.7 (Faul et al., 2007).
Group 1 Group 2 Effect size d A priori powerGroup 1sample size
Group 2sample size
Untreated drug-naı̈vePC9 cells
50 nM TSA treateddrug-naı̈ve PC9 cells
0.857491 80.0%1 3 3
Untreated drug-naı̈vePC9 cells
100 nM TSA treateddrug-naı̈ve PC9 cells
2.459671 80.0%1 3 3
Untreated PC9 DTPs 50 nM TSA treatedPC9 DTPs
11.30792 99.9% 3 3
Untreated PC9 DTPs 100 nM TSA treatedPC9 DTPs
12.73512 86.8%2 22 22
1 A sensitivity calculation was performed since the original data showed a non-significant effect. This is the effect
size that can be detected with 80% power and the indicated sample size.2 3 samples per group will be used based on the vehicle vs 50 nM TSA treated PC9 DTP comparison making the
power 99.9%.
Protocol 6Summary of original data estimated from graph reported in Figure 5B:
Dataset being analyzed Mean SD N
Erlotinib 525 8 3
Erlotinib + TSA 0 0 3
Erlotinib + AEW541 10 1 3
Test family& Two-tailed t test: Means: Wilcoxon-Mann-Whitney, Bonferorni’s correction: alpha error =
0.025
Haven et al. eLife 2016;5:e09462. DOI: 10.7554/eLife.09462 30 of 38
Registered report Biochemistry

Power calculations& Performed with G*Power software, version 3.1.7. (Faul et al., 2007)
Group 1 Group 2 Effect size d A priori powerGroup 1sample size
Group 2sample size
Erlotinib Erlotinib + TSA 92.80777 99.9% 21 21
Erlotinib Erlotinib + AEW541 90.33698 99.9% 21 21
1 A sample size of 3 per group will be used as a minimum sample size.
Protocol 7The original data presented is qualitative (images of Western blots). We used Image Studio Lite v.
4.0.21 (LI-COR) to perform densitometric analysis of the presented bands to quantify the original
effect size where possible.
Summary of original data quantified from the image reported in Figure 7A:
CellsNormalized pIFG-1R signal(normalized to IGF-1R (total))
Normalized IGFBP3 signal(normalized to IGF-1R (total))
Drug-naı̈ve PC9 cells 0.1065 0.4276
PC9 DTPs 2.3508 2.5992
The original data does not indicate the error associated with multiple biological replicates. To
identify a suitable sample size, power calculations were performed using different levels of relative
variance using the values quantified from the reported image as the mean. At each level of variance
the effect size was estimated and used to calculate the needed sample size to achieve at least 80%
power with the indicated alpha error. The achieved power is reported.
Test family& Due to the lack of raw original data we are unable to perform power calculations using a
MANOVA. We are determining sample size using a two-way ANOVA.& ANOVA, Fixed effects, special, main effects and interactions, alpha error = 0.05
Power calculations& Performed with G*Power software, version 3.1.7 (Faul et al., 2007).& ANOVA F test statistic and partial h2performed with R software, version 3.1.2
(Team, 2014).
2% variance:
Groups F test statistic Partial h2 Effect size f A priori power Total sample size
Drug-naı̈ve PC9 cellsand PC9 DTPs
F(1,8) = 11722(main effect, cell type)
0.99932 38.2789 99.9% 8(4 groups)
15% variance:
Groups F test statistic Partial h2 Effect size f A priori power Total sample size
Drug-naı̈ve PC9 cellsand PC9 DTPs
F(1,8) = 208.39(main effect, cell type)
0.96303 5.10382 99.9% 12(4 groups)
Haven et al. eLife 2016;5:e09462. DOI: 10.7554/eLife.09462 31 of 38
Registered report Biochemistry

28% variance:
Groups F test statistic Partial h2 Effect size f A priori power Total sample size
Drug-naı̈ve PC9 cellsand PC9 DTPs
F(1,8) = 59.8066(main effect, cell type)
0.88202 2.73419 99.9% 12(4 groups)
40% variance:
Groups F test statistic Partial h2 Effect size f A priori power Total sample size
Drug-naı̈ve PC9 cellsand PC9 DTPs
F(1,8) = 29.3052(main effect, cell type)
0.78555 1.91394 99.9% 16(4 groups)
pIFG-1R normalized signal
Test family& Two-tailed t test, difference between two independent means, Bonferroni’s correction,
alpha error = 0.025
Power calculations& Performed with G*Power software, version 3.1.7 (Faul et al., 2007).
2% variance:
Group 1 Group 2 Effect size d A priori powerGroup 1sample size
Group 2sample size
Drug-naı̈ve PC9 cells PC9 DTPs 67.43731 99.9% 2 2
15% variance:
Group 1 Group 2 Effect size d A priori powerGroup 1sample size
Group 2sample size
Drug-naı̈ve PC9 cells PC9 DTPs 8.99164 86.8% 2 2
28% variance:
Group 1 Group 2 Effect size d A priori powerGroup 1sample size
Group 2sample size
Drug-naı̈ve PC9 cells PC9 DTPs 4.81695 94.8% 3 3
40% variance:
Group 1 Group 2 Effect size d A priori powerGroup 1sample size
Group 2sample size
Drug-naı̈ve PC9 cells PC9 DTPs 3.37187 92.7% 4 4
Haven et al. eLife 2016;5:e09462. DOI: 10.7554/eLife.09462 32 of 38
Registered report Biochemistry

IGFBP3 normalized signal
Test family& Two-tailed t test, difference between two independent means, Bonferroni’s correction,
alpha error = 0.025
Power calculations& Performed with G*Power software, version 3.1.7 (Faul et al., 2007).
2% variance:
Group 1 Group 2 Effect size d A priori powerGroup 1sample size
Group 2sample size
Drug-naı̈ve PC9 cells PC9 DTPs 58.29364 99.9% 2 2
15% variance:
Group 1 Group 2 Effect size d A priori powerGroup 1sample size
Group 2sample size
Drug-naı̈ve PC9 cells PC9 DTPs 7.77249 99.9% 3 3
28% variance:
Group 1 Group 2 Effect size d A priori powerGroup 1sample size
Group 2sample size
Drug-naı̈ve PC9 cells PC9 DTPs 4.16383 87.6% 3 3
Group 1 Group 2 Effect size d A priori powerGroup 1sample size
Group 2sample size
Drug-naı̈ve PC9 cells PC9 DTPs 2.91468 83.6% 4 4
In order to produce quantitative replication data, we will run the experiment three times. Each
time we will quantify band intensity. We will determine the standard deviation of band intensity
across the biological replicates and combine this with the reported value from the original study to
simulate the original effect size. We will use this simulated effect size to determine the number of
replicates necessary to reach a power of at least 80%. We will then perform additional replicates, if
required, to ensure that the experiment has more than 80% power to detect the original effect.
Protocol 8The original data presented is qualitative (images of Western blots). We used Image Studio Lite v.
4.0.21 (LI-COR) to perform densitometric analysis of the presented bands to quantify the original
effect size where possible.
Summary of original data quantified from the image reported in Figure 7C:
Cells/Treatment Normalized pIFG-1R signal (normalized to ERK1/2 (total))
Vehicle treated PC9 DTPs 1.0701
Haven et al. eLife 2016;5:e09462. DOI: 10.7554/eLife.09462 33 of 38
Registered report Biochemistry

AEW541 treated PC9 DTPs 0.0906
The original data does not indicate the error associated with multiple biological replicates. To
identify a suitable sample size, power calculations were performed using different levels of relative
variance using the values quantified from the reported image as the mean. At each level of variance
the effect size was estimated and used to calculate the needed sample size to achieve at least 80%
power with the indicated alpha error. The achieved power is reported.
pIFG-1R normalized signal
Test family& Two-tailed t test, difference between two independent means,, alpha error = 0.05
Power calculations& Performed with G*Power software, version 3.1.7 (Faul et al., 2007).
2% variance:
Group 1 Group 2 Effect size d A priori powerGroup 1sample size
Group 2sample size
Vehicle treatedPC9 DTPs
AEW541 treatedPC9 DTPs
64.49516 99.9% 2 2
15% variance:
Group 1 Group 2 Effect size d A priori powerGroup 1sample size
Group 2sample size
Vehicle treatedPC9 DTPs
AEW541 treatedPC9 DTPs
8.59935 97.4% 2 2
28% variance:
Group 1 Group 2 Effect size d A priori powerGroup 1sample size
Group 2sample size
Vehicle treatedPC9 DTPs
AEW541 treatedPC9 DTPs
4.60680 98.3% 3 3
40% variance:
Group 1 Group 2 Effect size d A priori powerGroup 1sample size
Group 2sample size
Vehicle treatedPC9 DTPs
AEW541 treatedPC9 DTPs
3.22476 83.5% 3 3
In order to produce quantitative replication data, we will run the experiment three times.
Each time we will quantify band intensity. We will determine the standard deviation of band
intensity across the biological replicates and combine this with the reported value from the orig-
inal study to simulate the original effect size. We will use this simulated effect size to determine
the number of replicates necessary to reach a power of at least 80%. We will then perform
Haven et al. eLife 2016;5:e09462. DOI: 10.7554/eLife.09462 34 of 38
Registered report Biochemistry

additional replicates, if required, to ensure that the experiment has more than 80% power to
detect the original effect.
Protocol 9The original data presented is qualitative (images of Western blots). We used Image Studio Lite v.
4.0.21 (LI-COR) to perform densitometric analysis of the presented bands to quantify the original
effect size where possible.
Summary of original data quantified from the image reported in Figure 7I:
Cells/TreatmentNormalized KDM5A signal(normalized to ERK1/2 (total))
Vehicle treated PC9 DTPs 0.5432
AEW541 treated PC9 DTPs 0.0314
The original data does not indicate the error associated with multiple biological replicates. To
identify a suitable sample size, power calculations were performed using different levels of relative
variance using the values quantified from the reported image as the mean. At each level of variance
the effect size was estimated and used to calculate the needed sample size to achieve at least 80%
power with the indicated alpha error. The achieved power is reported.
KDM5A normalized signal
Test family& Two-tailed t test, difference between two independent means, alpha error = 0.05
Power calculations& Performed with G*Power software, version 3.1.7 (Faul et al., 2007).
2% variance:
Group 1 Group 2 Effect size d A priori powerGroup 1sample size
Group 2sample size
Vehicle treatedPC9 DTPs
AEW541 treatedPC9 DTPs
66.51393 99.9% 2 2
15% variance:
Group 1 Group 2 Effect size d A priori powerGroup 1sample size
Group 2sample size
Vehicle treatedPC9 DTPs
AEW541 treatedPC9 DTPs
8.86852 97.9% 2 2
28% variance:
Group 1 Group 2 Effect size d A priori powerGroup 1sample size
Group 2sample size
Vehicle treatedPC9 DTPs
AEW541 treatedPC9 DTPs
4.75099 98.8% 3 3
Haven et al. eLife 2016;5:e09462. DOI: 10.7554/eLife.09462 35 of 38
Registered report Biochemistry

40% variance:
Group 1 Group 2 Effect size d A priori powerGroup 1sample size
Group 2sample size
Vehicle treatedPC9 DTPs
AEW541 treatedPC9 DTPs
3.32570 85.5% 3 3
In order to produce quantitative replication data, we will run the experiment three times. Each
time we will quantify band intensity. We will determine the standard deviation of band intensity
across the biological replicates and combine this with the reported value from the original study to
simulate the original effect size. We will use this simulated effect size to determine the number of
replicates necessary to reach a power of at least 80%. We will then perform additional replicates, if
required, to ensure that the experiment has more than 80% power to detect the original effect.
AcknowledgementsThe Reproducibility Project: Cancer Biology core team would like to thank the original authors, in
particular Jeffrey Settleman, for generously sharing critical information to ensure the fidelity and
quality of this replication attempt. We thank Courtney Soderberg at the Center for Open Science for
assistance with statistical analyses. We would also like to thank the following companies for gener-
ously donating reagents to the Reproducibility Project: Cancer Biology; American Type Culture Col-
lection (ATCC), Applied Biological Materials, BioLegend, Charles River Laboratories, Corning
Incorporated, DDC Medical, EMD Millipore, Harlan Laboratories, LI-COR Biosciences, Mirus Bio,
Novus Biologicals, Sigma-Aldrich, and System Biosciences (SBI).
Additional information
Group author details
Reproducibility Project: Cancer Biology
Elizabeth Iorns: Science Exchange, Palo Alto, United States; William Gunn: Mendeley, London,
United Kingdom; Fraser Tan: Science Exchange, Palo Alto, United States; Joelle Lomax: Science
Exchange, Palo Alto, United States; Nicole Perfito: Science Exchange, Palo Alto, United States;
Timothy Errington: Center for Open Science, Charlottesville, United States
Competing interestsBH, EH, CD, MS: This is a Science Exchange associated laboratory. RP:CB: We disclose that EI, FT,
JL, NP are employed by and hold shares in Science Exchange Inc. The other authors declare that no
competing interests exist.
Funding
Funder Author
Laura and John ArnoldFoundation
Reproducibility Project: CancerBiology
The Reproducibility Project: Cancer Biology is funded by the Laura and JohanArnold Foundation, provided to the Center for Open Science in collaboration withScience Exchange. The funder had no role in study design or the decision to submitthe work for publication.
Author contributions
BH, EH, CD, MS, NV, KO, Drafting or revising the article; RP:CB, Conception and design, Drafting or
revising the article
Haven et al. eLife 2016;5:e09462. DOI: 10.7554/eLife.09462 36 of 38
Registered report Biochemistry

ReferencesAllemani C, Weir HK, Carreira H, Harewood R, Spika D, Wang X-S, Bannon F, Ahn JV, Johnson CJ, BonaventureA, Marcos-Gragera R, Stiller C, Azevedo e Silva G, Chen W-Q, Ogunbiyi OJ, Rachet B, Soeberg MJ, You H,Matsuda T, Bielska-Lasota M, Storm H, Tucker TC, Coleman MP. 2015. Global surveillance of cancer survival1995–2009: analysis of individual data for 25 676 887 patients from 279 population-based registries in 67countries (CONCORD-2). The Lancet 385:977–1010. doi: 10.1016/S0140-6736(14)62038-9
Bolden JE, Peart MJ, Johnstone RW. 2006. Anticancer activities of histone deacetylase inhibitors. Nature ReviewsDrug Discovery 5:769–784. doi: 10.1038/nrd2133
Chen M-C, Chen C-H, Wang J-C, Tsai A-C, Liou J-P, Pan S-L, Teng C-M. 2013. The HDAC inhibitor, MPT0E028,enhances erlotinib-induced cell death in EGFR-TKI-resistant NSCLC cells. Cell Death and Disease 4:e810 doi:10.1038/cddis.2013.330
Engelman JA, Janne PA. 2008. Mechanisms of acquired resistance to epidermal growth factor receptor tyrosinekinase inhibitors in non-small cell lung cancer. Clinical Cancer Research 14:2895–2899. doi: 10.1158/1078-0432.CCR-07-2248
Engelman JA, Settleman J. 2008. Acquired resistance to tyrosine kinase inhibitors during cancer therapy. CurrentOpinion in Genetics & Development 18:73–79. doi: 10.1016/j.gde.2008.01.004
Errington TM, Iorns E, Gunn W, Tan FE, Lomax J, Nosek BA. 2014. An open investigation of the reproducibilityof cancer biology research. eLife 3 doi: 10.7554/eLife.04333
Faul F, Erdfelder E, Lang A-G, Buchner A. 2007. G*power 3: a flexible statistical power analysis program for thesocial, behavioral, and biomedical sciences. Behavior Research Methods 39:175–191. doi: 10.3758/BF03193146
Greaves M, Maley CC. 2012. Clonal evolution in cancer. Nature 481:306–313. doi: 10.1038/nature10762Herman JG, Baylin SB. 2003. Gene silencing in cancer in association with promoter hypermethylation. NewEngland Journal of Medicine 349:2042–2054. doi: 10.1056/NEJMra023075
Kartal-Yandim M, Adan-Gokbulut A, Baran Y. 2015. Molecular mechanisms of drug resistance and its reversal incancer. Critical Reviews in Biotechnology:1–11. doi: 10.3109/07388551.2015.1015957
Krishnamurty R, Maly DJ. 2010. Biochemical mechanisms of resistance to small-molecule protein kinaseinhibitors. ACS Chemical Biology 5:121–138. doi: 10.1021/cb9002656
Kurtze I, Sonnemann J, Beck JF. 2011. KRAS-mutated non-small cell lung cancer cells are responsive to eitherco-treatment with erlotinib or gefitinib and histone deacetylase inhibitors or single treatment with lapatinib.Oncology Reports 25:1021–1029. doi: 10.3892/or.2011.1160
Little AG, Gay EG, Gaspar LE, Stewart AK. 2007. National survey of non-small cell lung cancer in the unitedstates: epidemiology, pathology and patterns of care. Lung Cancer 57:253–260. doi: 10.1016/j.lungcan.2007.03.012
Lynch TJ, Bell DW, Sordella R, Gurubhagavatula S, Okimoto RA, Brannigan BW, Harris PL, Haserlat SM, SupkoJG, Haluska FG, Louis DN, Christiani DC, Settleman J, Haber DA. 2004. Activating mutations in the epidermalgrowth factor receptor underlying responsiveness of non–small-cell lung cancer to gefitinib. New EnglandJournal of Medicine 350:2129–2139. doi: 10.1056/NEJMoa040938
Maemondo M, Inoue A, Kobayashi K, Sugawara S, Oizumi S, Isobe H, Gemma A, Harada M, Yoshizawa H,Kinoshita I, Fujita Y, Okinaga S, Hirano H, Yoshimori K, Harada T, Ogura T, Ando M, Miyazawa H, Tanaka T,Saijo Y, Hagiwara K, Morita S, Nukiwa T. 2010. Gefitinib or chemotherapy for non–small-cell lung cancer withmutated EGFR. New England Journal of Medicine 362:2380–2388. doi: 10.1056/NEJMoa0909530
Majem M, Remon J. 2013. Tumor heterogeneity: evolution through space and time in EGFR mutant non smallcell lung cancer patients. Translational Lung Cancer Research 2:226–237. doi: 10.3978/j.issn.2218-6751.2013.03.09
Murakami A, Takahashi F, Nurwidya F, Kobayashi I, Minakata K, Hashimoto M, Nara T, Kato M, Tajima K,Shimada N, Iwakami Shin-ichiro, Moriyama M, Moriyama H, Koizumi F, Takahashi K, Filleur S. 2014. Hypoxiaincreases gefitinib-resistant lung cancer stem cells through the activation of insulin-like growth factor 1receptor. PLoS One 9:e86459 doi: 10.1371/journal.pone.0086459
Nakagawa T, Takeuchi S, Yamada T, Ebi H, Sano T, Nanjo S, Ishikawa D, Sato M, Hasegawa Y, Sekido Y, Yano S.2013. EGFR-TKI resistance due to BIM polymorphism can be circumvented in combination with HDACinhibition. Cancer Research 73:2428–2434. doi: 10.1158/0008-5472.CAN-12-3479
Paez JG. 2004. EGFR mutations in lung cancer: correlation with clinical response to gefitinib therapy. Science304:1497–1500. doi: 10.1126/science.1099314
Pao W, Miller VA, Kris MG. 2004. ‘targeting’ the epidermal growth factor receptor tyrosine kinase with gefitinib(Iressa) in non-small cell lung cancer (nSCLC). Seminars in Cancer Biology 14:33–40. doi: 10.1016/j.semcancer.2003.11.005
Rosell R, Molina MA, Serrano MJ. 2012. EGFR mutations in circulating tumour DNA. The Lancet Oncology 13:971–973. doi: 10.1016/S1470-2045(12)70369-8
Sequist LV, Martins RG, Spigel D, Grunberg SM, Spira A, Janne PA, Joshi VA, McCollum D, Evans TL,Muzikansky A, Kuhlmann GL, Han M, Goldberg JS, Settleman J, Iafrate AJ, Engelman JA, Haber DA, JohnsonBE, Lynch TJ. 2008. First-line gefitinib in patients with advanced non-small-cell lung cancer harboring somaticEGFR mutations. Journal of Clinical Oncology 26:2442–2449. doi: 10.1200/JCO.2007.14.8494
Sharma SV, Bell DW, Settleman J, Haber DA. 2007. Epidermal growth factor receptor mutations in lung cancer.Nature Reviews Cancer 7:169–181. doi: 10.1038/nrc2088
Haven et al. eLife 2016;5:e09462. DOI: 10.7554/eLife.09462 37 of 38
Registered report Biochemistry

Shtivelman E, Hensing T, Simon GR, Dennis PA, Otterson GA, Bueno R, Salgia R. 2014. Molecular pathways andtherapeutic targets in lung cancer. Oncotarget 5:1392–1433. doi: 10.18632/oncotarget.1891
Stella GM, Luisetti M, Inghilleri S, Cemmi F, Scabini R, Zorzetto M, Pozzi E. 2012. Targeting EGFR in non-small-cell lung cancer: lessons, experiences, strategies. Respiratory Medicine 106:173–183. doi: 10.1016/j.rmed.2011.10.015
Stewart EL, Tan SZ, Liu G, Tsao MS. 2015. Known and putative mechanisms of resistance to EGFR targetedtherapies in NSCLC patients with EGFR mutations-a review. Translational Lung Cancer Research 4:67–81. doi:10.3978/j.issn.2218-6751.2014.11.06
Swanton C. 2012. Intratumor heterogeneity: evolution through space and time. Cancer Research 72:4875–4882.doi: 10.1158/0008-5472.CAN-12-2217
Team RC. 2014. R: A language and environment for statistical computing. R Foundation for StatisticalComputing. http://www.R-project.org/.
Ware KE, Hinz TK, Kleczko E, Singleton KR, Marek LA, Helfrich BA, Cummings CT, Graham DK, Astling D, Tan A-C, Heasley LE. 2013. A mechanism of resistance to gefitinib mediated by cellular reprogramming and theacquisition of an FGF2-FGFR1 autocrine growth loop. Oncogenesis 2:e39 doi: 10.1038/oncsis.2013.4
Haven et al. eLife 2016;5:e09462. DOI: 10.7554/eLife.09462 38 of 38
Registered report Biochemistry


![Seguridad informatica y redes jose uztariz alejandro delgado_ricardo remon[1]](https://img.dokumen.tips/doc/110x75/55b86028bb61eb58078b4590/seguridad-informatica-y-redes-jose-uztariz-alejandro-delgadoricardo-remon1.jpg)