Embed Size (px)
Citation preview

Regions in Motion – Breaking the Path
52nd European Congress of the Regional Science Association
4th Central European Regional Science Conference
21st – 25
th August 2012, Bratislava, Slovakia
Daria Zvirgzde1 , Javier Revilla Diez
2
“Towards internationally competitive regions in Ukraine: critical assessment”
Abstract
Globalisation as a dominant tendency of the XXI century has initiated the rise of the scale and dynamics of
economic interactions on the international, national and regional levels. Regions have started to compete as the
sources of economic growth since the disproportional levels of their development led to the escalation of the
disparities on the global economic platform. Experience of the most successful and highly developed states
clearly shows that the growth of the competitive economy on the macro-level is only possible through the
accumulation of the regional economic potentials on the meso-level. The notion of international regional
competitiveness has been paid attention to in economic and regional science literature, but still there is no one
single definition of what a competitive region means. The paper presents the author’s own definition of an
internationally competitive regional economy as the starting point of the assessment of the regional
competitiveness of the Ukrainian economy, its economic potential and regional attractiveness towards FDI. The
prospective analysis of the impact of FDI on the local business, of whether MNCs do add value to the local
regional growth, situating the regional competitive advantage, of the level of embeddedness of MNCs into
regional innovation systems as the primary sources of regional competitiveness is introduced in the paper within
the methodology framework of the survey carried out in three regions of Ukraine within the SEARCH Project of
the Seventh Framework Programme. Formulation of strategic policies targeting at raising the level of the
regional competitiveness stands as a coherent discussion focus.
The paper starts with introduction and literature overview. The second part of the paper is devoted to the
methodological approach, followed by the results and future research guidelines. The paper ends up with
concluding remarks and references.
Key words: regional competitiveness, economic potential, regional innovation system
JEL codes: E17, F21, O18, R11
1. Introduction
Modern economic development is well characterized by the tendency of
regionalization, which is expressed in the rise of the autonomy of the regions, seeking to
retain their identity and to enhance the role of a region within national and global economy.
Regional determinants in the system of factors of international competitiveness of the states
play a greater role, resulting in the formation of national regions with high competitive status,
world cities, high-tech clusters, which in fact determine the disposition of states in the
1 Institute of Economic and Cultural Geography, Leibniz University Hannover, [email protected]
hannover.de
2 Institute of Economic and Cultural Geography, Leibniz University Hannover, [email protected]

hierarchy of the global competitive relations. The region is becoming a relatively independent
economic entity, engaged in competitive relations within both inter-regional interactions and
the global market.
Under these conditions, the formation and implementation of effective competitive
strategies by the actors of international economic relations, specifically regions, in order to
ensure their high competitive status has become a priority for the international
arena. International organizations that evaluate global competitiveness also include regions
with high competitive status in their ratings (Gardiner B. et al., 2004). Transformation of the
process of competitive advantages of the countries around the world, namely its shift from
national to sub-national level, puts in front of contemporary scientists and politicians the task
of theoretical assessment of the patterns of influence of individual national regions on the rise
of international competitiveness of the states and of an effective mechanism of harmonization
of regional and national interests in the sphere of external economic relations. International
competitiveness of regions is associated primarily with highly innovative productive factors,
competitive advantages in high-tech fields, strong presence of national companies in the
world markets and the quality of life. A necessary prerequisite for successful realization of the
concept of raising international competitiveness of Ukraine is the formation of the strong
regional economy based on innovation, providing the breakthrough on the international
markets, primarily with high-tech products. The increase of the competitiveness of the regions
of Ukraine will depend on how the regions will invest in human capital, implement an active
innovation policy and shape an effective regional innovation system, integrated into the
global innovation area.
2. Literature overview
As it is well known, international competitiveness of regions is reflected through the
process of international economic relations. Hence, the evolution of economic thought
concerning the competitiveness of regions should be considered, especially in the context of
theories of international trade. A. Smith, D. Ricardo, J. Mill, who formulated the principles of
absolute and comparative advantage in international trade sought to explain the success of the
country in international competition. Swedish economists E. Heckscher and B. Ohlin
transformed the principle of comparative advantage by D. Ricardo, proving that if the value of
factors of production is the same in all regions, the region is losing its competitive position.
Thus, scientists attributed the level of investment, original environmental conditions,
technological development and human capital to the factors of regional competitiveness
(Hеckscher E.F., 1919; Ohlin B, 1933).

Nobel laureates P. Romer and R. Lucas with J. Grossman and E. Helpman contributed
to the concept of regional competitiveness, noting in their theory of "new growth" that
scientific and technological potential and investment in human capital are key drivers of
regional competitiveness. Scientists have argued that any region can be competitive in case
the number of registered patents and the level of education are increasing steadily (Romer P.,
1994, pp. 3-22). Highlighting the cause and effect relationship between regional
competitiveness and economies of scale, P. Krugman in the theory of "new trade" argues that
investment in human resources, raise of the level of specialization of the infrastructure,
activation of the networks of suppliers and technologies, the effects of agglomeration and
urbanization lead to the rise of the economies of scale, and hence competitiveness. P.
Krugman also states that the competitiveness of the region is almost entirely dependent on
whether the letter would be able to become more productive (Krugman P., 1994, pp. 28-44).
New trends in the development of world trade, technologies, and economic
growth required a review of the theoretical concepts of regional competitiveness. The concept
of regional innovation systems occurs in the early 90’s of the twentieth century as a separate
field theory of innovation systems in the works of C. Freeman, B. Lundvall, R. Nelson. It
integrates two basic ideas: the systemic nature of innovation and regional dimension of
innovation competitiveness of states. In the early XX century A. Marshall has emphasized on
the active role of individual actors in the economic development of the national regions and
countries. He argued that the model of local development is bipolar and based on effective
interaction between two major players in the market: local companies and government
institutions. H. Etzkowitz and L. Leydesdorff as a result of introduction of a third component,
research institutes, to the bipolar model, have developed a model of a "triple helix" of
territorial development, which illustrates the interaction and relationships that arise between
companies, research institutes and government organizations within the process of formation
of innovation systems (Etzkowitz H. et al., 2000, pp. 109-123).
In the early 90’s of the XX century there was a flow of new regional science
emphasizing on the need to work locally to compete globally. The most significant in 90’s
and up to now is the concept of M. Porter, who developed the theory of internal economic
growth in his work «The Competitive Advantage of Nations» and the system of factors
determining international competitiveness (Porter M., 1990, pp. 77-90). According to the
arguments of M. Porter and his famous "diamond" the factors that shape the competitiveness
of the country and its regions are factor conditions in the region, the parameters of domestic
demand in the region, service related industry (clusters of industries) in the region, strategy

and structure of firms, intrasectoral competition in the region, random events and public
policy.
3. Methodological approach
The definition of a "competitive region" is extremely important. It is an important
reference point for public policy aimed at strengthening the competitive position of the
national economy in the world market in the framework of tough international competition.
Different scientists, economists and authoritative international organizations interpret regional
competitiveness in a different way. Experts of the European Commission state that regional
competitiveness is the ability of the region to produce such goods and services that are in
demand in international markets and also to provide stable and high benefits to the local
population, or in general terms, it is the capacity of the region within the conditions of
external competition to provide a relatively high level of income and employment. In our
view, international competitiveness of the regional economy means the ability of enterprises
of the region to occupy and maintain strong positions in certain segments of the global market
in terms of strong economic potential, which provides a dynamic growth of the region and the
national economy on the basis of innovation; the developed system of market institutions;
considerable intellectual capital and investment resources; the ability to flexibly respond to
changing world conditions and to diversify production, accordingly, providing a high
standard of living and making a contribution to the improvement of the competitive status of
the national economy.
In the theory and practice of international economic relations there are several
approaches to assess the competitiveness level of the national economy and the factors, which
determine this level of competitiveness. We can group them into the following main sections:
• assessment based on individual factors and indicators, which mainly
characterize value production results or the usage of specific resources (European
Competitiveness Report, European Innovation Scoreboard, Regional Innovation
Scoreboard).
• assessment based on the holistic approaches using both statistical
indicators and the results of monitoring of the key factors (IMD World
Competitiveness Yearbook, World Economic Forum Global Competitiveness Index,
World Knowledge Competitiveness Index, Beacon Hill Institute, State
Competitiveness Report, Competitiveness Tree, ECORYS-NEI).
In our opinion holistic approaches are much more important, since they cover key
factors, that influence the raise of regional competitiveness and moreover, they comprise

integral methodologies of assessment, which are based on both quantitative and qualitative
indicators. Special attention must be paid to the methodology of the World Economic Forum.
Given the steady progress of theoretical and applied economic research, the methodology
used by WEF to assess international competitiveness is evolving rapidly. The final step in this
evolution was the Global Competitiveness Index (GCI) that was developed in 2004 to assess
the states growth potential for the medium and long term perspective. Global Competitiveness
Index is composed by a combination of accurate statistics and results of the Executive
Opinion Survey. Under this method the country competes in 3 stages of development,
determined according to the level of GDP per capita (Table 1).
Table 1. Subindex weights and income thresholds for stages of development
Stages of development GDP per capita (US$) thresholds
Stage 1: Factor-driven < 2,000
Transition from stage 1 to stage 2 2,000 -2,999
Stage 2: Efficiency-driven 3,000-8,999
Transition from stage 2 to stage 3 9,000-16,999
Stage 3: Innovation-driven > 17,000
Source: The Global Competitiveness Report 2011-2012
The level of competitiveness in the first stage depends on macroeconomic stability and
effective functioning of public and private institutions, developed infrastructure and high-
educated labor force. In the second stage only more efficient technologies that are
implemented in the production process of a company form its competitiveness. The third
stage of development, i.e. innovation stage, introduces competition on the basis of new
technologies. When a country moves to this stage of development, this means that the country
can maintain a high standard of living. Thus, according to the method of WEF there are 12
pillars of competitiveness of a country, which "hold" 3 stages of development. The factor
stage includes the basic requirements, including infrastructure and macroeconomic stability.
Availability of the latest technology and professional training are catalysts at the stage of
economic efficiency, while the level of innovation and business development are determinants
of the innovation-oriented economy.
In 2009, the Foundation "Efektuvne Upravlinya" in partnership with the WEF
published Ukraine Competitiveness Report, in which the competitiveness of the 15 regions
(oblasts) of Ukraine were analyzed, using the methodology of the GCI. It covers a
representative sample from different geographic locations, and regions with different

economic structures and cultural features. Within seven indicators regional statistics was
used, namely: inflation, the range of interest rates, fixed telephone lines, tuberculosis, infant
mortality, number of persons receiving primary education and personal computers. In other
cases, the actual data was used, which was limited due to the lack of the data in some regions.
For this reason the results are not published on the tenth component index (market size),
although they are taken into account when calculating the GCI. Since the decision in this area
applies only to the competence of the central government, a component can not be considered
as a factor of competitiveness in terms of specific regions of Ukraine.
According to Ukraine Competitiveness Report 2009, Kiev occupies a leading position
as the most competitive region, with the score of 4.17, which is 7.2% above the average in
Ukraine. Zaporizka and Odeska oblast were rated 4.16 and 4.11 respectively. The outsider
proved to be Zhytomyrska oblast, AR Krym and Zakarpatska oblast with scores 3.69, 3.62
and 3.45 respectively. According to the methodology of WEF the competitiveness of regions
is measured in comparison with countries. For example, Kiev is the 63d among 149
economies and is listed after such countries as Croatia and Hungary. Donetsk region with 4.02
rating takes the 82d place in the ranking and is followed by Hungary and Bulgaria.
Transcarpathian region is an outsider and takes the 131st place in the overall ranking between
Tajikistan and Mali.
In our view, leading of the regions over the countries is economically incorrect, since
this makes Kiev region more competitive than Hungary regions which take one of the leading
positions in Europe, while the competitiveness of Kiev reaches only the competitiveness of
the outsider in Europe. Nevertheless, Ukraine Competitiveness Report 2009 shows that the
regions of Ukraine have low competitiveness compared to the international arena in any case,
so it is not surprising that Ukraine was rated 82nd in the Global Competitiveness Report
2011-2012 out from 142 countries surveyed, following Macedonia, Botswana and Trinidad
and Tobago.
Experts from the Environmental Department of the World Bank in the context of the
development of indicators of sustainable development have built up a method of calculating
economic potential of a country as a prerequisite of its competitiveness level. The concept of
the World Bank focuses on the calculation of the national wealth, including such of its
components as: natural capital, industrial capital (assets), human capital, social capital. The
long process of socio-economic transformations in Ukraine, focusing on the development of
highly socially-oriented economy, necessitates a comprehensive scientific study of existing

and potential national economic systems to identify sources for further development and
productive use of economic potential.
As the income index, which characterizes the social product of the country, gross
value added, which is produced in the industry, is used. Forecast of this index is formulated
on the basis of its actual dynamics and key trends. Thus, the industry value index is estimated
as the total sum of incomes of the forecasted and postforecasted periods applied to the current
point of time.
T
T
tT
tt
t
ttindustry
rgr
gI
r
gIPV
)1()()1(1
1
+×−
×+
+
×=∑
=
−
Forecasted period post-forecasted period
PV – GVA present value of an industry;
1−tI – value added, produced in an industry in (t-1);
tr – discount rate for the forecasted period;
r – discount rate for the post-forecasted period;
t – timeline from one till infinity;
T – forecasted period;
tg – value added growth pace t;
g – value added growth rate for the post-forecasted period.
The first term of the formula corresponds to the value added in the industry during the
forecasted period. Accordingly, the forecasted period is the period for which one predicts the
development processes quite accurately. The second term of the formula represents an
estimation of the value of the country within postforecasted period, i.e. unlimited period of
time. Therefore, value added in this period is discounted according to the Gordon’s formula
with application of value added to the current point of time. It is very important to discount
the flows of value added using the right discount rate. Usually economists use two main types
of discount rates: to evaluate the private (financial) and public sectors. It is common that for
the purposes of calculating a "private" discount rate the following factors are taken into
account: risk-free rate of financing (for the most liquid securities), the rate of inflation and
risk premiums. However, for purposes of economic analysis of the processes that take place in
the public sector, the private rate is too high or sometimes too low. In this case, it is allowed
to use the social discount rate (opportunity cost in public sector). In the studies of the World
Bank social discount rate is elected by the so-called "social rate of return on investment",
which is determined by the formula:
curSRRI ×+= ,

r – real rate of intertemporal propensities;
u – elasticity of marginal utility of income;
c – growth rate of per capita consumption.
Practical application of the social discount rate is justified by experts of the World
Bank considering their view on the economy of the state and society in terms of taking into
greater account the interests of the population and future generations. The value of the true
norms of intertemporal propensities is similar to the risk-free rate financing and reflects the
expectations of the population and the choice between consumption and savings. The risk
premium in this model is represented through the indicator of the consumption growth rate
per capita, since high growth rates of consumption indicate accelerated economic
development, which therefore means that there are higher risks compared to highly developed
countries of the world. According to the World Bank estimates, the SRRI for developing
countries (Argentina, China, India, and Mexico) is 7-9%, for highly developed countries -
4%. The growth rates of the industries are in the forecasted period are evaluated considering
their dynamics in the periods, which precede the forecasted period, expert ratings and
forecasts and government policy statements.
4. Results and future research guidelines
The estimation of the economic potential of the regions (oblasts) of Ukraine includes
an assessment of the industrial, trade (commercial), agricultural, construction, transport and
communication potentials of the regions, considering the fact that the forecasted period in
Ukraine comprises not more than 10 years, which is consistent with the methodology of
forecasting of the macroeconomic dynamics of the World Bank. The assessment will be
carried out for two scenarios - optimistic and pessimistic. The first scenario is based on the
assumption that the growth rate of value added in the regions for the first 5 years of the
forecasted period will resume at the same level and match the mean increase from the
previous period (2004-2011), over the next 5 years of the forecasted period, growth rates of
value added will increase annually by 10% from the last year's figure. The second scenario is
of due only if the growth rate of value added the regions for the forecasted period will resume
at a lower level than in the previous period and will therefore level up at 50% of the average
increase of the previous period (2004-2011). Thus, these two scenarios represent optimistic
and pessimistic vectors of Ukraine's economy development after the global financial crisis. To
evaluate the economic potential of regions of Ukraine gross value added indicators have been
used, adjusted starting from 2001 according to the corresponding annual rates of inflation.
Therefore, accumulated GVA indicator in the forecasted period is adjusted to the prices in

2011. Due to the economic recession consumption growth rates per head will decrease and it
will take time to get this figure rising gradually, so we used the SRRI of 4% for the first two
years of the forecasted period. Over the next eight years of the forecasted period SRRI will
increase by 0.5% annually from the last year's levels as consumption dynamics after the
economic recovery will improve gradually. In the post-forecasted period discount rate is equal
to 4%, because in this period experts of the Ministry of Economy in Ukraine and of the State
Institution "Institute of Economic Forecasting of NAS of Ukraine" stipulate that Ukraine's
economy will grow constantly and steadily.
Now we will highlight one of the most important components of the economic
potential of a country – its industrial and trade (commercial) potentials, since the impacts and
interrelations within manufacturing sector and network capital are its basic elements of the
formation of strong economic potential and hence strong regional competitiveness. Industrial
and trade potentials give us direct access to the future FDI-flows in the manufacturing sector
and network capital research in the future analysis.
The total industry potential of the regions of Ukraine according to the optimistic
scenario equals 11565502,5 million UAH in the prices of 2011, following the pessimistic
scenario this figure is equivalent to 6180024,5 million UAH, which is nearly 47 % less than in
the optimistic scenario. In the forecasted period of 2011-2021 the amount of the total
industrial value added in the prices of 2011 will be 1771043,7 million UAH relying on
optimistic scenario, pessimistic scenario’s figure is 1,4 less and makes 1274820,7 million
UAH. Moreover, its biggest share will be created within the lat five years. In the post-
forecasted period the discounted value added will amount 9794458,9 million UAH according
to the optimistic scenario, which is 5,5 times more of the figure in the forecasted period. The
pessimistic scenario states the figure of 4905203,8 million UAH of the discounted value
added, which is 4 times more of the respective figure in the forecasted period.
The total commercial potential of the Ukrainian regions within the framework of the
optimistic scenario is 10343856.7 million UAH in prices of 2011 within the pessimistic
forecast the figure is almost 3 times smaller – 3708645.9 million UAH in prices of 2011. In
the forecasted period 2011-2021 the volume of accumulated added value will be 1196711.0
million UAH in terms of the optimistic scenario and 660508.5 million UAH in terms of the
pessimistic scenario. In the post-forecasted period the discounted value added will amount
9238145.7 million UAH if we consider optimistic scenario, which is 8 times more than the
corresponding figure in the forecasted period. If we consider the pessimistic scenario in the

post-forecasted there will be 4.6 times more of the discounted value added created than in the
forecasted period, namely 3048137.4 million UAH (Figure 1).
Figure 1. Optimistic and pessimistic scenario’s of the development of economic
potential
Source: Provided by author on the basis of Annex 1.
According to the optimistic scenario the biggest share of the industrial potential
belongs to Donetska oblast – 12,3%, which is only 1% less than the share of Dnipropetrovska
oblast, which has 11,3% of the industrial potential of the country. Luganska, Kharkivska and
Cherkaska oblasts share the third place in the division of industrial potential of Ukraine
among its regions with 8,9%, 6,9% and 5,8% of the industrial potential respectively. Kiev
region accounts for 4,0% of the industrial potential of Ukraine. Khersonska oblast is an
outsider with its share of industrial potential of only 0,5%. If we rely on the pessimistic
scenario, the biggest shares of the industrial potential also belong to Donetska and
Dnipropetrovska oblasts of 16,9% and 14,5% accordingly. An outsider in the pessimistic
scenario is Chernivetska region, with only 0,7% of the industrial potential of Ukraine.
According to the optimistic forecast Kievska and Donetska oblasts lead, which have the
largest share of commercial potential of the country - approximately 11.1%. They are
followed by Kharkiv region, which accounts for approximately 8.9% of the commercial
potential. According to the pessimistic forecast Kiev region has 7.1% of the commercial
potential of the country, and Donetska and Kharkivska oblasts have 14.1% and 7.8%
respectively. An outsider as of both forecasts is Sumska oblast, accounting for only 0.3% of

the commercial potential of Ukraine according to the optimistic forecast and 0.6% according
to the pessimistic one (Annex 1).
Overall, the calculations of the economic potential of the regions of Ukraine by main
economic activity state that the total economic potential of Ukraine in the prices of 2011
according to the optimistic scenario is 30976898.6 million UAH. Thus, if the growth rate of
the value added will recover according to its previous levels over the next 5 years and
then grow by 10% annually, the economic potential of Ukraine will be almost two
times larger than the one if is the growth rate of value added will be only 50% of the
average rate of the previous period. The bulk of Ukraine's economic potential will be
created within postforecasted period. The largest share of the economic potential of Ukraine
belongs to Donetska oblast: according to the optimistic forecast the figure is 3256395.7
million UAH, which makes about 10.5% of the total economic potential of Ukraine. Share of
the economic potential of Dnipropetrovska oblast out of the total economic potential of
Ukraine is approximately 8.1% in the optimistic scenario. In Kharkivska oblast its economic
potential accounts for 7.1% of the total economic potential in the optimistic scenario. If we
take into account the positive vector of Ukraine's economic development after the economic
recession, the Kievska oblast (excluding Kiev) accounts for roughly the same economic
potential as Kharkivska oblast, i.e. 7.1%. The smallest share of the economic potential of the
country belongs to the Khersonska oblast - 1.5% (Figure 2).
Figure 2: Economic potential by regions of Ukraine, optimistic scenario
Source: Provided by author on the basis of Annex 1
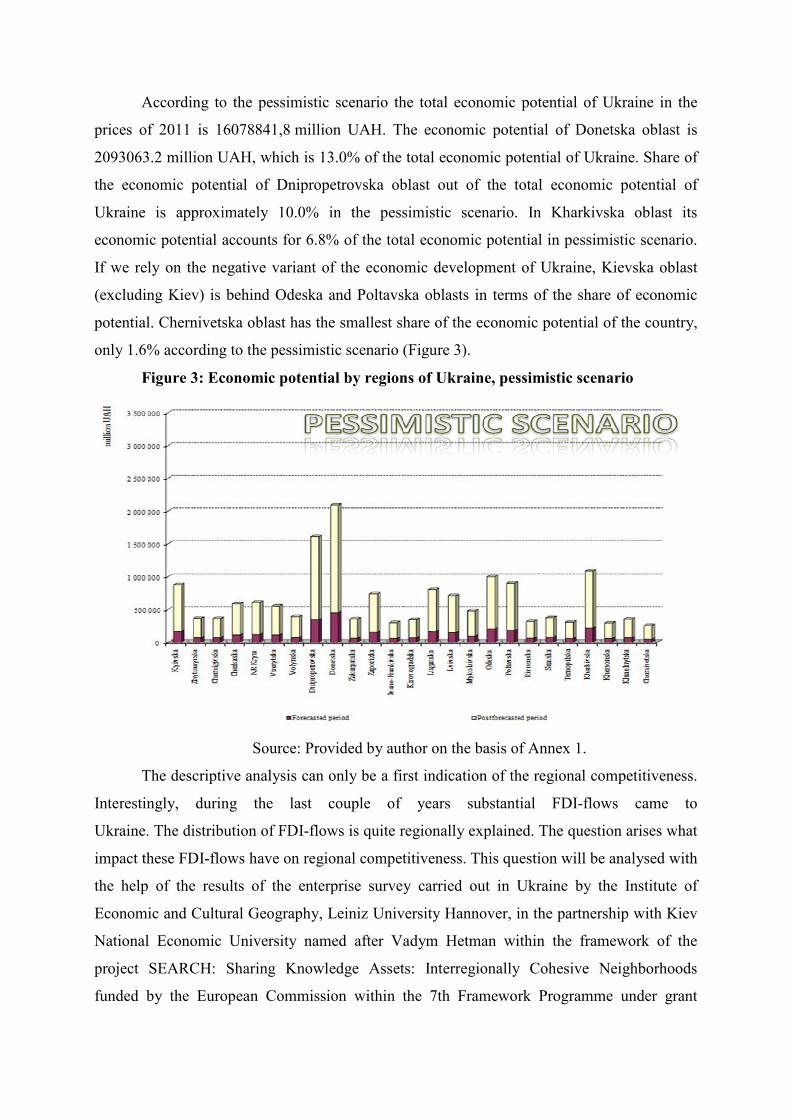
According to the pessimistic scenario the total economic potential of Ukraine in the
prices of 2011 is 16078841,8 million UAH. The economic potential of Donetska oblast is
2093063.2 million UAH, which is 13.0% of the total economic potential of Ukraine. Share of
the economic potential of Dnipropetrovska oblast out of the total economic potential of
Ukraine is approximately 10.0% in the pessimistic scenario. In Kharkivska oblast its
economic potential accounts for 6.8% of the total economic potential in pessimistic scenario.
If we rely on the negative variant of the economic development of Ukraine, Kievska oblast
(excluding Kiev) is behind Odeska and Poltavska oblasts in terms of the share of economic
potential. Chernivetska oblast has the smallest share of the economic potential of the country,
only 1.6% according to the pessimistic scenario (Figure 3).
Figure 3: Economic potential by regions of Ukraine, pessimistic scenario
Source: Provided by author on the basis of Annex 1.
The descriptive analysis can only be a first indication of the regional competitiveness.
Interestingly, during the last couple of years substantial FDI-flows came to
Ukraine. The distribution of FDI-flows is quite regionally explained. The question arises what
impact these FDI-flows have on regional competitiveness. This question will be analysed with
the help of the results of the enterprise survey carried out in Ukraine by the Institute of
Economic and Cultural Geography, Leiniz University Hannover, in the partnership with Kiev
National Economic University named after Vadym Hetman within the framework of the
project SEARCH: Sharing Knowledge Assets: Interregionally Cohesive Neighborhoods
funded by the European Commission within the 7th Framework Programme under grant

agreement number 266834. The objective of the SEARCH Project is to analyse the integration
process between the EU and the NCs by focusing on the European Research Neighborhood
(ERN), thereby improving fundamentally the understanding of institutional framework
conditions of the European Neighborhood Policy (ENP) countries, their economic interactions
with the EU in terms of people, capital, trade, knowledge, and innovation, in order to improve
future definition and implementation of the European Neighboring Policies taking into
account that "one size fits all" policy recommendations will not be appropriate due to the
bilateral nature of the EU-ENP countries agreements.
The aim of the enterprise survey is to investigate the location choices of FDI in
Ukrainian regions, the determinants of FDI presence and to assess the effects and mutual
impact of foreign firms’ activities on domestic firms and institutions in Ukraine and vice
versa. Around 450 companies are planned to be surveyed in 3 regions of Ukraine, i.e. 150
companies in each region: capital region, close to the EU border region and far from the EU
border region. The criteria of selection the regions is based on the FDI-flows in these regions
and geographical position towards the EU. The criteria of selection of the companies in each
region is determined by either food sector or machinery and equipment sector due to the
strong presence of MNCs in these sectors; and only production companies, namely those
having production sites in the chosen three regions of Ukraine, are selected. Overall, in each
region 100 domestic firms and 50 foreign firms are to be surveyed.
Thus, according to the data the State Statistical Committee of Ukraine Lvivska oblast
is the first in terms of FDI-flows in the Western part of Ukraine (close to the EU border
region) and Kharkivska oblast is the is the first in terms of FDI-flows in the Eastern part of
Ukraine (far from the EU border region) (Table 2).
Table 2. FDI distribution by regions of Ukraine
Regions of Ukraine
(oblasts)
FDI increase, reduction
per year, $ million
FDI cumulatively
starting from the
beginning of investment
on October 1, 2011,
$ million
FDI per person
cumulatively starting from
the beginning of
investment, $
2009 2010 2009 2010
Western region
Volynska 63,2 11,7 246,6 321,6 332,8
Zakarpatska 7,3 -1,1 340,1 293,0 291,7
Ivano-Frankivska 134,7 -92,5 622,2 460,8 393,9
Lvivska 240,6 * 75,2 1 363,9 473,2 503,7
Chernivetska 1,7 0,5 63,4 68,6 69,1
Capital region
Kyiv (city) 2 387,9 2 634,1 24 016,8 7 031,9 7 946,2
Kyivska 178,1 77,5 1 702,8 887,4 935,3

Eastern region
Donetska 107,8 424,7 2 292,2 366,1 464,6
Luganska 243,3 -6,3 747,3 275,0 274,7
Sumska 85,5 114,1 348,3 207,1 307,0
Kharkivska 472,8 622,7 2 776,7 754,6 985,0
Source: State Committee of Statistics, Ukraine.
At the time of preparation of this article, the enterprise survey is being carried out in
Ukraine. Random sampling has been used to select the companies for the survey from the
respective sectors. The companies are interviewed face-to-face. Prior to this two
questionnaires (one for foreign companies and one for domestic companies) have been
developed with closed, likert-scale questions. Both of the questionnaires consist of six blocks:
fact sheet block dealing with the general key information about the company and the
respondent; location choices and location patterns block for foreign firms and competition and
strategy block for domestic firms; business environment block, innovation block, customer-
supplier relation block, human capital and skills development block for both of the
questionnaires.
After the survey is finished, the results will be analysed and the assessment will show
the mutual impact of FDI on the domestic business in the regions of Ukraine. Therefore, the
issue of embeddedness of companies into regional innovation systems will be investigated in
order to show what impact FDI-flows have on the competitiveness status of the regions of
Ukraine.
5. Policy implications
Innovations play a crucial role in the ability of countries to respond effectively to the
challenges and opportunities of the global economy. Innovations today form the basis of a
highly competitive commercial potential, economic potential and therefore, highly
competitive national and regional economies. The world economic system of the XXI century
depends more from new ideas and talent, than from a developed infrastructure. Therefore,
public policy should be developed in such a way that it is powerful enough to stimulate
innovation in order to improve the competitive status of the regions and the country as a
whole. Innovation policy of highly competitive states is a set of tools that are aimed at
improving access to financing of innovation, creation of innovative regulatory framework to
ensure the demand for innovation and at strengthening of the interdependence between
research institutes and industrial enterprises, thereby stimulating innovative activity of
businesses.

The regions of Ukraine in order to be competitive on the international arena are to
undergo innovative progress, because otherwise it is impossible to enhance their international
competitiveness. The strategy of scientific and technological breakthroughs can not occur
without the development of competitive national innovation systems at national, regional,
sectoral and inter-industrial levels. Preparation of similar programs has been the normal
practice in the EU for a long time. Now they are designed and they operate successfully in
nearly 100 European regions and their target areas are IT, biotechnology, nanotechnology,
new materials and energy technologies. The main purpose of the State Regional Development
Strategy until 2015 and the Law of Ukraine "On Stimulation of Regional Development" is to
create conditions for increasing competitiveness of regions, ensuring their sustainable
development. In our view, the implementation of these strategic documents should take place,
using the experience of the key innovators, namely by building regional innovation systems
(RIS), which requires an integrated scientific approach, which consists of the following:
• There should be developed a state program of innovation stimulation at
national and regional levels. It is necessary to develop an innovative plan of action as
part of the state program of innovation stimulation in order to organize all the actors
involved in the development of the innovation potential of Ukraine, as well as all the
innovative initiatives, which will lead to a synergy effect in the future.
• The concept of regional innovation systems (RIS) should be created within the
framework of the state program of innovation stimulation at national and regional
levels. Regional innovation systems should be created as a set of interrelated tasks and
measures, aimed at solving major problems of innovative development of each region,
some of its industries and communities.
• The local specific environment should be taken into account when developing
the RIS in terms of a proper assessment of scientific and technological resources of the
region, financial and economic potential, production, social and education
possibilities, since all these are important prerequisites for the innovation development
of any region. It is important to investigate innovation opportunities and potential of
industrial enterprises of the region, as far as research institutes and universities.
• Stimulation of innovation activities of entrepreneurs should be provided at all
levels – starting from the government up till regional and local authorities. The
priority in innovation development in Ukraine should have information technologies,
nanotechnologies, biotechnologies and genetic engineering.

• Financing of innovation activities does play a great role in the development of
innovation potential and therefore, high competitiveness status of a country and its
regions. Financing can come from regional venture fund, foreign investment, public
funds etc. But the formation of the mechanism of financing of innovation projects of
different categories should start from the development of the scientifically grounded
conditions of commercial funds attraction and social funds attraction aimed at
innovative development of regional economies.
• The focus of the national innovation and investment policy should be on the
convergence of levels of socio-economic development through effective use of local
conditions and resources and integration of regional innovation systems into the global
innovation system. Therefore, it is important to create favorable conditions for
attracting foreign investment in the depressed areas in order to enhance high-tech
production, increase the investment attractiveness of the region through the active use
of specific technology areas.
• It is crucially important to promote the development of regional innovation
infrastructure. This encompasses in particular information centres, industrial parks,
technology transfer centres, business incubators. There is a need to enhance private
sector participation in financing of R&D, using a different number of mechanisms.
The effectiveness of this approach is confirmed by the experience of many countries,
namely aimed at stimulation of the development of high-tech clusters, which will
create a platform for radical formation of regional innovation.
• Small and medium size enterprises as the most dynamic and flexible structures
of the regional innovation system should be supported by the following: simplification
and acceleration of the registration process of business entities, formation of a network
of regional business support funds, introduction of concessional lending of small and
medium-sized national banks, activation of participation of Ukrainian organizations,
institutions and companies in international scientific and technological cooperation.
• There is a definite need to organize a system of direct connections between
science and industry. Improving the competitiveness of Ukrainian enterprises is
impossible without information on the latest applied and basic research, which
requires the closest connection to the academic sector. Is also necessary to promote
international, inter-branch and inter-regional scientific and technological cooperation

and development of new processes and technologies that would share the results of
research activities between the actors.
6. Concluding remarks
By and large, in this article the authors investigate the notion of regional
competitiveness using Ukraine and its regions as the subject of analysis. The paper goes with
an assessment of the theoretical aspects and up-to-date methodologies of the analysis of the
international competitiveness of the regions and its determinants within the conditions of
globalization. The results of the study of the economic potential of the regions of Ukraine as
one of the drivers of regional competitiveness are provided and finally, the paper comes up
with the strategic ways of accumulation of the innovative competitiveness of the regions of
Ukraine through creation of the highly competitive national architecture with the promotion
of venture capital, research activities and regional innovation infrastructure within the
framework "science - business - government". Moreover, the possibilities of future research
based on the results of the enterprise survey in Ukraine carried out by the Institute of
Economic and Cultural Geography, Leibniz University Hannover, are highlighted within the
framework of the SEARCH project of the 7th
Framework EU Programme focusing on FDI-
flows into the regions of Ukraine and their interdependence with the main determinants of the
highly competitive status of the regions.
References
1. Etzkowitz. H, Leydesdorff L. (2000) The Dynamics of Innovation: From National
Systems and “Mode 2” to a Triple Helix University-Industry-Government Relations.
Research Policy, 29-215р.
2. European Innovation Scoreboard Database. http://www.proinno-europe.eu/page/eis-
database
3. Gardiner B., Martin R., Tyler P. Competitiveness, Productivity and Economic Growth
across the European Regions. – London, 2004.
4. Hеckscher E.F. The Effekt of Foreign Trade on Distribution of Income/ Reading in the
Theory of International Trade // Blakiston Series of Republished Articles on
Economics. 1919. – N 4. – 386 p.
5. IMF, World Economic Outlook Database. World Economic and Financial Surveys:
national sources. International Monetary Fund.
http://www.imf.org/external/pubs/ft/weo/2010/01/weodata/index.aspx
6. Krugman, P. Competitiveness: a dangerous obsession, Foreign Affairs, 73, 2. – 1994 -
58p.

7. Ohlin B. Interregional and International Trade. – Cambridge Mass.: Harvard
University Press, 1933. – p. 28-36
8. Porter M. The Competitive Advantage of Nations.Free Press,New York,1990.–863p.
9. Porter М. Clusters and the new economics of competition. Harvard Business Review.
Nov-Dec. 1998. – p. 86-112
10. Romer P. M. The Origins of Endogenous Growth. Journal of Economic Perspectives,
Winter 1994. – 32p.
11. The Global Competitiveness Report 2011-2012. World Economic Forum. Klaus
Schwab. Xavier Sala-i-Martin. Geneva, Switzerland, 2011. – 527 p.
12. World Competitiveness Yearbook. World Competitiveness Centre. IMD. Research
Methodology. http://www.imd.ch/research/centers/wcc/research_methodology.cfm
13. World Knowledge Competitiveness Index 2008. Robert Huggins, Hiro Izushi, Will
Davies, Luo Shougui. Centre for International Competitiveness. Wales, UK, 2008. –
57 p. http://www.cforic.org

ANNEX 1.
Economic potential of the regions of Ukraine by two m
ain economic activities
in the forecasted and postforecasted periods
Sourc
e: C
alcu
lati
ons
pro
vid
ed b
y a
uth
or.
The
eco
no
mic
po
ten
tial
of
the
regio
ns
by t
wo
mai
n a
ctiv
itie
s
(op
tim
isti
c sc
enar
io)
The
eco
no
mic
po
ten
tial
of
the
regio
ns
by t
wo
mai
n a
ctiv
itie
s
(p
essi
mis
tic
scenar
io)
Regions of
Ukraine
Industry
Trade
Economic
Industry
Trade
Economic
Forecasted
Period
Postforecasted
period
Forecasted
Period
Postforecasted
period
Forecasted
Period
Postforecasted
period
Forecasted
Period
Postforecasted
period
Forecasted
Period
Postforecasted
period
Forecasted
Period
Postforecasted
period
AR
Kry
m
42 8
19
,6
239
64
5,3
6
6 2
43
,5
517
06
6,6
175 351,2
1 045 305,5
30 5
20
,1
120
91
8,6
3
5 8
06
,4
168
14
5,7
121 887,9
485 166,0
Vin
nyts
ka
34 3
04
,9
170
23
6,5
4
4 1
90
,2
355
86
4,3
154 619,1
837 043,7
26 5
18
,0
99 3
66
,2
23 1
60
,5
110
66
9,8
115 731,8
437 247,7
Voly
nsk
a 2
5 6
46
,8
210
64
7,2
5
1 1
72
,8
377
05
3,1
118 253,6
786 063,8
13 1
75
,6
63 6
63
,4
29 2
08
,9
132
92
3,1
75 676,2
316 793,5
Dn
ipro
pet
rovsk
a 2
38
13
2,8
1
063
73
7,6
5
3 8
87
,1
356
92
6,8
434 905,4
2 082 475,1
196
35
5,0
7
02
14
7,6
3
3 7
52
,3
145
27
2,9
345 889,2
1 265 878,5
Don
etsk
a 2
73
05
0,8
1
148
27
6,6
1
55
24
5,3
9
98
82
2,1
564 299,6
2 692 096,1
233
08
2,5
8
12
02
4,9
9
9 5
75
,0
422
31
3,1
452 114,2
1 640 949,0
Zh
yto
myrs
ka
35 2
50
,5
215
28
0,3
3
4 6
16
,2
259
01
7,1
104 733,3
603 484,5
23 5
56
,1
97 3
47
,6
19 4
79
,3
89 3
84
,1
74 917,3
291 884,9
Zak
arpat
ska
39 5
61
,7
355
10
3,4
4
1 0
75
,2
339
82
4,5
112 684,9
829 793,7
18 4
74
,9
94 0
08
,2
20 9
44
,6
101
62
2,0
67 188,8
290 654,5
Zap
ori
zka
100
40
8,7
5
02
35
0,4
6
0 5
95
,6
543
97
1,1
213 089,3
1 251 655,5
77 2
11
,4
290
39
1,9
2
8 2
93
,5
143
98
0,3
151 696,8
590 369,4
Ivan
o-F
ran
kiv
ska
20 0
78
,2
89 9
49
,6
26 5
64
,3
207
70
9,7
82 491,4
435 223,1
16 5
27
,5
59 1
75
,6
14 3
34
,5
67 3
78
,8
63 266,8
234 312,0
Kyiv
ska
65 9
47
,2
402
96
5,6
1
02
19
8,3
1
059
10
6,4
271 325,5
1 924 708,7
44 0
50
,9
182
09
2,4
4
0 0
40
,0
222
88
6,8
169 004,2
709 011,4
Kir
ovogra
dsk
a 3
6 0
34
,6
237
22
6,6
2
0 1
91
,7
147
46
9,7
98 753,2
562 004,5
22 6
84
,4
97 3
32
,6
11 6
18
,5
52 6
24
,0
70 908,6
276 413,9
Lu
gan
ska
155
24
1,0
8
78
93
4,5
2
2 2
92
,6
122
78
5,5
223 498,6
1 192 823,9
109
73
9,5
4
37
17
9,0
1
6 0
69
,5
63 1
86
,8
165 402,7
637 134,1
Lviv
ska
59 5
26
,7
358
73
3,6
4
6 3
35
,8
311
78
9,8
198 702,8
1 071 163,1
40 1
84
,7
164
98
6,5
2
8 6
43
,0
124
28
1,8
147 387,1
563 837,6
Myk
ola
ivsk
a 6
4 8
57
,7
390
86
0,5
4
2 4
78
,3
336
14
6,2
163 940,6
979 620,8
28 0
06
,6
105
21
2,8
2
2 6
54
,3
107
19
6,7
97 554,0
379 107,6
Od
esk
a 6
7 2
48
,2
381
03
0,2
8
1 1
41
,9
663
23
3,3
282 466,4
1 583 795,3
47 5
11
,8
189
34
5,3
4
1 8
91
,8
201
86
3,2
207 023,1
792 094,1
Polt
avsk
a 6
9 3
03
,2
392
67
3,6
5
7 1
75
,2
448
42
0,5
295 884,3
1 584 637,5
83 1
91
,0
325
77
4,3
3
0 7
61
,2
144
83
5,8
182 633,8
719 527,9
Riv
nen
ska
23 0
60
,9
137
86
3,5
2
2 1
04
,0
144
79
0,5
88 571,9
471 123,8
15 6
62
,5
64 0
54
,0
13 9
72
,2
59 7
98
,7
66 308,3
252 036,4
Su
msk
a 5
9 8
48
,3
309
73
5,0
5
433
,4
21 6
91
,6
100 208,5
458 497,8
45 0
13
,0
171
93
5,2
4
772
,4
16 2
63
,6
82 024,8
293 736,9
Ter
nop
ilsk
a 2
1 0
60
,8
136
45
4,2
3
3 3
13
,9
277
32
3,6
89 876,0
561 240,8
13 4
32
,2
57 1
69
,7
16 8
78
,5
82 1
83
,4
60 321,9
245 513,4
Kh
ark
ivsk
a 1
19
10
9,4
6
74
33
9,4
9
7 7
71
,0
829
12
2,0
315 088,7
1 895 185,3
84 2
00
,6
335
43
1,0
4
8 5
81
,8
239
08
6,0
219 565,5
867 901,8
Kh
erso
nsk
a 1
2 9
46
,5
45 6
34
,4
23 3
70
,7
151
14
2,3
79 097,6
385 679,3
12 1
22
,2
39 2
40
,7
14 9
27
,6
63 4
75
,4
62 793,6
228 812,0
Kh
mel
nyts
ka
24 9
20
,8
145
91
8,5
2
5 1
45
,6
179
92
9,6
98 937,3
526 053,5
17 1
90
,3
69 5
96
,3
14 7
38
,4
66 0
32
,3
74 406,4
281 274,5
Ch
erk
aska
77 4
31
,6
591
62
3,9
2
8 9
29
,0
186
06
3,2
173 235,1
1 087 040,3
42 7
22
,9
198
28
3,1
1
8 5
60
,1
78 7
03
,2
115 299,2
473 076,9
Ch
erniv
etsk
a 7
2 9
85
,9
557
65
6,0
3
1 9
19
,8
240
15
9,4
135 216,8
952 890,6
8 4
89
,4
34 7
87
,6
17 8
69
,8
82 2
43
,5
49 857,2
203 788,1
Ch
ernig
ivsk
a 3
2 2
66
,8
157
58
2,4
2
3 3
19
,5
162
71
7,0
99 544,7
502 516,6
25 1
97
,7
93 7
39
,3
13 9
74
,4
61 7
86
,4
77 187,4
286 273,0
Total
1 771 043,7
9 794 458,9
1 196 711,0
9 238 145,7
4 674 775,9
26 302 122,7
1 274 820,7
4 905 203,8
660 508,5
3 048 137,4
3 316 046,8
12 762 795,0
Total potential
11 565 502,5
10 434 856,7
30 976 898,6
6 180 024,5
3 708 645,9
16 078 841,8


![[52nd KUG PP] Intro KUG](https://img.dokumen.tips/doc/110x75/54b891a74a79597d368b45c6/52nd-kug-pp-intro-kug.jpg)