Embed Size (px)
Citation preview

Regional & Urban PolicyRegional & Urban Policy
Investments for growth & jobs
Promoting development and good governance in EU regions and cities
6th Report on economic, social and territorial cohesion, July 2014

Regional & Urban PolicyRegional & Urban Policy
Key messages & conclusions
Rudolf Niessler, Director of the Policy DirectorateDG for Regional and Urban Policy

Regional & Urban PolicyRegional & Urban Policy
6th Cohesion Report
• Art. 175 of the consolidated treaty:'The Commission shall submit a report to the European Parliament, the Council, the Economic and Social Committee and the Committee of the Regions every three years on the progress made towards achieving economic, social and territorial cohesion …'
• Exceptionally, the report has been delayed by one year to report on the new Cohesion Policy programming period

Regional & Urban PolicyRegional & Urban Policy
New structure instead of old
1. Smart growth2. Inclusive growth3. Sustainable growth4. Public investment, growth
and the crisis5. Good governance6. Evolution of Cohesion
Policy7. Impact of Cohesion Policy8. Cohesion Policy in 2014-
2020
1. Economic, social and territorial situation
2. National policies and cohesion
3. Other EU policies and cohesion
4. Impact of Cohesion Policy

Regional & Urban PolicyRegional & Urban Policy
Regional disparities increased
2000 2001 2002 2003 2004 2005 2006 2007 2008 2009 2010 2011 2012 201365
70
75
80
85
90
95
100
105
110
115
120
65
70
75
80
85
90
95
100
105
110
115
120GDP per head Unemployment rateCoefficient of variation, 2000=100
Coefficient of variation of GDP per head, employment rate (15-64), unemployment rate, EU-27 NUTS 2 regions, 2000-2012
Source: Eurostat, DG REGIO calculations

Regional & Urban PolicyRegional & Urban Policy
Economic disparities
• Crisis halted regional economic convergence
• National GDP projections show slow convergence post-crisis
2001
2002
2003
2004
2005
2006
2007
2008
2009
2010
2011
2012
2013
2014
2015
-6
-4
-2
0
2
4
6
8
-6
-4
-2
0
2
4
6
8
Less developed Member StatesModerately developed Member StatesHighly developed Member States
Annual average change (%)
Growth of GDP per head in real terms, EU-28, 2001-2015
Source: Eurostat

Regional & Urban PolicyRegional & Urban Policy
Crisis reinforced role of Cohesion Policy
• Crisis led to a rapid reduction of public investment as a part of the fiscal consolidation efforts
2007 2008 2009 2010 2011 2012 2013200
220
240
260
280
300
320
340
200
220
240
260
280
300
320
340
EU-28 Public investment (GFCF)EU-28 Public investment without 2007-2013 Cohesion Policy payments (ERDF, ESF, CF)
EUR billion at 2005 prices
Impact of Cohesion Policy on public investment, 2007-2013
Source: Eurostat and DG REGIO

Regional & Urban PolicyRegional & Urban Policy
Cohesion policy 2007-2013 and national counterpart represents a significant proportion of public investment in Member States
0%
10%
20%
30%
40%
50%
60%
70%
80%
90%
Slov
akia
Lith
uani
a
Hun
gary
Bulg
aria
Latv
ia
Port
ugal
Esto
nia
Czec
h Re
publ
ic
Pola
nd
Mal
ta
Rom
ania
Slov
enia
Gre
ece
Spai
n
EU 2
7
Italy
Cypr
us
Ger
man
y
Finl
and
Fran
ce
Uni
ted
King
dom
Belg
ium
Swed
en
Aust
ria
Irela
nd
Net
herla
nds
Den
mar
k
Luxe
mbo
urg
Average 2011-2013
SF and CF (and national co-financing) as % of total public investment (GFCF and capital transfers)

Regional & Urban PolicyRegional & Urban Policy
Tangible benefits of cohesion policy in 2007-2013
• 594 000 jobs created – at least 262 000 in SMEs• 77 800 start-up companies supported• 2 700 KM of new or reconstructed railways• 25 800 KM of new or reconstructed roads• Broadband access for 5 million citizens• Access to clean drinking water for 3.2 million citizens• ESF: 15 million participants per year• 940 financial instruments in 25 Member States rising EUR 12.6
billion € OP funding (including EUR 8.36 billion structural Funds) for equity, loans and guarantees

Regional & Urban PolicyRegional & Urban Policy
Cohesion Policy 2014-20 in the EU economic policy mix
Country-specific recommendations are the reference for Partnership
Agreements and programmes

Regional & Urban PolicyRegional & Urban Policy
Cohesion Policy 2014-2020
• Focus on growth-enhancing investments
• Concentration on Europe 2020 priorities
• Improving governance
• Linked to the European Semester
• Linked to structural reform through ex-ante conditionalities

Regional & Urban PolicyRegional & Urban Policy
State of programming 2014-2020
• 16 Partnership Agreements (PAs) adopted• All remaining PAs have been commented and will
be adopted by the end of the year• 197 out of the 205 REGIO-led Operational
Programmes (Ops) have been submitted.• 181 out of 187 ESF/YEI OPs have been submitted,
incl. 33 OPs covering YEI• So far 6 OPs have been adopted.

Regional & Urban PolicyRegional & Urban Policy
11. Good governance
10. Education
09. Social inclusion
08. Employment
07. Network infrastructure
06. Environment
05. Climate change adapta-tion
04. Low-carbon economy
03. SMEs support
02. ICT
01. Innovation and R&D
0 5 10 15 20 25 30 35 40 45
1.1
6.2
11.0
2.9
25.6
15.5
3.6
30.1
32.7
13.7
40.0
3.2
26.3
20.9
30.733.5
17.0
3.5
7.7
ESF ERDF CF
EUR billion at current prices
Allocation to thematic objectives by Fund (EUR), 2014-2020
Source: Final and draft partnership agreements as of 1 June 2014

Regional & Urban PolicyRegional & Urban Policy
ESF Priorities (TOs 8-11)
Network infrastructure
(TO 7)
Climate change adaptation andenvironment
(TOs 5-6)
ERDF concentration priorities (TOs 1-4)
0 5 10 15 20 25 30 35 40 45
30.2
22.8
15.8
31.2
31.5
18.2
12.1
38.2
2014-2020 2007-2013
% of total (excl. Tech. Assist.)
Allocation by thematic objective, EU-28, 2014-2020 and 2007-2013
Source: SFC and Final and draft partnership agreements as of 1 June 2014

Regional & Urban PolicyRegional & Urban Policy
Ex-ante conditionality is challenging
11. Good Governance
10. Education
09. Social inclusion
08. Employment
07. Network Infrastrastructure
06. Environment
05. Climate change adaptation
04. Low-carbon economy
03. SME support
02. Information Communication Technology
01. Innovation and R&D
0 2 4 6 8 10 12 14 16 18 20 22 24 26 28
13
20
18
17
16
18
14
14
9
16
18
4
5
7
9
3
5
9
11
15
7
7
3
1
5
3
2
2
2
8
2
3
2
4
2
3
3
2
3
3
EAC not com-pletely fulfilled
EAC fulfilled
Not applicable
Not available
Number of MS Source: Commission assessment of PAs Based on information available in June 2014

Regional & Urban PolicyRegional & Urban Policy
Next steps
• Full reporting on Cohesion Policy 2014-2020 programming period by end of 2015
• Ex-post evaluation of 2007-2014 by end of 2015• Midterm review/revision of MFF by end of 2016• 7th Cohesion Report in 2017 (including policy
proposals post 2020)
Regional & Urban PolicyRegional & Urban Policy
6th Cohesion Report
Manuela GELENGHead of Unit, ESF Policy and LegislationDG Employment, Social Affairs and InclusionEuropean Commission

Regional & Urban PolicyRegional & Urban Policy
Overview
1. Employment, social and education trends (chapter 2 of the Report)
2. Policy framework and ESIF (ch.2)
3. ESF 2014-20 support to institutional capacity building and public administration reform (ch.5/ ch.8)
4. Results of ESF 2007-2013 programmes (ch.7)
5. State of play programming of ESF and YEI OPs (ch.8)

Regional & Urban PolicyRegional & Urban Policy
Key trends The crisis has widened disparities in employment
rates; EU2020 employment target of 75% is currently
far from reach; Unemployment highest in the EU in over a
decade; major risks for youth; Early school leaving rates improve but significant
challenges for education and training systems; At-risk-of-poverty rates increased in 17 MS; Severe material deprivation is on the rise 11% of
the EU population in 2012. It is worst in southern and eastern MS.

Regional & Urban PolicyRegional & Urban Policy
EU Policy framework and ESIF
The EU2020 policy framework for "inclusive growth": higher employment rates as well as greater focus on social inclusion
EU2020 is now the backbone of the ESIF legal framework 2014-2020 => Funds will have to concentrate on a limited number of priorities (for the ESF, up to 5 investment priorities)
Despite the increasing needs as outlined already, need to ensure value for EU investments.

Regional & Urban PolicyRegional & Urban Policy
ESF 2014-20 support to institutional capacity building and public administration reform
ICB is a key EU2020 and CPR priority
Need to differentiate between stricto senso capacity to manage EU funds and the broader needs for comprehensive public administration reforms.
A strategic approach to ICB is a prerequisite for successful reforms (though not present in all MS)

Regional & Urban PolicyRegional & Urban Policy
Results of ESF 2007-2013 OPs
Preliminary results of evaluations (end-2012):Access to employment: Around 20 million participations (i.e. cases of
participation in programmes); of which over 3 million found a job soon after the support ended.
20 million young people received support (30% of the total)
Around 500,000 gained qualifications under these measures
Social inclusion: EUR 13 bn of ESF support; at least 164,000
persons entered employment after activation.

Regional & Urban PolicyRegional & Urban Policy
Results of ESF 2007-2013 OPs (ctnd)
Education, training and lifelong learning: 10% of total ESF (EUR 35 billion) for education
and training; 25.9 million participations in human capital
development measures 5.5 million low-skilled participated in lifelong
learningInstitutional Capacity Building: EUR 3.7 bn ESF allocated to efficiency of public
administrations and public services; ICB recognised as a goal.

Regional & Urban PolicyRegional & Urban Policy
State of play ESF/YEI programming
187 ESF/YEI OPs expected; 181 officially submitted, incl. 33 OPs covering YEI
5 OPs adopted (incl. 2 YEI dedicated OPs) Overall, close link between CSR and MS selection
of investment priorities for the ESF ESF continues to be the main employment and
human capital EU instrument, now boosted also by YEI for youth employment
More could be desired as regards funding allocations to Roma, social systems and PES reforms, education, and the ambition of public administration reforms.

Regional & Urban PolicyRegional & Urban Policy
Further information
ESF thematic publications 2014-2020:
Youth employment/YEI: http://ec.europa.eu/esf/BlobServlet?docId=450&langId=en
Promoting inclusive growth: http://ec.europa.eu/esf/BlobServlet?docId=445&langId=en
Promoting Good Governance: http://ec.europa.eu/esf/BlobServlet?docId=444&langId=en
Simplified cost options with the ESF in Italy:http://ec.europa.eu/esf/BlobServlet?docId=453&langId=en

Regional & Urban PolicyRegional & Urban Policy
6th Cohesion Report
Lewis DijkstraDeputy Head of the Economic Analysis UnitDG for Regional and Urban Policy

Regional & Urban PolicyRegional & Urban Policy
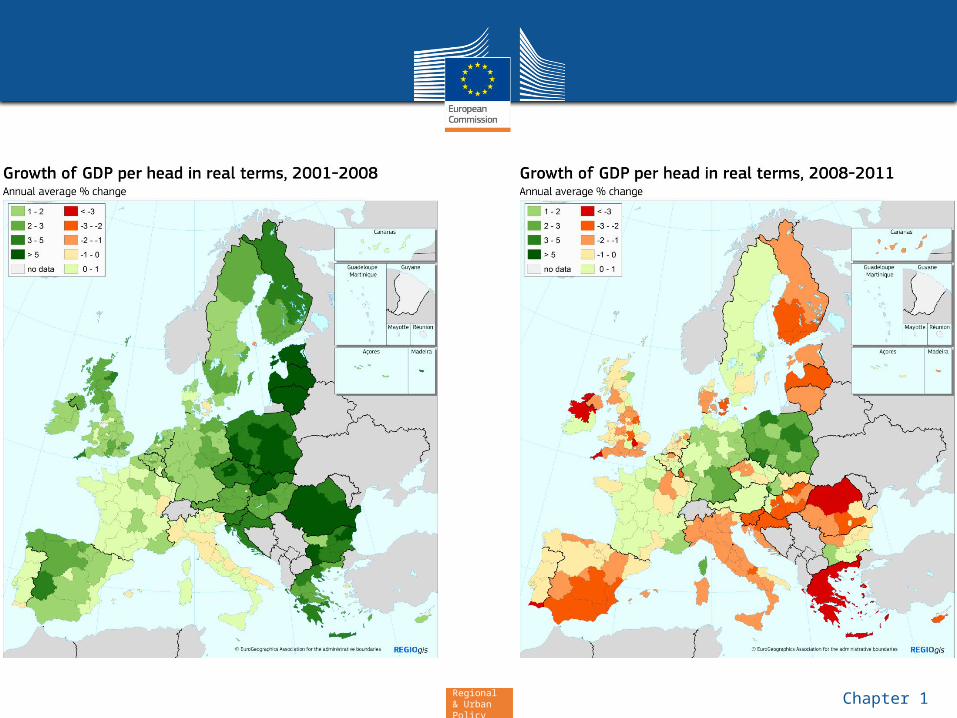
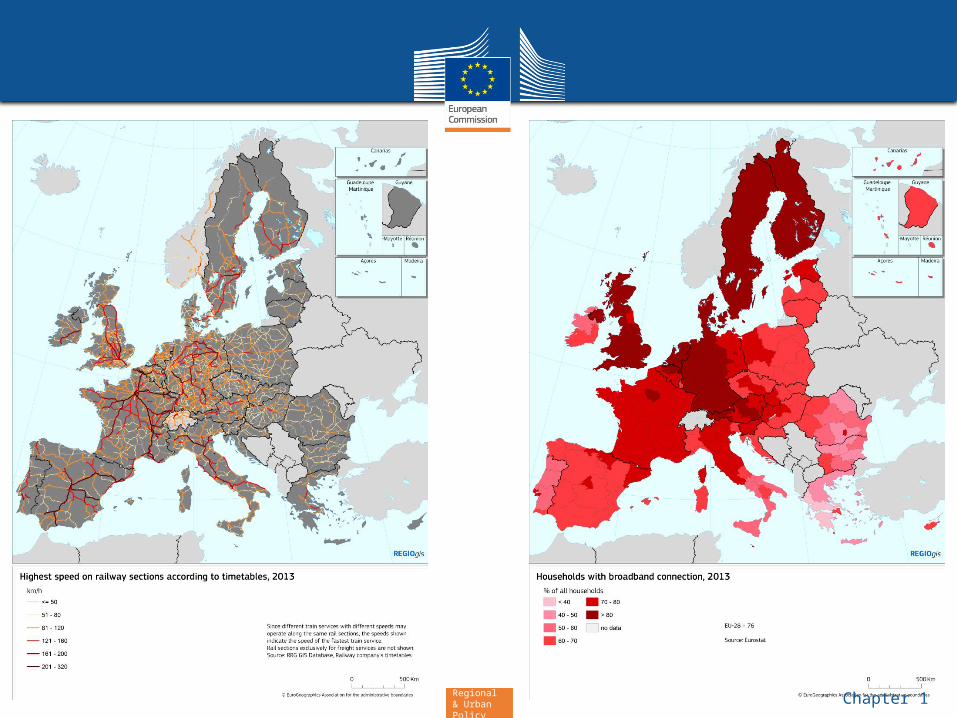
Chapter 1
Regional & Urban PolicyRegional & Urban Policy
Chapter 1

Regional & Urban PolicyRegional & Urban Policy
Chapter 1

Regional & Urban PolicyRegional & Urban Policy
Chapter 1
Regional & Urban PolicyRegional & Urban Policy
Chapter 1

Regional & Urban PolicyRegional & Urban Policy
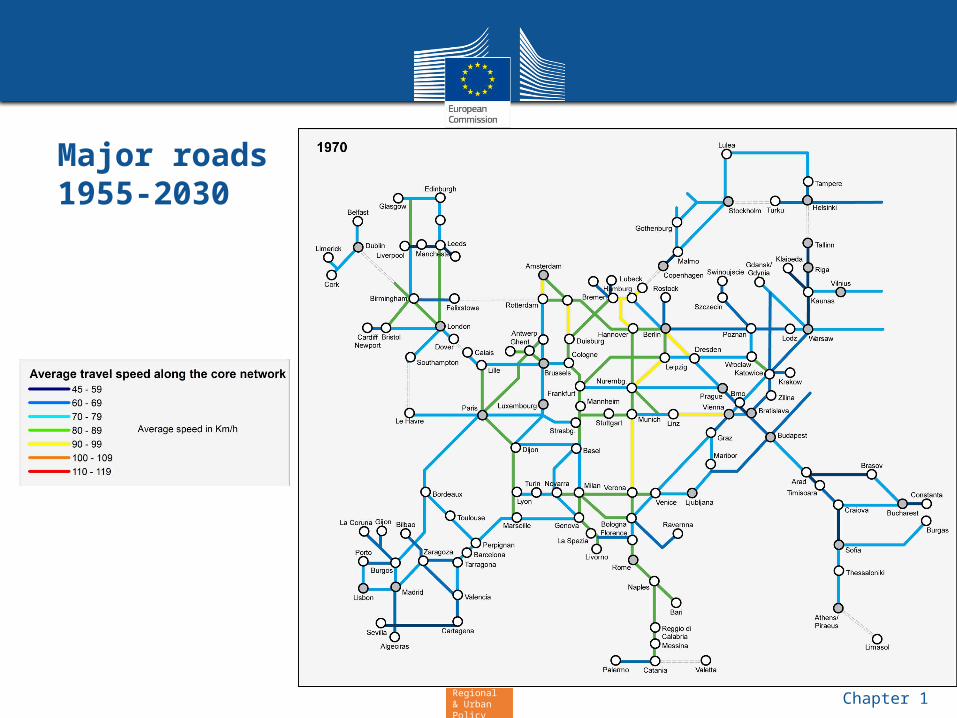
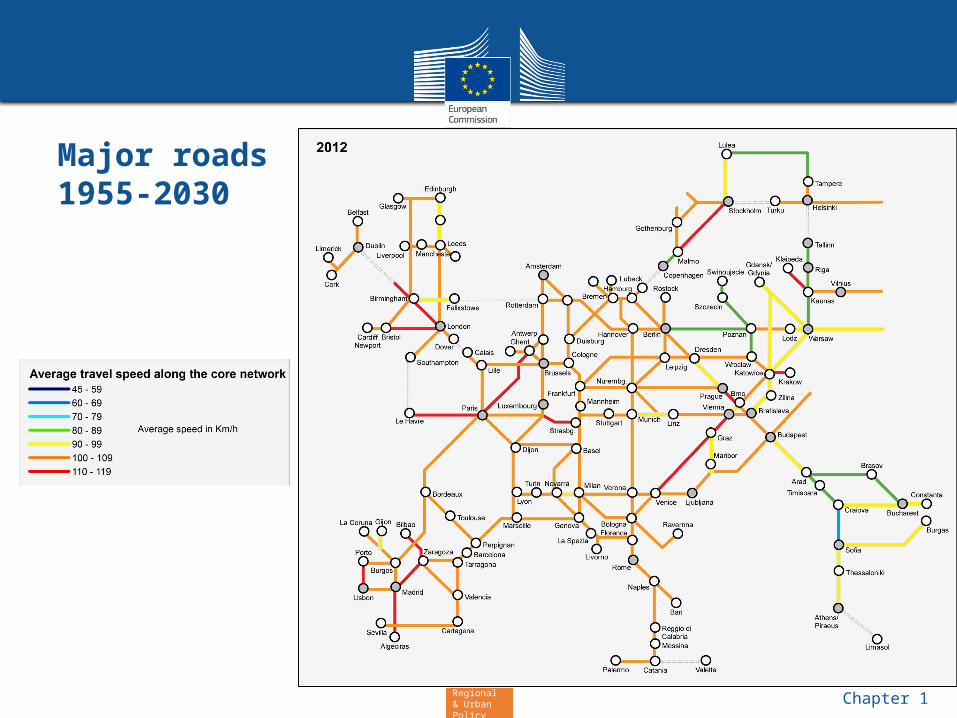
Major roads1955-2030
Chapter 1
Regional & Urban PolicyRegional & Urban Policy
Major roads1955-2030
Chapter 1

Regional & Urban PolicyRegional & Urban Policy
Major roads1955-2030
Chapter 1

Regional & Urban PolicyRegional & Urban Policy
Major roads1955-2030
Chapter 1

Regional & Urban PolicyRegional & Urban Policy
Major roads1955-2030
Chapter 1
Regional & Urban PolicyRegional & Urban Policy
Major roads1955-2030
Chapter 1

Regional & Urban PolicyRegional & Urban Policy
Major roads1955-2030
Chapter 1

Regional & Urban PolicyRegional & Urban Policy
Regional competitiveness
• Boosting competitiveness requires more investments in innovation, entrepreneurship, education, digital and physical networks and more exports & FDI
Chapter 1

Regional & Urban PolicyRegional & Urban Policy
Chapter 2
Regional & Urban PolicyRegional & Urban Policy
Chapter 2
Regional & Urban PolicyRegional & Urban Policy
Chapter 2

Regional & Urban PolicyRegional & Urban Policy
Chapter 3

Regional & Urban PolicyRegional & Urban Policy
Chapter 3

Regional & Urban PolicyRegional & Urban Policy
Chapter 3

Regional & Urban PolicyRegional & Urban Policy
Malt
a
Luxe
mbo
urg
Belgium
Cypru
s
Hunga
ry
Czech
Rep
ublic
Nethe
rland
s
Slovak
ia
United
King
dom
Poland
Irelan
d
Bulgar
iaIta
ly
Greec
e
Germ
anySpa
in
Croat
ia
Franc
e
Lithu
ania
Roman
ia
Sloven
ia
Eston
ia
Denm
ark
Portu
gal
Austri
a
Finlan
d
Latv
ia
Sweden
EU-28
0
5
10
15
20
25
30
35
40
45
50 Renewable energy consumption, 2006-2012
2006 2012
Target 2020
Sha
re o
f re
new
able
ene
rgy
in g
ross
fin
al e
nerg
y co
nsum
ptio
n, %
Chapter 3

Regional & Urban PolicyRegional & Urban Policy
Governance
Poor governance slows down Cohesion Policy implementation, reduces its impact and hinders economic growth and entrepreneurship
Chapter 5

Regional & Urban PolicyRegional & Urban Policy
Chapter 5

Regional & Urban PolicyRegional & Urban Policy
A growing source of investment
1976
1981
1986
1995
2004
2007
2012
0.00
0.05
0.10
0.15
0.20
0.25
0.30
0.35
0.40
0.00
0.05
0.10
0.15
0.20
0.25
0.30
0.35
0.40
CF ESF ERDF% of gross national income (GNI)
Cohesion Policy expenditure, 1976-2012
Source: DG BUDG, AMECO, DG REGIO calculations
EU-9 EU-10 EU-12 EU-15 EU-25 EU-27
Chapter 6

Regional & Urban PolicyRegional & Urban Policy
A stronger focus on key priorities
1989-1993 1994-1999 2000-2006 2007-20130
20
40
60
80
100
Technical assistance
Environment
Employment, educa-tion, social inclusion
Infrastructures (Transport, Energy, Telecom)Business support, R&D and innovation
% of total
Composition of Cohesion Policy investment in less developed re-gions, 1989-2013
Source: DG REGIO
Chapter 6

Regional & Urban PolicyRegional & Urban Policy
Europe 2020
• Less developed regions furthest removed from both EU and national 2020 targets
Chapter 6

Regional & Urban PolicyRegional & Urban Policy
Impact on EU economies
Evaluations have shown that cohesion investments have contributed to improving the structure of the EU economies by:
• enhancing the performance of enterprises, increase their investment and employment, particularly for SMEs.
• increasing firms activities in R&D and their capacity to innovate• improving public infrastructure• improving the matching between supply and demand on the labour market
At the macro level, model simulations show that Cohesion Policy has a significant impact on GDP, in particular in the Member States which are the main beneficiaries of the policy.
Chapter 7

Regional & Urban PolicyRegional & Urban Policy
• Cohesion Policy will significantly boost GDP per head in less developed regions
• The impact over time will spread to main trade partners
• Better core TEN-T network strengthens market integration and specialisation.
Chapter 8

Regional & Urban PolicyRegional & Urban Policy
Chapter 8
Regional & Urban PolicyRegional & Urban Policy
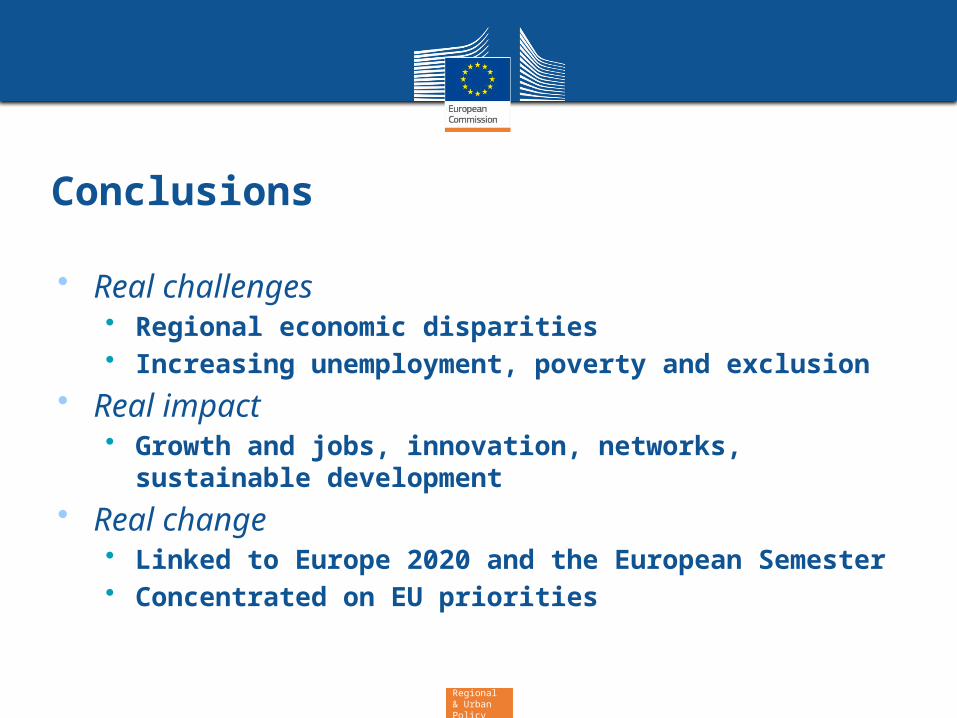
Conclusions
• Real challenges• Regional economic disparities• Increasing unemployment, poverty and exclusion
• Real impact• Growth and jobs, innovation, networks,
sustainable development• Real change
• Linked to Europe 2020 and the European Semester
• Concentrated on EU priorities


![Connectivity of sleep- and wake-promoting regions of the human ... · terior hypothalamus [2–10]. This hypothalamic region has direct anatomical connections with other wake-promoting](https://img.dokumen.tips/doc/110x75/5f7c658824f33d4ac6283ab8/connectivity-of-sleep-and-wake-promoting-regions-of-the-human-terior-hypothalamus.jpg)


