Embed Size (px)
Citation preview
regional transportation
·plan
southern california association of governments

regional transportation plan
1978 edition
_ ..... by
southern california aaaaciatian af governments
revlaed January 251 "1979
The Envlran"'entel Impact Report of the Plan Ia contained In 1!11 eeparete document

II
The Southern California Association of Governments ( SCAG) was formed by local elected officials in 1965 to deal with issues of regional concern. SCAG is a partnership of 1 ocal governments joined together in voluntary agreements under the Joint Exercise of Powers Section of the California Government Code. The Association is composed of six county governments -- Imperial, los Angeles, Orange, Riverside, San Bernardino, and Ventura -- and over one hundred fifty cities within these counties.
SCAG is designated by the State of California the Regional Transportation Planning Agency, responsible for preparing a Comprehensive Regional Transportation Plan.
The preparation of this report was financed in part through a grant from the U.S. Department of Transportation, Urban Mass Transportation Administration, under the Urban t1ass Transportation Act of 1964, as amended; the U.S. Department of Transportation, Federal Highway Administration, under the Federal Aid Hi Act of 1973, as amended; and
of California.

TABLE OF CONTENTS
LO Summary 1
2.0 Introduction 2-1
2.1 Purpose of the Plan 2-1
2.1.1 Guide to System Management and Development 2-1
2.1.2 Legal Requirements 2-1
2.2 Planning Process and Participants
2.2.1 Program Coordination
2.2.2 Subregional Coordination
2. 3 Plan Content
3.0 Issues and Prob·lems
3.1 Land Use
3.2 Air Quality
3.3 Energy
3.4 Access and Mobility
3.5 Allocation of Resources
3.6 Institutional Responsibilities
3.7 Technological and Operational Change
3.8 Phased Decision-Making
4. 0 Goa 1 s and Objectives
4.1 Comprehensive Goals of the Region
4.2 Regional Transportation Goals
4.3 Transportation Planning Objectives
4.3.1 Air Quality Objective
4.3.2 Energy Objective
4.3.3 Transit Ridership Objective
2-3
2-3
2-4
2-5
3-1
3-1
3-2
3-2
3-3
3-3
3-4
3-4
3-5
4-1
4-1
4-3
4-3
4-4
4-5
4-6

5.0 Policies
5.1 Multi-Modal Policies
5.1.1 System Planning Policies
5.1.2 Transportation System Management Policies
5.1.3 Ridesharing Policies
5.1.4 System Development Policies
5.1.5 Transportation/Air Quality Policies
5.1.6 Energy Policies
5.2 Automobile Policies
5.3 Transit Policies
5.4 Highway Policies
5.5 Airport System Policies
5.6 Non-Motorized Section Policies
5.7 Maritime and Railroad Policies
5.8 Financial Policies
6.0 Programs and Actions
6.1 Multi-Modal
6.1.1 Transportation Systems Management (TSM)
6.1.2 Transportation and Air Quality
6.2 Automobile
6.3 Transit
6.4 Highways
6.5 Airports
6.6 Non-Motorized
6.7 Maritime and Railroads
; ;
5-1
5-1
5-2
5-3
5-3
5-4
5-5
5-6
5-7
5-7
5-11
5-12
5-16
5-17
5-18
6-1
6-1
6-1
6-7
6-10
6-12
6-28
6-55
6-70
6-73

7. 0 Finance 7-1
8.0 Appendix A-I
A Technical Assumptions
A-1 Introduction A-1
A-2 Growth Forecast Pol icy A-1
A-3 Regional Airport System Element A-5
A-4 Travel Demand Forecasting A-9
A-5 Travel Forecast Mobile Source Emissions. A-12
A-6 Financing State Highways A-17
B Public Participation A-18
C Air Quality
D
E
F
G
9.0 Glossary
C-1 Air Quality Strategies, Tactics, and Measures
Transit Service Policies
Highway Evaluation Methodology
Subregional Plans
Airports of Regional Significance
i i i
A-20
A-23
A-24
A-25
A-26
9-1

FOREWORD
While transportation recommendations must be based on the best available infonnation, political decisions are ultimately required.- And these decisions must reflect the public will. When risks must be measured against benefits, when economic and environmental values must be weighted and balanced, the public has the right and the obligation to make its views known.
SCAG welcomes public participation, because informed and involved citizens and citizen groups are essential for action to improve our regional transportation system. The views, opinions, needs and desires of the public will continue to be sought as SCAG updates the regional plan.
What can you do to make a difference in the transportation planning process?
First of all~ get informed about local, regional and state transportation proposals, plans and programs. Once you have this basic information, the next step is to evaluate it within your own experience, based on where you live and travel.
Then, determine what you want in transportation, now and in the future. Take your ideas, requests and suggestions to your local elected officials, to planners~ or to others who are working on the problems.
Get involved with your neighborhood or community planning group. Find out who does this work in your area. Encourage civic and local organizations to have programs on transportation issues.
And be sure to let us know at SCAG how you feel about transportation. We invite your participation in public hearings, forums, workshops, and by writing or calling us. SCAG encourages public input and involvement --yes. and even prodding and constructive criticism of its regional planning program.
For further information. please contact the SCAG Community Relations Office.
The Southern California Association of Governments
600 S. Commonwealth Avenue, Suite 1000 los Angeles, California 90005
(213) 385-1000
i i i

RESOLUTION OF THE SOUTHERN CALIFORNIA ASSOCIATION OF GOVERNMENTS ADOPTING AMENDMENTS TO THE 1978 REGIONAL TRANSPORTATION PLAN
No. 79-::J.ZS-6
WHEREAS, the Southern California Association of Governments (SCAG) serves as the areawide planning agency for Southern California and has been Guly designated under federal and state la\.'1 as the agency responsible for regional transportation planning within its jurisdiction; and
WHEREAS, pursuant to this authority the SCAG Executive Committee adopted a Regional Transportation Plan on October 5, 1978; and
WHEREAS. an amendment has now been prepared for incorporation into the Regional Transportation Plan which address additional transportation issues;
NOW THEREFORE BE IT RESOLVED that the Executive Committee of the Southern California Association of Governments hereby adopts the 1978 Regional Transportation Plan Amendment.
BE IT FURTHER RESOLVED that the President of the Southern California Association of Governments is authorized to transmit the 1978 Regional Transportation Plan Amendment to the State of California in accordance with state law.
Passed and adopted by the Executive Committee of SCAG at a regularly adjourned meeting held this 2.s'th.· day of January, 1979.
Attest:
iv

RESOLUTION No. 79 -ISS- j;
SCAG EXECUTIVE COf1MITTEE CERTIFICATION OF THE FINAL ENVIRONMENTAL IMPACT REPORT SUPPLEMENT PREPARED FOR THE ADOPTION OF THE 1978 REGIONAL TRANSPORTATION PLAN Af!ENDMENT
WHEREAS, the Southern California Association of Governments has undertaken the preparation of an amendment to the Regional Transportation Plan pursuant to its responsibilities as the regional transportation planning agency; and
WHEREAS, an Environmental Impact Report (UR) was prepared on the i{egional Transportation Plan and certified as complete by the Executive Committee of SCAG on October 5, 1978, in compliance with the California Environmental Quality Act of 1970 {California Public Resources Code Section 21000 et. seq.); and
WHEREAS, CEQA requires that an EIR Supplement the prepared and considered by the Executive Committee of SCAG prior to its approval of the Regional Transportation Plan Amendment;
NOW THEREFORE BE IT RESOLVED that the Executive Committee of the Southern California Association of Governments hereby certifies the completion of the Final Environmental Impact Report Supplement for the 1978 Regional Transportation Plan Amendment pursuant to the California Environmental Quality Act of 1970 and declares that the Executive Committee has reviewed and considered the information contained therein prior to the approval of the Regional Transportation Plan Amendment.
Passed and adop.ted by the Executive Committee of SCAG at a regularly adjourned meeting held the zs..,. day of January, 1979.
1 i,jj· ~·-~'~£<>
,...James H. Wilson, President
Attest: f~ark Pisano, Executive Director
v

600 .Iouth CoM- Aveftue •JIIIto 1000 • l.oJ Angeler • California • 90005 • 213/385-1000
RESOLUTION ON THE FINOING OF CONSISTENCY BETWEEN THE REGIOti.~L TRANSPORTATION PLAN AND THE STATE IMPLEt~ENTAT!ON PLAN
Resolution No. 79 -lse-.q
WHEREAS, the Southern California Association of Governments (SCAG) is the designated Metropolitan Planning Organization for the area within its jurisdiction and, as such~ is responsible for the preparation and adoption of the Regional Transportation Plant and
WHEREAS, Section 176 of the Federal Clean Air Act, as amended, and Section 109(j) of the Federal Aid Highway Act, as amended, require SCAG to assess the consistency of the Regional Transportation Plan with the State Implementation Plan for Achieving and Maintaining National Ambient Air Quality Standards, and
WHEREAS, SCAG has acted to carry out this responsibility by insuring the consistency of the Regional Transportation Plan with the Air Quality Management Plan (AQMP), with the understanding that any final assessment must await approval of the AQMP by the Administrator of the U. S. Environmental Protection Agency;
NOW THEREFORE BE IT RESOLVED that the Executive Committee of the Southern Ca 1 iforn i a Association of Governments hereby accepts the report enti t 1 ed: "19i8 Consistency Assessment of the SCAG Regional Transportation Plan to the State Implementation Plan for .1\chieving and Maintaining National Ambient Air Quaiity Standards," attached as Exhibit "A" and made a part of this resolutior, by reference, as an accurate description of the status of current transportationrelated air quality improvement efforts within the SCAG region.
BE IT FURTHER RESOLVED that the Executive Committee hereby finds the 1978 Regional Transportation Plan to be consistent with the California State Implementation Plan for air quality (based upon the regional Air Quality Management Plan as noted above).
Passed and adopted by the Executive Committee of SCAG at a regularly adjourned meeting held this 25th day of January, 1979,
Attest:~ iJaF pi sana: ~ Executive Di'"ec"':.o:
vi
of Governments
1.0 Summary
2.0 Introduction
2.1 Purpose of the Plan
TABLE OF CONTENTS
Revised l/25/79
1
2-1
2-1
2.1.1 Guide to System Management and Development 2-1
2.1.2 Legal Requirements 2-1
3.0
2.2 Planning Process and Participants
2.2.1 Program Coordination
2.2.2 Subregional Coordination
2.3 Plan Content
Issues and Problems
3.1 Land Use
3.2 Air Quality
3.3 Energy
3.4 Access and Mobility
3.5 Allocation of Resources
3.6 Institutional Responsibilities
3.7 Technological and Operational Change
3.8 Phased Deci si on-Making
4.0 Goals and Objectives
4.1 Comprehensive Goals of the Region
4.2 Regional Transportation Goals
4.3 Transportation Planning Objectives
4.3.1 Air Quality Objective
4.3 •. 2 Energy Objective
4.3.3 Transit Ridership Objective
4.3.4 Rideshare Objective.
vii
2-3
2-3
2-4
2-5
3-1
3-1
3-2
3-2
3-3
3-3
3-4
3-4
3-5
4-1
4-1
4-3
4-3
4-4
4-5
4-6
.4-7

Revised 1-25-79
5.0 Policies • 5-1
5.1 Multi-Modal Policies 5-1
5.1.1 System Planning Policies 5-2
5.1.2 Transportation System Management Policies 5-3
5.1.3 Ridesharing Policies • • 5-3
5.1.4 System Development Policies 5-4
5.1.5 Transportation/Air Quality Policies 5-5
5.1.6 Energy Policies 5-68
5.2 Automobile Policies 5-7
5.3 Transit Policies 5-7
5.4 Highway Policies • •
5.5 Airport System Policies
5.6 Non-Motorized .Section Policies
5.7 Maritime and Railroad Policies
5.8 Financial Policies •
5.9 Institutional Arrangement Policies
6.0 Programs and Actions
6.1 Multi-Modal
6.1.1 Transportation Systems Management (TSM)
Rideshare Program (TSM).
6.1.2 Transportation and Air Quality
6.2 Automobile
6.3 Transit
6.4 Highways
6.5 Airports
6.6 Non-Motorized
6.7 Maritime and Railroads
viii
•
5-11
5-12
5-16
5-17
5-18
.5-20
6-1
6-1
6-1
6-3
6-7
6-10
6-12
6-27
6-55
6-70
6-73

Revised 1-25-79
7.0 Finance 7-1
7.A Institutional Arrangements • 7-Al
8.0 Appendix • A-I
A Technical Assumptions
B
A-1 Introduction A-1
A-2 Growth Forecast Policy A-1
A-3 Regional Airport System Element A-5
A-4 Travel Demand Forecasting A-9
A-5 Travel Forecast Mobile Source Emissions. A-12
A-6 Financing State Highways
Public Participation
•
•
A-17
A-18
C Air Quality
D
E
F
G
H
I
J
K
L
C-1 Air Quality Strategies, Tactics, and Measures
Transit Service Policies
Highway Evaluation Methodology
Subregional Plans
Airports of Regional Significance
Sections Transit Monies Distribution Agreement
Finances Element Major Assumptions
Notes for Financial Tables 1-6
Notes for A-3
Capital Operating and Maintenance Costs for the AQMP Recommended Measures
A-20
A-23
A-24
A-25
A-26
A-27
A-28
A-29
A-37
A-38
M Key SCAG Documents Contributing to the Annual RTP A-39
N
0
9.0 Glossary
Selected Subregional Plans and Reports used in RTP Development
Reasonably Available Control Measures
ix
A-41
A-46
.9-1


1.0 INTRODUCTION
The Southern California lifestyle is built on travel. Our homes and businesses are spread across 1,600 square miles of urbanized area; the reg.ion as a whole occupies 38,000 square miles. Our 10 million residents have over 5-1/2 million autos, and drive them daily on the region's 3,700 miles of freeways and highways, and thousands of miles of surface streets. Each day our public transit system carries over one million passengers on over 3,400 buses. In one recent year, the region's six major air-carrier airports moved some 29 million passengers and 750,000 tons of cargo. And the many general-aviation airports in the region house over 11,000 private aircraft used for business and pleasure.
For recreation, the region also has miles of bikeways, equestrian and hiking trails, and numerous marinas for pleasure boating.
Besides moving people, our transportation system moves goods and services. The highway system serves trucks as well as passenger vehicles. The three major ports of the region (Los Angeles, Long Beach and Port Hueneme) handled $13 billion in trade in 1974 -- 30% of the total trade at all West Coast ports. Three major rail roads move people and freight through the region -- the Southern Pacific; the Union Pacific; and the Atchison, Topeka, and Santa Fe.· Southern California has the busiest rail market in the Western United States.
All of these facilities and the people who operate them make up the region 1 s complex transportation system. How we work, play, and live depends in large part on how well that system works.
Unfortunately, it doesn 1 t work as well as it used to. We see increasing traffic congestion, more burning of energy, and more air pollution. The costs of just keeping up the existing system are skyrocketing -- and there are not enough tax dollars to fund all the new programs the region wants. We must decide very carefully how to spend our money.
The 1978 Regional Transportation Plan focuses on approaches to solving these and other problems. Mobility, energy consumption, air pollution, financing, project priorities -- these are some of the major transportation issues that SCAG is dealing with.
!.I CRITICAL TRANSPORTATION ISSUES
SCAG 1 s first major effort in transportation planning carne in 1974, when eight major transportation issues were identified:
Land Use
How do our land use decisions affect the provision of transportation facilities and services, and vice versa?
-I-

Air Quality
How will changes in the transportation system contribute to attainment of clean air?
Energy
What changes in the transportation system will best conserve energy?
Access and Mobility
How can the transportation system provide better access to opportunities, and equitably improve people 1 s mobility?
Allocation of Resources
How can our 1 imited funds provide the greatest benefit, and how can additional funds be found?
Institutional Responsibilities
What institutions, having what responsibilities, can best provide and operate the system?
Technological and Operational Change
How can the system best incorporate new technologies?
Phased Decision-Making
How can decisions meet current transportation needs and yet keep our options open for the future?
1.2 THE REGIONAL TRANSPORTATION PLAN
The Regional Transportation Plan is updated periodically, to keep pace with changes in legal requirements, new technology, available funding, and so on. This RTP -- the fifth in a continuing series -- is built on policies and actions previously adopted (in the Critical Decisions Plan for Transportation, 1974, and the RTPs of 1975, 1976, and 1977), and includes new policies and actions adopted this year. This current Plan will, in turn, be refined and amended in future updates.
The Regional Transportation Plan must fulfill a number of state and federal legal requirements. These require that the region prepare a transportation plan which will include both short- and long-range elements, and result in a balan-ced and coordinated transportation system. Although a specific definition of balanced transportation is arguable, generally this RTP uses the tenn to mean: the provision of services and facilities in a proper proportion, by mode, necessary for the development of an equitable and efficient transportation system.
-2-

Other legal responsibilities to be met include the Clean Air Act. The Act requires each state to adopt a plan that will achieve and maintain acceptable air quality, using measures to control transportation, if necessary. This RTP contains policies and actions that specifically address air quality; these -- a1 ong with plans for controlling pollution from causes other than transportation -- will make up the regional element of the statewide air-quality plan.
The Regional Transportation Plan is not intended to be a builder's blueprint; rather, it is primarily a policy document that sets out clearly the ideas that will guide the future development of the transportation system. It i dent ifi es the direct ions in which the region must move. It says which kinds of projects are acceptable to the region and, by implication, which are not. It sets criteria by which each project can be judged, and defines what each should accomplish. The force of its policies derives from the fact that they are agreed upon by those representing every member government in the region, and the fact that only those projects and programs accepted into the Regi anal Transportation Plan become eli gi b 1 e for funding by the state and federal governments.
Each year, the RTP fonns the basis for development of the Transportation Improvement Program, and is used in reviewing federal grant applications and projects using local Transportation Fund (SB 325/821} moneys.
1.3 GOALS AND OBJECTIVES
Five broad goals for transportation have been-adopted:
1. To deve 1 op a transportation system wh; ch wi 11 support the comprehensive goals of the region, taking into account the effect of mode selection, location, and time upon the physical, social, economic, and organizational envirorvnent.
2. To create a balanced transportation system integrated with planned land use to provide effective mobility for all people and efficient and economic movement of goods.
3. To minimize the need for long distance intraregional travel, particularly work trips, by guiding the development of the region to create self-sufficient metros having balanced service facilities, employment, and housing.
4. To deve 1 op for the region a transportation system compat i b 1 e with the environment, using the available resources wisely, promoting the aesthetic beauty of the region, and avoiding undesirable environmental changes.
5. To develop a transportation system that is financially, legally, and politically feasible, has broad public support, and has a commitment to its implementation by elected officials and those providing transportation services.
-3-

Revised 1/25/79
In conjunction with these overall goals, the 1978 RTP establishes four quantified objectives for the regional transportation system:
!. Air Quality
Mobile sources at a minimum will reduce emissions (expressed) in tons per day) by 1987 according to the table 4.3-1 on p 4-4.
2. Energy
Reduce fuel consumption by the transportation system equivalent to a reduction of vehicles miles traveled of 5% in each five-year period from 1980 to 1995.
3. Transit
Increase transit ridership, currently 3.36%, to 6% of person trips in the region by 1ggo.
4. Rideshare
1.4
A) Carpool/vanpool
By 1987 increase the average light-duty vehicle occupancy for the daily, freeway/non-freeway, home to work trip from 1.2 to 1.3
B) Transit
By 1990 increase transit ridership by 755,000 new transit persontrips daily.
POLIGIES AND ACTIONS
The Plan suggests various means of attaining the region•s transportation objectives. These take the fonn of po 1 i ci es and actions which guide decisions on the following elements of the system: automobiles, public transit, airports, non-motorized modes, highways, maritime, and ra i 1 roads.
The basic theme running through the Regional Transportation Plan's policies and actions is that of 11 improved system management 11
• In each section, actions are divided between transportation system management and system development.
Transportation system management proposals encourage better use of the existing system by increasing its people-carrying capacity. Measures include ridesharing (carpools, vanpools~ transit), and increasing aircarrier load factors. System management methods have lower capital cost than system development strategies~ and usually can be implemented more quickly.
System development proposals include construction of new facilities . such as roadways~ rapid transit, expanded ports, and new airports. The costs of system development (e.g.~ capital construction) have increased much faster than revenue from local, state~ and federal sources. This makes system development harder to finance than ever before. Since our already extensive system costs more and more each year just to maintain and operate, we should plan further development only when the system we already have cannot be made to meet our needs.
-4-

1.4.1 Multi Modal Program Development
The multi-modal section describes two specific planning approaches that transcend most of the transportation modes:
o Transportation System Management (TSM), which includes ridesharing, and
o Air Quality ManagemPnt.
Each planning approach leads toward attainment of the goals adopted by the region. For example, TSM attempts to make the most out of the system we have by improved management and operat i o na 1 efficiency. Ri deshari ng, one TSM technique, tries to maintain mobility without adding more cars to the roads. The air quality management planning activities seek to improve air quality-- in part, by reducing the pollution caused by transportation,
Understanding the integration of these strategies throughout the plan is important, since many actions support both programs. For example, providing exclusive lanes for transit, vanpools, and carpools is basically a strategy that encourages ridesharing. However, when two or more people who once· drove separately share a vehicle, there is also less congestion and vehicle pollution. Thus the exclusive lane also meets the aims of the transportation management and air quality approaches.
A Ridesharing Plan and an Air Quality Maintenance Plan are scheduled for adoption and amendment into the RTP in February of 1979.
I. 4.2 Automobile Policies and Actions
On the average, Southern Californians make over three trips a day --96.6% of them by car. In fact, we have become accustomed to driving everywhere, often using our- cars when we don't really have to. All these trips add to air pollution, traffic and energy consumption. To meet our clean-air and fuel-conservation objectives, we must learn to use our 5-1/2 million automobiles more wisely.
We have to examine how much each of us contributes to the problems, and see where we can cut back. For example, the RTP recognizes that automakers have a responsibility to develop clean-burning engines that use less fuel. But it .also recognizes that we cannot meet the federal airquality standards through cleaner engines alone. We will simply have to drive less, particularly as the population increases.
The RTP supports ridesharing to maintain mobility, reduce congestion, clean the air, and reduce consumer costs. Mandatory inspection and maintenance of light-duty vehicles (cars, vans, small trucks) is endorsed to ensure that engines don't waste gasoline or dirty the air. Inspection and maintenance is also a strategy required by the Air Quality Management Plan, necessary to allow an extension from 1982 to 1987 for meeting the federal standards for carbon monoxide and photochemical oxidant.
-5-

1.4.3 Transit Policies and Actions
Over a million of the region 1 s residents ride transit every day, especial-1 y for home/work trips at peak hours. The SCAG region has a number of different fonTis of transit, including fixed-route bus service, dial-aride, and some charter bus service. Paratransit service (taxis, vans) is provided by many private operators, and some local governments supply specialized services to the elderly and handicapped. AMTRAK offers rail transit between Los Angeles and San Diego.
About 850,000 people use the buses of the Southern California Rapid Transit District daily, while over 60,000 use the Orange County Transit District service. The remainder use transit provided by other counties or by cities, or services such as dial-a-ride, taxis or vans, and Amtrak.
Despite these impressive numbers, only 3.36% of daily trips are made on transit. The RTP proposes to increase this number to 6% -- which would help to cut down vehicle miles traveled.
To attract new ride~s, SCAG proposes various measures to improve and increase transit serv1ce -- for example, better coordination among transit operators. Transit service standards and policies have also been adopted to help improve service levels and lower costs.
The Plan supports preliminary work on the Regional Transit Development Program. This program initially calls for the establishment of an areawide bus-on-freeway system; construction of a people-mover system in downtown Los Angeles; and development of a grade-separated rapid transit facility running from downtown Los Angeles through North Hollywood. Portions of the RTDP will affect San Bernardino, Riverside, Orange, and Los Angeles counties.
The Plan also supports preliminary engineering for an exclusive transit guideway in Orange County, and transit improvements in the Los Angeles/San Diego corridor. Also urged is the expansion of the region's local service fleet by several hundred buses over the next five years.
Policies aimed at better service for ,the elderly and handicapped would increase the number of transit vehicles easily boardable and usable by the physically handicapped. Transit passengers' safety and security needs would be met through such measures as improved physical planning, procedural guides for transit employees, and improved communication equipment,
-6-

1.4.4 Highway Policies and Actions
The region 1 s vast network of highways moves more people and goods than any other segment of the transportation ·system. Drivers reach most destinations quickly and easily on the 1,455 miles of freeways and 2,282 miles of conventional state highways in the region. But the system has growing problems.
More and more vehicles are using the highway system, creating congestion, adding to air pollution, and consuming growing amounts of our precious energy supply.
To cope with these problems, the Plan advocates both transportation system management (TSM) measures and further system development. TSM measures are favored over system development wherever possible, due to their lower capital costs and greater ease of implementation. Specifically, the RTP recommends that highway projects be funded in the following order of priority: first, maintenance and rehabilitation, and second, operational improvements and new construction.
The RTP urges that Caltrans implement projects necessary to maintain and rehabi1 itate the system, or to make it safer. To ease congestion, the RTP supports traffic-operations improvements such as synchronized signals, improved striping, and upgrading of routes that can serve as alternatives to freeway travel. In addition, SCAG supports the increased use of high-occupancy vehicles (buses, carpools, vanpools) to reduce pollution and energy consumption. The Plan rec001mends that such vehicles receive preferential treatment on the highway system, including special reserved freeway lanes and bypass facilities at metered on-ramps.
In terms of system development, the RTP urges completion of needed new construction. With in the region • s freeway system there are severa 1 .. essential gaps .. , which are links between two completed portions of a freeway, expressway, or major route.
There are a 1 so numerous areas in the region where new freeways or major upgrading may be needed. Potential highway-system projects, now being evaluated, will be priority-ranked for possible construction in the future.
-7-

1. 4. 5 Airport Policies and Actions
One out of three persons who want to fly in 1995 won't be able to, if the region's expected air-travel demand for 1995 is reached and our airports have not been expanded. The RTP recommends that all six of the region's major airline airports expand to the maximum capacity currently planned.
Many airports in the region cannot grow beyond certain 1 imits due to regulations governing noise, environmental impacts, use of airspace, and so on. The proposed Palmdale International Airport could relieve much of the expected overcrowding.
The RTP recommends that undeveloped land around new airports be planned for uses compatible with airport operations, and that all areas which benefit from new facil jties share in the costs of building them. Plans for new or expanded airport facil Hies must~ of course. meet state and fed era 1 env i ronmenta 1 standards.
Another worsening airport problem is ground access. One solution would be to process air passengers at remote tenni nal s and then take them to the airports in group transport. The RTP recommends that such terminals be planned for and phased in as needed.
1.4.6 Non-Motorized Modes Policies and Actions
Southern California's climate allows a wide range of leisure pursuits. Many such activities -- walking, bicycling~ horseback riding, hiking -require trails or special lanes which are part of the transportation system. The RTP Non-Motorized Section concerns itself with these modes.
The initial policies deal primarily with bicycling~ which could serve many of our trips. All of the counties and 80% of the cities in the SCAG region have developed plans for bikeways, and the RTP recommends that local governments encourage and promote greater bike use. For example, safe bicycle storage should be provided at all major destinations, and cities and counties should require bike-storage facilities in large public and private buildings~ and at bus tenninal facilities. The RTP also favors modifying some streets and highways to provide bicycle lanes. These actions, and programs of biker/driver education and bike-law enforcement, should promote a safe environment for cyclists and encourage the enjoyment of this useful mode.
-8-

1.4. 7 Maritime and Rail roads
The SCAG region has three major ports -- Los Angeles, long Beach, and Port Hueneme -- and is served by three major railroads. Except for AMTRAK, which provides passenger service within the region, both ship and rail modes carry mostly freight. Ports are public facilities which gear their _operations to the demands of the private sector. While both rail and sea transport are privately owned, each has a considerable impact on public transportation facilities, since the freight they carry is at some point trucked on public highways. Each also has an effect on the region•s environment. Thus both modes must be considered in a regional transportation plan.
While approving the ports• Master Plans for development to 1990, SCAG proposes to take a more active role in reviewing individual projects. It will do this by increasing its contacts with Harbor Commissioners and Harbor Districts, and by strengthening its review of projects' Environmental Impact Statements.
Working with AMTRAK to increase the level of passenger service in the Los Angeles/ San Diego travel corridor, SCAG will also support rail passenger service in other corridors as an alternative to long-distance commuting by automobile.
The connection points that ports and rail roads have with other modes {especially highways) will be carefully considered in future RTP updates. Policy guidelines for incorporating rail, port, pipeline, and truck considerations will be developed in future regional plans.
1.5 FINANCIAL SECTION
The financial element of the plan presents a summary of existing sources of funds to provide transportation services and facilities in the SCAG region. Financial need for the future is then projected on three levels:
a financially constrained plan {below current service levels),
a maintenance of current services level plan {keeping service as is),
an unconstrained plan {expanding levels of service).
For transit, the implications of a financially constrained plan vary from county to county. In counties other than Los Angeles, moderate system expansion is possible even in the constrained case. However, in Los Angeles, if no added funds are found to support SCRTD's operations, further service cutbacks and fare increases will be necessary to maintain a balanced budget. The maintenance of current services level transit plan is higher than the constrained plan by the amount necessary to fund SCRTD's operations deficit.
-9-

The financially unconstrained transit plan incorporated all the system expansion envisioned by the Regional Transit Development Program. Although additional federal funds will be available for some of the added capital expenses, and fare revenues will be higher due to increased patronage, an additional $1,600-million will be needed to fund the program --an amount which could be raised by a 1/3 cent sales tax increase.
The financially constrained highway program is based on the assumption that the SCAG Region is able to obtain the legal maximum of capital improvements. The 11 expansion 11 unconstrained alternative calls for an additional $700-million in improvements. This sum could be raised by imposition of a 1.4 cent gasoline tax if all funds generated by the region were returned to it.
A financially constrained Streets and Roads program will not be adequate to fully fund maintenance and rehabilitation as shown to be needed in the maintenance of current services level plan. To continue Streets and Roads Programs at the historical level, maintenance/rehabilitation wi 11 require an additional $800 million, equivalent to a 1.6 cent gas tax increase.
-10-

introduction

2.0 INTROOUCTI ON
2. I PURPOSE OF THE PLAN
The purpose of the Regional Transportation Plan (RTP) is two-fold. It must define the course of action Southern California should take to achieve a balanced transportation system for both goods and people, and it must satisfy several state and federal requirements.
2.1.1 Guide to System Management and Development
The Plan•s main purpose is to guide the region in developing a balanced transportation system. This system must: 1) serve all population groups and satisfy critical transportation needs; 2) combine existing and new modes into a single, coordinated system; 3) protect the environment; 4) use available revenues for the greatest benefit; and 5) help guide the patterns of regional growth by supporting planned land uses.
The RTP is not a detailed blueprint of the transportation system of the future. Rather, it is a policy document which provides a framework for developing a regional system. The Plan identifies regional transportation goals and objectives; sets policies from which projects can be developed, and against which proposed projects can be evaluated; outlines actions to be implemented; and presents a plan for financing programs and projects.
Projects to be implemented in the short term are listed in the Transportation Improvement Program (TIP). The RTP (planning) and TIP (programming) complement one another. Policies and actions in the RTP fonn the basis for development of, and -inclusion of projects in, the TIP. The TIP 1 s specific projects implement the RTP in the short term.
2 .!. 2 Legal Requirements
The Plan responds to many legal requirements. Changes in the requirements often affect the degree of emphasis placed on specific issues in the RTP.
AB402 of 1977* requires that designated transportation planning agencies (e.g., SCAG) shall prepare a regional transportation plan
*
"directed at the achievement of a coordinated and balanced regional transportation system, including, but not 1 imited to, mass transportation, highway, railroad, maritime and aviation facilities and services. The plan shall be actionoriented and pragmatic considering both the short- and long-term future and shall present clear, concise policy guidance to local and state officials ...
Chapter 1106, Statutes of 1977
2-1

The law requires the plan to have policy, action, and financial elements. Adoption procedures are described. The first plan is to be forwarded to the California Transportation Commission by October 1, 1978, and plans are to be adopted every two years thereafter.
SCAG has worked with Caltrans, other regional agencies, and local governments to help develop the guidelines on RTP preparation adopted by the California Transportation Commission on May 18, 1978.
Federal regulations, issued jointly by the Federal Highway Administration ( FHWA) and the Urban Mass Transportation Administration ( UMTA), a 1 so require the development of a transportation plan consisting of short-range and long-range elements. This plan resulted from a continuing, cooperative and comprehensive planning process by SCAG, local agencies, and the state, as required under federal law.*
SCAG is the agency responsible under federal and state 1 aw for carrying out the regional transportation planning process, and the 1978 RTP meets this responsibility in part.
The Plan addresses other legal responsibilities. For example, the Federal Clean Air Act requires that each state adopt a plan to achieve and maintain air quality -- using, when appropriate, transportation control measures. The 1978 RTP contains policies and actions directed at air quality. These, combined with pollution control programs for areas other than transportation, make up the regional element of the statewide plan to be prepared by the California Air Resources Board.
The Plan meets the UMTA requirement that transit services for the elderly and handicapped be improved.
The RTP wi 11 be the basis for deve 1 opment of the Transportation Improvement Program, and will be used in reviewing federal grant applications and projects using Local Transportation Fund (SB325/821) moneys.
• These regulations detail responsibilities for metropolitan pTanning organizations. They also include instructions for the preparation of the Transportation Improvement Program, the Unified Work Program, and the Transportation System Management element, as well as procedures for certification. See also 23 USC 105, 134(a) and 135(b); 49 USC 1602, 1603(a), 1604.
2-2

2.2 PLANNING PROCESS AND PARTICIPANTS
In the SCAG region, every level of government and many special-purpose entities are involved in transportation planning. SCAG, the regional planning agency, is designated by the federal and state governments to coordinate transportation plans across geographic boundaries, and to coordinate transportation plans with other types of plans, such as those for land use and the envirorrnent.
2.2.1 Program Coordination
SCAG is responsible for regional planning in many areas besides transportation -- e.g., air quality, water quality, housing, and human services. These activities are coordinated. For example, each program area uses the Development Guide's growth forecast policy. And, as environmental planning has been emphasized, the many programs have begun joint planning activities. For example, a single Transportation Control Plan is being developed for both the RTP and the Air Quality Maintenance Plan (AQMP).
Transportation Planning
In the SCAG region, every level of government, n1any special purpose agencies, districts, and commissions are involved in transportation planning activities. These agencies cooperatively plan, develop, and implement the most appropriate system for the. region.
SCAG
SCAG is the federal- and state-designated regional transprtation planning agency for six Southern California counties: Imperial, Los Anyeles, Orange, San Bernardino, Riverside, and Ventura. As part of its responsibility, SCAG conducts regional transportation planning and coordinates subregional transportation planning.
SCAG encourages local govermnents to participate in preparing their mm subregional transportation plans, to ensure that local needs are addressed. When consistent with regional policies-- themselves fon.Julated in cooperation with subregional agencies and com~o1ittees -- recommendations are included in the RTP.
The state is also actively involved in regional transportation planning through the California Department of Transportation. -Close coordination, both technical and policy, are essential. A close working relationship exists at the technical level with the three CALTRANS Districts in the SCAG region. CALTRANS sits (ex officio) on the SCAG Transportation and Utilities Committee, a policy advisory committee for SCAG. The California Air Resources Board also has an ex officio member on the Transportation and Utilities Committee to strengthen coordination between transportation and air quality.
2-3

The transportation eler~ent of the AQ~~p will be the Transoortation Control Plan for the region. It will be amended into the Regional Trans~ortatiun Plan upon adoption of the AQf1P, to ensure confonnity bet\leen the two plans.
County Transportation Commissions
legislation (AB 1246) passed in 1976 established County Transportation Comrnissions in Los Angeles, Orange, San Bernardino, and Riverside counties. These Corrn,Jissions began to function in January, 1977. The governing board of each Commission is composed primarily of County Supervisors and Councilmer:Jbers. The Commissions 1 prir.1ary role relates to short-range planning and programming, with specific resvonsibilities identified in 1 aw.
The r~ajor responsibilities of the Commissions include but are not limited to: coordination of the operation of public transportation services within the County; approval of plans for public mass-transit systems or projects \-Jhich confonn to the Regional Transportation Plan; carrying out shortrange capital and service planning which is directed towards the development and approval of a short-range three- to five-year transportation improvement program, with an annual updated element reflecting all transportation capital and service priorities. This program shall contain all projects utilizing federal and state highway and transit funds, as well as any public mass-transit guideway !)rojects. The program shall be consistent with the- Regional Transportation Plan and is submitted to SCAG for incorroration into the Regional Transportation Improvement Programs.
2.2.2 Subregional Coordination
Coordination is required between agencies and across geographic boundaries. Subregional plans {Appendix F) were reviewed in preparation of the RTP for the following purposes:
o To identify major issues, problems, and concerns of the local agencies;
o To determine if there were any major inconsistencies between the policies, goals, and actions of the local agencies and the RTP;
o To ensure that the concerns of the subregional agencies are reflected in the RTP update.
2-4

2 .3
PLAN CONTENT
The 1979 RTP is in three documents: Systems Management Report, and (3) an
Chapter 1 contains the summary.
Revised 1/25/79
(1) The Plan, (2) A Transportation Environmental Impact Report.
Chapter 2 of the Plan covers the purpose of the Plan, its process and participants, as well as an overview of Plan format.
Chapter 3 details major transportation issues and problems (the primary focus for the RTP's development).
Chapter 4 presents the comprehensive planning aims that· underlie transportation goals, policies, and actions. Also given are the transportation goals and the objectives identified as targets for the Plan.
Chapter 5 contains both modal and multimodal policies, which lead to methods for realizing the Plan's goals and objectives.
Chapter 6 details programs and actions for either system management or system development. Those for Transportation System Management (TSM} are designed to make better use of the existing system. TSM actions are usually low-capital, an can be implemented in the short tenn. System development actions generally involve expanding or increasing the system•s capacity, and are capital-intensive.
Chapter 7 describes the financial plan: the overall costs, revenues. and J financial recommendations.
Chapter 7A describes institutional arrangements.
The Environmental Impact Report (EIR}, published separately, su11111arizes the combined impact of all the recommendations in the 1978 Plan in six areas: 1} natural environment; 2) land use and urban fonn; 3) economy; 4} social environment; 5) air quality; and 6) energy. The overall Plan could affect regional development patterns, employment, auto mobility, and energy consumption. Individual recommendations could have local impacts on land use, social envirorrnent, air quality, and land values; these are also examined, so that the impacts of transportation improvements and management strategies can be seen. This system-level EIR does not replace detailed environmental studies of projects, or EIRs that address local impacts of specific proposals.
The Transportation Systems Management report is also published separately and is an elaboration on TSM tactics contained in the RTP.
2-5
{

issues and problems
•

3.0 ISSUES AND PROBLEMS
As part of the Regional Transportation Planning process, future travel needs are projected, and the funds likely to be available for transportation are estimated. These data indicate that future transportation needs (1990-95) far exceed the region's ability to finance them, given present resources. The Regional Transportation Plan is prepared with the above concern in mind. Specifically, the Transportation System Management Element which contains the Ridesharing actions is directed at more efficient use of the system we have, through better management and operation of our transportaiton network.
SCAG's transportation planning recognizes eight key problem areas: {1) land use, (2) air quality, (3} energy, (4) access and mobility, (5) allocation of resources, (6) institutional respon5ibil ities, (7) phased decision-making, and (8} technological and operational change.* The first four problems must be addressed to make the system ccrnpatible with the environment and provide efficient service. The others pertain to the responsibilities of developing the system over time. These eight problems dictate the approaches used to develop the system.
3.1 LAND USE
How do our land use decisions affect the provision of transportation facilities and services, and vice versa?
Of all the various factors which influence travel, the arrangement of land uses is probably the most important and yet the most difficult for which to measure travel demand influences.
The advent of the mass-produced automobile heralded a change in the geographic arrangement of urban uses. The detached single-family home was made possible, and as a result large areas of relatively low-density residential development were created, serviceable primarily by the auto.
These land-use trends facilitated by the automobile have worked in a self-sustaining cycle for many years. Recently increasing costs for both housing and transportation have created interest for infilling vacant urban land and the creation of subregions where activities such as work and home life could be accomplished without a long commute trip. The arrangement of land uses can have a dramatic effect on an ability to increase use of alternative means of transportation to the auto (i.e., transit, ridesharing, walking, bicycling) and thus conserve energy, reduce pollution, and reduce transportation user costs.
*Critical Decisions Plan for Region~ Transportation- 1974 (SCAG)
3-1

3.2 AIR QUALITY
How will changes in the transportation system contribute to attainment of clean air?
In one year of average driving, most cars emit over 600 pounds of pollutants. Short trips increase the pollution rate because there is more starting of a cold engine. Over 50% of vehicle hydrocarbon emissions, 60% of carbon monoxide, and 68% of nitric oxide emissions come from cars.
In Southern California, air pollution cost $350 million in 1970, in damage to health, crops and materials. It is dangerous for some people with respiratory ailments to walk or exercise when pollution is high. Even moderate amounts of pollution can cause headaches, rasping coughs, and burning eyes.
Although air pollution is down from the high in 1965, the region still exceeds federal and state standards for oxidants about two-thirds of the year, and the standards for carbon monoxide.one-third of the year. Because of stricter exhaust standards, future vehicles will emit less hydrocarbons. carbon monoxide, and nitrogen oxides. After 1990, however, the State Air Resources Board says that rising miles of travel will cause another pollution increase. It is important to note that probably of equal importance are the insidious effects of lower levels of air pollution. Increased aggravation of chronic respiratory diseases have been associated with long-term exposure to low levels of air pollutants.
3.3 ENERGY
What changes in the transportation system wi 11 best conserve energy?
Southern California burns 13.6 million gallons of gasoline and diesel fuel each day for surface transportation (rail. bus. auto motorcycle, and truck), more than double the rate of 20 years ago. Our 5-1/2 million cars use 53% of all our petroleum-based fuels. Fran 1956 to 1976, the average resident's gasoline const111ption rose from .91 gallons to 1.3 gallons. Each person now consumes about 125 gallons more of petroleum each year than in 1956. Today, about 40% of these fuels are from imported crude oil, and the proportion is rising.
The supply of low-cost U. S. oil is running out. No one knows just how much is left, but the amount is finite. Varying estimates of the remaining domestic oil cause public confusion and detract from the vital need to stretch what we have. Because oil is still available and affordable, public reaction has been slow and uncertain; but as the U.S. depends more and more on foreign oil and the demand keeps growing, gasoline prices could jump to $1 a gallon within the next few years. At the same time, the U.S. becomes more vulnerable to foreign political actions.
3-2

3.4 ACCESS AND MOBILITY
How can the transportation system provide better access to opportunities, and equitably improve people's mobilfty?
Transit: For those who own an automobile, or have access to one, the present transportation system in the region offers a high level of mobility. And because of its speed and comfort, many people rely on the automobile as their sole means of transportation. However, there are still many people who are not able to drive, for reasons of age, inc001e, health, or physical handicap. Since the public transit system does not offer service to all locations for all trip purposes, these people are often restricted in their ability to take advantage of education, shopping, employment, or recreational opportunities.
In some communities, transit service levels are inadequate, when compared with adopted service standards. In others, transfers between routes are difficult to make because of poor scheduling and routing of buses. For some, schedules are inadequate for off-peak hour services. Even when service levels are adequate, poorly designed vehicles and vehicle approach areas often act as barriers to the infirm elderly and the handicapped.
Auto: Southern California has a good road system, but nearly 10 million people use it, most of them during the morning and evening rush hours (6-10 a.m. and 3-7 p.m.).
During those hours, nearly 10% of freeways in Los Angeles and Orange counties operate stop-and-go at speeds under 20 miles per hour (mph). Another 20% of the freeways operate between 20 and 35 mph. Thus about 200 miles of freeway are severely or moderately congested. Many more miles of freeway operate between 35 and 55 mph wlth intennittent slowing-- which is often more annoying because of the suddenly changing conditions. Congestion usually extends 10 or 20 miles fr001 downtown Los Angeles.
Congestion will get worse. Without highway improvement, in 1988 over 30% of the freeways wi 11 be congested at peak periods. Major freeways -- the Santa Monica, Santa Ana, San Diego, Hollywood and Ventura -- will average 20 mph for large portions of the route, raising. travel times by 50-60%. The miles of congested freeway wil 1 double. Relying on new highway construction alone to solve congestion problems would require the construction of about 900 new 1 ane-mi 1 es of freeway, assuming that ramp metering and other upgrading and control measures are also implemented.
3.5 ALLOCATION OF RESOURCES
How can our limited funds provide the greatest benefit, and how can additional funds be found?
Financial resources available to fund transportation facilities and services have not been able to keep pace with increasing travel demands.
3-3

The results have meant increased congestion on our highways, roads and streets, as well as unmet needs for transit users. Data reflecting anticipated revenues for the future continue to indicate a shortfall in funds compared to needs. Because of this, the Regional Transportation Plan must provide policies and actions that make the most efficient use of limited financial resources.
For example, the plan must {1) set carefully-considered priorities to be used in allocating resources, (2) emphasize projects that encourage more efficient use of the existing system, and (3) suggest legislative and regulatory changes that would affect either total resource availability, or the region's ability to use available resources more efficiently.
3.6 INSTITUTIONAL RESPONSIBILITIES
What institutions, having what responsibtlities, can best provide and operate the system?
The fragmentation of responsibility for planning, programming, and implementation in transportation has become more of a concern in recent years. This is due primarily to increasing interest in multi-modal planning efforts, transportation systems management development, air quality planning, and the need to encourage ridesharing techniques. All of these require a high degree of interagency coordination and understanding. The arrangement of institutional responsibilities also has a major effect on the efficiency with which a particular service can be offered, or a facility constructed.
Recent legislation (AB 1246) has added County Transportation Commissions in Los Angeles, Orange, San Bernardino, and Riverside Counties, while AB 402 has created a State Transportation Commission in lieu of four previous transportation-related groups (Highway Commission, State Transportation Board, Aeronautics Board, and Toll Bridge Authority). These changes and others were brought about by the need to continually refine institutional arrangements so as to best meet transportation needs. Continual thought will be needed in this issue area.
3.7 TECHNOLOGICAL ANO OPERATIONAL CHANGE
How can the system best incorporate new technologies?
Transportation planning and development take place in a dynamic environment. Changes in transportation technology occur frequently, as is evidenced by the development of fuel-efficient autos. Other improvements, such as the personalized rapid transit systems and the high-speed rail systems, are on the planning horizon. Although some future options appear to provide attractive alternatives to existing modes, there is still considerable uncertainty about them. If these emerging technoloyies are incorporated into the regional transportation system without adequate deve 1 opment, there is a risk that they may not function properly. If existing technology is used to the exclusion of new technologies, there is a rish that an obsolete system will be built.
3-4

3.8 PHASED DECISION-MAKING
How can decisions meet current transportation needs and yet keep our opt ions open for the future?
One difficulty of planning is making the proper choices in the face of uncertainty. Transportation planning is especially sensiti-ve to uncertainty because of its dependence on technology, the large capital and operating expenditures required by transportation systems, and the lengthy lead time between planning and implementation. In the past, master plans were considered the most reasonable way of reducing uncertainty in decision-making. However, it has been found that the longer the planning horizon, the greater the degree of uncertainty.
Another difficulty is that once a partirular direction, scenario, mode or technology has been chosen, other options may inadvertently be foreclosed. The process must be structured to be responsive to existing conditions yet flexible in the face of change. Existing needs must be planned for in a way that does not forec 1 ose future opt; ons.
3-5

goals and objectives

4.0 GOALS AND OBJECTIVES
The Regional Transportation Plan's goals and objectives set the framework within which specific policies, a'ctions, and plans are formulated. (Goals identify public desires which are theoretically attainable, and provide pri nc i p 1 es for the deve 1 opment process. Objectives are more precise and quantifiable steps to achieve in advancing toward the goals.) The transportation goals and objectives outlined in this Plan· support the goals and policies of the Regional Development Guide, which is the sixcounty comprehensive p 1 an.
4.I COMPREHENSIVE GOALS OF THE REGION
The Regional Development Guide is SCAG's canprehensive guide for regional growth and development. As such, it deals with a broad range of issues, including land use, employment, population, housing, and environmental quality.
To guide growth and change, SCAG has adopted both a broad set of goals and policies (set forth in Goals and Policies, adopted in 1973), and specific, quantified growth forecast numbers (The SCAG-76 Growth Forecast Policy -1976) showing the preferred distribution of growth for specific time increments. (Note: Draft SCAG-78 was distributed for review and comment in late August 1978. It is scheduled for adoption in January 1979. It will be reflected in the amendments to the 1978 RTP which are scheduled for adoption in February.)
The Development Guide goals and policies provide basic guidance for, and are supported by, SCAG's transportation planning activities. The following is a summary of the goals and policies that are particularly relevant to transportation planning.
o To assure opportunity for the experience of a variety of 1 ifestyles within the region and within each of its major geographical subunits.
o To create subregions which have a balance of service facilities, employment, and housing types.
o To guide the development of the region toward a fonn which provides the necessary balance between the region's manmade and natural systems.
o To ensure housing opportunities in proximity to jobs and daily activities.
o To encourage the maintenance of sound and viable residential neighborhoods and to increase the rehabilitation of blighted and declining neighborhoods.
o To assure a variety of economic opportunities within each of the major sub-units of the region consistent with its natural and existing resources and potential resources.
* SCAG, Development Guide, Draft SCAG-78 Growth Forecast Policy (Aug.,'78)
4-I

o To achieve a balanced distribution of open space throughout the region which meets the needs of inhabitants .•• and which will prevent some of the adverse effects of urban sprawl and other forms of inappropriate development.
o To eliminate the degradation and pollution of the region's basic resources-- water, air, and land.
o Growth throughout much of the region should be of low density character, with specified urban areas experiencing higher density development in accordance with local and regional plans.
o Development within existing urban areas, rather than the urbanization of new land, should be encouraged as much as possible.
The SCAG-76 Growth Forecast Policy was adopted in December, 1975, and modified slightly for technical updates in November, 1977. The Growth Forecast depicts future land uses, levels of population, housing and employment consistent with SCAG's Development Guide and Trasportation goals and policies. The Draft SCAG-78 Forecast is currently under review. Six growth forecast alternatives were developed, assessed, and reviewed as a basis for developing SCAG-78. These six alternatives were assessed from a transportation perspective. The SCAG-78 adopted alternative will be reflected in the amendments to the 1978· RTP, which are scheduled for adoption in February 1979.
The policies from the SCAG-76 Growth Forecast Policy particularly relevant to transportation planning include the following:
o Encourage growth in and adjacent to existing urban areas.
This policy applies particularly to those areas where the existing infrastructure-- that is, transportation systems, utilities, schools, private investment, etc. -- is not used to capacity. This would also encourage recycling of the housing stock, preserve open space and agricultural lands in outlying areas, and reduce longdistance home-to-work travel thereby reducing energy use and alleviating air pollution.
o Avoid densities that would overtax the existing and currently planned infrastructure.
o Preserve, wherever possible, the region's natural resources and desirable land uses, particularly prime agricultural lands.
o Balance population with jobs within each major subregion.
This policy is intended to reduce home-to-work commute trip distances, and to cause a more equitable distribution of the employment tax base.
* SCAG, Deve 1 opment Guide. Alternative Popu 1 at ion. Housing, Emp 1 oyment and Land Use (PHEL) Forecasts, Draft, Vol. I, May 1978, and DMJM, Preliminary Environmental Assessment for Six Growth Forecasts for the South Coast Planning Area, May 1978.
4-2

Revised 1-25-79
4.2
REGIONAL TRANSPORTATION GOALS
Five transportation goals, adopted and incorporated into the Regional Development Guide in 1973, provide the framework for planning the transportation system and suggest general implementation strategies:
1. TO DEVELOP A TRANSPORTATION SYSTEM WHICH WILL SUPPORT THE COMPREHENSIVE GOALS OF THE REGION, TAKING INTO ACCOUNT THE EFFECT OF MODE SELECTION, LOCATION, AND TIME UPON THE PHYSICAL, SOCIAL, ECONOMIC, AND ORGANIZATIONAL ENVIRONMENT.
2. TO CREATE A BALANCED TRANSPORTATION SYSTEM INTEGRATED WITH PLANNED LAND USE TO PROVIDE SAFE, EFFECTIVE MOB! L ITY FOR ALL PEOPLE AND EFFICIENT AND ECONOMIC MOVEMENT OF GOODS.
3. TO MINIMIZE THE NEED FOR LONG DISTANCE INTRAREGIONAL TRAVEL, PARTICULARLY WORK TRIPS, BY GUIDING THE DEVELOPMENT OF THE REGION TO CREATE SELF-SUFFICIENT SUBREGIONS HAVING BALANCED SERVICE FACILITIES, EMPLOYMENT, AND HOUSING.
4. TO DEVELOP FOR THE REGION A TRANSPORTATION SYSTEM COMPATIBLE WITH THE ENVIRONMENT, USING THE AVAILABLE RESOURCES WISELY, PROMOTING THE AESTHETIC BEAUTY OF THE REGION, AND AVOIDING UNDESIRABLE ENVIRONMENTAL CHANGES.
5. TO DEVELOP A TRANSPORTATION SYSTEM THAT IS FINANCIALLY, LEGALLY, AND POLITICALLY FEASIBLE, HAS BROAD PUBLIC SUPPORT, AND HAS A COMMITMENT TO ITS IMPLEMENTATION BY ELECTED OFFICIALS AND THOSE PROVIDING TRANSPORTATION SERVICES.
4.3 TRANSPORTATION PLANNING OBJECTIVES
Four key objectives -- steps toward achieving the goals -- have been formulated to_ date:
1. REDUCE EMISSIONS FROM MOBILE SOURCES MEASURED IN TONS PER DAY) BY I 1987 ACCORDING TO TABLE 4.3-1.
2. CONSERVE TRANSPORTATION ENERGY IN THE REGION BY THE AMOUNTS SHOWN IN TABLE 4. 3. 2.
3. INCREASE TRANSIT RIDERSHIP, CURRENTLY 3.36%, TO 6% OF ALL PERSON-TRIPS BY 1990.
4. INCREASE RIOESHARING (CAR/VANPOOL) AS MEASURED BY AUTO OCCUPANCY, FROM 1.2 INDIVIDUALS PER VEHICLE TO 1.3, AND INCREASE RIOESHARING (TRANSIT) THROUGH SERVICE AND FACILITY IMPROVEMENTS CAPABLE OF ADDING 1.7% ADDITIONAL DAILY TRIPS TO TRANSIT (1. 7% INCLUDED AS PART OF 6% TRANSIT OBJECTIVE.
These objectives are discussed in detail on the next page.
4-3

Revised 1-25-79
4.3.1 AIR QUALITY OBJECTIVE
The following objective represents a reevaluation of the previous objective. As a study objective, a 40% emissions reduction from all mobile sources was evaluated. This approach was taken because it was discovered that non-light-duty vehicles, particularly certain off-road vehicles, were growing sources of emissions. Analysis of the study objective and development of the Air Quality management plan altered and established the following objective for the South Coast Air Basin. An objective for Ventura County and Southeast Desert Air Basin portions of the SCAG Region has not been developed.
It is recommended that mobile sources at a minimum reduce emissions (expressed in tons per day) by 1987 according to the fa 11 owing tab 1 e:
Table 4.3-1
SCAB 1987 Emission Reduction Potential of Transportation Control Measures
Source RHC
On-Road Travel Related 4l.B Off-Road Operations 9. 7 Technological 149.1
Total Mobile 200.6
RHC = Reactive Hydrocarbons NOx = Nitrogen Oxides CO = Carbon Monoxide
NOx co 41.3 354.4
(+3.5) 116.3 199.4 1201.1
237.2 1671.8
The emission reductions were developed through the AQMP process which selected measures, regardless of source category (i.e., stationary or mobile) based on the cost effectiveness, emission-reduction potential, reasonable availability, and related impact criteria. This competitive process resulted in the selection of those measures which best met the reduction objectives necessary to satisfy federal clean air standards by 1987. Those emissions 1 i sted in Tab 1 e 4. 3-1 when added to stationary measures satisfy the standards. As the review process proceeds, a tradeoff policy will be used. If one of the recommended measures is removed, it will be replaced by another comparable (in terms of emissions-reduction potential) measure or measures based on the above criteria and process, and the emission-reduct ion objective wi 11 change accordingly, depending on whether the replacement measure is on-road, off-road, or stationary. It should be noted that those reductions presented in Table 4.3-1 exceed the mobile source's fair share allocation of the reductions necessary. To be specific, the transportation measures emission reductions represent 67% of the RHC, 65% of the NOx, and 100% of the CO targets.
table 4.3-1 4-4

4.3.2 Energy Objective
o Conserve transportation energy in the region by the amounts shown in Table 4.3-2.
YEAR
1980
1985
1990
1995
FUEL CONSERVATION OBJECTIVES (MILLIONS OF GALLONS OF GASOLINE PER YEAR)
PROJECTED CONSUMPTION OF FUEL BY LIGHT-DUTY FUEL SAVINGS
VEHICLES OBJECTIVE
5,270 263
4,650 465
4,240 424 to 636
4.170 417 to 834
PERCENTAGE SAVED
5
10
10 to 15
10 to 20
Fuel savings for 1990 and 1995 are shown as a range, since they will depend on the. measures used to reduce emissions. To the degree that emissions are reduced by reducing VMT, a corresponding amount of fuel will be saved. It is expected that the VMT projected for 1985 will be reduced by 10%. Beyond 1985, emissions may be further reduced either by reducing VMT even more, or by using other measures (e.g., imposing controls on sources not now controlled). The range of fuel savings shown corresponds with these possibilities.
Note that the LOV consumption projections in Table 4.3-2 are based on two assumptions: 1) that there will be a normal vehicle replacement cycle with vehicles meeting the federal fuel economy standards, and 2) that VMT will continue to increase at current trends. Thus the fuel savings objectives for 1980 through 1995 shown in Table 4.3-2 are in addition to projected savings to be realized by meeting the federal fuel economy standards for new vehicles.
4-5 table4.3-2

4.3.3 Transit Ridership
o Increase transit ridership, currently 3.36%, to 6% of all persontrips by 1990.
Currently, about 3.36% of person-trips are by transit in the region. If the 6% objective is to be met, therefore, significant improvements in transit service will be required. Estimates of ridership for the Regional Trans it Development Program indicate that this program waul d bring the regional transit ridership up to about 1.8 million by 1990. This is equivalent to a 4.4% modal split. To reach the transit objective of 6% modal split, or 2,5000,000 transit trips, many of the ridesharing strategies defined in the multi-modal section of the RTP must be successfully implemented. Such strategies as fare policy changes, parking management, employee subsidies {free bus passes}, infonnation and marketing, etc., will have to be implemented.
This objective is discussed further in Section 6.3.
4-6

Revised 1-25-79
4.3.4
RTP Ridesharing Objectives
The SCAG region light-duty vehicle rideshare objective is defined as:
By 1987 increase the average light-duty vehicle occupancy for the daily, freeway/non-freeway, home to work trip from 1.2 to 1.3. Achieve this increase in average vehicle occupancy by diverting approximately 1,063,000 work commuters from single-occupant to rideshare modes (i.e., 3+ person carpools or its equivalent), thusly, forming 354,000 new carpools and 708,000 daily carpool vehicle trips. See note bel ow.
It is intended that, by 1987, those weekday 1 ight-duty vehicle trips identified have, as 24-hour home-based work trips (utilizing both freeway and non-freeway segments of the transportation network), an average vehicle occupancy of 1.3. In order to realize this average vehicle occupancy, it will be necessary to divert approximately 735,000 work commuters from the single-occupant vehicle mode to the mutiple occupant (i.e., 3+ person carpool or its equivalent) mode of travel --in addition to the 328,000 work commuters expected to form carpools naturally {i.e., contributing 109,000 3+ person carpools or their equivalent). It is assumed that these 735,000 ridesharers, formed into some 245,000 3+ person carpools and representing approximately 490,000 daily carpool trips, can be captured by means of an Employer Program aimed primarily at commuter matching and promotional activities (i.e., contributing 639,000 new ridesharers and 213,000 carpools) and a Freeway Facility Change Program featuring rides hare incentives such as rideshare lanes and metered ramp bypass lanes (i.e., contributing 96,000 new ridesharers and 32,000 carpools). This objective is the same as the level called for in the AQMP.
Capture rates for the Employer Program are expected to vary according to the size of the finn and may require incentives in addition to matching/ promotion in order to be realized. Listed below are the capture rates for firms of various sizes which are expected to be achieved by 1987.
Size of Finn {Number of Employees)
500 and above 250 - 499 100 249
1 - 99
% Captured to Ridesharing {3+ carpools}
20 15 10
2.5
These rates represent targets and actual capture rates wlll vary from these figures (e.g .• one firm of 500 may have a capture rate of 10% while another firm of 500 may have a capture rate of 30%).
4-7

Revised 1-2 5-79
The SCAG region transit rideshare objective is defined as:
By 1990 increas-e transit ridership by 755,000 new transit person trips daily. This increase will be achieved primarily by diverting 378,000 additional work commuters from single-occupant mode to transit. This increase would account for 1.7% of all daily person trips.
Transit facility and service improvements will result in an increase in transit trips from the current level of 3.36% to 4.3% of all person trips (see Transit Ridership Objective 4.3.3). In order to meet the 6% modal split objective for the region it will be necessary to successfully implement or continue several ridesharing options. It is anticipated that the implementation of these non-facility ridesharing activities (especially a marketing and information program, an expanded employer incentive program and parking management programs) \~ill contribute to increasing transit ridership by the amount stated above.
NOTE: The veh i c 1 e occupancy objective of 1.3 is based on the assumption that a 6% transit modal split objective is achieved, that 639,000 commuters are captured through an Employer Program, that 96,000 commuters are encouraged to rideshare through freeway faci 1 ity improvements, and that 328,000 commuters form carpools naturally. Should the facility and/or service improvements not be implemented or the number of individuals expecte~ to fonn carpools naturally not do so, it will be necessary to make trade-offs among the components of either the transit or 1 ight-duty vehicle objectives or between the two objectives.
4-8

policies

5.0 POL! C I ES
The following sections list the transportation policies for the region (multi-modal, auto, transit, airports, non-motorized, maritime and rail, finance, and institutional arrangements.
5.1 MULTI-MODAL POLICIES
1. THE REGIONAL TRANSPORTATION SYSTEM SHALL SERVE ALL TRIP PURPOSES IN AN EQUITABLE MANNER ACCORDING TO NEEDS. ASSURANCES SHALL BE SOUGHT FROM TRANSPORTATION PROVIDERS THAT PROPOSALS FOR IMPROVEMENTS SHALL (l) PROMOTE THIS EQUITABILITY AND (2) CONSTITUTE INTEGRAL PARTS OF A COMPREHENSIVE SYSTEM, CONSISTENT WITH THE REGIONAL TRANSPORTATION PLAN. TRANSPORTATION MODES, SERVING DIFFERENT FUNCTIONS AND AREAS, SHALL BE COORDINATED TO PROVIDE A CONTINUOUS FUNCTIONAL SYSTEM.
2. THE REGIONAL TRANSPORTATION SYSTEM SHALL EQUITABLY SERVE BOTH PEOPLE AND GOODS MOVEMENT, PROVIDE EFFECTIVE SERVICE TO TRANSIT DEPENDENTS, AND SHALL INCLUDE ALTERNATIVE SERVICE TO AUTO TRAVEL.
3. THERE SHALL BE A BALANCED TRANSPORTATION SYSTEM, PROVIDING IMPROVED TRAVEL OPPORTUNITIES AT ALL SCALES, AND ACCOMMODATING EXISTING TRAVEL DEMANDS AS A PRIORITY, BOTH IN URBAN AND RURAL AREAS. IMPROVEMENTS SHOULD BE PROVIDED IN PROPORTION TO THE DISTRIBUTION OF TRIPS BY LENGTH AND PURPOSE, UPGRADING SERVICE IN METROPOLITAN AREAS AND, IN PARTICULAR, WITHIN COMMUNITIES.
4. IMPLEMENTATION PROGRAMS SHALL BE BASED ON A PHASED DECISION-MAKING PROCESS, WHEREIN EXPERIENCE AND EVALUATION SHOULD GUIDE THE PROGRESSION OF DECISIONS. FUNDING PROGRAMS SHALL ALSO FOLLOW A PHASED DECISION-MAKING PROCESS, WHEREIN A MULTI-MODAL CONCEPT SHOULD BE FOSTERED AND SHOULD NOT BE BIASED IN FAVOR OF ANY ONE MODE OR PARTICULAR TYPES OF FACILITIES OR SERVICES. DECISIONS ON IMPROVEMENTS SHALL TAKE INTO ACCOUNT THE EFFECTIVE USE OF ALL AVAILABLE MODES AND FACILITIES, AND SHALL GIVE SIGNIFICANT SUPPORT TO SUCH IMPROVEMENTS THAT PROVIDE BENEFITS FOR THE ENVIRONMENT, IN PARTICULAR, AIR QUALITY AND ENERGY.
5. PUBLIC TRANSPORTATION SYSTEMS OF THE REGION SHALL BE SIGNIFICANTLY IMPROVED. SUBSTANTIAL INCREASES IN PUBLIC TRANSIT FUNDING SHALL BE SOUGHT, WITH PARTICULAR EMPHASIS ON OPERATING FUNDS. THE DEVELOPMENT OF AN INITIAL PORTION OF A GUIDEWAY TRANSIT SYSTEM(S) SHALL BE SUPPORTED, AS WELL AS OTHER TYPES OF SYSTEMS THAT PROVIDE SATISFACTORY JUSTIFICATION. BUS SERVICE SHALL BE IMPROVED THROUGH MODIFICATION OF THE EXISTING SYSTEM, CONSISTENT WITH THE SHORT-RANGE TRANSPORTATION PLAN.
5-l

5 .1.1 System Planning Policies
6. Use the Regional Development Guide and the currently adopted growth Forecast Policy as a guiding criterion in providing transportation service.
7. Recognize existing local land use plans in the fo1111ulation of transportation decisions.
8. Project implementation of the Regional Transportation Plan must be undertaken consistent with the requirements of the Ca 1 iforni a Coastal Act of 1976.
9. Travel corridors as discussed in AB 1246 will be identified in the 1979 RTP. Assignment of priorities for corridor planning will also be included.
10. Future regional plan updates should include more specific consideration and recommendations on highway development relative to: growth policy; VMT reduction; air quality, energy, and the role of highways in terms of auto, transit~ goods movement, and other uses.
11. SCAG shall identify methods to allow substantial involvement by communities in plan development and in the decision-making process. In conjunction with this policy, identification of transportation needs at the community level should be incorporated as part of the planning process undertaken by the transit districts.
12. Encourage and support development of new technologies for the efficient movement of people and goods~ and incorporate advanced technologies in the development of alternatives whenever it appears that such technologies are feasible.
13. SCAG should serve as a coordinating and facilitating agency for the development of region-wide policies on transportation issues, and positions on state and federal transportation legislation, regulations and programs.
14. SCAG should actively participate in positions on transportation issues agencies.
the fonnul at ion affecting local
of state-wide and regional
15. Communication between the private sector and all public bodies involved in decisions on transportation issues should be actively encouraged, particularly in the early stages in the development process.
5-2

~viftd 1-~ 5-79
5.1.2 Transportation System Management Policies
16. The transportation system shall be managed to increase operational efficiency, conserve energy and space, reduce air pollution and noise, and provide for mobility and accessibility.
17. Avoid undesirable duplication of transit services.
5. 1 .3 Ridesharing Policies
18. Encourage ridesharing by providing bypass lanes at metered ralllps at locations detennined to be feasible and desirable. These lanes should:
- have support from both citizens and local elected officials - be operationally safe -be capable of serving and encouraging either carpooling, vanpooling
or the use of buses.
19. In planning new freeways, evaluate the impact of including exclusive bus, van and carpool lanes.
20. Where rideshare lanes meet the fallowing criteria and are consistent with the policies in the Regional Transportation Plan, then projects should be implemented. These projects should:
21.
22.
- have support from both citizens and local elected officials - be operationally safe - be open to all fonns of high occupancy vehicles - serve as an incentive to rideshare and benefit all freeway users -be undertaken where freeflow condition cannot be reasonably achiev-
ed or it can be shown that a rideshare lane will carry at least as many people as a conventional lane.
Encourage cities and counties to include exclusive lanes for buses carpools and vanpools on major arterials for peak-hour travel and t~ enforce related parking restrictions to insure unobstructed use of these lanes by high occupancy vehicles.
Expand the use of existing park-and-ride and park-and-pool lots to serve as connecting points for all available types of high-occupancy vehicles.
23. Support development of transfer centers which improve the interface of various transportation modes and encourage the use of highoccupancy vehicles.
5-3

Revised 1-25-79
24. Support development of public and private paratransit services (such as taxipools, demand-responsive and community level service) which encourage ridesharing on short trips and support any needed changes in legislation and regulation.
25. Support development of a centralized multi-modal information and marketing organization which will assist commuters in utilizing, and employers in sponsoring ridesharing services. Such an organization should be regional in scope, a non-provider of transportation services and quasi-governmental or private entity.
26. Support the expansion of Commuter Computer's ability to provide ridesharing match lists and to provide these lists in a expeditious manner so that potential ridesharers can be assisted quickly.
27. Support an extensive and coordinated marketing program to increase public awareness of transportation problems and encourage ridesharing as an immediate action to alleviate the problems,
27A. Cities and counties should consider developing parking programs which encourage the voluntary reduction in the supply of off-street parking spaces. Commercial and industrial businesses should be offered the option to reduce both code required and conditionally required parking in exchange for their commitment to implement measures that will encourage a reduction in the use of the singly occupied automobile. Any reduction in parking should be dependent upon both the nature and the effectiveness of measures that participating businesses would be willing to implement.
27B. Support the development of adequate, low-cost liability insurance for people who use group transportation.
27C. Support changes in the tax code which pennit employer sponsored ridesharing program costs as a legitimate business deduction and do not consider these costs as income to the employee.
270. Encourage both public agencies and private employers to provide bus passes for ernpl oyees, sponsor carpools or vanpool s, provide subscription bus service, assign preferential parking .spaces for ridesharing vehicles, institute flextime and to consider using fleet vehicles as means of facilitating ridesharing for commute trip purposes.
27E. Encourage public and private employers to provide equal subsidy treatment of auto drivers, bus riders, carpoolers and vanpoolers.
5-4

Revised 1-25-79
27F. Encourage cities and counties to develop locally implementable projects which encourage the use of high occupancy vehicles such as bus turn-outs, off-street parking programs, signal pre-emptions and other related programs.
27G. For the purposes of AQMP, all forms of multi-occupant vehicles and paratransit systems shall be considered public 'transportation if such vehicles or systems are supported directly or indirectly by public funds.
s. !.4 System Development Policies
28. Provide transportation for necessary and anticipated travel between metropolltan areas but do not encourage an increase in long-distance travel.
29. Emphasize metropolitan and short-distance transportation improvements consistent with other Plan policies.
30. Encourage development of transportation services appropriate for rural areas.
31. Add new transportation facilities and services when it can be shown that: the demand for the facility and/or service is reasonable and anticipated; improved management of the transportation system cannot accommodate the demand; there exist adequate capital and operating funds to finance the improvement; their use does not take away from existing service; the proposed improvements are costeffective; and social, environmental, and other objectives are met or negative impacts in these areas are mitigated.
32. Stage transportation planning so that policies guiding long-term transportation improvements are adopted. For hardware and route decisions, consider for adoption only those improvements which can be implemented in the foreseeable future.
5-4A
Revised 1-25-79
5.1.5 Transportation Air Quality Policies
33. The Regional Transportation Plan and the Transportation Improvement I Program shall be consistent with the Air Quality Management Plan as the applicable portion of the State Implementation Plan.
34. Transportation systems planning within the SCAG region shall work cooperatively with the regional Air Quality Maintenance Planning process to attain federal and state standards for ambient air quality at the earliest achievable date, and to maintain the standards thereafter.
35. SCAG supports and encourages technological improvements, particularly for heavy duty and off-road vehicles, as one means of moving toward attainment of federal and state air quality ~tandards.
36. SCAG supports and encourages the state legislature to move rapidly toward implementation of a mandatory annual inspection/maintenance program for light-duty vehicles in the region.
37. Air pollution from mobile sources shall be reduced by the development and implementation of programs and actions in the following areas:
- the diversion of a substantial number of single-passenger auto trips to carpool, vanpool, transit and other modes. (See Rideshare objectives.)
-the encouragement of a reduction in individual daily vehicle trip-making through land use, urban design, and marketing techniques.
- improvement to the efficiency of the automobile by
instituting an annual emissions inspection and maintenance program improving bottlenecks and points of congestion in the road system encouraging technical improvements to vehicle design and operation applying emissions standards and operational improvements to off-road vehicles and currently unregulated sources.
38. Alternative modes of travel should be planned and provided for to reduce the region 1 s reliance on the automobile.
39. SCAG shall commit to the implementation of all adopted transportation control measures, to the implementation of public transportation measures sufficient to meet basic transportation needs, and to attainment each year of the reasonable further progress (RFP} goal for the non-technological mobile category of measures. This commitment shall be executed through exercise of A-95 review authority and TIP review/approval authority to the extent authorized by state and federal statutes.
5-5

Revised 1-25-79
40. In conjunction with counties and cities, continue planning efforts on preferential facilities for high-occupancy vehicles on major arterials during peak hours; and develop directional flow experiments using one-way traffic flow on selected major arterials to accommodate peak hour traffic and decrease travel time.
41. Support a "balanced., approach to air quality and energy planning based on an objective assessment of the automobile's contribution to regional air pollution and energy consumption, relative to other po 11 uti on sources and energy users.
42. Encourage local governments to develop parking strategies that will encourage the use of transit and carpools; relieve traffic circulation on 1 ocal streets; supplement other transportation and land use measures designed to improve air quality and conserve energy; insure coordination of transit and paratransit developments with parking management strategies.
43. Sanctions applied to transportation funds for noncompliance with appropriate portions of the State Implementation Plan (SIP) should apply only to those jurisdictions not implementing their portion of the plan.
43A. The adopted Regional TIP Annual Element shall constitute the required commitment by state, regional, and local agencies, to implement and fund adopted transportation control and public transportation measures.
43B. In the case of transportation control measures and public transportation improvements which have been previously programmed, implementation should be given priority and newly adopted measures should be phased into the TIP as expeditiously as possible.
43C. To ensure maximum local government involvement in the implementation of the AQMP/RTP and in the continuing planning process, the following steps will be taken prior to the replacement of any control measure:
a. Prior to implementation of a control measure whether indentified in the AQMP or suggested for inclusion in the future, a detailed analysis evaluating the cost, effectiveness, and social and economic impacts of the proposal shall be prepared by the implementing agency and circulated in a timely manner to all concerned parties for review and comment.
b. Local government shall have a full opportunity to review, comment on, and approve control measures which they are designated to implement at the local level. Further, State, Federal agencies shall comply within the context of Executive Order 12088 and to the greatest extent feasible, with local government requests in regard to the implementation of control measures which are the respons_ibility of State or Federal agencies.
5-6

Revised 1-25-79
c. As a part of the continuing planning process, any governmental agency may propose an amendment to the AQMP to substitute an equivalent control measure for any measure the agency is required under the plan to implement. The procedures for proposing amendments will be developed and incorporated into the plan by subsequent revision.
d. Implementation of control measures by local governments is contingent upon the availability of funds from federal, state and local sources.
43D. SCAG wi 11 encourage the study and potentia 1 use of en vi ronmenta lly acceptable a 1 tern at i ve fue 1 s for trans port at ion energy conservation and emission-reduction_ potential.
43E. All forms of multi-occupant vehicles and paratransit systems shall be considered public transportation if such vehicles or systems are supported directly or indirectly by public funds.
43F. As a part of the FY 79-80 regional planning effort, SCAG, in cooperation with County Transportation Commissions and transit operators, will develop and document in the RTP a plan for long- and short-range transportation improvements designed to meet basic public transportation needs. This plan will be implemented according to the schedule adopted with that plan.
43G. As a part of the FY 79-80 regional planning effort, SCAG, in cooperation with County Transportation Commissions and transit operators, will develop and document in the RTP a plan for long- and short-range transportation improvements designed to meet basic public transportation needs. This plan will be implemented according to the schedule adopted with that plan and will be presented to the Executive Committee for adoption by June 1980.
43H. Governmental agencies will minimize 11 project-by-project" review through conducting air quality analysis at the regional level instead of the project level, whenever possible.
431. Governmental agencies in the AQMP planning area will, when preparing an environmental impact report, confine the projects air quality analysis to local impacts through referencing the AQMP as a demonstration that regional impacts have been offset (as long as the AQMP is being implemented and reasonable further progress goals are being met).
43J. Any government agency receiving funds for air quality planning of transPortation projects, where air quality impacts have been offset by the AQMP, shall support and assist in the implementation of the AQMP, instead of developing separate air quality mitigation measures for individual projects.
5-6A

Revised 1-25-79
43K All agencies of the federal government shall support and implement the AQMP. All federal facilities~ especially military facilities, sha 11 be constructed and operated in a manner consistent with the AQMP, except where national defense dictates otherwise, or mitigate on a one-to-one basis any air pollution resulting from their activities.
43L Transportation improvements described in the AQMP baseline (see AQMP document 1-25-79) as well as the transportation control measures (see RTP/Air Quality Actions #6 through #58) both contribute to achieving desired results and need to be implemented as expeditiously as possible. This includes local congestion relief projects which are transportation system management (TSM) improvements contribute to reducing air emissions. The regional analysis considered these projects as part of the AQMP baseline. Further analysis and documentation of their effectiveness will be annually reviewed through the Transportation Improvement Program (TIP) and consistency assessment process.
5. 1 .6 Energy Policy
44. Transportation energy requirements shall be minimized by:
a) supporting planning, programming and implementation efforts which conserve energy.
b) encouraging technological changes that conserve energy.
c) educating users of transportation energy about the costs of various modal alternatives.
45. Energy consumption requirements of transportation shall be minimized by: meeting the Federal fuel economy standards though at least 1980; shifting a substantial number of single-occupant auto trips to carpools, transit, and other modes; giving strong support only to investments in modes and facilities that will result in energyefficient travel; reducing consumption of scarce and expensive energy fue 1 •
46. Emphasize reduction of emissions and conservation of energy in review of grant applications and subregional programs for acquiring, replacing, or operating transit and publicly owned vehicles.
47. In improvement of the existing transportation system~ priority shall be given to those means of travel which are energy-efficient and least polluting.
48. Encourage the development of energy contingency plans for selected transportation agencies to assure the operation of essential transportation services during periods of critical fuel shortages.
5-6B

Revised 1-25-79
5.2 AUTOMOBILE POLICIES*
1. Regional, subregional, and local agencies shall emphasize efficient automobile use (to lower emissions, save energy, and reduce congestion) by these means:
a) Encourage ridesharing.
b) Develop and implement traffic-operations improvements to speed and manage the flow of motor vehicles (i.e., signal synchronizing, channeling, reversible lanes, etc.) to increase efficiency.
c) Encourage technical improvements to vehicles.
d) Encourage local governments, major employers, and universities to develop parking strategies that increase ride-sharing and supplement other transportation and land-use measures to improve air and conserve energy.
5.3 TRANSIT
Service
1. SCAG encourages compliance with the local bus service standards.**
2. The following guideway projects are of equally high priority for Proposition 5 funding:
- The Southern California Rapid Transit District•s rail rapid transit line from downtown Los Angeles to North Hollywood.
- The City of Los Angeles Downtown People-Mover.
Note: Proposition 5 moneys are applicable only to Los Angeles County.
3. SCAG, in cooperation with other agencies, should identify areas where paratransit projects would supplement existing and proposed transit operations. Current legal restrictions to the provision of these services should be analyzed for possible removal.
* Some of the auto-related policies can be found in the HOV, TSM, and air quality sections.
**See Appendix A for local service standards.
5-7
Revised l-25-79
4. Efforts to upgrade service or add service shall be supported and priority for such service improvement shall be given to improvements in areas where transit service is substandard and in areas of greater than nonnal transit dependency.
5. SCAG shall use the following in defining groups requiring special transportation assistance:
the transportation handicapped (including wheelchair users, semiambulatory persons, the developmentally disabled) and the elderly
- lack of auto availability
-persons at or below the poverty level as defined by the U.S. Census Bureau
6. Plans for regional transit systems ~hall include consideration of service to the major airline airports.
7. The corridors proposed by the SCRID and the OCTO are adopted by SCAG for planning purposes with the addition of local circulation areas (to be identified) throughout the region {Figure 6.3-3).
?A. Support development of the RTDP as part of the long-range transit plan or the region. This is contingent upon an increase in funding availability. The complete Program includes the following:
- Element I: Local Bus/TSM Improvements (Including Service Expansion).
- Element II: Full Freeway Transit Program. Includes construction of rideshare lanes and stations~ as well as the implementation of service improvements. The rideshare lanes will be designed to permit possible conversion to rail. ·
- Element III: Construction of the Los Angeles Downtown People Mover. -Element IV: Construction of rail rapid transit line from Downtown
Los Angeles to North Hollywood.
Also support development of a financially feasible RTDP implementation program which can be implemented within anticipated funding constraints.
This program includes the following:
Element I: Local Bus/TSM Improvements (includes service expansion when financially feasible).
Element II: Construction of .rideshare lanes on the Santa Ana~ Harbor, and Century Freeways, and the extension of the San Bernardino Busway from its current western tenninus to Union Station. Rideshare lanes will be designed to pennit possible conversion to rail.
5-8

Revised 1-25-79
- Element III: Construction of los Angeles Downtown People Mover. -Element IV: Construction of rail rapid transit line from downtown
Los Angeles to North Hollywood.
Paratransit Coordination
8. The crc•s, IVAG, and VCAG shall encourage transit and paratransit operators to coordinate their planning and programming with each other, and with other agencies concerned with transportation. SCAG will aid this process by:
a) requiring that applications for funding of new paratransit operations show that existing resources are inadequate and discuss how the requested funds might be used to expand existing public and private sector services or, where integration is not feasible, state the reasons why.
b) fostering the development of joint powers agreements and contractual arrangements between service providers.
c) supporting efforts which bring providers pf similar transportation services together to discuss coordination and consolidation strategies.
BROKERAGE
SA. SCAG, the CTCs, and the subregional agencies will support demonstration projects as appropriate, that develop and evaluate brokerage projects for community-level transportation services.
PRIVATE SECTOR PARTICIPATION
8B. SCAG will maintain the Paratransit Task Force and actively encourage that participation in the transportation planning process also be afforded to representatives of private transportation providers at the subregional level.
LOCAL TRANSPORTATION REGULATIONS CONSISTENCY
BC. The transportation regulations of local governments should be consistent with the Regional Transportation Plan. local governments are encouraged to draft paratransit ordinances, or revised taxi ordinances, which permit shared-ride taxi service, independent driver contracting, less restrictive insurance provisions, and regulatory coordination.
PUC/RTP COORDINATION
80. The State Public Utilities Commission should be encouraged to make decisions and adopt regulations which are consistent with the Region-al Transportation Plan. '
5-SA

Revised 1-25-79
Elderly and Handicapped
9. The elderly and handicapped have the same right as other persons to travel and to utilize regular public transportation services. Persons with developmental disabilities, the physically disabled and the elderly shall be provided a continuum of transportation services according to need and their degree of transportation disability. Adopt and support objectives intended to facll itate the transition to accessible public transportation services.
10. Support the coordination or consolidation {where appropriate) of transit and of paratransit services to provide more effective, efficient and accessible transportation services.
11. Plans for transportation services shall include methods to provide transportation services for persons with developmental disabilities, the physically disabled and the elderly.
12. For transportation planning purposes, transportation-handicapped persons are those individuals who, by reason of illness, injury, congenital malfunction, developmental disabilities or other pennanent or temporary incapacity or disability, including those who are nonambulatory wheelchair bound and those with semi-ambulatory capabilities, are unable without special facilities or special planning ana design to utilize mass transportation facilities and services as effectively as persons \~ho are not so affected.
13. Agencies applying for public funds will notify affected public or private operators early in the development process and consider their comments when proposed new transportation programs would impact their services or afford opportunities for coordination. Planning agencies will see that lists of existing services are made widely available.
Safety
The following proposed policies have been developed from a SCAG study, Transit Safety and Security: A Design Framework:
14. Support and encourage a greater awareness that crime prevention through physical planning can play an lmportant part in the reduction and deterrence of criminal activity in transit facility design.
15. Encourage development of uniform regional transit traffic and parking regulations as well as uniform transit signing regulations for furthering transit safety and security.
16. Suggest to transit operators the desirability of developing written procedural guides to inform transit employees on how to conduct themselves during any safety and security incidents.
17. Encourage transit operators to jointly develop and adopt a uniform standardized i nci dent-recording procedure.
5-9
Revised l-25-79
18. Support and encourage an evaluation of emergency communication equipment and radio frequencies in order to design better communication systems that will help decrease response times by public safety agencies.
19. Support and encourage public safety agencies to review transit designs for security needs prior to application for building permits.
Procedural
20. Agencies designated by the CTC 1s, IVAG and VCAG shall pr~par: a Short Range Transit Plan (SRTP) as required to meet federal gu1del1nes.
2L SCAG and CTC 1 s will determine the merit and suitability of TIP projects according to the following criteria:
(1) Conformance with applicable statutes and regulations promulgated by the relevant granting agency or authority.
(2) Confonnance with policies and guidelines incorporated into the Regional Transportation Plan.
(3) Confonnance with transit system efficiency standards and guidelines which are developed and adopted by SCAG as Transit Service Policies.
(4) Confonnance with stipulations included in the SCAG/Public Transit Operator Memorandum of Understanding.
22 •. SCAG and CTC 1 S shall adopt criteria consistent with SB 1687 for the evaluation of claims for community transit services. Such criteria shall include:
priority for group requiring special transportation assistance
innovative and efficient service
the level of impact of the service in meeting transportation need
- the level of impact on existing taxi and transit services.
23. SCAG and CTC 1 s shall also provide for an alternative finding, based upon the evaluation of all claims submitted, that some or all of SB 1687 funds could be used to better advantage for Article 4 purposes in the development of a balanced transportation system.
24. SCAG 1 s endorsement of applications for state and federal transit I funding shall be contingent upon implementation of the revised Memorandum of Understanding and consistency with the Regional Transporta-tion Plan.
5-10

5.4 HIGHWAY POLICIES
1. Highways of regional significance are state highways only, including highways necessary to complete the Interstate system.
2. Maintain the 55-mph speed 1 imit within urbanized areas of the region for al 1 vehicles except emergency vehicles.
3. The use of the existing highway system should be maximized through traffic operational improvements.
4. Construction of sound barriers on freeways that pass through previously established residential areas will be a high priority program.
5. Priorities for funding highway programs will be:
First, maintenance and rehabilitation; Second, operational improvements and construction of new facilities necessary to the efficiency of system use.
6. For the purpose of meeting AB 402 mandates and for allocating any discretionary highway funds within and among Caltrans districts, SCAG shall support the development of a regionally prioritized list of new highway construction projects during FY 78-79 which numerically ranks highway projects as recommended in sub-regionally prepared priority lists.
7. In accordance with AB 402, the RTP shall be the guiding document for State Highway programming in the SCAG region, with this understanding: that Caltrans will report to the TUC and Executive Committee as to how they actively considered the adopted RTP in the fonnulation of the proposed STIP; and that if Caltrans cannot follow the RTP recommendations, that this report jutify the reasons for not being able to do so.
8. SCr\G will continue to work with the county transportation commissions and subregional agencies to seek additional highway funding to meet the current shortfall in the SCAG region.
9. SCAG will continue working with the California Transportation Commission and the 1 egisl ature to require the programming of project development costs in the TIP.
10. SCAG will support the development of a federal program on interstate highways which would allow the use of interstate funds for major upgrading of older interstate routes.
* Some of the Highway Policies are found in the Ridesharing Section.
5-Il

5.5 AIRPORT SYSTEM POLICIES
Planning
1. The Regional Airport System Plan must be based on a continuing planning process rather than a binding long-term commitment and the Plan should be reviewed at least every two years.
2. SCAG 1 s primarily responsibilities in aviation planning are to a) forecast travel demand b) coordinate system design c) coordinate institutional arrangements.
3. Implementation, as well as continuing review and rev1S1on, of the adopted Regional Airport System Plan must be integrated with development and implementation of the SCAG Regional Transportation Plan and also with state and federal transportation plans, to assure the coordination of elements and modes of regional, state, and federal transportation system.
4. SCAG should act as a convening agency to bring representatives of airlines, airport owners, communities, the Department of Defense, the Federal Aviation Administration, and other regulatory agencies together on a regular basis to increase intraregional cooperation.
5. SCAG Regional Transportation Plans and updates will include specific consideration and reconmendations relating to airport access; the economic impact of meeting or not meeting projected aviation demands; the development of airport requirements within a comprehensive regional framework; and the reexamination of aviation forecasts.
6. The initiative for implementation of airport system plans in the 1978 RTP remains with local ccmmunities, state and federal agencies, and aviation industry organizations.
7. Local decision-makers must be involved in independent airport authority and commission decisions.
8. Methods should be sought for spreading the financial burden of constructing any major new general aviation facilities among all areas in the region to be served by that facility.
9. Recognizing the preemption by the federal government in this area, SCAG's policy for priority airspace is: (a) military, (b) air carrier, (c) general aviation (with as much airspace as possible).
10. If conflicts should arise in the planning, development, or operation of the general aviation portion of the regional airport system, priority normally should be given to regionally significant airports over locally significant ones.
5-I2

11. SCAG supports Airport Land Use Commissions (ALUC 1 s) in their efforts to ensure compatible land use around airports.
12. Measures to assure permanent land use compatibility must be included in .the planning and development of new airports, including a high priority for land acquisition.
13. Incompatible land uses around all airports should be prevented.
14. The State of California and SCAG definition of open space shall be used in evaluating airport impact upon open space. This definition is "land or water which is essentially unimproved and is devoted to the following open space uses:
Preservation of natural resources - Managed production of resources
Outdoor recreation Public health and safety."
15. The areas of the region which will have the greatest deficiencies in air transportation service by the late 1980s should begin now to formulate policies concerning these deficiencies. Delayed actions or decisions not to act may cause severe inconvenience to the public. SCAG will provide all possible assistance and encouragement to local public agencies to preclude such delays.
16. No existing large civil or military airport should be converted to a non-aviation use without realizing that such action eliminates one of the options for provision of future airline service.
17. Operators of existing airports where established policies now limit the levels of air transportation service should frequently reevaluate these policies in 1 ight of improvements and application of noise reduct ion technology.
18. Planning for allocation of traffic among existing airports and for the development of major new airports should consider the relative ability of airports to comply with the California Environmental Standards or superseding Federal Regulations.
19. The definition of Airports of Regional Significance for the Regional Transportation Plan shall be as follows:
The term regional is applied to any airport that serves a 111ajor portion of region-wide air traffic activity, that has CAB or PUC certificated service, or that provides service to a portion of the region whicfl otherwise would be isolated from the air transportation system. The criteria used for definition can be found in Appendix G.
5-13

Management_
20. The six major airline airports in the regional airport system today should be expanded to the maximum extent currently planned with the greatest emphasis on expansion of Los Angeles International and Ontario International Airports to 1985.
21. At Hollywood-Burbank, Long Beach, Orange County, and Palm Springs Airports, the primary emphasis should be placed on achieving higher load-factors on c001mercial aircraft presently using the facilities; and, secondly, substituting quieter, higher-capacity aircraft for aircraft currently being utilized.
22. All airports of regional significance, especially those whose future existence is threatened, should be protected.
23. A broad-based airport ownership appropriate to both the market area and the impact area of an airport should be encouraged.
24. Where levels of military activity will permit it, joint use of military airports should be encouraged. (Joint use could enable orderly transition to civil ownership if a facility is declared surplus. Civil use of any surplus military airport should be pursued.)
25. Civil uses of airspace in the region should not impair critical military missions.
26. Every effort must be exerted to assure that all existing general aviation airports remain part of the future airport system.
27. The Federal Aviation Admini3tration airport design, obstruction, airspace and other safety standards must be followed.
28. Additional land for noise buffer zones around general aviation airports should be acquired where necessary.
29. Aircraft noise and air pollution should be reduced to an acceptable level.
30. The State of California airport noise regulations, or similar federal regulations that may supersede them, shall be adhered to as airport planning criteria for the SCAG region. Environmental impact statements and reports shall demonstrate how an airport development proposal, and an airport-related zoning change, will meet these criteria.
31. In order to meet the criteria of the California airport noise regulations, every reasonable effort must be made to reduce jet engine noise, including engine retrofit or early retirement of older aircraft.
5-14

32. Much greater emphasis should be placed upon the development of technology to reduce the noise produced by general aviation aircraft. and particularly that emitted by business jets.
33. Air quality standards (federal .3nd state) should be a major consideration in planning the regional airport system. Project envirollllental statements and/or reports shall make specific references to the potential impact of project implementation in relation to such standards.
34. Aircraft engine ground operating time should be reduced where safety permits.
35. Ground service vehicles at airports should be required to meet highway vehicle emission standards.
Deve 1 opment
36. Any development of an airport beyond the maximum airspace capability shown for it should be undertaken only with the full realization that such development may detract from the optimum utilization of the airspace system, or necessitate reductions in the potential development indicated for other airports.
37. Airports that are remotely located should not be expected to provide capacity relief in the short term to 1980. In the time period beyond that, ground travel time will be a major determinant of how many passengers any remotely located airport will serve. However, phased deve 1 opment of remote passenger termi na 1 s should be implemented throughout the region, coinciding with the availability of adequate mass transit.
38. Efforts should be undertaken to integrate into the development strategy all parties having a vital interest in airport ground access (e.g •• airport limousine services, taxi companies, transit system operators, rental car agencies, the airlines, and the airport operators).
39. Consideration should be given to the development of high-speed ground transportation systems to supplement air transportation systems in local and short-haul markets, both for energy conservation reasons and to partially relieve airline airport capacity problems.
5-15

5.6 NON-MOTORIZED MODES POLICIES
1. The needs of handicapped persons in terms of special design features will be considered in the review process for pedestrian facilities.
2. Encourage and promote the greater use of bicycles for all transpor-tation purposes within the region. Specifically. encourage pro-visions for bicycle storage at all major facilities.
3. Where appropriate, justified, and safe, modify streets and highways to include bicycle facilities.
4. Encourage cities and counties to incorporate into their ordinances and building codes provisions for safe bicycle storage facilities in public and private buildings.
5. Encourage the development and implementation of education and enforcement programs which promote a safe environment for bicycle use.
6. Support legislation facilitating city-county implementation of bicycle programs.
7. Encourage public transit operators to provide bicycle storage facilities where appropriate on public transit vehicles.
8. Urge enforcement of applicable bicycle traffic laws by local governments.
9. The bicycle mode transportation in
shall be considered as an alternative mode of the regional transportation planning process.
10. Encourage the development of bicycle facilities which will be:
Convenient to use Easily accessible Relatively safe from injury or theft Cant i nuo'us Integrated into a multi-modal transportation network
-Of service to as many segments of the population as possible.
11. Encourage non-motqrized transportation as an alternative to the automobile.
5-16

5.7 MARITIME AND RAILROAD POLICIES
1. Provide guidelines for the incorporation of rail, port, pipeline, and truck considerations in future policies of the Regional Transportation Plan.
2. Utilize adopted local Master Plans for the Ports as a basis for future port development. -
3. Recognize the interface between Ports and other publicly provided transportation facilities (especially highways) as an important consideration in future transportation planning efforts.
4. Recognize the interface between rail facilities and highways as a primary consideration in future transportation planning efforts.
5. SCAG supports commuter rail service between the following:
San Diego to Santa Ana to Los Angeles
Oxnard to Chatsworth to Los Angeles
6. SCAG supports continued investigation of intercity rail service between San Bernardino and Los Angeles.
7. SCAG should support other attempts to utilize existing rail facilities for passenger (commuter) operations.
8. Maritime alternatives for passenger transport should be assessed as travel demand and technological advances warrant.
9. SCAG should assume a more active role in developing and maintaining working relationships with the private sector operators of the region 1 s rail system.
10 Transportation terminals, including intennodal transfer points, shall be developed to accommodate a variety of modes. Consideration shall be given to the interaction of auto, carpool, transit, paratransit, pedestrian, aviation and other modes in plans for freight terminals. Consideration shall also be given to the desirability of developing combined passenger and freight terminals.
5-17

5.8 FINANCIAL POLICIES
Mu 1t i -Mod a 1
1. Seek greater flexibility in the use of transportation funds which are available or may become available from federal and state sources.
2. Support amendment of the Transportation Development Act of 1971 to remove the restriction which limits tt1e funds available for public transportation under the act to 50% of annual local costs after the first five years of operation.
3. Support state and federal policies which will assure that regional and subregional planning agencies receive an adequate and continuing level of funding for regional transportation planning.
4. Support legislation and amendments to Article 19 of the State Constitution. which would remove the "guideway" transit constraint and allow highway user revenues to be allocated for any type of transportation improvement without percentage limitations.
Transit
5. Optimum use should be made of existin~ funds for capital improvements prior to seeking new funds.
6. Encourage increased efficiency of transit operations by dt?veloprlent and implementation of transit efficiency standards, allocation incentives, and improved data gathering and analysis capabilities.
7. Encourage tran·sit decision-makers to establish a desired ratio of fares to subsidy. As costs increase over time, it is necessary for financial stability, that either a) this relative level be maintained through periodic review and increase of fares or b) the subsidy share of total costs be increased by increasing taxes.
8. That the available Section 5 funds be made available within the Los Angeles-Long Beach urbanized area .9!l!,t for operdting assistance requirements.
9. The allocation of Section 5 funds for FY 75, 76, and 77 is available to each operator for that annual element year plus the two years following.
10. SCAG will take the necessary united action to ensure the availabilty of Section -3 funds to meet all reasonable capital requirenents as approved in the Regional Short Range Transit Plan.
5-18

Revised l-25-79
lOA. SCAG will distribute UMTA Section 5 funds between counties in the Los I Angeles/Long Beach urbanized are!a according to a formula which includes population and travel-system factors. (The details of the -formula and the conditions which accompany its use are appended in Appendix H.)
11. Seek increased funding for transit operations.
12. Every effort shall be made to maximize the use of available federal transportation grants to support transit system operating costs and major capital improvements.
13. Encourage local governments to use Federal Revenue Sharing funds for transit.
14. Seek necessary 1 egi sl ati on and canst itut i ana 1 changes to facilitate implementation of value capture financing mechanisms by transit districts.
Highways
15. Although it would be more appropriate for increases in gasoline taxes to be levied by state governments, it is possible that federal action may result in imposition of an additional gas tax. The region will oppose imposition of any federal tax from which revenues are not retained in the region for public- transportation or highway purposes. Federal and state efforts to increase gasoline taxes should be coordinated to avoid simultaneous imposition of taxes on the SCAG region.
16. The state should seek a greater return on our federal highway user I taxes than the present 75%.
17. Ensure adequate funding of maintenance, rehabilitation, safety, and operational improvements on existing highway system.
Streets·and·Roads
18. Support a 2·cent·per-gallon gasoline tax increase, with the funds to be returned directly to local governments for transportation purposes.
19. Secure sufficient funding from all levels of government to implement the actions, programs, and projects contained within the Regional Transportation Plan.
20. Encourage the most cost efficient use of funds in each modal area.
21. No funds shall be allocated or expended for capital projects unless there is a reasonable expectation that sufficient funds will be available for maintenance and operating costs.
5-19

Revised 1-25-79
22. New sources of funds should be levied at the lowest, most appropriate, level of government.
23. Programming of projects in the Annual Element of the Regional Transportation Improvement Program (TIP) by state or local agencies shall be deemed a commitment of necessary local funds to implement.
24. Agencies, jurisdictions, or districts receiving federal funds for capital projects which are offset by the Air Quality Management Plan and waul d otherwise be required to have air mitigation wi 11 support and assist in the implementation of the air qua 1 ity measures and policies recommended.
25. Additional highway user revenues should be generated through indexing of the State Gasoline Tax.
26. For the purposes of the AQMP, the following categories funds shall be considered available to fund adopted transportation control measures, and to fund public transportation measures to meet basic transportation needs:
o All funds available under Section 5 of the Urban Mass Transportation Act of 1964 as amended.
o All funds available under Section 3 of the Urban Mass Transportation Act of 1964 as amended.
o To the extent necessary to support required capital improvements, and the extent allowed by law, Federal Aid Primary and Federal Aid Interstate highway funds.
o To the extent necessary and to the extent allowed by law, Federal Air Urban highway funds.
o To the extent necessary and to the extent allowed by law, Transportation Development Act (TDA) funds. This policy does not ap~y to TDA funds allocable to areas outside the non-attainment area.
o All fare box and other operating revenues. o To the extent necessary and allowed by law, Proposition 5 funds. o Funds flowing through the State Highway Account from all sources
including transfers from the Department of Motor Vehicles Account. o Local gas tax funds excepting those funds required for maintenance
and safety. o Social service funds for transportation purposes including but not
limited to UMTA 16 (b)(2) funds.
5.9 Institutional Arrangement Policies
1. Decisions and resolution of transportation conflicts should be made at the lowest level of government empowered to address the issue.
2. Agreements should be reached between SCAG, Caltrans, CTC•s, IVAG, VCAG, and transit operators which are intended to eliminate duplication of effort; fix responsibilities with agencies best qualified to do the work; improve coordination; and ensure the appropriate de 1 egat ion of res pons i bil ities to the county transportation commi ssions and other designated subregional agencies.
3. Streamline the transportation planning, programming and project review process to minimize review time and red tape.
5-20

programs and • act1ans

6.0 PROGRAMS AND ACTIONS
6.1 MULTI-MODAL
This section describes two planning approaches that transcend most of the transportation modes:
o Transportation System Management {TSM), which includes Ridesharing, and
o Air Quality Management.
Each planning approach leads toward attainment of the goals adopted by the region. For example, TSM attempts to make the most of the system we have by improved management and operational efficiency. The Ridesharing Program (a TSM technique) tries to maintain mobility without adding more cars to the roads. The Air Quality Management planning activities seek to improve air quality -- in part, by reducing the pollution caused by transportation.
The action recommendations are scattered throughout the plan. A separate TSM document, elaborating on TSM actions, has been prepared, and is available under separate cover. TSM actions in this document are labeled as such in each modal section. Ridesharing and transportation air quality actions are also in this section.
Understanding the integration of these strategies throughout the plan is important, since many actions support both programs. For example, providing exclusive lanes for transit, vanpools, and carpools is basically a ridesharing strategy. However, when two or more people who once drove separately share a vehicle, there is also less congestion and vehicle pollution. Thus the exclusive lane also meets the aims of the transportation management and air quality approaches.
The Ridesharing program now under way includes an extensive citizen involvement phase with specific c001munity liaison areas spread throughout the region. Infonnation being gathered will be developed into specific RTP amendments to be made to this plan in February of 1979.
The Air Quality Management planning program is now examining the possible options available to the region to attain clean air. After review and adoption, revised transportation air quality actions will also be amended into the Region a 1 Trans port at ion Plan in February of 1979.
6.1.1 Transportation Systems Management (TSM)
Transportation Systems Management actions are identified in the modal sections.* These are generally 1 ow-cost projects that improve, rather than expand, the existing system. The TSM actions, collectively, generally conserve energy, improve air quality, and increase transportation efficiency, safety, and mobility.
* Separate modal sections address the automobile, transit, highways, airports, non-motorized modes, and maritime and railroads.

TSM activities may be divided into eight categories:
1. Traffic operations improvements
Freeway operations improvements, including ramp metering Traffic signal system improvements Traffic channelization Creation of one-way streets
2. Transit service improvements
Purchase of buses or vans Express bus service improvements Shelters and other passenger amenities Passenger information systems and services
3. Transit management measures
Improvements in routing and scheduling Other management information and control systems Vehicle communication and monitoring techniques Improved maintenance procedures Operational agreemtns Regional service standards and guidelines
4. Special commuter services
Commuter bus service Vanpool s
5. Community-level paratransit services
Jitneys Dial-a-ride/dial-a-lift Shared-ride taxis Service coordination Brokerage
6. Other actions to encourage ridesharing
Regional Rideshare Program Express lanes for carpools, vanpools, and buses Bypass lanes for high-occupancy vehicles at metered on-ramps Park-ride/park-pool lots Carpool/vanpool matching services Employee incentive programs
7. Parking management
8. Bicycle and pedestrian facility improvements
6-2

6.1.1 Transportation Systems Management (TSM) Ridesharing Program
Revised 1-25-79
In early 1977, the SCAG Executive Committee decided that developing incentives for ridesharing would be an important priority in the region's transportation system. Action was needed in two areas to develop such incentives. First, the public had to become aware of the congestion, energy, cost, and air pollution problems facing the region and the rationale behind various strategies which could address these problems. Second, Southern Californians had to have a meaningful ro 1 e in planning to meet these problems and in the development of solutions. The Executive Committee felt such actions were lacking in the implementation of the Santa Monica freeway "diamond laneu and did not want to see that experience repeated.
As a result, the Executive Committee authorized staff to pursue a ridesharing public awareness and participation program. The program was to cover transportation-related problems, ridesharing facilities and services, as well as other incentives, and was to solicit input from a wide variety of citizens and interested groups.
At the same time, Caltrans recognized a need for greater public awareness and participation, especially with respect to its required report to the FHWA (Federal Highway Administration) regarding the ultimate status of the north-bound "diamond lane 11 on the San Diego freeway. Recognizing the advantages of working together, the two agencies made a decision to become joint sponsors of the program and to invite the County Transportation Commissions and other transportation agencies to become more involved as well. These agencies now comprise the Ridesharing Steering Committee, which is the meChanism for managing the program and working together on the problems confronting the entire region. Teamwork not only produces a better product by incorporating the strengths of each agency•s expertise, but also provides more effective results where a consensus of opinion is reached.
The period for developing the work plan of the ridesharing program culminated near the end of 1977. In January 1978, the regionwide awareness portion of the program was initiated. The focus of this effort was to reach as many people as possible, regionwide, with the ridesharing message. This included the development of a wide range of collateral materials such as a film, slide show, brochure, portable displays, public service announcements and billboards.
Simultaneously, the agencies began to develop the community-level awareness and participation effort. In order to maximize resources. nine Community Liaison Areas {CLAs), which represented a cross section of demographic characteristics in the region, were selected for an intensive
6-3

Revised 1-25-79
involvement effort. This part of the program also included special training of an interagency ridesharing team in both the technical aspects of ridesharing and communication/public involvement skills requisite to a major effort of this type. In April 1978, the regionwide awareness and community-level involvement efforts were brought before the public in a kick-off press conference. These efforts will continue through the end of 1978. In August, a private-sector employer program was begun and will also continue through the end of the year. To date, over 2,000 people have attended meetings at which Come Together ridesharing presentations were made and the program 1 s exhibits have been displayed at fairs which have attracted over 500,000 people.
The goal of these efforts was to provide information on ridesharing options and to learn from the public which of the ridesharing options are most acceptable. ·
An analysis of the infonnation gathered through the involvement program, as well as further refinement of the technical feasibility of the ridesharing options, was done during the fall of 1978. The public 1 s preference for the different ridesharing options was evaluated in light of the technical and financial feasibility of implementing these options in the various communities. In 1979, the partner agencies in the Come Together ridesharing program are planning to implement a second phase regiom'lide awareness program, a set of ridesharing demonstration projects, additional community involvement activities, and research to develop further the potential for ridesharing in Southern California.
Preliminary analysis of the public 1 s responses leads to the conclusion that while there is support for many of the ridesharing facility and service improvements, these improvements alone are not the only way to encourage ridesharing. While these improvements will generate a certain amount of ridesharing, additional actions are needed to insure that the facilities and services are used to their maximum potential. Rather than solely focusing on the usupply 11 of more transportation facilities and services, it is important now to focus on maximizing the "demand 11 side of ridesharing.
Social interaction and convenience are prime considerations in the decision to rideshare. Social interaction can be facilitated by taking a more personalized approach to promoting ridesharing. This can be accomplished through a strong empl oyer~based program (which draws on the infonnal communication network which exists among employees at the place of work) and through a community-based program (which draws on neighborhood organizations). In addition, both these programs \1ould offer the opportunity to make ridesharing more convenient (through the establishment of neighborhood park/ride lots, or preferential parking at the place of work). In order to have an impact on the demand side of ridesharing, it is recommended that both types of programs be undertaken in the next phase of the rideshari ng program.
6-4

Revised 1-25-79
The current ridesharing program has been focusing on the commute trip because it is easiest to influence behavior on regular trips and because it is trips in the peak hours that do most to aggravate the problems of congestion, air pollution and energy consumption. While this focus should continue (to be tied in with the employer program) there is an additional need to examine how ridesharing can be encouraged for non-corrmute trips. This could be accomplished through both a home-based program as well as through focusing on major trip-generating activity centers.
Finally, while transportation agencies agree that certain facilities and service improvements are needed or should be implemented, there is a continuing need to involve citizens of Southern California in the process and to provide information to the community on these improvements-and how they contribute to solving some of our transportation problems.
6-5

Revised 1-25-79
Ridesharing Actions
1. SCAG supports Cal trans' implementation of rideshare lanes on the Santa Ana, Harbor and Century Freeways as well as related ridesharing activities on these freeways including bypass lanes at metered onramps and park/ride and park/pool lots.
2. SCAG, Caltrans and the subregional agencies will continue to support Commuter Computer's ability to provide carpool, vanpool and taxipool matching and will support funding for expansion of existing computer capacity to handle service information and rideshare matching.
3. Caltrans will install bypass lanes at metered freeway ramps, where such lanes are technically feasible and appropriate, according to the following schedule:
RAMP METERING PROJECT IMPLEMENTATION SCHEDULE
RAMPS RAMPS WITH METERED BYPASS LANES BYPASS LANES
Jan. 197B 253 46 18% By Jan. 1979 373 93 25% By Jan. 1980 602 211 35% By Jan. 1983 1000 400 40%
4. After completion of the southbound portion of the San Diego Freeway project, and the rideshare program update, the Executive Committee will reconsider the preferential use of the median lanes on the basis of all available infonnation.
5. Caltrans will cOnstruct the I-105 freeway as a joint transit way; .include ramp metering and by-pass lanes for high occupancy vehicles. Planning and design will include facilities for preferential access to LAX for high occupancy vehicles.
6. SCAG, the CTCs, and Caltrans will continue to examine existing and new local ordinances, and state and federal laws and regulations relating to their implications for ridesharing, and propose changes which will encourage the use of carpools, vanpools, taxi pools, buses, and trains.
7. SCAG, the CTCs, transit operators, and affected local governments will identify 3-5 locations for testing alternatives to traditional parkride/express bus service. Such alternatives might include provision of public subscription bus service, private commuter bus service, or changes in pub 1 i c trans it 1 abor cant racts which permit the use of part-time drivers. Implementation of service, on a trial basis, will begin in FY 80.
table 6.1-1 6-6
Revised 1-25-79
8. For the purpose of expanding employer-sponsored ridesharing programs, SCAG, Caltrans and other transportation agencies will develop a centralized ridesharing marketing and information agency oriented towards employers and the commute trip. Such an agency will be identified and operational not later than January 1, 1980.
9. SCAG and the CTCs will work with the Public Utilities Commission to develop a mechanism for providing private commuter bus operators interim authority to start new routes.
10. SCAG and the CTCs will work with local governments, taxi operators, and Commuter Computer to test the feasibility of the taxi pool concept.
11. SCAG, the CTCs and Commuter Computer will work with the PUC, State Insurance Board and the Los Angeles Area Chamber of Commerce to develop adequate, low-cost liability insurance for owners, operators and users of group transportation.
12. SCAG, the CTCs and Caltrans will work to amend the State Constitution to pennit Caltrans to develop park-ride or multi-modal lots.
13. SCAG, the CTCs and Caltrans will explore new methods of providing· tax incentives to employers, commuters and service operators to encourage ridesharing and will also publicize changes in tax legislation which relate to ridesharing.
14. SCAG, the CTCs and Caltrans will continue the current Come Together program, including efforts to increase general awareness on the problems of air pollution, congestion, energy consumption and user costs as well as specific ridesharing options.
These agencies will examine in greater detail the actual cost of driving alone versus ridesharing and increase public awareness of true costs. As part of this continued awareness effort, the agencies will develop articles for print media, speaking opportunities for program representatives on radio and television and before community groups, public service announcements for radio and television, and brochures on 3-5 sp~cific ridesharing options (including ridesharing lanes and bypass lanes).
15. As part of the Come Together effort, SCAG, the CTCs and Caltrans will develop a public awareness and involvement program in Los Angeles County, in the Harbor, Santa Ana and Century freeway corridors to increase people 1 S understanding of bypass lanes at metered ramps and express lanes and to demonstrate how these options could work in those corridors. Such an awareness program should be undertaken in other corridors as appropriate.
6-6A

Revised 1-25-79
16. SCAG, in cooperation with appropriate agencies, will develop, on a demonstration basis, severa 1 home-end or community based programs which test various techniques designed to provide a more personalized or targeted approach to ridesharing.
17. SCAG and the CTCs will study ways of promoting and developing ridesharing activities for non-commute trip purposes at selected activity centers. A public awareness and involvement effort will be conducted at at least one site during FY 80 to test the effectiveness of encouraging ridesharing for non-regular trips.
18. SCAG and Caltrans, in conjunction with the subregional agencies, will develop an infonnation-sharing and technical-assistance program to help local governments develop locally implementable projects which encourage the use of high occupancy vehicles such as reserved curbside lanes for buses and carpools~ on and off street parking programs~ etc.
19. SCAG, the CTCs and Caltrans will work to expand existing employer sponsored ridesharing programs to meet the objectives set forth in Section 4.3.4. To accomplish this objective, the agencies will assist public and private employers in providing bus passes for employees, sponsoring carpools or vanpools, providing subscription bus service, assigning preferential parking spaces for ridesharing vehicles, instituting flextime and using fleet vehicles for ridesharing purposes.
20. SCAG will assist cities and counties in developing parking programs which encourage the voluntary reduction of off-street parking spaces.
21. All governmental entities will develop rideshare matching programs ·in support of the regional rideshare program. This would be voluntary through 1982 and mandatory thereafter.
6-6B

Revised 1-25-79
6.1.2 Transportation and Air Quality
During the last two years, SCAG, in cooperation with the South Coast Air Quality Management District, Caltrans, local governments and other agencies, has been deve 1 oping an Air Qua 1 ity Management Plan for the South Coast Air Basin. A similar plan has been prepared in Ventura County by the Ventura County Environment/Air Management Agency. Desert portions of the SCAG region will have Non-Attainment Plans prepared which indicate how these areas wi 11 attain the federal ambient air qua 1 i ty standards. Each of these plans, once approved by the state and federal governments. will represent revisions to the required State Implementation Plan.
These plans are required to consider transportation control measures and to rec001mend those which are to be implemented. Congress, in the 1977 Clean Air Act Amendments, included 18 control measures that have to be considered for implementation.
The Clean Air Act also includes numerous other requirements which impact local governments and transportation decisions significantly. These include:
o Commitments to implement approved control measures.
o Commitments to do additional analysis of measures as required.
o Commitments to use all available resources to establish, expand, or improve public transportation to meet basic transportation needs.
o Expeditious programming of and priority for transportation control measures and public transportation measures in Transportation Improvement Programs.
o Implementation of an Inspection/Maintenance Program if an area cannot meet standards by 1982.
o The Regional Transportation Plan and Improvement Program must conform with the approved State Implementation Plan.
If the air quality plans noted above are not completed within a congressionally mandated schedule and/or the requirements of the Clean Air Act are not met. the Act would preclude the awarding of certain federal transportation funds under Title 23, United States Code (as well as other federal funds). These sanctions would not apply to transportation projects under that title for safety, mass transit, or transportation projects related to air quality improvement or maintenance.
In addition to sanctions against federal funds, the Act would also prohibit the granting of any permit allowing new emission sources to be started in the region, thus blocking commercial, industrial, and other types of growth.
6-7

Revised 1-25-79
Because of the significance of these issues and the contribution of mobile sources to the total air quality problem, SCAG, the County Transportation Commissions, subregional transportation planning agencies, Caltrans, transit operators, and local governments have joined with air quality control agencies to prepare the plans discussed above and prepare a coordinated approach to these and other (i.e., State lewis Air Qua 1 i ty Act) requirements. An extensive interagency process was developed in the South Coast Air Basin with SCAG and the South Coast Air Quality Management District sharing co-lead responsibilities for the AQMP. Subregional agencies (counties) assisted by elected officials of selected cities, the County Transportation Commissions and SCAG prepared subregional inputs to the AQMP. SCAG prepared growth forecasts, land use, transportation and energy inputs. The SCAQMD prepared stationary-source inputs. An extensive public involvement process was also developed and utilized in preparing the plan.
The conclusion of the South Coast AQMP is that standards for oxidant, nitrogen dioxide, and carbon monoxide could be met by 1987 but not by 1982. An extension of time will be necessary to attain these standards. Air Quality tactics as adopted in the Air Quality Management Plan for the South Coast Air Quality Management District (1-25-79) are reflected in Table6.1-2.
6-8

~ .~ --~ - "~ ~
-;: ~ -• < 0 ~
• < 0
~
u 0 ~ • ~ < 0 -• • 'E ~
• ~ 0 < ·-••
1_!!!, .~ . ~ ·-o-o• ~0 ~ ... --~<
£~ • !i'~ cru
"~ ~~ <0 uo ~~
~· .o ~~ ~ 0
ll
~ • z.
I . I " .
I
, I I· I 'i i I
I ''
~.nu:>~ll">u:>CNU'> N~N""u:>..._ ..... ,_,_NN""'-O...._o:l CQ o o I I o I j I I I I 0 J I ~:r::r:::z::::r:t:::t::r::r::z::r:r:r:c:z:
~
• ON"""'""'"""a:l"'O.-.N""""""' .,_,.....,...., ..... ,_ .......... ,_,....NNNNNN
6-BA
-"' .... ..,"' ..... (Oa:la)o;> ..... I I I I I
%::1::Z::%:t:
• ~ ~
• • u 0 v ~
~ <
h • •• -o ~! . . ·-.l!f ·~ 0~
~· u :-e g~
0 ·-~ • •
~~ 0~ •u • • r~
~s ~ ,. • •• ~v -· .~
• •• ~ ~-~~ 0 -~ • • -· ~ - ~
~--~ ~~ • ~ ~ 1 0
" 0 ~ •
~ • • 0 u • • ~ 0
0 E • t • • < ~ ~~ ~ • 0~ ~ • • -~ 1.-8 ~ • -· ~ -z • • -< ·~ 0 0~ ·-• ~ u .ll 0 ~ ~ • -· ~ ~0 ··-- 0~ ~ ~ u ~ .o
~~
• -~
0 • ~0 uv
t• -~ 0
.!' • • ~ f ~
·~ 0 • o• •• u-• • • 0 ' ~-<. -> • • • ~~ • ~ .,; • • f f 0 ' • < ~ 0
·~ • :;i ~~
~0
• • • .:? • < . ~ ·-0~ - u ~-·~ 0~
~ ~· < ·-0 0 d • ~ 0~
~ --u •> • ·-~ ·-~ •• • w·-
• • • ~· 0 00 ~ ~-• • e
~
• ~ 0 • u • '
0 w z
•
table s .... -2

Revised l-25-79
Air QualitY Actions
Actions denoted below by asterisks are found also in the 1-25-79 adopted Air Quality Management Plan. They represent the mobile transportation control measures, and for consistency (as required by the Clean Air Act Amendment of 1977) are so contained in the Regional Transportation Plan. Note: Some Air Quality actions listed below may also be listed in other sections of the RTP (i.e. Transit, Highways, Non-Motorized, Maritime and Rail, and Finance).
1. SCAG and the subregional agencies will provide information to the general public on the economic and environmental benefits and methods of reducing the emissions of pollutants and conserving energy; and encourage private firms to take these considerations into account in the acquisition, replacement or operation of autos, trucks, and other vehicles.
2. SCAG recommends that the state and federal governments consider a tax credit or tax deduction for low-income individuals to mitigate the vehicle maintenance costs attributable to a mandatory inspection and maintenance program.
3. SCAG will seek assurance from domestic automobile manufacturers that significant improvements will be made to the automobile, in terms of fuel economy, pollution _characteristics, and safety. Such improvements should have the following aims:
- A pollution-free engine, to be achieved either by design innovations or through the use of alternative sources of energy.
- As the average size of automobile is reduced, incorporate additional safety improvements into their design.
4. To detennine whether "reasonable further progress" is being made through transportation measures, SCAG, in cooperation with the County Transportation Commissions, IVAG, and VCAG, will establish perfonnance criteria for all transportation management measures to detennine annual progress in their implementation and effectiveness.
5. As a part of the FY 79-80 regional planning effort, SCAG, in cooperation with County Transportation Commissions and transit operators, will develop and document in the RTP a plan for long- and short-range transportation improvements designed to meet basic public transportation needs. This plan will be implemented according to the schedule adopted with that plan and will be presented to the Executive Committee for adoption by June 1980.
6-9

Revised 1-25-79
*H-1 Increased Air Passenger Load Factor
6. SCAG will establish a task force of airline representatives of commercial airlines, airport operators, and regulatory agencies to detennine specific implementation actions to achieve an average load factor of 70%. Recommendation for action to be made by July, 1979. (See Action 56 and Airport Action 22).
*H-2 Jet Aircraft Ground Taxi Operation Improvements
7. SCAG wi 11 seek assurances from FAA that it wi 11 initiate a technica 1 feasibility study (if necessary) in FY 81 to detennine impacts of modifying engine speeds during aircraft idling and reducing the number of in-operation engines during taxiing. (See Action 56 and Airport Action 22).
8. The FAA should prepare, in conjunction with the affected agencies, an operating procedure for each type of aircraft in use. This procedure should include RPMs for engine, numbers of engines to be used, and allowances for reduced taxi speeds if necessary. (See Action 56 and Airport Action 22).
*H-3 Triple Trailer Trucking
9. SCAG and Caltrans,working with truck operators and other appropriate agencies, will include (in the Overall Work Program) a study of triple trailer trucking focusing on outlying routes in the South Coast air basin.
*H-4 Modified Work Schedules
10. SCAG will work with both private and public sector employers to develop an educational program designed to encourage both staggered work hours and four-day, 40-hour work weeks.
*H-5 Parking Management: Carpool Preferential Parking (see also H-34)
11. SCAG, the CTCs and Caltrans will work to expand existing employer sponsored ridesharing programs to meet the objectives set forth in Section 4.3.4. To accomplish this objective, the agencies will assist public and private employers in providing bus passes for employees, sponsoring carpools or vanpools, providing subscription bus service, assigning preferential parking spaces for ridesharing vehicles, instituting flextime and using fleet vehicles for ridesharing purposes.
*H-6 New General Aviation Aircraft Engine Controls
12. SCAG will encourage the ARB (California Air Resources Board), EPA and FAA to establish requirements for new piston aircraft engines to meet emission standards as proposed by the EPA in 1973.
6-9A

Revised 1-25-79
*H-7 Emission Standards for all new Non Farm Heavy Duty Offroad Vehicles
13. SCAG and SCAQMD will recommend that ARB establish exhaust emission standards for all new non-fann heavy-duty off-road vehicles comparable with standards for highway heavy-duty trucks.
14. SCAG wi 11 promote new standards for non-farm heavy-duty off-road vehicles through its legislative/administrative advocacy program.
*H-11 Electrify Railroad Switching Yards
15. SCAG will seek federal/state/private sector financial support of feasibility studies for the electrification of railroad switching yards and all operations, if appropriate, or other equivalent emission reduction measures.
16. SCAG will seek commitments from the major railroad companies owning/ operating classification/switching yards at Colton, East L. A. (Hobart Yard), South Central L.A. (Watson Yard) and the Harbor Service Railway at Port Hueneme, Long Beach, and Port of L.A. to convert those yards to electric power pending the results of detailed feasibility studies.
*H-13 Trip Reduction Program
17. SCAG, in cooperation with other appropriate agencies, will develop a media/educational program aimed at maintaining the current daily automobile trip-making level.
18. SCAG and other appropriate agencies will evaluate alternative methods for 1 ocal government implementation of automobile trip reduct ions (i.e., land use planning, circulation, home goods delivery).
19. SCAG, in cooperation with local government, will identify demonstration projects to be tested for automobile trip reduction effectiveness.
*H-15 Emission Standards for New Farm Equipment
20. SCAG and SCAQMD will recommend that ARB establish new exhaust emission standards for all new farm equipment similar to those promulgated for on-road heavy-duty equipment.
21. SCAG will promote new standards for new farm equipment through its legislative/administrative advocacy program.
6-9B

Revised l-25-79
*H-16 Modify Old and New Jet Aircraft Engines
22. SCAG will encourage EPA and FAA to establish emission standards for modifying existing jet aircraft engines to meet proposed 1978 Federal standards.
*H-18 Inspection and Maintenance of Light Duty Vehicles
23. SCAG endorses the California Legislature's adoption of legislation to mandate implementation of an annual vehicle inspection/maintenance program in the South Coast Air Basin. This program would require full mandatory inspection of light duty vehicles at State supervised inspection stations using loaded tests.
24. SCAG, in conjunction with the South Coast Air Quality Management District and other interested agencies, wi 11 prepare a 1 egi slat ive advocacy campaign to promote state mandated legislation for an annual inspection/maintenance program.
25. SCAG will prepare information to encourage governmental entities to initiate an immediate voluntary inspection/maintenance program for their fleet vehicles until a mandatory program is in operation.
*H-23 Increased Bicycle and Pedestrian Facilities
26. SCAG will coordinate bicycle planning. implementation, and safety programs among all participants in the transportation planning process.
27. SCAG and the CTCs will encourage cities and counties to use available SB 821 bicycle and pedestrian facilities funds in support of projects which discourage auto use.
28. SCAG will seek increased funding, from private, local, state and fed era 1 sources, for bicyc 1 e and pedestrian faci 1 it i es, through its legislature/administrative advocacy program.
29. SCAG, the CTCs, and Caltrans will encourage and support promotional programs to increase the provision for and use of bicycle and pedestrian facilities. ·
30. SCAG will encourage cities and counties to consider amending zoning, subdivision and building ordinances to require the provision of bikepaths, over-crossings and pedways, bike racks and other facilities to encourage walking and bicycle riding.
*H-24 Improved Emission Controls from Motor Vehicles
31. SCAG will seek ARB administrative action to revise emission standards as defined in the AQMP for on-road vehicles beginning with the 1983 model year.
6-9C

Revised l-25-79
*H-25 Reduce Jet Aircraft Queuing Delays
32. SCAG will utilize a task force of representatives of commercial airlines, airport operators and regulatory agencies to develop an implementation program which will reduce aircraft delays and excessive idle/taxi operations while on the ground. Recommendations for action to be made by July 1981 with implementation by appropriate agencies or finns prior to 1983. (See AQ Action 56, and Airport Action 22).
33. The airlines and regulatory agencies should evaluate existing operating procedures and flight schedules to minimize the taxi and queueing delays. Control of landings, and increased use of gate holds should be given high consideration. In addition, airport operators should design airport expansion and construction based on shorter taxi distances, reduced airplane ground congestion and runway configurations which minimize ground delay. (See AQ Action 56, and Airport Action 22).
*H-34 Rideshare Program (see also H-5)
34. SCAG, the CTCs and Caltrans will work to expand existing employer sponsored ridesharing programs to meet the objectives set forth in Section 4.3.4. To accomplish this objective, the agencies will assist public and private employers in providing bus passes for employees, sponsoring carpools or vanpools, providing subscription bus service, assigning preferential parking spaces for ridesharing vehicles, instituting flextime and using fleet vehicles for ridesharing purpOses.
*H-35 Traffic Signal Synchronization
35. SCAG, Caltrans, CTCs and appropriate local governments will identify candidate high volume intersections for signal synchronization. These intersections should form clusters of contiguous, interconnected systems and should build upon those intersections already having such systems.
36. SCAG, in cooperation with CTCs and implementing agencies, will investigate additional funding for signal synchronization and prepare necessary recommendations to obtain such funding.
6-90

Revised 1 ~25-79
*H-36 Voluntary Retirement of Older Vehicles
37. SCAG recommends that the Legislature authorize through legi slat ion the actions listed below and appropriate sufficient funds to carry out these actions.
-The Air Resources Board will initiate a program wherein they will offer to purchase for $450 vehicles 12 years or older registered in the South Coast Air Basin whose owners voluntarily want to sell them.
-The Air Resources Board will utilize the private sector car dealers to the maximum extent possible and provide incentives for their involvement in this program.
-The Department of Motor Vehicles will substantially increase the registration fee for out-of~state vehicles 10 years or older coming into the South Coast Air Basin.
-The Department of Motor Vehicles will reduce to $1 the registration fee for vehicles that replace those sold to the state through this program.
- The enabling legislation should authorize the State Board of Equalization to waive the sales tax normally levied on a vehicle purchase when that vehicle is replacing one sold to the state through this program.
38. The SCAQrm ·and ARB should seek private sector funding of the program for voluntary retirement of older vehicles, and allow it as a stationary source offset action.
39. SCAG will seek implementation of actions related to voluntary retirement of older vehicles through lts legislation/administrative advocacy program.
*H-60 Electric Vehicles
40. SCAG \'lill include (in the Overall Work Program) a study of electric or hybrid vehicles as an alternative to the auto for short distance travel in urban areas with specific application to fleet operations.
6-9E

Revised l-25-79
*H-72 Improved Trucking Efficiency
41. SCAG will encourage the ICC (Interstate Commerce Commission) and the Public Utilities Commission to revise their deadheading regulations to decrease the number of empty backhauls by proprietary and non-proprietary trucking operations.
42. SCAG will evaluate alternative incentives for the trucking industry to reduce empty backhauling for selected freight movements.
43. SCAG, in cooperation with the California Trucking Association and other appropriate trucking interests, will evaluate methods to develop a centralized brokerage-dispatching system to increase the trucking fleet average load.
*H-85 Freeway Facility and Transit Improvement Supporting High Occupancy Vehicle Movement
RTDP - Element II - Freeway Transit
44. Caltrans will develop rideshare lanes (designed for possible conversion to rail} on the following freeways:
a) Harbor Freeway (from 1-10 to 1-105 with stations south of 1-105 to San Pedro and to Long Beach via Route 11, 405 and F).
b) Santa Ana Freeway (from downtown Los Angeles to 1-605), c) Century Freeway (from LAX to I-605), d) Extension of El Monte Busway from its current western tenninus to
Union Station.
45. OCTC, OCTO, Caltrans and local agencies will:
a) Complete the alternatives analysis of the high capacity transit improvements in the Santa Ana/Los Angeles Corridor
b} Conduct preliminary engineering and EIR/EIS work on the first usable segment of the Santa Ana Transportation Corridor.
c) Upon successful completion of the above design and construct an appropriate facility serving the high activity Santa Ana corridor to be integrated with transit facilities being designed and constructed in Los Angeles County.
6-9F

Revised l-25-79
*H-86 Wilshire Rail Line
RTDP - Element IV
46. SCRTD will design and construct a rail rapid transit line from downtown Los Angeles along Wilshire Boulevard to Fairfax Avenue, north on Fairfax to Hollywood, and through the Cahuenga Pass to North Hollywood. This will be integrated with the freeway Transit and Downtown People-Mover elements of the RTDP.
*H-87 Los Angeles Downtown People Mover
RTDP - Element Ill
47. The City of los Angeles will design and construct a downtown people mover that would include intennodal transfer facilities at Union Station and the Convention Center.
*H-88 Congestion Relief Freeway Widening
48. SCAG will promote expeditious implementation of currently programmed (in the TIP) widening projects which relieve peak hour congestion by seeking additional funding for such projects.
49. SCAG, in conjunction with Caltrans, CTCs and affected agencies, will evaluate additional widening projects to determine impacts, (including noise} costs and effectiveness of reducing emissions and improving mobility. (Approximately 300-400 lane miles of freeway widenings have been identified as candidate proposals by Caltrans.)
*H-89 Transit Improvements
RTDP Element I
50. Trans it operators will
a} Maintain existing levels of service; b) develop convenient transfer facilities to encourage
greater transit utilization; c) modernize transit facilities and equipment including
revenue vehicles; d) implement, in conjunction with appropriate City and
County of los Angeles agencies, transit priority programs e) develop community transit services when appropriate.
· 6-9G

Revised 1-25-79
*H-112 Carpool Signups for Governmental Employees
51. All governmental entities will develop rideshare matching programs in support of the regional rideshare program. This would be voluntary through 1982 and mandatory thereafter.
*H-113 Governmental Purchase of low Emission High Fuel Economy Vehicles
52. A 11 governmenta 1 entities shall estab 1 ish programs to polluting, high fuel economy vehicles for their fleets. will be mandatory after 1982.
purchase 1 ow This programs
*H~114 Governmental Vehicles to a Program of Inspection and r~aintenance
53. All governmental entities, including special districts, will develop programs to perform low emission tune ups on all vehicles including heavy duty trucks and maintenance equipment. This will be a voluntary program through 1982 and mandatory thereafter. This program will require a minimum of two years per year per vehicle.
*H-117 Santa Ana Corridor (see also H~85)
54. OCTC, OCTO, Caltrans and local agencies will:
a) Complete the alternatives analysis of the high capacity transit improvements in the Santa Ana/Los Angeles Corridor
b) Conduct preliminary engineering and EIR/EIS ~'>lark on the first usable segment of the Santa Ana Transportation Corridor.
c) Upon successful completion of the above design and construct an appropriate facility serving the high activity Santa Ana corridor to be integrated with transit facilities being designed and constructed in Los Angeles County.
6-9H
Revised 1-25-79
*H-118 Reduce Non Recurrent Congestion
55. Caltrans shall develop those automated traffic management procedures necessary to reduce non-recurrent congestion on the freeway system. This should include expansion of the electronic surveillance system and changeable message signing, closed circuit television, highway advisory radio messages, and improved response times in clearing accidents and other forms of non-recurrent congestion.
56. For the three AQMP measures relating to airports (H-1, H-2 and H-25) and their associ a ted transportation act ions, the total emissions from each airport should be determined and the public agency owning or operating these airports can implement these three measures or take whatever other actions are necessary to reduce the emissions by an amount equivalent to those that would be reduced by the individual airport and VMT control measures -- provided that the equivalent reduction takes place at the airport originating the emissions.
57. SCAG, in cooperation with Caltrans, CTCs, subregional agencies and 1 oca 1 governments, where appropriate, wi 11 continue to ana 1 yze and recommend other measures which may be des i reab 1 e to reduce mobile source emissions.
58. SCAG, through its monitoring and review responsibilities, will direct adherence to, and provide progress reports on, implementation of air quality measures on the schedule shown in Table 6.1-3 on the following page.
6-91

'' u ,_
1979 1980 1981 1982 1983 1984 1985 1986 1981 1988 Implementing Agency
-~-·~-··---~------··---AIRLINES
AIRLINES AND AIRPO~T OPERATORS
,_'
"-2
lncr~a~ed Air Pns~ger Lo~d F~ctor
Jet Aircraft Gro~nd hxi Operation [mprovement5
TRUCKING ~-3 Triple-Trailer
~---•
o--o
~---~
COI'IPA~lES Trucbng [r-PILOT i!.!tlN5T2T.!ilfi __
£MHOIER5 ,_, Modified Work Schedules
to.
[)-~Il]J.!!.G,!~~S~CJ._ PILOT 0£1101tSTRATION
EMPLOYERS AND PARKING LOT OPERATORS
,_, Carpool Preferential Parking <>------:=~"' ---==:;:;:;;;;;;;;~:;:;:;;;;;;;;....; D- Yi!LooAAY--
MANUFACTURERS
MA~UFACTURERS
RAILROAD COMPANIES
,_,
,_,
H-11
New General Avidtlon ~i rcraft Engtne Sontrol s
Emisston Standard:; for all New Non-farm fleavy-Duty Off-Road VehiCles
Electrify Railroad $~itching Yards
Submitt~l
to.
~·~
EPA approval of MB submittal of final S!P'levlsion for pre-1982 01easures.
Regional refine111ent of post-1982 further study measure; ARB review and submittal to EPA a~ final SIP revision.
table 6.1-3
. .. 19113 11:mEL leAR . ..
- -- 1983 MOOCL YEAR ----------------------+
- . _.....
Development
0 0
0 0
Teclm1ca1 studies ~lternatives analysis preliminary engineering, impact and feasibility analy•is, envirornnenta1 clearances, f1nancial prograrmting, etc.
!mpleonentation
- -- - Actions carryin~ out the recOOI'IIended measures resulting in emission reductions.

"' ' ~ ;><;
lf11Jiefl'le0tirlg Agency ~ -·· -·· _ .. -·· _, -·· _, _,.
~r·· -·· -· -·· -·· _,. -"· - -· _, _ ..
"' CONSUMERS H~l3 T~ip Reduction Proqram
[}. OE~S.ll_Al!.ll.!,_P!;gJllTl.,
MANUFACTURERS H-15 Emission Standards • .. for New Farm Equipment
1983 '«JOEL H~~
MANUFACTURERS H-16 Modify Old and New • .. Jet Aircraft Engines to Meet Pro~osed 1978 Federal Standdr<is
BUREAU OF AUTO- H-18 InSpection and Main- "' MOTIVE REPAIRS, tenante of Light· DEPARTMENT OF Duty Vehicles
D- 'CHAii'sr'oFoi4Ncli$i.iP------CONSUMER AFFAIRS IIAHOATOR~
"' ~ CITIES ANO H-23 Increased Bicycle and COUNTIES Pedestrian Facilities
[}-Ei'tsTI~G ANO PILOT PROGRAMS
• ... MAMUFACTURERS H-24 Improved Emission
Centro Is for Motor 'lehlcles
1983 i'IIJDEL YEAR
• .. AIRliNES AND H-25 Reduce Jet Aircraft AIRPORT Queu1ng Del an OPERATORS
"' EMPLOYERS H-34 Rideshare Program
[}-EiiSTlNG AND PilOT PiiOG'AAMs- - - ~
Submittal Develo~nt
"' . -E~A approval of ARB submittal of final S!PKevi>ion for pre-1982 measures.
Regional refinement of post-1982 further study measure; ARB rev1ew and !lubmittal to EPA as final SIP revision.
table 6.1-3
<) <) impact and feasibility 4Mlysi5, en~irorwnental clearances. financial prognnrning, etc.
!mplemenUtion
• • Actions carryinp out the recorrmended measures resulting in ennss1on red~ctions.
I

~
' ~ r
·T~Illtt'IIUIJY 1979 1980 1981 1982 1983 1984 1985 1986 1987 1988 A..ency ~ J.n. Jul, ..-n. July ....,_ July JM. July 1"· July .lin. July ....,_ July .... n. .July .11111. July .lin. I ~ I I I I I I I I I I I I I I I I I I
I I I CITIES, COUNTIES P.NO CAL TRANS
ARB, OMV, SCAQMD
H-35 Traffic S1gnal Syncllroni zation
K-36 Voluntary Retirement of Older Cars
"
MANUfACTLJRERS I H-60 £1ectrte Ve~ichs MW HHT OWNERS
TRUC~ING OPERATORS
CAL TRANS ~NO TRANS IT Q[PRATDPS
no
'"'
K-72 Improvea Truck1ng Efficiency
H-85 freeway facility and Improvements 3upport i ng H1gh-Occupancy Vehicle Movement
H-86 ~1lst>ire Ra1l L1ne
rl-81 Los Angeles Oo~ntown Peapl e ~over
Submi tt31
6
. -EPA approva 1 of ARB submi tta 1 of fin a 1 SIP ~ev ,, ion for pre-19B2 ~-easures.
Regional refinement of pOst-1982 furt~er Hudy measure; ARB rHiew and sutlmittal to EPA as final SIP revision.
table 6.'1-3
--- _ ________.&
Q-PiLOT PROGRAM . .. D--- --- -·1---------------+ PILOT PROilRAM . ..
. ...
& ~
---- _...
• • Development
COMPUTfOH DEPENDENT ON FUNOIN~ AVA1U16!LITY
O O Technical studies_alternative~ analysis prel1minary engineering, impact and feas 1 b1 1 1 ty ana lys 1 s, env1 ronmenta 1 cleardnces, financial prcgra11111ing, etc.
Implementation
- -- - Actions carryinr out the recormended measures resu1t1n9 in emission reductions.

~
' ~ "'
Implementing 1979 1980 1981 1982 - -~-- . - - - -
CAL TRANS "·" Conqest 10n Rei ief -~ree,.ay lohden1n~s UMITEO
Q-~PLEME~~~TION
TRANS IT H-89 Tr~nslt Improvements
"' GOVER/IJIIEI!T H-112 C4rpool S1gn-ups for EMPLOYERS Go•erMent EITiployee> 0--------------------VOUJIITAl'IY
"' GOVERN~ENT H-113 Purchase of Governm~>nt AGE~ ItS Cars for Low Em1 ss JOn
and High Fuel ~conomy [}- -"ii)LOO'TARV--
"' GOVERNMENT H-114 Regular Program of AGENCIES l n spec t i on/Ma i ntenance
for Govenrment Vehicles [}- ------ --VOLIJIH~R1
CAL TRANS H-1 17 Santa Ana Tronspor-AND TRANSIT tat ion Corr>aor OPERATORS
"' t'AL IRAN) H-118 ~on-Recurrpnt
•:nnyest 1nn Rei ref
Sutmn tta I
"' ~-~
EPA ororoval M ARB submittal of final •_.]r·"~"'''·'" 'or ~··e-1~"- ,,,.,,.,,,,-~,.
Reqional ref1n""'ent of po~t-1982 further study m~a~ure~ ARB r<!Vlc>w oo><l submittal to tPA as final SIP revision.
0
1983 1984 1985 1966 1987 1988 - - - - - . - - -- - ---
• ..
• ..
.... ,.,
""'NOATI)RY
• .. -
Development
0 impact and haSlbility onaly>"· environmental cledrdnce>, financial proqrarmnnq, etc.
.!_m_p !..~!!'tat io_f!_
table 6.1-3 • • Attions carrvin~ 011t tne rec:onrnendeM me•>ures r~sult1ng in eml;slon reduction>.


6.2 AUTOMOBILES
Automobi 1 es are the region's chief mode of trave 1 : about 5. 5 mi 11 ion of them carry 97% of the 37,865,000 daily person-trips. And they are expected to carry most of the region's 43,000,000 daily person-trips in 1995.
This chapter deals with automobile management: measures to minimize its impact on air quality, lessen its consumption of energy -- and, at the same time, promote better traffic-flow and reduce congestion.
These include measures to:
Reduce or combine automobile trips. This reduces emissions, fuel consumption, and congestion.
Improve efficiency of travel corridors. Synchronized signals, reversible lanes, etc., can make vehicle operations more efficient.
Improve the technical characteristics of the automobile itself. Better engines could lessen auto emission rates and fuel use.
Emissions, fuel consumption, and congestion are most directly improved by reducing auto use -- either the length of the average trip or the number of vehicle trips, since both have an impact on vehicle miles of travel (VMT). Thus ridesharing, which increases vehicle occupancy, also reduces emissions, energy use, and congestion.
California Emission Standards have greatly reduced auto emissions, and future improvements are expected. The 1978 model-year cars' CO emissions will fall to 2.8 grams/mile, about 3% of the CO rate of 1966 model-year cars. As newer, "cleaner 11 cars replace older, "dirtier" cars, the overall emission rate for the vehicle fleet will fall. By 1980, expected reductions (relative to 1975 levels} range from 16% for evaporative hydrocarbons to 65% for carbon monoxide exhausts.
Technical characteristics can be improved by modifying autos already in use (e.g., engine components could be maintained more frequently), and mandating improvements in new cars, through emission or fuel-economy standards. The efficiency of travel corridors can be improved by TSM actions (see Section 6.1.1)
The actions which follow increase the efficiency of auto use:
6-10

Revised 1-25-79
Automobile Actions
1. SCAG will seek Air Resources Board (ARB) administrative action to revise emission standards as defined in the AQMP for on-road vehicles beginning with the 1983 model year.
2. SCAG endorses federal fuel economy standards for 1978, 1979, and 1980 model-year automobiles.
3. SCAG endorses the California Legislature's adoption of legislation to mandate implementation of an annual vehicle inspection/maintenance program in the South Coast Air Basin. This program would require full mandatory inspection of light duty vehicles at State supervised inspection stations using loaded tests.
4. SCAG, in conjunction with the South Coast Air Quality Management District and other interested agencies, wi 11 prepare a 1 egi sl ative advocacy campaign to promote state 1 egis 1 at ion mandating an annua 1 inspection/maintenance program.
5. SCAG wi 1 1 prepare information to encourage governmenta 1 entities to initiate an immediate voluntary inspection/maintenance program for their fleet vehicles until a mandatory program is in operation.
6. SCAG recommends that the state and federal governments consider a tax credit or tax deduction for low-income individuals to mitigate the vehicle maintenanc·e costs attributable to a mandatory inspection and maintenance program.
7. SCAG urges enforcement of the 55-mph speed 1 imit. Increase public awareness of the speed limit.
8. SCAG supports signal synchronization programs.
9. SCAG will seek assurance from domestic automobile manufacturers that significant improvements will be made to the automobile, in terms of fuel economy, pollution characteristics, and safety. Such improvements should have the following aims:
- A pollution-free engine, to be achieved either by design innovations or through the use of alternative sources of energy.
- As the average s i"ze of automobi 1 es is reduced, incorporate add itional safety improvements into their design.
6-11


6.3 TRANSIT
6.3.! Setting
Public transit service in the SCAG region include~ fixed-route bus service, demand-responsive (dial-a-ride) service, route-deviation bus service and charter service. The only rail transit in the region is offered by AMTRAK. Paratransit (taxis, subscription bus service, etc.} is provided by private and public sector operators, and several local governments provide specialized services for particular groups.
Over one mil 1 ion riders use the SCAG region• s transit systems each day: about 850,000 use the Southern California Rapid Transit District service, slightly over 60,000 use the Orange County Transit District service, and the remainder are distributed among operators in other counties and municipal operators in the urbanized area. Although these transit trips are a small percentage of the total person trips (approximately 3.36%), during the peak-hour, transit person-trips rise to about 10% of the total trips.
Direct responsibility for providing public transportation service in the region is shared by several transit operating entities, generally organized according to geographic political jurisdictions. Major transit operators• service areas are shown in Figure 6.3-1. The two largest of these are the Southern California Rapid Transit District (SCRTD) which provides most of the Los Angeles County service and the Orange County Transit District {OCTO) which serves Orange County. As transit districts, SCRTD and OCTO were created by special state 1 egi slat ion.
In three other counties, local governments have formed joint powers agencies as primary service providers. These are the Riverside Transit Agency (RTA) and Sunline in Riverside County, OMNITRANS in San Bernardino County and South Coast Area Transit in Ventura County. Although specific arrangements between member cities and counties differ in each area, the general organizational relationship is one of joint decision-making, shared costs and fully coordinated service arrangements for participating local governments.
In addition to the service provided by transit districts and joint powers agencies, several cities own and operate municipal transit systems, especially in Los Angeles County. Many local governments also contract for service from other cities and/or taxicab companies.
There has been a significant expansion of paratransit service in recent years, with more than a thousand social service agencies and privatesector providers offering specialized transportation service, primarily to their client groups. Recent surveys have identified more than 5,000 vehicles committed to these types of operations in Los Angeles County alone.
6-12

' ' '. ' ' ' ' \
VENTim COUNTY
- 'I<''·-'' ;-~
., 'i~<X ''"'
il J:,;;;:;
' ' ' ' ' ' ' ' \ ' ' ' ' ' ' ' '.
SCRTD
' ' ! '
w; ""'
LOS AfiOEIIS COONTY
f .
,-1 l"
P\ STITUTORYT!Wm \IDIS1111CTS
• TDAIIIC\JJCEOW\IjiC11'1J. OPERITORS
§~l,lj(IPIJ.OPEII!T«<S
0\IUjiCIP.(l'DEIOIMDIIESKIIS'I!' .,,. D JOIIfl PO\I6S •UT!I::llrm
PUBLIC TRANSIT SYSTEMS IN THE SCAG REGION
FIGURE 6.3·1
OCTO
t D!SEirl WJjSII S!!TEIIS; 11CTORI'II.LEY TlliSIT JUTIIOliiT'f CITY Cf BIRSll;Jjj
SAN BERNARDINO OOUNTY
RIVERSIDE COUNTY
IOESEI!TIRJISTS'ISID!S SUNUNE + ilXTHEI~\'!III:E
~ ..:..E:l

Seventy-five taxi service providers operate 1,500 taxis in the region and carry 15 mill ion passengers per year. Nearly 100 private commuter buses are operated in the region, transporting 3,000 commuters daily. All together, 65 private bus companies offer airport transportation, charter and tour service, school bus service, and even local transit.
6. 3. 2 Transit Objectives
Transportation objectives on energy and air quality can be supported through reaching a modal split of 6% of regional person-trips on transit by 1990. It is assumed that each county of the SCAG region will improve transit ridership in proportion to its existing ridership, to meet this regional modal-split objective.
The LARTS modeling and patronage forecasting methodoloyy was used for projecting transit ridership under varying service improvement a lternatives. The alternative endorsed for planning purposes -- the Regional Transit Development Program-- projects a ridership level in the region of 1,800,000 by 1990 through service improvements. This is equivalent to a 4.4% modal split. To reach the transit objective of 6':,; modal Sfll it or 2,500,000 transit trips, other strategies which encourage transit 111ust be successfully implemented. Such strategies include fare policy changes, parking management, employee subsidies, information and rr1arketing. (Refer to HOV Section 6.1.1.)
Figure 6.3-2 projects the number of transit trips required to reach the modal split objective of 6% transit trips. The lower line reflects the increase in transit ridership due solely to population increase, assuming no transit system improvements over 1976 through 1990. The middle 1 ine reflects the projected increase in transit ridership resulting from improved service as defined by the Regional Transit Development Program (described under the Transit Development Section of this Plan). The top line reflects the transit ridership olljective of 6%.
6-lo
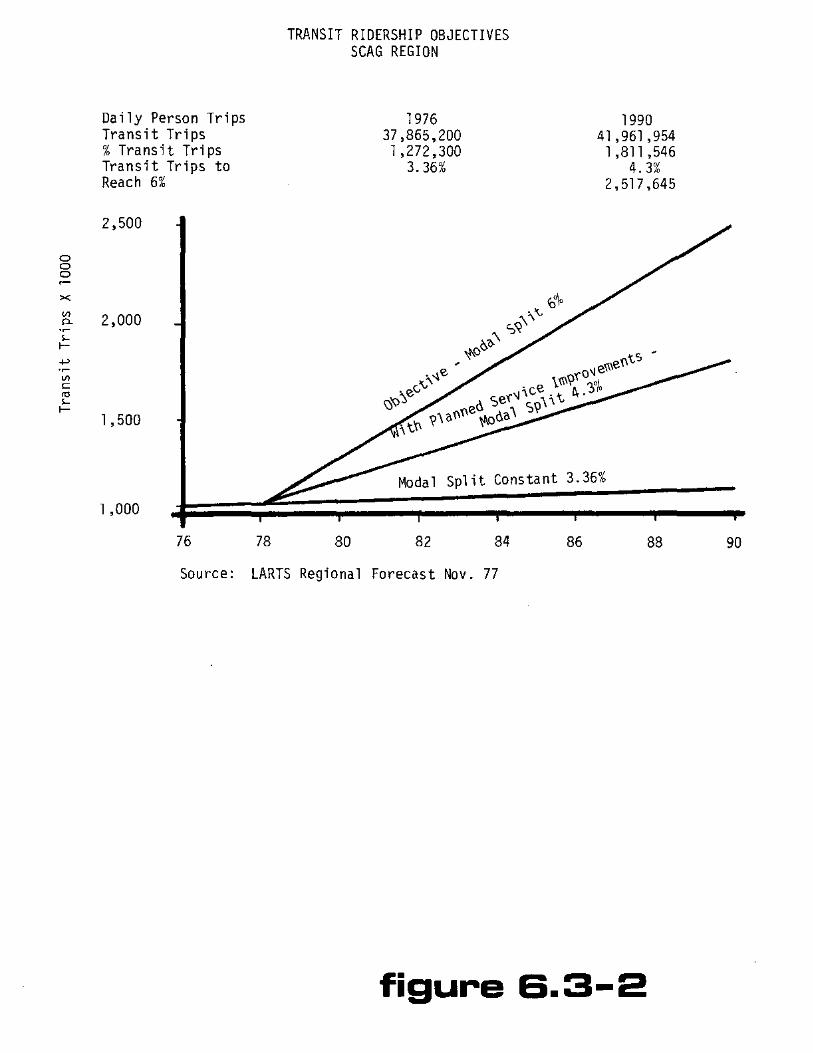
0 0 0 -X
~ 0-
~ >-~
~ ~
~ ~ >-
Daily Person Trips Transit Trips %Transit Trips Transit Trips to Reach 6%
2,500
2,000
1 • 500
1 ,000
76 78
TRANSIT RIDERSHIP OBJECTIVES SCAG REGION
1976 37,865,200 1,272,300
3. 36%
1990 41,961,954
1 ,811 ,546 4.3%
2,517,645
Modal Split Constant 3.36%
80 82 84 86 88
Source: LARTS Regional Forecast Nov. 77
figure 6.3-2
90

• ~ 0
• • 0 u
" • z < • "

6.3.3 Plans, Planning, and Issues
Planning to Meet the 6% Transit Ridership Objective.
a. Short-Range Trjnsit Plans developed for the five-year period FY 1979 through FY 1983 generally consider two alternatives, one a status quo option, and the second, an expansion option, which forms the basis for the Regional Transit Development Program, Element I (TSM). The Short-Range Transit Planning process, which has evolved in response to state and federal regulations, represents a blending of regional, 11 top down" and local "bottom-up" planning. The regional role has been expressed through unifonn guidelines for preparation and adoption of local plans, prepared by the region's transit system operators and subregional planning agencies.
b. The Regional. Transit Development Program is a plan to improve transit through better use of freeways and fixed-guideway systems. The plan refinement and preliminary engineering phase of the Regional Transit Development Program got underway since the last issue of the Re.gional Transportation Plan.
The Regional Transit Development point early in fiscal year 1979. tions and capital improvements. identified -- and made available.
Program wi 11 reach a decision To support expanded RTDP operaa new source of funds must be
c. The coming year will also see greater emphasis on ridesharing strategies to encourage greater ridership of transit and other types of high-occupancy-vehicles. (Discussed in Section 6.1.1)
Meeting the Needs of the Transit Dependent
Planning for the elderly and handicapped has received increased enphasis si nee the last RTP was adopted. Surveys of a 11 soci a 1 service organi zations in Los Angeles, Ventura, and Imperial Counties were completed and the results compiled. An E & H needs study is nearing completion. The coming year w"ill emphasize the matching of needs to available services and development of a comprehensive plan to improve transportation for the elderly and handicapped.
6-17

Revised 1-25-79
6.3.3A
Regional Transit Development Program (RTDP)
The 1977 Regional Transportation Plan endorsed preliminary engineering and environmental analysis relating to a Regional Transit Development Program {RTDP) that would consist of the following elements:
Element I -Transportation Systems Management(TSM) Element II - Freeway Transit Element III - Los Angeles Downtown People Mover Element IV - Regional Core Rapid Transit
In December of 1976, the U.S. Secretary of Transportation approved the funding of preliminary engineering and en vi ronmenta 1 analysis for the RTDP. The federal share of the downtown people mover (Element III) construct ion costs was a 1 so approved pending 1 oca 1 funding support and environmental clearances.
The RTDP Integration Report
SCAG, working through the Interagency Technical Committee and the Interagency Coordinating Committee and in close cooperation with staffs of the County Transportation Commissions and the implementing agencies, has prepared an RTDP Integration Report. This report integrates the work done on each of the elements and makes recommendations as to what should be implemented. Two basic recommended plans emerge from the evaluation and analysis of the RTDP elements. These are:
A. Fully Funded RTP
The currently developed RTDP, as depicted Figure 6A, is recommended for implementation contingent upon an increase in funding beyond anticipated levels. Chapter 7 discusses possible methods of obtaining increased funding. The recommended complete program is as follows:
TSM
a Implementation of transit priority programs on arterials o Development of facilities to improve intermodal transfers o Enhancement of community transit when appropriate o r~odernization of transit capital facilities/vehicles o Expansion of bus fleet by approximately 900 vehicles
(750 for SCRm)
6-18

Revised 1-25-79
Freeway Transit
Development of rideshare lanes {designed for possible conversion to rail) on the following freeways: The Harbor (1-10 to 1-105 with stations south of 1-105 to San Pedro), the Santa Ana (downtown Los Angeles to Rt. 91 coordinated with Orange County's planning efforts in the Santa Ana Corridor), Ventura (Hollywood Freeway To Reseda), Century (LAX to I-605), the extension of the Long Beach (I-10 to 1-210), the Hollywood (downtown Los Angeles to the Ventura Freeway) extension of the San Bernardino Busway from its current western tenninus to Union Station, Santa Monica (downtown Los Angeles to La Cienega), Sin Diego (U.S. 101 to Marina Freeway).
Development of stations and parking facilities to complement rideshare lanes and mixed flml' sections of the bus-on-freeway rapid transit system.
Development of service improvements on several regional freeways. Included among these are I-10 (Santa Monica to Pomona), San Diego (Valencia to Long Beach), U.S. 101 (Thousand Oaks to downtown Los Angeles), Harbor (San Pedro to downtown Los Angeles), and Long Beach (Pasadena to Long Beach).
Downtown People Mover (DPM)
Construction of the Los Angeles Downtown People t~over which would include intennodal transfer facilities at the Convention Center and Union Station.
Rail Rapid Transit
Construction of an 18-mile rail rapid transit line from downtown Los Angeles along Wilshire Boulevard to Fairfax Avenue, to Hollywood and through the Cahuenga Pass to North Hollywood.
B. Financially Feasible Implementation Program
As noted above, implementation of the complete RTDP is contingent upon increased funding support. At the present time, only a portion of the Program is financially feasible. This portion of the Program, the financially feasible implementation program is depicted in Figure 6B.
Below is listed the first phase of the RTDP. The elements included in this program can be implemented without additional funding beyond anticipated levels. The program consists of the following:
Transportation Systems Management (TSM)
o Implementation of various TSM programs that would not involve expansion of service beyond current levels.
6-19
Revised 1-25-79
Freeway Transit
o Development of rideshare lanes (designed for possible conversion to rail) on the Santa Ana Freeway (downtown Los Angeles to 1-605), the Harbor Freeway {I-10 to I-105 with stations south of 1-105 to San Pedro and to Long Beach vi a Routes 11, 405 and 7), the Century Freeway (LAX to I-605), and the extension of the San Bernardino Busway from its current western terminus to Union Station.
Downtown People Mover
o Construction of the Los Angeles Downtown People Mover that would include intermodal transfer facilities at the Convention Center and Union Station.
Rail Rapid Transit
a Construction of an 18-rnile rail rapid transit line from downtown Los Angeles along Wilshire Boulevard to Fairfax Avenue~ north on Fairfax to Hollywood~ and through the Cahuenga Pass to North Hollywood.
Future Regional Transit Development Program (RTDP) Related Planning
The RTDP~ as currently -developed, addresses transit improvements in Los Angeles County. It is recommended that the region's transportation planning work program include the necessary analysis and study that would evaluate the development of the RTDP in Orange, Riverside, San Bernardino, and Ventura Counties.
In Orange County, current RTP actions support completion of an alternatives analysis for high capacity transit in the Santa Ana Corridor, as well as preliminary engineering and environmental impact work on the first usable segment. Upon successful completion of the alternatives analysis, preliminary engineering and environmental work support is given for an appropriate facility to be coordinated with improvements in the Los Angeles County portions of the Corridor.
6-20

' I I II I I I
I ' I<
' ' ' ' '
h-?1
' ' '
~
~
l ·~~ ~.
H :!:,.~
u I :I I I I I

r'···
I
> -1 '-~
I /r((ji f~.._·-~---lL 1 ( -LTv r
{
·-----,_
'
' -~~~~~
i':: .•. --:"'-
' ___ , 1
6-22
j i ~
I u • I ~ §
~ 8
• • •
··"'
I ' ' ! ~ .. '·' r ' '
i r; :· ;.
''
' ,'

~
' N w
\
• TAANSITCENTERS
• ON LINE STATIONS
.A. FREEWAY TO FAEEWA't TRANSFER STA.
D INTEAMODAL STKI'IONS ·--·----'--0::~
~··~~~-·---~
\
\
-~· ; 0"'--'{:.:> ~ --- .. .; -"7 (' F ~ -- /l:.,o>"-::..--------
p' ,.
c Transit
••• .
'----.....
"'1--
•eopyriqht Automobile Club of Southern california. Reproduced by penli. .. ion•

Revised 1-25-79
6.3.4 Transit System Actions
TSM Act ions
Short Range Transit Plans. (The following is a summary of the actions submitted for the 1978-83 Short Range Transit Plan.)
1. SCRTO will replace 1500 buses; renovate several fixed facilities; add one bus yard and a maintenance facility. Increase patronage by 24% from 310 million to 384 million annually by 1983.
2. OCTO will increase its fleet from 359 buses to 821 buses by 1983, add six transportation terminals, analyze alternatives relating to the Pacific Electric corridor; and increase patronage by 100%, from 20 mill ion to 40 mill ion annually.
3. RTA and Sunline will, by 1983, expand their fleet 49% from 71 vehicles to 106 vehicles, and increase patronage 100%, from 2 million to 4 million annually.
4. Omnitrans will, by 1983, expand their bus fleet by 32%, from 77 vehicles to 101, and the demand-responsive fleet by 67%, from 33 vehicles to 55 vehicles. Patronage is expected to increase by 86%, from 6.4 million to 11.9 million riders.
5. SCAT and Simi Valley will improve service and expand the fleet of 37 vehicles to 44 vehicles by 1983, and increase patronage by 42% from 2.8 million to 4.0 million annual riders.
Elderly and Handicapped
6. Agencies designated by the CTCs, IVAG and VCAG will annually update the elements of the Short Range Transit Plans for the elderly and handicapped including procedures and programs to reduce or eliminate barriers and increase the number of fully accessible vehicles in the region 1 s transit system.
7. OCTC, SANBAG, and RCTC will develop a catalog of paratransit services.
8. SCAG, the CTC's, VCAG, and IVAG will update and maintain a catalog of_paratransit services for each subregion.
9. SCAG will prepare a regional plan on elderly and handicapped policies, needs, and activities in conjunction with all interested parties in the region.
6-24
Revised 1-25-79
10. SCAG and the CTC's will study alternative means of coordinating social service agency transportation delivery systems.
11. SCAG, CTC's, subregional planning agencies, and transit operators will sponsor public i~Orkshops for the purpose of considering transportation needs of the elderly and the handicapped (particularly the semiambulatory and wheelchair users).
Procedural
12. Agencies designated by the CTC's, !VAG and VCAG wi11 prepare an I annual Short Range Transit Plan and Transit TIP consistent with the RTP.
13. SCAG will prepare an annual Regional Short-Range Transit Plan Summary.
Coordination
14. SCAG, the CTC's, and the transit operators will execute and comply with the Public Transit Operator Memorandum of Understanding.
15. Transit operators, the CTC's, and SCf\G will improve and coordinate public transit passenger information systems and services.
16. SCf\G, in conjunction with the State Public Utilities Commission (PUC), shall investigate changes in the PUC's "Southern California Restriction" which prohibits inter-regional carriers from providing intra-regional service in parts of Los Angeles, Orange, Riverside, and San Bernardino Counties. Specifically, they shall consider:
a) eliminating the restriction during days and hours when public transit is not operating;
b) selectively applying the restriction to certain routes and corridors;
c) eliminating the restriction entirely and allowing the interregional carriers to compete with public transit. offering higher fares but reduced travel times.
6.3.5 System Development Actions
Regional Transit Development Program (RTDP): Plan Development
17. LACTC, Transit Operators, Caltrans, and the City and County of Los Angeles will conduct further analysis and evaluation of those portions of the full RTDP which cannot be implemented without increased funding support.
18. County Transportation Commissions, Caltrans, SCAG, and other appropriate agencies will conduct the necessary analysis and studies that will evaluate development of the RTDP in Riverside, San Bernardino, and Ventura Counties. The Orange County Transportation Commission, OCTO, Caltrans, and other appropriate agencies will continue the alternatives analysis relating to possible RTDP development in Orange County. OCTO will continue efforts to acquire the Pacific Electric right-of-way between Santa Ana and Stanton.
6-25

Revised 1-25-79
19. SCAG, SCRTD, and the Los Angeles County Transportation Commission will continue to evaluate the potential for rail rapid transit in additional corridors. Corridors for evaluation will be selected on the basis of projected patronage 1 eve 1 s. potentia 1 for funding, and environmental acceptability.
RTDP Element I - Transportation System Management (TSM}*
20. Transit operators will
a) maintain existing levels of service; b) develop convenient transfer facilities to encourage greater
transit utilization; c) modernize transit facilities and equipment including revenue
vehicles; d) implement, in conjunction with appropriate City and County of Los Angeles agencies, transit priority programs on arterials;
e) develop community transit services when appropriate.
RTDP Element II - Freeway Transit*
21. Caltrans will develop rideshare lanes (designed for possible conversion to rail) on the following freeways:
a) Harbor Freeway (from 1-10 to 1-105 with stations south of I-105 to San Pedro and to Long Beach via Route 11, 405 and 7);
b) Santa Ana Freeway (from CBD to I-605) c) Century Freeway (from LAX to I-605); d) Extension of San Bernardino Busway from its current western
terminus to Union Station.
22. OCTC, OCTD, Cal trans and local agencies will:
a) Complete the alternatives analysis of the high capacity transit improvements in the Santa Ana/Los Angeles Corridor
b) Conduct _preliminary engineering and EIR/EIS work on the first usable segment of the Santa Ana Transportation Corridor.
c) Upon successful completion of the above design and construct an appropriate fac i 1 ity serving the high activity Santa Ana corri dar to be integrated with transit facilities being designed and constructed in Los Angeles County.
* Phasing
lmpl ementat ion depends upon federa 1 and 1 ocal approva 1 of pre 1 i mi nary engineering results, development of a local funding source, state and federal funding approvals. Tentative dates are:
a) Plan Refinement Elements I, II, and IV.: September 1978. b)- Complete Element III, preliminary engineering: November 1978. c) Preliminary Engineering Elements I, II, and IV: 1980.
6-26

Revised 1-25-79
RTDP Element III - Los Angeles Downtown People Mover*
23. The City of Los Angeles will design and construct a Downtown People Mover that would include intennodal transfer facilities at Union Station and the Convention Center.
RTDP Element IV - Regional Core Rapid Transit*
24. The Southern California Rapid Transit District will design and construct a rail rapid transit line from downtown Los Angeles along Wilshire Boulevard to Fairfax Avenue, north on Fairfax to Hollywood, and through the Cahuenga Pass to North Hollywood. This will be integrated with the Freeway Transit and Downtmm People Mover elements of the RTDP.
Los Angeles-San Diego Corridor
25. Implementing agencies will develop transit improvements in the interregional Los Angeles to San Diego Corridor as described below:
Short range actions through 1980
Cal trans, local agencies, and appropriate transit operators will:
a) Expand existing private operator fleet by 10 vehicles, including high-capacity 64-seat buses.
b) Expand frequency of express service between primary centers -Los Angeles, Long Beach, San Diego -- by about one-third.
c) Legislatively authorize demonstration programs for inter-regional bus improvements, using preferential treatment lanes where available.
* Phasing
Implementation depends upon federal and local approva-l of preliminary engineering results, development of a local funding source, state and federal funding approvals. Tentative dates are:
a) Plan Refinement Elements I, II, and IV: September 1978. b) Complete Element III, preliminary engineering: November 1978. c) Preliminary Engineering Elements I, II, and IV: 1980.
6-26A

Medium range actions through 1985
Caltrans, local agencies, and appropriate transit operators will:
a) Expand private operation fleet by 18 vehicles, including four higher-capacity 64-seat buses.
b) Expand frequency of express service between the following secondary centers: Van Nuys, LAX, San Bernardino, Riverside, and Escondido.
c) Introduce an additional express route: Van Nuys-Inglewood-San Diego.
d) Increase service frequency overall by about 39% over the shortrange program.
e) Improve access to bus stations at Anaheim, Santa Ana, Van Nuys, and San Clemente.
f) Construct new, near-freeway terminals at Santa Ana, Ingle\'IOOd/ LAX, and Van Nuys.
6-26B

O~erating Costs
Element I Status
Element I TSM
Regional Transit Development Program
Estimated Annual Operating Costs
Los Angeles County Portion
($Millions)
Quo (78 System)
Element I I Freeway Transit
Element III Downtown People Mover
Element IV Regional Core Rapid Transit
Sources of Funds
Operating Revenues
UMTA Section 5
TDA (SB 325)
Potentially Available Funds
Additional Funds Required
Total Funds
1990 Annual
540.3
183.2
136.4
2 .8
51.6
919. 7
383. l
96.8
168.4
648.3
271.4
919.7
table 6.3-4


6.4. HIGHWAYS
This chapter discusses the regional highway system. Section 6.4.1 describes the existing regional highway system; and Section 6.4.2 describes the process for programming State highway improvements under AB 402. Beginning with Section 6.4.3, highway programs affecting the SCAG region and issues relating to highway planning and programming are identified.
System management and system development (subregional/regional state highway priorities) actions are in Sections 6.4.5 and 6.4.6, respectively. Operational improvement and preferential treatment actions are found in SCAG 1 s Rideshare Program (Section 6.1.1).
The discussion on financing state highways identifies and analyzes financial issues {Section 6.4.7).
6. 4.1 The Existing Regional Highway System
As a matter of pol icy, only state highways are considered as regionally significant. State highways include both freeways and non-freeways (expressways~ controlled access highways, and conventional highways).
Figure 6.4-1 illustrates the existing regional highway system and proposed construction and widening projects. Table 6.4.1 notes changes in state highway mileage -- by county, by Caltrans district, and for the SCAG region from 1976 to 1978.
Changes in State Highway Mileage*
~~-
NOo•Fre""'Y••
'""''"' ''''"' Mil N ' mlea e Toto I
-~-----f! 16-11 fY 71-IS '' 10-ll n 11-1~ " I0-11 " 71-7~
''" Ao9ele> "" "' "' "' ''" "' Qrao!e '" "' '" '" ,.,
"' "nt"" "' "" "' "' '"' '"' ---------------- .......... ·--·-·--·--District Dl "'" "" "" "" I .~06 I ,410
"'''"ldo m "' JOI• '" "' '" ''" """"~'"' "' "' '" '" 1 , 1 ~a '·'~" ----------······ .......... -
Olstcl<t " '" "' I ,0!2 I ,079 I ,623 I ,6,8
RIV<>"ide "' "' '"' '" '" '" ,.,.,,,, " -1~~.::~+2--r- .• :::·--
'"' w ...... ·······-·· ·-·-- ----····- - - -----
"'''''" " '"' "' "' -~~ --=_,,,,-=
ICAG Re9ioo I I,W J. 706 J.no
• Stoto Ol9h••>• oncl..Je '"'""''sldl•ided "'""! hlgh•oys wlto sep•rotoo grooe <rO»l09>. f"ll "<"' oontroll '"' non-Ire•••>• (control leo"<"'"!""''''
"'"""'''· ''"""""""" ''•"••»!. •• Oeue"'' in noo-tre...-oy ••lea!O '"'"' cou><d by ooo-f"""''' """' UP9"'"" to '""''Y
"""'·
table 6.4-1 6-27

----- -------- ·-·-·-·---~I "\r...~---'''-----i I
VENTURA
t FIGUPE6.4·1 REGKIIIAL HIGHWAY mTEM
llewCooslnlli>1 ''" Wideni"9
,,~,,
~ "'" ,,.,
'
LOS ANGELES
-, - '
\ '
• SAN BERNARDINO
'"
....... , ___ _ -~
• 1 ' ~
I RWOODE
-

6. 4. 2 Programming Highway Projects under AB 402
The state's new transportation law, the Alquist-Ingalls Act of 1977 {AB 402). significantly alters the process of programming state highway improvements. Under the act, the state legislature will appropriate funds to specified program categories with the California Department of Transportation (Caltrans) having the ability to transfer up to 10% of such funds between programs upon approval by the California Transportation Commission (CTC).
The budget will be developed from the adopted state TIP -- a five year blueprint of transportation improvements. The state highway portion of this TIP replaces Caltrans' previously used Multi-year Planning Program. AB 402 prescribes that the California Transportation Commission adopt, as the state TIP, regionally adopted TIPs unless specified findings are made as to overriding statewide interest, insufficient funds, or regional TIP conflict.
To facilitate the TIP process estimates of the state highway funds available to each county in the SCAG region will be provided by the California Transportation Commission. The methodology for making these estimates must be determined by the Commission in cooperation with Caltrans and local and regional transportation agencies. Table 6.4-2 presents the various deadlines specified in AB 402 for the new state highway programming process.
6. 4. 3 Highway Programs Affecting the SCAG Region
State Highway programs that affect SCAG's highway planning effort and encompass system management and system development actions are:
Maintenance and Rehabilitation Operational Improvements New Facilities Local Assistance
These are some of the capital outlay programs (appropriation categories) identified in AB 402 for State Highway Account funds. Under AS 402, County Transportation Commissions and local and regional agencies can program and make tradeoffs between the Operational Improvements Program and New Facilities Program and their respective subprogram categories. The other programs identified in AB 402 --Administration, Program Development, and Operations -- are administrative programs of Caltrans, and therefore \~ill not be discussed in this section.
A brief definition of each of the highway programs that impact the SCAG region follows. Program definitions are based upon the Department's {State Department of Transportation) program definition manual.
6-30

TIME LINE
1978
Apri 1 through September
October 1
November 1
December 1
1979
January
February 15
Apri 1 1
June
July 1
August l
August 15
October 1
TIMETABLE FOR STATE HIGHWAY PROGRAMMING
TIP PROCESS
CTC develops methodology for making state highway fund estimates.
Cal trans prepares fund estimates based on CTC methodo 1 ogy.
CTC adopts and provides fund estimates to local and regional transportation planning agencies.
Cal trans submits pro- I posed State TIP consis-tent with fund estimates.
I
I
Local and regional TIPs I submitted to CTC 's consistent with fund estimates.
I CTC adopts local and regional TIPs itS State I TIP unless specified findings are made,
Appeals regarding the State TIP are due.
Public hearing on appeals must be held.
Cal trans prepares new fund estimates.
BUDGET PROCESS
State Highway Budget Proposed for FY '80. Legislative review.
CTC submits evaluation of proposed budget to Legislature.
Budget adopted for FY '80 setting program levels.
CTC allocates budgeted program levels to projects in the State TIP.
table 8.4-2

o Maintenance and Rehabilitation
As highway facilities age or become damaged, they beco1ne more costly to maintain. This program deals with keeping the existing system in a safe and usable state by repairing deteriorated or damaged facilities. As owner/operator, the Department has the authority to program and implement maintenance and rehabilitation projects.
o Operational Improvements
This progra1n deals with making the operation of the existing highway system more efficient and keeping it intact to retain the value of the public's investment. Some of the projects within this program are Ridesharing projects; community and school noise attenuation projects; safety, compatibility, and traffic operational improvements.
o New Facilities
This program involves the construction of highways on a new alignment to supplement or replace existing facilities; the addition of new lanes to existing facilities to accommodate increasing volumes of traffic; and the construction of highways to serve new areas and assist in the appropriate development of the region.
o local Assistance
6. 4. 4
This program element provides the administration, coordination and control required by Federal and State legislation in furnishing financial assistance to City and County transportation programs. These programs support the Highway Transportation Program in providing a response to the public need for safe, serviceable and comprehensive city and county transportation service. Local assistance includes: Federal-Aid Secondary, City and County Urban Extensions, TOPICS, Railroad Crossings, Unassigned Local Assistance, Federal-Aid Urban System, Bicycle Facilities, Highway Safety lmprover:~ent on local Roads, and Off-System Roads.
Current Issues
Over the past few years, the following trends have been evident: high priority projects have not moved forward; back-up projects have not been provided; there has been an increasing emphasis on canpatibility projects (sound walls and sound attenuation; landscaping); and legally required funding has not been provided. The following issues will be discussed below: (a) the inability to get projects ready for construction; (b) selecting AB 402 fund estimation methodology; and (c) the 1977 "Nml' Needs Study.
6-32

Inability to Get Projects Ready for Construction
The process of getting a hight-.'ay project ready for construction has been lengthened by such problems as not being able to begin preliminary project or engineering studies, not being able to acquire right-of-way for project construction, and delays in obtaining final environmental clearance.
In preparing the Regional TIP under AB 402, SCAG and County Transportation Commissions should have the ability to program projects to undergo preliminary engineering studies, as part of the long-range planning function, and pursuant to project implementation being scheduled in the next fiveyear period.
1977 "Now" Needs Study
Section 188.8 of the Streets and Highways Code requires Caltrans to prepare, every four years, an estimate of existing state highway construction needs. The study is used to set the legally required minimum expenditure on right-of-way, construction and reconstruction in each transportation district of the state.
Individual jurisdictions within the region as well as SCAG's Transportation and Utilities and Executive Committees have canmented critically on the amount of state highway expenditures programmed for the region when compared to state highway revenues generated and existing state highway
-needs. Concern has also been expressed over the methodology used to compile the 1977 "Now" Needs study. The philosophy and methodology of the study resulted in a dramatic decline, between 1974 and 1977, in the measurement of new construction need in the region. This decline was particularly significant in los Angeles, Ventura, and San Bernardino Counties. In some cases the decline in new construction need was due to the deletion of proposed highways from the state highway system. Legal opinion prevented the deletion of the Beverly Hills Freeway in western los Angeles from being offset by the addition to the study, of the Wilshire Corridor Starter line despite the fact that Proposition 5 funding for the Starter line would count toward meeting the state highway district minimum. In other instances, state highway improvements were deleted or downscoped in the 1977 Study in opposition to regional priorities and policies. For these reasons SCAG opposes the use of the 1977 Needs Study for setting the district minimum percentages in state highway funding.
6-33
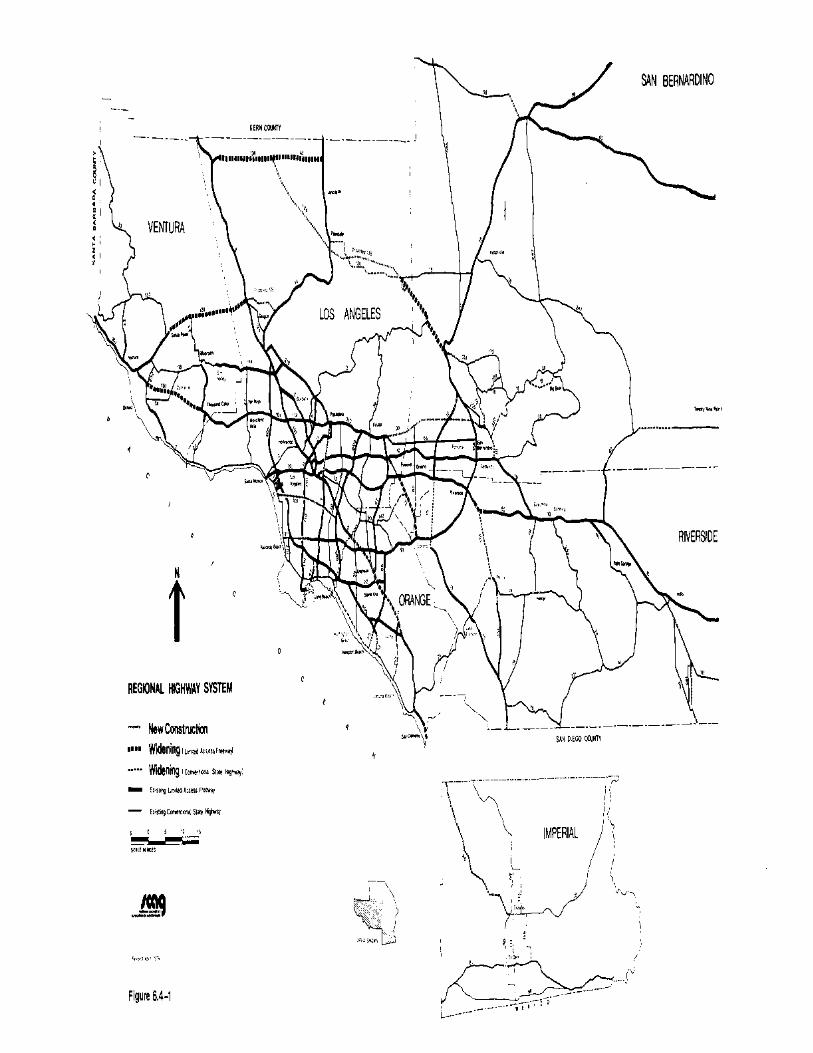
>
! ' I • ' ' l • > '
' " '
' " U IIIIWUIIHII~IIIIIfiiiiiiH
VENTURA
M
t REG~IIALIIGHWAY SISTEM
.... ~wConstructm
Widening 1 Ln>d '"'~rom~
Wtd!nmg ,c_,.,. s,., "! .. ~:
' ' ' ,, ~--""'"'"
~ .J:.E:"'
Figure 6.4-1
\\ \, ...
\ -. .. , "· \ ''""" " ·~··ci·~ ..... , ...... _\
'······· .... .........-'--H
LOS ANGELES
'-. ., •• '\
SIN BERNARDINO
RWER~OE
' ' '

Revised 1-25-79
6 .4. 5 System Management Actions*
System management actions are directed toward making more efficient use of the existing highway system. Generally, these actions are not as capital intensive as system development actions.
1. Caltrans will implement maintenance and rehabilitation activities as appropriate to ensure complete utilization of the existing State highway system.
2. Caltrans will implement a traffic management program to obtain maximum efficiency of the existing system.
3. Caltrans will implement safety improvements as necessary to ensure a safe highway system.
4. Caltrans will implement improvements necessary to ensure compatibility with the environment.
5. Preliminary engineering and environmental evaluation for the highway related element of the Regional Transit Development Program will be conducted conducted by Caltrans, and highway portions of the RTDP based on the results should be implemented.
6. SCAG will promote expeditious implementation of currently programmed (in the TIP) widening projects which relieve peak hour congestion by seeking additional funding for such projects.
7. SCAG, in conjunction with CALTRANS, CTCs and affected agencies, will evaluate additional widening projects to detennine impacts, (including noise) costs and effectiveness of reducing emissions and improving mobi 1 i ty. (Approximately 300-400 1 ane miles of freeway widenings have been identified as candidate proposals by CALTRANS.)
* See Section 6.1.1 for highway-related ridesharing actions.
6-34

Revised 1-25-79
6.4.6 System Development Actions
This section lists state highway construction priorities submitted by county transportation commissions. VCAG and IVAG (see Table 6.4.3). These priorities include only new freeways/expressways and widening projects that exceed $200,000 in cost. From these lists a regional list of priorities will be developed. These priorities will be used as guidelines for establishing priorities for major state highway projects in the FY 1979-1980 TIP.
8. SCAG endorses construction of 1-105 (with the provision that 1-105 will be a freeway/transitway consistent with the Regional Transit Development Program, with ramp metering and bypasses where consistent with appropriate planning) and the upgrading of Routes 1-15, 15E, 86 and 30.
9. SCAG endorses Route 30 as a top priority construction project for immediate implementation. acquisition of right-of-way and preliminary engineering.
10. Caltrans should develop projects on Routes 86 and 1-15E and should implement them expeditiously to provide safe and efficient movement of people and goods along those travel corridors.
11. SCAG will complete the Highway Evaluation Report and establish priorities for the regional highway system.
6-35

Priority
I
2
3
4
5
6
7
Route No.
86
86
86
86
86
86
I -8
TABLE 6.4-3 PROPOSED NEW FACILITY PROJECTS FOR THE SCAG REGION
IMPERIAL/RIVERSIDE HIGHWAY PRIORITIES (Source: Imperial Valley Association of Governments)
Project Description
NEW FACILITIES R10.7/R22.6 South of Indio, from the Jet. of Route 195 near Mecca to 0. 2 mile N of Dillon Road
4 1 ane freeway
Imp-R63.5/Riv-R2.8 Near Desert Shores, from 0.5 mileS of Brawley Ave to 0.5 mileS of Ave 81
4 1 ane freeway
R2.8/R10.7 South of Indio, from 0.5 mileS of Ave 81 to Jet of Route 195 near Mecca
4 1 ane freeway
57.5/63.1 Near Salton City, from 0.3 mile S of Marina Or N to 0,5 mile S of Brawley Avenue
4 lane expressway
41.5/5 7. 5 2 miles S of North Jet Route 78 to 0.3 mileS of Marina Drive N
4 lane expressway
21.8/41.5 NW of Brav1l ey, from Brandt to 2 mi 1 es S of North Jet Route 78
4 lane expresS\>/ay
REV!SED FACILITY
South of El Centro Revise Interchange at I-8 and Imperi ul A'tenue
Approximate Length
11.9
7.5
7.9
5.6
16.0
19.7
0 .l
Fed. System Designation*
Primary
Primary
Primary
Primary
Primary
Primary
Interstate
Cost (Mill ion)
$22.9
$13.4
$13.0
$9 .l
$13. 6
$20.6
6-36 table 6.4-3

Route Priorit,. No.
1 91/11 Artesia Freeway
2 1-105 Century Freeway
3 47 ~dustrial
Freeway
4 30 Foothi 11 Freeway
5 7 ong Beach Freeway
6 90 Marina Freeway
Extension
TABLE 6.4-3 (Continued) PROPOSED NEW FACILITY PROJECTS FOR THE SCAG REGION
LOS ANGELES COUNTY HIGHWAY PRIORITIES
Project Approximate Fed. System DescriEtion Lenqth Designation
Construct B-lane freeway • 5 Mile FAP from Main Street to Route 11, including interchange at Route 11 and Redondo
Connect Route 605 in 17 .o Mile I Downey with Route 1 in El Segundo by constructing 8-lane freeway with provision for transitway.
From Willow Street in Long 1.1 Mi 1 e* FAU Beach to San Diego Freeway construct 6-l ane expresswa 0
From Foothill Boulevard to 5.3 Mile** FAP San Bernardino County line (then into San Bernardino to parallel Route 66) Construct 4-lane freeway.
Between Route 1-10 and 4.5 Mile FAU Route I-210 construct 8-lane freeway.
From Lincoln Boulevard to 2.3 Mile FAU Washington Boulevard with access ramps to Venice Boulevard.
Cost (Million)
$38
$457
$10-38
$25
$128
$20
* Some work contemplated to .5 miles south of Willow Street for total distance of 1.6 miles. ** Portion in Los Angeles County.
6-3 7
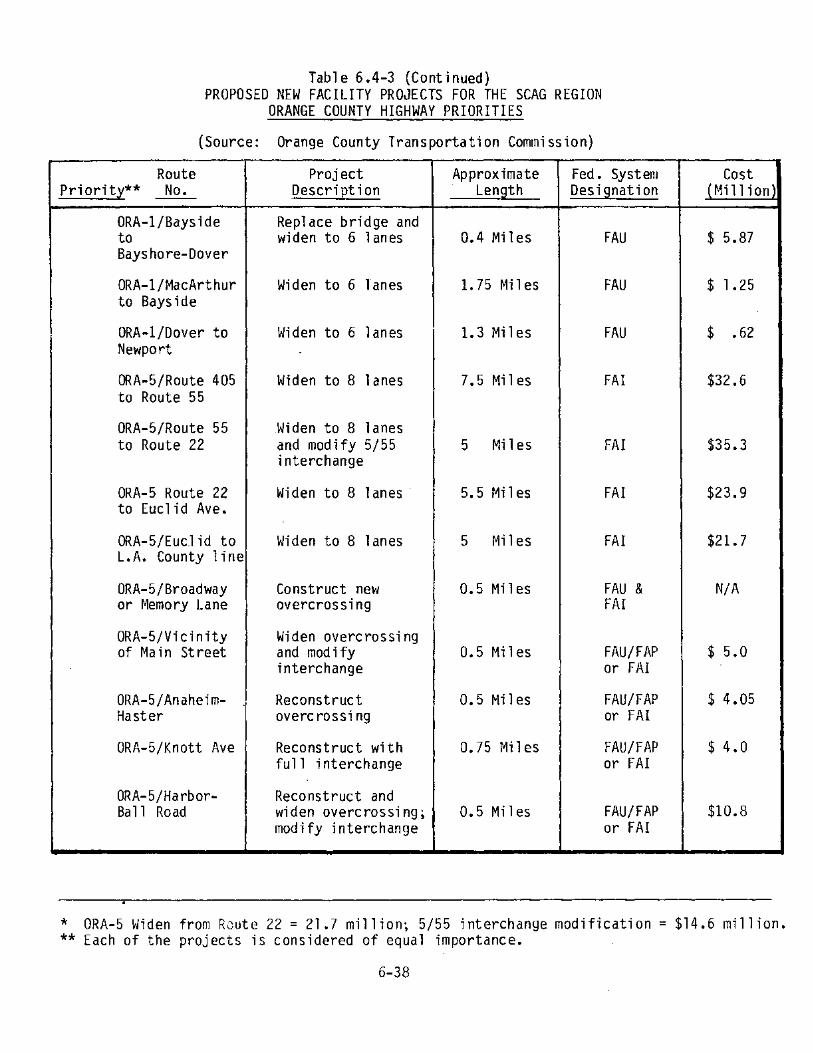
Table 6.4-3 (Continued) PROPOSED NEW FACILITY PROJECTS FOR THE SCAG REGION
ORANGE COUNTY HIGHWAY PRIORITIES
(Source: Orange County Transportation Commission)
Route Priority** No.
Project Description
Approximate Length
Fed. System Designation
ORA-l/Bayside to Bayshore-Dover
ORA-l/MacArthur to Bayside
ORA-l/Dover to Newport
ORA-5/Route 405 to Route 55
ORA-5/Route 55 to Route 22
ORA-5 Route 12 to Euclid Ave.
ORA-5/Eucl id to L.A. County line
ORA-5/Broadway or Memory Lane
ORA-5/Vicinity of Main Street
ORA-5/AnaheimHaster
ORA-5/Knott Ave
ORA-5/HarborBall Road
Replace bridge and widen to 6 1 anes
Widen to 6 lanes
Widen to 6 lanes
Widen to 8 1 anes
Widen to 8 lanes and modify 5/55 interchange
Widen to 8 lanes
Widen to 8 lanes
Construct new overcros sing
Widen overcrossi ng and modify interchange
Reconstruct overc rossi ng
Reconstruct with full interchange
Reconstruct and widen overcrossing; modify interchange
0.4 Miles
!.?SMiles
1.3 Miles
7.5 Miles
5 Mi 1 es
5,5 Miles
5 Miles
0.5 Miles
0.5 Miles
0.5 Niles
0.75 Miles
0.5 Miles
FAU
FAU
FAU
FA!
FA!
FA!
FA!
FAU & FAI
FAU/FAP or FAI
FAU/FAP or FAI
FAU/FAP or FAI
FAU/FAP or FA!
Cost {Million
$ 5.87
$ 1.15
$ • 62
$32.6
$35.3
$23.9
$21. 7
N/A
$ 5.0
$ 4.05
$ 4. 0
$10.8
* ORA-5 Widen from R0ute 22 = 21.7 million; 5/55 interchange modification= $14.6 million. ** Each of the projects is considered of equal importance.
6-38

Table 6.4-3 (Continued) PROPOSED NEW FACILITY PROJECTS FOR THE SCAG REGION
ORANGE COUNTY HIGHWAY PRIORITIES
(Source: Orange County Transportation Commission)
Route Project Approximate Fed. System Priorit,y: No. Descri 2t ion Len9th Designation
ORA-5/Ilth St. Modify interchange 0.5 Miles FAU/FAP or FAI
ORA-5/San Diego County 1 ine- Widen to -8 1 anes 6.4 Miles FA! North Camino De Estrella
ORA-55 Bristol Construct Freeway 3.5 Mi 1 es FAU to 15th Street
ORA-73/Bonita Construct Freeway I 2 Mi 1 es FAP ' Canyon to Red Hill
ORA-133 Laguna Widen ? FAP Canyon Road
ORA-405/at Widen Structure 0.5 Miles FAU Edwards
6-39
Cost (Million)
$ 3.6
$20.0
$59.36
N/A
N/A
$.60

Route
Table 6.4-3 (Continued) PROPOSED NEW FACILITY PROJECTS FOR THE SCAG REGION
RIVERSIDE COUNTY HIGHWAY PRIORITIES
(Source: Riverside County Transportation Commission)
Project Approximate Fed. System Priority No. Descri Et ion Len9th Designation
District 8 New Facilities
1 1-15, Magnolia Construct 4 1 ane .7 ~1i 1 es FA! to Route 91 freeway
2 I -15, Route 91 Construct 4 1 ane 9.8 Mi 1 es FA! to Route 60 freeway
3 I-15, San Diego Construct 4 1 ane 1.1 Miles FA! county 1 ine to freeway 1 mi 1 e north
4 I-15, San Jacinto Construct 4 1 ane 3.1 Mi 1 es FA! River to Central freeway
5 Route 74, Hemet Construct bypass 6. 5 Mi 1 es FAP Bypass through Hemet
District 8 Missing Links
1 I-15E, Perris Convert to 4 1 ane 10.9 ~1iles FAP to Route 60 Freeway
2 I-15E, at Construct 1.0 Miles FAP Ethanac Road interchange
District 8 Widenings
1 Route 60, UCR Widen from 4 to 2.9 Miles FAP to r~ain Street 6 1 anes
2 Route 74, Widen from 2 to 10.3 Miles FAP Lake Elsinore 4 lanes to Perris
6-40
Cost (Million)
$18.0
$65.0
$ 5.3
$13. 5
$ 6.0
$30.0
$ 1.5
$ 2. 6
$ 5.6

Route
Table 6o4-3 (Continued) PROPOSED NEW FACILITY PROJECTS FOR THE SCAG REGION
RIVERSIDE COUNTY HIGHWAY PRIORITIES
(Source: Riverside County Transportation Commission)
Project Approximate Fed. System Priorit~ No o Descri~tion Length Designation
3 Route 71, Widen from 2 to 3.4 Miles FAP San Bernardi no 4 1 ane s County 1 ine to Route 91
4 Route 79, Widen from 2 to 6.2 Miles FAP Foothill Road 4 1 anes to 1-10
5 Route 60, Widen from 4 to 4.1 Miles FAP Valley Way to 6 1 anes Main Street
District 11 New Facilities
I Route 86 Imperial County Convert to 4 1 ane 10o7 Mi 1 es FAP line to Route 195 freeway
2 Route 86, Route Convert to 4 1 ane llo 9 r~; 1 es FAP 195, to .2 mile freeway North of Di 11 on Road
6-41
Cost (Mill ion)
$ 3o0
$ 9oU
$ 4 0 5
$20o0 I
$22o 9
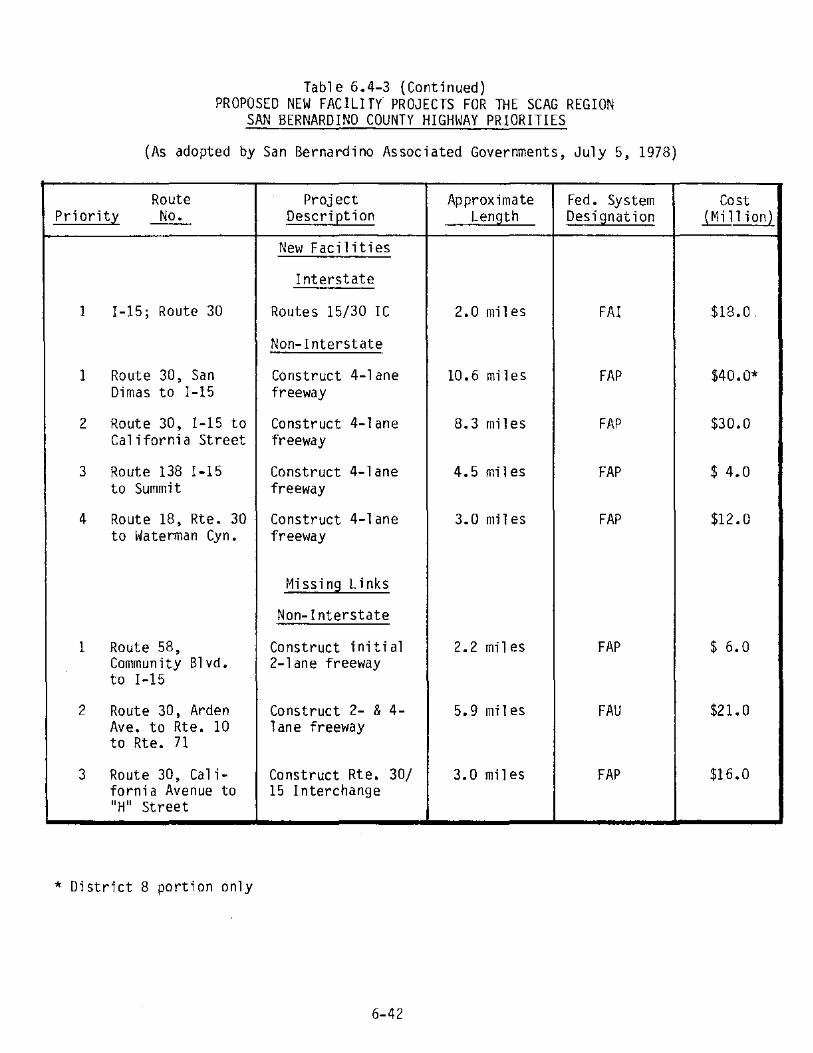
Table 6.4-3 (Continued) PROPOSED NEW FACILITY PROJECTS FOR THE SCAG REGION
SAN BERNARDINO COUNTY HIGHWAY PRIORITIES
(As adopted by San Bernardino Associated Governments, July 5, 1978}
Route Project Approximate Fed. System Priorit~ No. Descri ~t ion Length Designation
New Facilities
Interstate
I I-15; Route 30 Routes 15/30 IC 2.0 miles FA!
Non-Interstate
I Route 30, San Construct 4-lane 10.6 miles FAP Dimas to 1-15 freeway
2 Route 30, 1-15 to Construct 4-lane 8.3 miles FAP California Street freeway
3 Route 138 I-15 Construct 4-lane 4.5 miles FAP to Summit freeway
4 Route 18, Rte. 30 Construct 4-1 ane 3.0 miles FAP to Waterman Cyn. freeway
Missing Links
Non-Interstate
1 Route 58, Construct initial 2.2miles FAP Community Blvd. 2-1 ane freeway to I-15
2 Route 30, Arden Construct 2- & 4- 5.9 miles FAU Ave. to Rte. 10 lane freeway to Rte. 71
3 Route 30, Cal;. Construct Rte. 30/ 3.0 miles FAP forni a Avenue to 15 Interchange "H" Street
*District 8 portion only
6-41
Cost Ql_ijlion)
$18.0.
$40.0*
$30.0
$ 4.0
$12.0
$ 6.0
$2!.0
$16.0

Table 6.4-3 (Continued) PROPOSED NEW FACILITY PROJECTS FOR THE SCAG REGION
SAN BERNARDINO COUNTY HIGHWAY PRIORITIES
(As adopted by San Bernardino Associated Governments~ July 5, 1978)
Route Project Approximate Fed. System Prioritx No. Descri ~t ion Length Designation
Widen Interstate
1 1-15, Devore Rd. Widen freeway to 2.1 miles FA! to Route 15-E 8 1 anes
Widen Non-Int 1 state
I Route 71, LA Widen to 4 1 ane s 8.4 miles FAP Co., to Rte. 83
2 Route 62, Sunfair Widen to 4 1 anes 8. 0 miles FAP to Canyon
3 Route 62, El Widen to 4 1 anes 3.9 mi 1 es FAP Repose to Sunfair
4 Route 18, Big Widen to 4 1 anes 9.6 miles FAU Bear Dam to Big Bear City
5 Route 83, Pine Widen to 4 1 anes 2.0 miles FAU Avenue to Merrill Ave.
Other Major Widen-i ng Deficiencies
Non-Interstate
- Route 18, Widen to 4 1 anes 21.3 miles FAP Crest 1 i ne to lakeview Point
- Route 142, Widen to 4 1 anes 5.8 miles FAP Orange Co. line (portions) to Rte. 71
- Route 330, Widen to 4 1 anes 14.6 miles FAP Highland Ave. to (portions) Running Springs
6-43
Cost (Mill ion)
$ 2.0
$ 3.0
$ 0.6
$ 0.4
$25.0
$ I. 0
$40.0
$ 0. 9
$17.5

'
Route
Table 6.4-3 (Continued) PROPOSED NEW FACILITY PROJECTS FOR THE SCAG REGION
VENTURA COUNTY HIGHWAY PRIORITIES
{Source: 1977 Ventura County Transportation Plan)
Project Approximate Fed. System Pri orit,l** No. Descri~tion Length Designation
1
( 1 )
2
( 2)
3
( 3)
* ** ( ... )
Route 126/Santa Widen to 4 26 FAP Paula to Castaic lanes conven-Junction with tional highway Highway 5
Route 101/ Widen to 6 19 FAP Moorepark Road, 1 ane freeway Thousand Oaks to Santa Clara River, Oxnard
Route 23/New Los Complete missing 2 FAP Angeles Avenue to freeway 1 ink Route 118
Route 33/end of * Widen to 4 lanes or . . . ... freeway, Casitas construct a 2-lane Spring Road to bypass Encino Drive
Route 1 corridor ... . .. . . . (Oxnard Bypass)
Route 150, 118, 23, . . . . .. ... 34. and 232 (Capital Outlay Projects)
The City of Ojai has not endorsed a by-pass of Oak View. Represents grouping of projects into categories rather than project ranking Indicates that project infonnation is not available at this time.
6-44
Cost (Mill ion)
$25
45
15
. . .
. ..
. ..

6. 4. 7 Financial Analysis and Issues
The following discusses issues regarding state highway finance and programming that must be resolved in the implementation of AB 402, and provides a rough estimate of the region 1 s need for additional resources.
Equity of State Highway Expenditures
As shown in Figure 6.4-2, expenditures on construction and maintenance of state highways in the SCAG region reached a peak of $373 million in FY 71. Mirroring the overall state decline in highway expenditures, the regional level of construction, reconstruction, and improvement fell in FY 76 to a decade low of $170 million, while maintenance expenditures also dropped from a high in FY 75 to $44 mill ion in FY 76 -- a 9.5% decrease. The amounts shown for FY 77 equal those for FY 76 and confirm the trend, identified in last year's RTP, that SCAG counties have lost significant ground with respect to the rest of the state in receiving state highway expenditures. The c001bined regional share has fallen to 34% of total state highway moneys expended on construction and maintenance -- down from a decade-high share of 42% of the money expended in FY 72.
During the past year, SCAG's financial analysis for state highways has centered on the rate of State Highway User Tax donations -- estimated state highway revenues generated minus actual expenditures -- the region has provided to the other states of the nation and to other counties within California. The graphic "State Highways Expenditures and Revenues 1967-1976" (Figure 6.4-3) shows, for example, that while $8 billion was expended statewide during this ten-year period, $1.15 billion generated in los Angeles and Orange Counties was spent in other counties of the state.
A description of the flow of these dollars may be found on the reverse side of the graphic.
The amount of state highway dollar donations flowing from the SCAG region has risen sharply over time. Figure 6.4-4 shows these donations for five-year periods beginning with 1947. Based on current Caltrans programming plans, 1t is estimated that for the five-year period FY 79-FY 83, over one billion dollars generated in the SCAG region will be spent for state highway improvements in other states and in other counties in Ca 1 iforni a.
Figure 6.4-5 places the projected $1.15 billion tax donation into perspective with total estimated Highway User tax dollars generated and currently programmed expenditures. Figure 6.4-5 shows that under projected federal and state levels for state highway support, the region will receive, in expenditures, only 62 cents of each state highway tax dollar generated. This rate of return is down from the estimated return of 70 cents per tax dollar generated during the five-year period FY 67-71.
6-45

(Mill ions ! )
350
300
250
200
150
100
50
0
FY '69
HISTORICAL EXPENDITURES FOR CONSTRUCTION MID MAINTENANCE ON STATE HIGHI<AYS IN THE SCAG REGION
construction
maintenance
'70 '71 '72 '73 '74 '75 '76
figure 6.4-2
'77
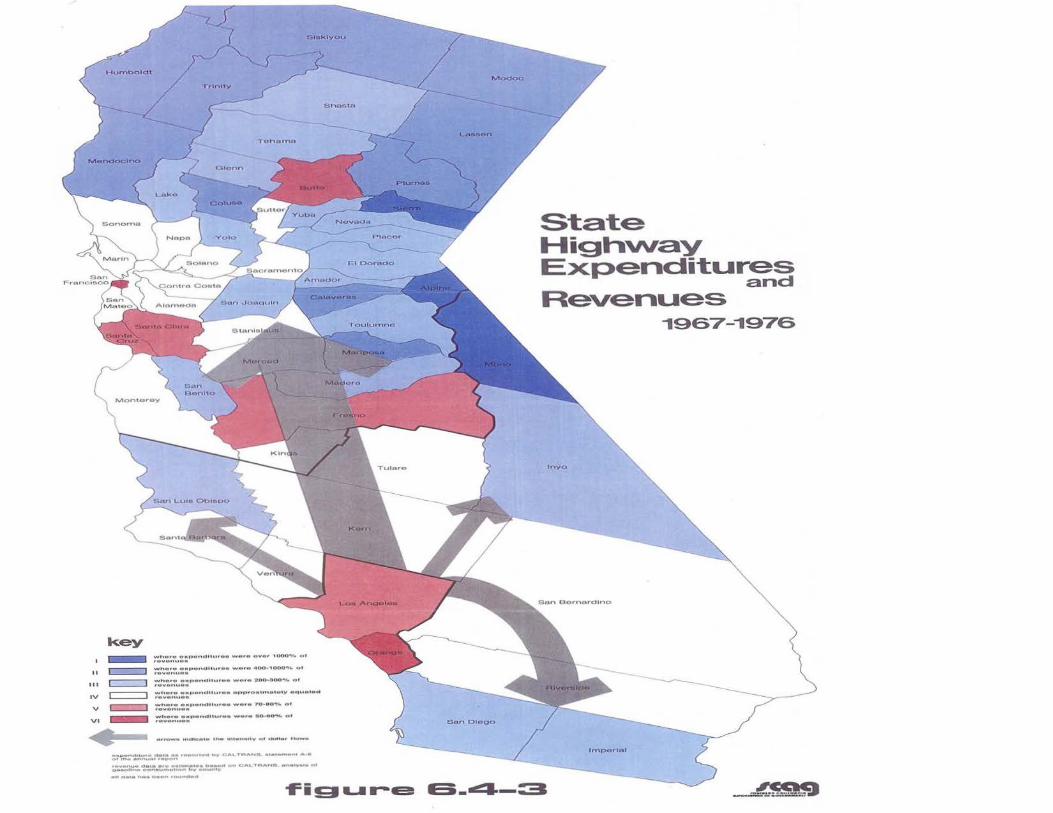
key
-
whero a..,ovnQIU.of'•• ..,...,.. ov•r 1000"Mo ol revonu••
It ~ ;" .. ~::,.-:.,:;r•Vndlt.,ot•• w•r• •00.,1000'"" ot
1 1 l ~ ;"'.~":.~.:" ... ::p•ndllu••• ...,or• a00.300'Mo ol
lV r:::::::::::::J ::.,~'!.o;:' ... ::P••,dlhH•• •ooro••rn••••v •ountoact
V c=:::::::a ~~~o;..,-:.,::pendlh.ore• -•r• 'J'o .. ·•O"Moo or
VI -- ~~:";,•...,::pwouJlH,.f'•• -••• ao..AO'"K. ot
•• ,_. tndtOJ•t• ~~ ...,,.,...n,.. or •"'Wlot••r •..--...
:;:--:o:.::-:.~-:..~~.':,!':' Oftf •<tM(t h'f" , ...... TftA ...... ,.,,.,....,.., A •
,.,..~ ..... o..LA . ...... ,. .. .,.,., •• ._. .. _, .... CAI,.-TnAH· - •n-•ty••• Ot o--.ou.- ro:on• un'!PIIo:t,.. b¥ vouf'on;
State Highway Expenditures
and Revenues
"1967--t976
-t=i Ell .... .-.a 13-~-::::1 ~

0
' ' ' 0
' ' ' '
' ' ' ' ' ' 0 0
' ' 0 0 0 Cl z
0
' ' 0
' ' l 0
' ' 0 ' ' ' ' ' '
' ' ' 0 0
'
' ' ~ ' ' ' 0
' ¢ ~
' ,. ' ' ' : 0 0
0 ' ~ 3 ' ' 1 0 • • 0
' 0
' ' ' ' . ' 0
' '
' ' '
0 0
' 0 0
' ' ' 0 ' ' 0 1- ~ "' 0 0
0
' ' ' ' ' ' 0 ' ' ' ' ' c 0 0
..... " .,.,.<.
"""' oooooo O<nOO• , . ., ... ,
"")",""> >"" '""""'Ill ..
'·""""·'"' . """"""·"'"'"
... , ....... cooooooco·o""'o'""'" ••00'''"'"100
...... .. ........ .. ,_,,,,_ "''"'"""'"''''" OC¢"0 OtO<OOOOOC":
' '"'" ... " "'' ,_. .. , ,, " "''
,,.,,,,., ,,,,,. .. <OO<'fO
""'"'"'' '
""""·'• .. ,., <" '· ...
"''"'""'"" """'''""'' " "" •00"1
• • ""'""'"'"'"00 ·"'"""''"'"""',' ""'' ' . '"' "" ,,,, '' ""' '"""·'"''•"'"0 " ""' ... ,.' " .,
'"'"'""". "00""•"
. ......... ocooooooco 0"0000000<
""'"""'"''
.. ... ., ... '"0"""'""' ""'"'a''·••
"'<'''"'' """""""''" " """" •,
<"OO<'O''"" < """""" '
oooo<<'"'" ONU<O"HO '"
' ' ' ' " ' -' ' 0 ,,.,
,, '" " ··-·" " ' " '" " " '"' "' l
. '
O<O"-"''"<'"'OO'""""O'N"""'''"""'"''" ,.,,,,o,,,._.,,,o ... """"'''""'N•O''N''''"'''" . ' ' ' ' . ' ' ' ' . . ' ' ' ' . . ' . ' ' ' ' . ' ' . ' . ' . ' ' . ' . . ' ~"'''"""""""".'"'""""'""""'~'"""'"""""
,, ................................... . ''""''oooocoo<oc•,oo•o•oooooooo••'·'''oco O~o<o••o'o'.N''""''"''""O"'""'"'''o'''' ¢0 0 C,; • iO "ON< 0~< 0 0""' 000 <\m• 00 00 o<Q """ .N
• • • , ' ' I
. ........ , .......................... .. "''"'C:'"'"'":""''""""oo:""'N'"''o'oo"' """;-'oonoo. ""''~"'''"'""""'N''N""'""'"
""N"-"" .. ,
0 ooo 0'<' c<o '"" "' 0. 00 '' 0,. "" ,·.oo ,_ o.: M'" ·"""'"""""'''"'''"O'''"•"O''""""'N'""'" " " " '" ~ .. ,
" • " 0. 0' o,-oo "'" :•COO ON 0'' ;o , 00>''" 0 •. 00 "" 00 - " " .. " " -- " """ "' '"' ~"' "
<"O tv- oN ooo: •• "''"'"" • o« •«•-' oo«.< ,.,:; • "N'N"""'N•'""""o""""''" .. '"o'""""'"'"O 0 " ""N" 0-<•0 .. ,
"'
~ ' ' 0 0 ' ' ' " L " 'J', L I': h t;r;)g "-". ;m8!~ ' ' '
' '' '' ' " ' " "
'' " " '
., "
~'
' '"' "" 0" ••
"'" --:: . ': "•'. '• 1t1 ~ r i " "' ' ~ ,_
~ t.~:
,_., c - ' "" E ' " ' . ' . "'; ' 'i; : '" ., ~ ., . ,_ ~ r::: 3 ""' . ' ;-«0
:~~;
" 'i :: '" """ '·' 0 J ,~.,'
~ ' ''" ~ : ~;

STATE HIGHWAY TAX DOLLAR DONATIONS SCAG REGION
Five Year Totals FY 1947-FY 1983
($Millions)
1,200 -
1 '100 -
1 ,000 -
9)0 -
8.l0 -
700 -
600 -
500 -
400 -
300 -
200 -
100 -
1-----i
Contributions by SCAG motorists to other states for State Highway purposes
Contributions by SCAG motorists to other counties in Calif. for State Highway purposes
$282 Mil
To Other
,----------,IC State1s
Contributions to other states not known for these
periods
$70 Mi 1
Ito :Other jtounttes
$104 Mil
to·. •0~":
FY 1947-51 1952-56 1957-61
$81 2 Mil
$708 Mil $375 Mil
$219 Mil to
to Other States
$533 Mil Other
136 Mil to
Other States
~397 lil11 to
Other ••unties 1 ..... in-
Calif.
1962-66
States
~489 M11 to
_Other Counties
in Calif.
$437•MU to
Other Co-unt_1e
in tall f.
1967-71 1972-76
$1,150mil
I 461 Mil to
Other States
~686 Mil to
Other P>untie
in Calif.
1979-83 (projected)
figure 6.4-4

HIGHWAY USER TAX DOLLARS GENERATED VERSUS PROJECTED EXPENDITURES
SCAG REGION FY 1979-FY 1983
Tota 1 Genera ted $3.0 Billion
Donated to Other States
$461 mil • ( 15%)
Donated to Other Counties
$686 mil . (23%)
Projected State Highway Account Expenditures
$1,862 mil. ( 62%)
figure 6.4-5

Projected Expenditures vs. the 1977 "Now" Needs Study
One way to measure the need for additional financial resources is to compare projected state highway expenditures to the 11 Now" Needs Study compiled quadrennially by Caltrans. This study measures existing state highway needs and is used to set the legally required minimum expenditure on right-of-way, construction, and reconstruction in each transportation district of the state. Figure 6.4-6 shows that Caltrans• programmed expenditures on state highways in the SCAG region will fund the equivalent of only 21 percent of the existing state highway needs, as measured by the 1977 11 NOW 11 Needs Study.
Potential for Increased Funding
AB 402 does not revise existing state 1 aw requ1 n ng a North/ South d i visian, and district minimum expenditure of state highway construction funds. These geographical requirements, when combined with the amounts available in the Federal-Aid funding pots (Interstate, Primary, Urban), constrain the Ca 1 iforni a Transportation Commi ss ion• s abi 1 ity to reprogram highway projects. The Southern California Association of Governments has detennined, however, that (although there are definite statewide tradeoffs which must be made i.n determining funding levels} the California Transportation Commission does retain sufficient flexibility to increase the amount of highway expenditures programmed in the SCAG region. For example, through acce 1 era ted state cash financing and minima 1 North/ South Interstate, Primary and State-Only funding shifts, an increase of $91 million could be made available in Primary and State-Only funds to th~ SCAG region for the five-year period FY 79-FY-83. This would represent a 10% increase to the current SCAG capital outlay program.
The California Transportation Commission could also provide an additional $145 million to the SCAG region, to reach the region•s legal .,maximum" funding level.* Such an increase would, however, have significant impacts on interstate funding in San Diego County.**
Programmed Expenditures vs. Required District Minimums
As demonstrated ·earlier. the share of state highway funds.
SCAG region fails to receive an equitable Moreover, Caltrans estimates that it will
* This legal nmaximum 11 funding level assumes the SCAG region receives all Southern California discretionary moneys and that the SCAG portion of District 11 (Imperial and parts of Riverside Counties} receives a proportionate share of District ll 1 s district minimum.
** A complete discussion of alternative capital outlay funding levels and their impacts may be found in the report, 11 1978 Financial Plan for State Highways, Background Analysis and Discussion".
6-50

fail to expend the legally prescribed* district m1n1mum during FY '76-FY '79 for State Transportation District 7 (Los Angeles, Orange and Ventura Counties). The estimated shortfall is approximately $60 million. Compounding this projected violation of state law has been a growing imbalance in the legally required expenditure between Northern and Southern California.
Projected Funding Gap for New Facilities Construction (State Highways Only)
Figure 6.4-7 shows estimated levels of for state highways in the SCAG region. year periods, FY '79-'83 and FY '84-'88.
support for capital improvements Estimates are for the two five-
Revenue estimates assume a return to the region of approximately 50%** of the projected capital outlay in the state. Though feasible under current funding provisions of state law, such a return would require, in implementation activities, a more intensive and broader-based project development effort than is now under way by Cal trans. For example, the plan estimates $1140 million available for the period FY '79-'83, compared with the $854.1 million included in the Caltrans 1977 Six-Year Planning Program.
Expenditures are estimated for the following program categories: maintenance and rehabilitation, operational improvements, and new facilities. Estimates for the first two categories correspond generally to the amounts included in the Caltrans Six-Year Planning Program. For illustration purposes, the additional dollars that would be made available to the region, given ''maximum'' legal funding, are dedicated to new facilities.
Even under these conditions, the funding level shown for new facilities would not be sufficient to fund all projects submitted to SCAG for inclusion and prioritization in the Regional Transportation Plan (see Table 6.4-3). Based on the ~rejects submitted to date~ a deficit of a roximatel $700 million wou d be ro'ected -- whic if funded wou d require the equivalent of a 1.4-cent gallon gasoline tax increase during FY 1 79-'88.*** Expected additions to the project list and the highway requirements of the Regional Transit Development Program could add significantly to this amount.
* ••
Section 188.8 of the Street and Highways Code The estimated 50% would represent an equitable return of funds to the SCAG region, given that the region generates about 50% of the state's gas tax revenues. In addition, the resulting revenues would be approximately equal to the legal 11 maximum 11 funding levels discussed above.
***Assumes that gasoline consumption in the SCAG region equals 50% of California gasoline consumption and that all gas tax revenues generated by the increase in the SCAG region are returned to the region.
6-51

$ (Millions)
$900
!800
$700
$600
$500
$400
$300
$200
$100
FY 79
COMPARISON OF EXISTING STATE HIGH~IAY NEEDS TO PROGRAMMED EXPENDITURES
SCAG Region--FY 79-FY 83
Existing State Highway Needs
Programmed Expenditures
80 81 82 83
Note: Existing State Highway Needs are escalated at 8% over the five-year peri oct.
figure 6.4-6

FINANCIAL PLAN FOR STATE HIGHWAY CAPITAL IMPROVEMENTS (SCAG REGlON)
FY 1979 - FY 1983
Revenues Available
E X P E N 0 I T U RES:
FY 1984 - FY 1988
Revenues Available
E X P E N D I T U R E S
New Facilities
100 200 300 400 500 600 700 800 900 1000 1100
$1,140 million
$ 85-125 million
$175-250 million
$765-880 million
$ 760 million
$ 95-140 million
$175-250 million
$370-490 million
figure 6.4-7

Once rema1n1ng project submittals have been received, a constrained financial plan (required by AB 402) will be prepared. In preparing this plan, a decision will have to be made as to whether to constrain the plan based on available revenue estimates, or to seek additional sources of funds.
6-54


6.5 AIRPORT SYSTEM
The basic goal of this airport system plan is to develop a system of airports which meets the air transportation needs of the region in a manner consistent with the adopted Growth Forecast Policy. In fonnulating the regional plan, basic data on the existing airport system were coordinated with material provided by the Federal Aviation Administration and the Division of Aeronautics of the California Department of Transportation. The air transportation forecasts used in this plan are consistent, on a regional level, with forecasts developed by the State Division of AeronalJtics.
6.5.1 Setting
The locations of the major air carrier airports are shown in Figure 6.5-1. A comparison of the traffic at the air carrier airports in CY 1977 is shown in Table 6.5-1.
The inventory of air carrier and general aviation airports compns1ng the SCAG region Airport System Plan are listed alphabetically by county in Table 6.5-2. The airports 1 isted in Table 6.5-2 meet the criteria for being included in the plan contained in the airport system policies presented in the Policy Section of the RTP.
6.5.2 Current Issues
Some of the most important ttnresolved probler;Js and issues for the region's airports are described below.
Capacity Deficiencies
Forecasts indicate a demand of 88 to 97 Million Air Passengers (MAP) in 1995. (Table A-3-1, Appendix A.) However, current data show that the regional airport system (with presently planned expansions of existing facilities) will accommodate only 67 to 78 l'lAP by 1995 (Table A-3-2). Thus, it is possible that one out of three persons t.,rishing to fly on air carriers in 1995 will rtot be Jble to.
General aviation forecasts indicate a growth from some 11,000 based aircraft in 1977, to 20,000 in 1995. Forecasts indicate a shortage of airport ctcconwtodations for :Jeneral aviation aircraft by 1990: 350 accotllmodations in Los /\ngeles County, 690 in Oran;J>.:! Coun~y (Table A.3-3).
6-55

~ -· UJ r::: "1 CD
m • U1 I ~
VENTURA LOS ANGELES
Major Air Carrier Airports in the SCAG Region
eMajor Airports
SAN BERNARDINO
e RIVERSIDE Palm Springs Municipal
IMPERIAL
J 9.2p,4p,
10 30 So
• l:llyfhe

rt ID D" -CD
m • Ul I ~
AIRPORT ---· ..
LOS ANGELES INTERijATJONAL
ORAijGL COUNTY
HOLLYWOOD-BURBANK
ONTARIO INTERIJATIONAL
PALM SPRINGS
LONG BEACH
IMPERIAL COUNTY
PALMDALE AF PLANT 42
BLYTHE
SCAG REGION TOTAL
AIR CARRIER AIRPORTS
CY 1977 TRAFFIC COMPARISON
! PASSENGERS (NUMBER) AIR CARGO (TONS)
28,361,863 812,290 !
2,158,505 2,455
1,998,951 8' 541 ' ' 1,680,556 3 ,418 ' '
506,283 323
491,243 2' 294 '
48,683 203 I
6' 14 7 24 I
' I
3' 726 21 ' i
35,255,958 829 '569

I ' ) (2)
I 3)
(4)
(5) (5) (6)
County
Airport Type
Airport Name
'""'" c;,n .
~!!Jm
~COUNTY
~;:"fPB
li ~
~
AIRPORTS IN THE SCAG REGION
Owoec/ cmi ~:, "' dH.
" .ioo
j~J ·"' li U·-
I~ ·-~·--~ .. ·- ~ ~· ~ ~~~~!~f~~ation u
. .
• • • • PUC Center
*" R .~ ffi;
!
table 6.5-2

AIRPORTS IN THE SCAG REGION
O...ner/ Ci~:i ::, County
~ lifl ~g w
Airport Type leo~ u w
I!: ~~~
I~ ~
Airport Name !1 -~ U•"
I" •• ·~
~ ." ~ ~·" ¢0 ~0
C!a~sification u rn ." ~
CUUNIY
Wil Ai coact' ~·
~
~~~
(7 ~ Chil .
~
. ·~
I~ ~ ill
(a I l=ll ~ ( 9 I
table 6.5-2

Collnty
Afrport Type
Airport Name
~~ ~.~ (12) ~
(13) ~
AIRPORTS IN THE SCAG REGION
"'·
•
table 6.6-2

NOTES FOR TABL£ 6.5-2
I. Leased and operated by the City of Los Anqeles as a reliever airport for Van Nuys.
2. The publicly-owned Avalon Bay Seaplane Base is used only as an airline alternate for the adjacent, privately-owned Pebbly Beach Seaplane Base and is not open to public use.
3. The t:ities of Burbank, Glendale, ar1d Pasadena have formed the Hollywood-Burbank Airport Authority to operate the airport.
4. Plant 42 is a civil and military flight test center. A joint-use agreement with the Air Force provides for airline service.
5. These two demand areas could potentially be served by one larger airport.
6. The Saugus/Castaic area is not expected to generate a regionally significant demand by itself. An airport serving the combined Saugus/Castaic/Fillmore demand area would be regionally significant. Also see Ventura County.
7. Reeves Field is currently being stLJdied by the State of California and the County of Los Angeles to serve the regionally significant demand generated by the Los Alamitos/ Seal Beach ilrea as well as to relieve congestic.n at other general aviation airports in Orange and Los Angeles Counties.
8. An airport site at Moreno Valley is currently under consideration by the County of Riverside to serve the regionally significant demand projected for the Edgemont/Sunnymead area.
9. The County of Riverside currently is seeking a site for a regionally significant general aviation airport to serve the demand generated between Elsinore-Temecula Areas.
10. Although joint use of Norton AFB could serve these needs, the Air Force has adopted a no joint use position. SANBAG is presently conducting a Requirements and Site Selection Study to determine how these needs will be met.
11. Formerly Oxnard Air Force Base, the Airport is now operated by the County of Ventura as a general a~iation airport.
12. The City of Simi Valley and Ventura County are preparing to undertake a joint study of alternative airport sites in the east end of the county.
13. An airport serving the regionally significant demand generated in the Fillmore area could also potentially serve the locally significant demand generated in the Castaic area of Los Angeles County.
F-IFR
F-TCA LD
l-IFR
L-TCA S-2 S-3 VFR
•
(,I
(b)
"f,irspace capability indicates the maximum pote~tial for dev~l?pment of a~ airport with respect to the local airspace available. The a1rspace_capab1l1ty categor1es shown :or each of the airports in the listing were initially ass1gned ~o them by_the.Cal1fornla Airspace Utilization Committee Task 11. The objective of th1s c~te9or1z~t1on 1~ ~odefine a system of airports which will permit orderly growth of avut10n Wlth a rrnmmum of airspace conflicts. The following abreviations and categories are used:"
Full Instrument Flight Rules (airport can be developed to full IFR, including precision approach, and VFR capacity) Full Terminal Control Area Limited Development (further deve 1 opmen t of airport is 1 imi ted due to airspace conflicts with other airports) Limited Instrument Flight Rules (airport has only limited, i.e. non-precision, IFR capability, but can be developed to full capacity for VFR operations) Limited Terminal Control Area (arrival/departure corridor configuration) Stage II Radar Approach Sequencing Stage III Radar Approach Sequencing Visual Flight Rules (airport can be developed to full VFR capacity, but cannot accommodate any IFR operations)
No airspace capability category assigned by Task 11; category shown obtained through consultation with Federal Aviation Administration. San Fernando and Whiteman have airspace conflicts which limit simultaneous development. Both currently serve regionally significant levels of demand. Full IFR development may be limited due to airspace conflicts with Ventura County, Oxnard Airport and Naval Air Station, Point Mugu.
table 6.5-2

Palmdale I'nternat i onal Airport (Proposed)
Palmdale International Airport is the Los Angeles City Department of Airport's long-range project to meet future air carrier passenger demand. The City of Los Angeles has a development plan for this airport and has been acquiring property in recent years. The site appears to be acceptable to a majority of the local comr;1unities.
Airport Growth Constraints
A number of the SCAG region airports have 1 ocal constraints on the increase of airport operations needed for the forecasted growth in air travel and cargo. Many constraints are due to the noise impact on the surrounding community, surface access congestion and lack of physical space to accommodate facility expansion without significant economic burden on the airport operator.
Reeves Field Airport
Reeves Field, an airport on Tenninal Island in the City of Los Angeles Harbor, is now closed. A general aviation airport is needed to relieve flight operations and provide added space at Torrance Municipal, Hawthorne Municipal, Long Beach Municipal, and other south bay area airports. The Los Angeles Harbor District has plans for using Reeves Field as a central storage area for hazardous materials. The SCAG Aviation Technical Advisory Committee is currently communicating with the Los Angeles Harbor District, exploring possibilities for reopening Reeves Field as a reliever airport.
Airport Noise Standards
Los Angeles International, Hollywood-Burbank, and other major air carrier airports in California remain operating only through the issuance by the State of annual variances from the State regulation Title 4 Subchapter 6 Noise Standards. The State noise standard is sufficiently stringent that the ambient noise from a neighboring street reportedly exceeds the noise conditions that Los Angeles International Airport is required to meet.
Transit Between Orange County and Ontario International Airport
Recent studies by SANBAG and staff of the Orange County Board of Supervisors indicate the feasibility of a joint public and private bus service to operate a shuttle between the Orange County area and Ontario International Airport. Such service could be provided with little or no public subsidy and would help alleviate the passenger demand on Orange County Airport with the possibility of a decrease in the noise attributable to jet aircraft in Orange County.
6-62

Revised 1-25-79
6.5.3 Institutional Responsibilities
Institutions at federal, state. and local government levels as well as the private sector are involved in the regional airport system. The actions outlined above would be carried out primarily by local governments. Most airports are owned or leased and operated by cities and counties which would be responsible for capital improvements and planning of their respective airports.
The cities of Burbank, Glendale, and Pasadena formed the Hollywood-Burbank Airport Authority (a joint powers entity) and purchased for operation the Hollywood-Burbank Airport. The State Government Code was amended specifically to provide for the purchase and for the issuance of revenue bonds by the Authority.
The cities of Chino, Garden Grove, Santa Ana, and Stanton have formed a Joint Powers Authority, the Inter-County Airport Authority, for the purpose of developing a solution to the forecast public demand in the area defined in the State- and SCAG-adopted forecasts as consisting primarily of Orange County, but including parts of Southern San Bernardino and Western Riverside Counties.
6. 5.4 System Management Actions
1. In the short tenn, SCAG will give priority to promoting greater use of special airport limousines or buses by increasing the frequency and points of service, and decreasing trip times. Provisions for priority lanes on freeways and on streets leading into the airport for these vehicles as well as other public transit buses are needed and should be vigorously supported.
2. The Los Ange 1 es Department of Airports should make provisions for handling the increased volumes of air cargo expected at LAX through ]985.
3. SCAG supports improved ground access to Los Angeles International, Ontario, and Hollywood-Burbank airports, and urges that any improvements should be planned to also accommodate the expected increases in air cargo volumes.
4. Ontario International should be planned as the major reliever airport for Los Angeles International in tenns of air cargo handling capability.
5. Remote passenger terminals 1 ocated in the high-density centers of the Los Angeles metropolitan area and providing fast~ convenient groundaccess service directly to aircraft at Los Angeles International Airport should be in operation by the early 1980's.
6. Present remote parking capabilities and the intra-airport circulation system should be more fully developed at LAX.
6-63

Revised 1-25-79
7. By 1985, flight frequencies and the choice of destination at Ontario International Airport should be greatly extended over those available today.
8. SCAG should detenntne the impact on the regional airport system in making decisions on the use of unused airport facilities in the region, such as Reeves Field on Terminal lsland.
9. SCAG will assist local governments in forecasting aviation demand to provide a basis for matching public need with airport facilities.
10. SCAG will assemble the data sufficient to permit the definttion of general aviation demand areas, as has been done for air carrier demand areas. This will indicate facility development priorities.
6.5.5 System Development Actions
11. Land use compatibility will be developed around major regional airports in relation to California and Federal noise regulations.
12. Los Angeles International Airport should be developed to enable 40 million annual passengers to be enplaned and deplaned by the mid-1980 1 s.
13. Ontario International should be developed to enable 4 to 6 million annual passengers to be enplaned and deplaned by 1985; to enable substantial growth in passenger volumes through the 1980's; and to enable 14 to 20 million annual passengers to be enplaned and deplaned by 1995.
14. Airline airport facilities in the Palmdale area should be developed to serve all of the air passenger demand attracted to an airport in that area.
15. SCAG will establish a task force of airline representatives of commercial airlines, airport operators, and regulatory agencies to determine specific implementation actions to achieve an average load factor of 70%. Recommendation for action to be made by July. 1979.
16. SCAG will utilize a task force of representatives of commercial airlines, airport operators and regulatory agencies to develop an implementation program which wi l 1 reduce aircraft delays and excessive idle/taxi operations wh i1 e on the ground. Recommendations for action to be made by JulyJ 1981 with implementation by appropriate agencies or firms prior to 1983.
6-64

Revised 1-25-79
17. The airlines and regulatory agencies should evaluate existing operating procedures and flight schedules to minimize the taxi and queueing delays. Control of landings, and increased use of gate holds should be given high consideration. In addition. airport operators should design airport expansion and construction based on shorter taxi distances, reduced airplane ground congestion and runway configurations which minimize ground delay.
18. SCAG will seek assurances from FAA that it will initiate a technical feasibility study (if necessary) in FY 81 to detennine impacts of modifying engine speeds during aircraft idling and reducing the number of in-operation engines during taxing.
19. The FAA should prepare, in conjunction with the affected agencies, an operating procedure for each type of aircraft in use. This procedure should include RPMs for engine, numbers of engines to be used, and allowances for reduced taxi speeds if necessary.
20. SCAG Nill encourage the ARB (California Air Resources Board), EPA and FAA to establish requirements for new piston aircraft engines to meet emission standards as proposed by the EPA in 1973.
21. SCAG will encourage EPA and FAA to establish emission standards for modifying existing jet aircraft engines to meet proposed 1978 Federal standards.
22. The total emissions from each airport should be detennined and the public agency owning or operating these airports can implement the three AQMP measures relating to airports (H-1. H-2 and H-25) and their associated transportation act ions or take whatever other actions are necessary to reduce the emissions by an amount equivalent to those that would be reduced by the individual airport and VMT control measures -- provided that the equivalent reduction takes place at the airport originating the emissions.
6-64A
6. 5. 6 Financing
The regional airport system short-range capital improvements with cost estimates for the five-year period FY 80 through FY 84 (as planned by the region's airport operators) are provided in Table 6.5-3.
The region's air-carrier-airport operators have projects eligible for Federal Aviation Administration Airport Development Aid Program (ADAP) funding far in excess of the ADAP funding that is likely to be granted within the SCAG region in this period. The Los Angeles City Department of Airports' five-year plan shows a theoretical use of approximately $74.3 million in ADAP funds for Los Angeles International Airport, and approximately $18.9 million for Ontario International Airport. The figure for LAX is about double the approximate $7 million per year the Department has been obtaining in ADAP funds for that airport. However, the necessary extension of the Federal legislation might enable higher funding.
The region's general aviation airport operators have projects eligible for FAA ADAP funding which require about 12% more ADAP funds than esti~ mated to be available.
The five-year capital improvement programs proposed by the airport operators for FY 85 - FY 89 are listed in Table 6.5-4. Very few of the airports have information for this period. The data for Los Angeles International and Palmdale International are for projects planned only through FY 85. Airport development is heavily dependent upon ADAP funding and Congress has only appropriated ADAP funds through FY 80.
The Airport and Airway Development Act Amendments of 1976 to the Airport and Airway Development Act of 1970 increased the amounts of Federal ADAP capital improvement funds previously available per year and added new airport improvement elements to the eligibility list. Since Congress provided for funding only through FY 80, it is assumed for planning beyond FY 80 that the present Federal funding pattern for the airport system will continue through FY 89.
Two-thirds of the Federal funding for air-carrier and canmuter airports is assigned to air-carrier airports on the basis of annual passenger enplanements. The remaining one-third will be assigned to air-carrier and commuter airports at the discretion of the Secretary of the Department of Transportation. Since for this latter case there is no historical basis for the amount that will be assigned to the SCAG-region airport system, it is assumed that the proportion will remain about the same as when one-third was assigned on the basis of population and geographical area.
The Federal ADAP capital improvement funding available to the SCAG-region airport system shown in Table 6.5-5 reflects these assumptions.
The California Airport Aid Program (CAAP) derives its funds primarily from the tax on aviation fuel used by general aviation aircraft. Because of this, the Division of Aeronautics distributes the funds primarily to airports which provide service to the general aviation sector although there is a mandatory allocation of $5,000 annually to each public airport.
6-65

ct ID C" -CD
m • m I Ell
COUNTY AND
AIRPORT
IMPERIAl COUNTY Brawley Calex1co Calipatria Municipal
**Imperial County Salton sea
County Total
LOS AAGELES COUNTY Brackett Compton El Monte Fox, Gen. Wm. J. Hawtllorne Munici pa 1
*11Ho llywood-Burbank **Long Beach (a} **los Angeles lnt'l. **l'~lmdale lnt'l. S~nt~ J>lonica Municipal Torrance Municipal Van Nuys Whiteman
County Total
ORANGE COUNTY Fullerton
**Orange County County Total
~IVERS!OE COUNTY BMnlng Mun1cipal
**Blythe Corona Municipal Desert Center Hemet-Ryan
**Palm Springs Municipal ~i¥erside Municipal Thennal Chiriaco Sum1it Moreno valley Temecula Area
County Total
FIVE-YEAR CAPITAL IMPROVEMENT PROGRAMS PROPOSED BY SCAG REGION AIRPORT OPERATORS
BY MAJOR COST CATEGORY FOR fY 1980 THROUr.H BY 1984 (DOLLARS}
PROJECT COST CATEf.ORY
PASSENGER OTHER GROUND TOTAL AIRFIELD TERMINAL BUILDING ACCESS LAAD PROJECT
AREA AREA AREA FACILITIES ACQUISITION COST
0 0 330,000 0 0 330,000
330,000 152,500 36,100 77,400 0 596,000 2,412,000 0 550,000 0 1' 744,000 4,706,000
680,000 0 120,000 0 100,000 900,000 3,422,000 152,500 1,036,100 77,400 1,844,000 6.532,000
l,"l33,987 650,200 0 0 2,584,187 0 138,000 0 0 138,000 0 0 1,067,500 0 0 I ,067,500
64,000 0 0 0 0 64,000 0 50,000 0 0 2,987,000 3,037,000
4,950,000 162,000 0 100,000 51,000,000 56,212,000 10,190,000 6,300,000 1,500,000 820,000 1,000,000 19,810,000 49,421,000 158,150,000 6~.295,000 169,474,000 0 443,341,000
0 63,330,000 0 0 500,000 63,830,000 67,000 D 0 18,000 0 85,000
1,007,500 1,000,000 283,600 696,000 0 2,987,100 3,777,000 0 1,738,000 744,000 0 6.259,000
0 1,122,000 0 0 0 1.122,000 71,410,487 230,114,000 71 ,673,300 171,852,000 55,487,000 600,536,787
389,000 40,000 788,500 0 0 1,217,500
389,000 40,000 788,500 0 0 1.217,500
402.000 D 0 0 D 402,000 500,000 D 95,000 0 D 595,000 770,000 200,000 1,340,000 220.000 80,000 2.610,000 355,000 0 0 0 0 355,000
1,050,000 120,000 180,000 82,000 0 1,432,000 450,000 516,000 10,000 0 4' 100,000 5,076,000 905,000 0 0 629,000 258,000 I, 792,000 215,000 0 60,000 0 0 275,000
20,000 0 0 0 0 20,000 1,035,000 0 90,000 0 525,000 I ,650,000 1,035,000 D 90,000 0 600,000 1,725,000 6,737,000 636,000 1,865,000 931,000 5,563,000 15.932,000
FUNDING SOURCE
AOAP ''" LOCAL
0 70,000 260,000
D 536,400 59,600 4,235,400 0 470,600
0 D 900,000 4,235,400 606,400 1,690,200
1,660,247 57,600 866,340 0 0 138.000 D 0 1,067,500 D 57,600 6,400
2,573,000 227 .coo 237,000 39,569,795 0 16,642 ,205 14,060,000 0 5. 750 .coo 74,338,500 25,000 368,977 .soo
0 D 63,830,000 68,000 8,000 9,000
1,026,540 304,650 1,655,910 0 25,000 6,234,000 0 0 1,122,000
133,296,082 704,850 466,535,855
432,000 627,480 158,020
432,000 627,480 158,020
173,700 181,300 47,000 400,000 0 195,000 765,000 414,000 1,431,000{ 268,000 18,000 69,000 840,000 D 592,000
4,549,500 0 526,500 1,585,800 24,600 181.500
52,000 135,000 88,000 0 0 20,000
1,248,000 0 402,000 1,308,000 0 417 .ooo
11.190,000 772,900 3,969,100

rt m D' -CD
m • Ul I Cal
F!VE-YE~R CAPITAL IMPROVEMENT PROGRAMS PROPOSED BY SCAG REGION AIRPORT OPERATORS
BY MAJOR COST CATEGORY FOR FY 1980 THROUGH FY !984 (DOLLARS)
PROJECT COST CATEGORY FUNDING SOURCE COUNTY AND
PASSENGER OTHER GROUND AIRPORT AIRFIELD TERMINAL BUILDING ACCESS LAND
AREA AREA AREA FACILITIES ACQUISITION
SAN BERNARDINO COUNTV
Apple Valley 376,680 0 0 0 577,733 Baker 30,000 0 0 0 0 Barstow-Daggett 446,115 0 0 0 0 8\g Bear City 1,303,527 0 0 0 0 Chino 963,500 0 0 0 0 Needles Municipal 245,600 0 0 0 0
**Ontario lnt' 1 7,771,000 26,194,000 0 0 0 Redlands ,,micipal 52,000 0 0 60.000 0 Rialto Municipal 1,800,000 130,000 330,000 0 300.000 Twenty~Nine Palms 89,881 0 0 0 0 Trona 15,000 0 0 0 0
County Total 13,093,303 26,324,000 330,000 60,000 877 '733
VENTURA COUNTY uVentura Co. Oxnard 559,000 95,000 338,000 0 2.225,000
Ventura Co. Camarillo 1 ,058,000 915,000 300,000 0 0 County Total 1,617,000 1,010,000 638,000 0 2.225,000
SCAG REGION
Air Carrier Airports 76,253,000 254,747,000 66,789,000 170,394,000 60,569.000 G. A. Airports 20,415,790 3,729,500 7,541,900 2,526,400 5,427,733
Total 95,668,790 258,476,500 76,330,900 172,920,400 65,996.773
-- -~-
•• AIR CARRIER AIRPORTS
I •I (b)
PROJECTED IMPROVEMENT PROJECTS REPRESENT UNAPPROVED PLANNING FORECASTS ONLY
PARTLY IS FROM PRIVATE FUND
TOTAL PROJECT ADAP CAAP
COST
954,413 858,973 0 30,000 0 27,000
446,115 0 401,504 1,303,527 1,173,174 0
963,500 867,150 0 245,600 221,040 0
33,965,000 18,925,250 25,000 112,000 0 46,800
2,560,000 1,890,000 0 89,881 0 80,892 15,000 0 13,500
40,685,036 23,935,587 594,696
3,217,000 2,331,000 475,750 2,273,000 1,227,400 454,300 5,490,000 3,558,400 930,050
530,752,000 158,409,445 525,750 39,641,323 18,238,024 3,710,626
670,393,323 176,647,469 4,236,376 --- -- ----
LOCAL
95,440 3,000
44,611 130,353 96,350 24,560
15,014,750 65,200
670,000 8,989 1,500
15,154,753
410,250 591,300
1,001,550
471,816,805 17,592,673 65,509,478 ---

rt m D" -CD
m • 01 h
FIVE-YEAR CAPITAL IMPROVEMENT PROGRAMS PRCPOSED BY SCAG REGION AIRPORT
OPERATORS BY MAJOR COST CATEGORY FOR FY 1985-Bb THROUGH FY 1989-90 {Thousands of Dollars)
I PROJECT COST CATEGORY "FUNDING SOURCE
Airfi!•ld Passenger Other Ground Land I Total AIRPORTS Are<• Terminal Building Access Acquisition ! Project ADAP CAAP Local
Area ,'\.rea Facilities i Cost
Banning Municipal 200 0 100 100 0 1 400 360 20 20 III«Blythe c 0 95 o 0 : 0 0 0 95
Corona Municipal 600 330 1,640 220 0 I 2,790 1,206 0 1584* Desert Center NO IMPROVEMENTS 0 0 0 Hawthorne Munic'ipi!l 0 0 ' 0 0 1,698 1.698 1,373 142 183 Hemet-Ryan 0 110 340 0 0 450 0 0 450
! **Imperial County 5,000 4,500 0 500 i Redlands Municipal 2,500 0 0 0 0 2,500 2,039.75 210.25 250 I Reno Valley (proposed) 150 0 90 0 0 240 80 0 160 ' Rialto Municipal 2,300 0 0 0 0 2,300 2,070 0 230
Santa Monica Municipal 1,000 1,000 0 0 0 2,000 9'JO 110 99C ; Temecula Area (proposed) 0 0 90 0 0 90 r 0 0 90
I Torrance Municipal 354 548.6 0 0 0 902.6 623.88 96.12 182.6 Ventura Co- camarillo 250 0 0 0 0 250 225 12.5 12.5
**Venturu Co- oxnard 250 0 0 0 0 250 225 12.5 12.5 I 11....------- ...J.. ____ J.... ___ J.. ____ J.. ____ ...J. ___ i.... _________ _
*part of the funds is from private investment **Air Carrier Airports

Preliminary planning within the State Division of Aeronautics indicates that approximately $3.0 million will be available for distribution to the California airports annually for capital improvements in FY 79. The available funds will drop to $1.0 million in FY 83. The SCAG region, from consideration of numbers of airports and airport activity, is entitled to approximately one-half of the California funding. The State CAAP capital improvement funding available to the SCAG region airport system shown in Table 6.5-5 is based on obtaining one-half of these funds.
It should be noted that the $101,776,000 in ADAP funds estimated to be available in FV 80-84 for air carrier airports will not cover the planned need of $158,409,445 (shown in Table 6.5-3). Nor will the $16,249,000 in ADAP funds estimated to be available for the same period cover the $18,238,024 shown as required for general aviation airports.
The $3,900,000 in CAAP .funds estimated to be available in FY 80-84 will not cover the planned need of $4,236,376 for the regional airport system.
Federal (ADAP)
Ai rcarri er/Commuter
General Aviation
State (CAAP)
SCAG REGION AIRPORT SYSTEM
CAPITAL IMPROVEMENJ FUNDING AID FORECAST (THOUSANDS OF DOLLARS}
FY 1980 FY 1981 FY 1982 FY 1983 FY 1984
18,274 19,315 20,355 21,396 22,436
2,937 3,094 3, 250 3,406 3,562
1 ,200 1 ,000 700 500 500
TOTAL FY TOTAL FY 1980-1984 1985-1989
101 '776 127' 788
16,249 20,154
3,900 2,500
6-69 table 6.5-5


6.6 NON-MOTORIZED
6. 6.1 Setting
Non-motorized transportation includes all modes of travel that use human energy directly for propulsion. Bicycling and walking are the most common examples.
In the SCAG region each county has developed and adopted county wide plans for bikeways and related bicycle facilities. In conjunction with the counties, nearly 80% of the cities in the region have developed local plans for the same type of facilities interconnected and coordinated with the county facilities. For the most part, the plans include extensive networks of bike paths and describe projects being implemented progressively, using available funding to extend the basic system. Maps and material showing routes, convenience data and other physical information are available from the individual counties and cities. In addition, Caltrans has developed an extensive network of state bikeway routes on state highways throughout the state highway system with specific regional maps and convenience data available from Caltrans District Offices. They also provide standards and guidelines for facility design, operational use, safety and traffic practices. These city, county and state plans have been serving the cyclist adequately and, to date, a regional plan for bicycles, or non-motorized transportation, has not been developed by SCAG.
Plans for pedestrian facilities have not been developed in general practice as separately identifiable programs. These facilities are usually implemented and funded as part of local plans for traffic and street/highway deve 1 opment at city and county 1 eve 1 s. As such, they are consistent within themse 1 ves and no regi ana 1 plans have been deve 1 oped or considered necessary. Regional level coordination of pedestrian facilities has been primarily for the administration of SB-821 funds which includes regional policies for pedestrian and physically handicapped and elderly needs in project application and A-95 review. Encouraging pedestrian facility coordination is exemplified by the City of Los Angeles•s expanding pedway system in downtown Los Angeles.
6.6.2 Relation to Issues and Objectives
The use of non-motorized means of travel is most closely related to the air quality and energy conservation issues and objectives for the region. Neither walking nor bicycle riding burns fuel or emits pollutants which deteriorate air quality. The bicycle can be used effectively as an alternate means of transportation for many short trips made by the automobil e. Every trip that can be made by this means instead of the automobile directly reduces vehicle miles of travel and emissions to the atmosphere. Currently, bicycle use is predominantly for recreational purposes although its use for work trips, shopping trips. and other errands is growing. Data on these uses is not readily avail able. Although the reduction in automobile use expected from bicycle travel is small, it does make a positive contribution. The use of the bicycle should be encouraged as much as possible by regional policies and actions.
6-70

6.6.3 Act ions
Revised 1-25-79
County and city plans for bicycle and pedestrian facilities are consistent within the region and they adhere to Federal and State safety and design standards. Implementation and schedules of action are determined by local agencies. Coordination of these plans is provided by SCAG, as needed. The administration of SB 821 funds and the review process for A-95 and the Transportation Improvement Program (TIP) are continuing functions. Actions to encourage more bicycle use will be continued.
1. SCAG will coordinate bicycle planning, implementation, and safety programs among all participants in the transportation planning process.
2. SCAG and the CTCs will encourage cities and counties to use available SB 821 bicycle and pedestrian facilities funds in support of projects which discourage auto use.
3. SCAG wil 1 seek increased funding, from private, local, state and federa 1 sources, for bi eye 1 e and pedestrian faci 1 it i es, through its legislature/administrative advocacy program.
4. SCAG, the CTCs, and Caltrans will encourage and support promotional programs to increase the provision for and use of bicycle and pedestrian facilities.
5. SCAG will encourage cities and counties to consider amending zoning, subdivision and building ordinances to require the provision of bikepaths, over-crossings and pedways, bike racks and other facilities to encourage walking and bicycle riding.
6-71

SB B21 BICYCLE AND PEDESTRIAN FACILITIES FUND ALLOCATIONS
PROJECT COUNTY TYPE FY 1976 FY 1977
Imperial Bicycle 15,264 21,308 Pedestrian --- ---Tota 1 15,264 21,308
Los Angeles Bicycle 1,196,172 1,179,506 Pedestrian 213,943 198,326 Tota 1 1,410,ll5 1,377,832
Orange Bicycle 292,324 383,216 Pedestrian 7,273 42,468 Tota 1 299,597 425,684
Riverside Bicycle 82,114 92, lll Pedestrian --- ---Total 82, ll4 92, 1ll
San Bernardino Bicycle 65,714 62,382 Pedestrian 38,059 45,375 Tota 1 103,773 107,757
Ventura Bicycle 60,870 77, 331 Pedestrian 1,600 ---Total 62,470 77,331
TOTAL Bicycle 1,712,458 1 ,815,854 --SCAG ( 87%) (86%) --REGION Pedestrian 260,875 286,169
( 13%) ( 14%) Tota 1 1,973,333 2,102,023
(100%) (100%)
*Unallocated funds included in Bikeway expenditures in County of L.A.
**$6,965 unallocated in San Bernardino County.
table 6.6-'1
FY 1978
13,753 6,900
20,653
1 ,260,6ll* 247,263
1,507,874
370,707 49,146
419,853
ll0,978 ---
ll0,978
44,802 80,969
125,771*
55,225 22,000 77,225
1,856,076 (82%)
406.270 ( 18%)
2,262,354 (100%)

D D
m:FD~l:FD~Dm:FD~0 r:F~o~r:FCQJ~@~
v-
CJo

6. 7 MARITIME AND RAILROADS
Maritime transport in the region is almost wholly concerned with worldwide freight movement. Since the majority of world trade is conducted by ship, the ports play a vital role for commercial, industrial and residential interests. The los Angeles Customs District comprises the ports of Long Beach, Los Angeles and Port Hueneme. The District handled $14.5 billion worth of trade in 1974 -- 39% of the total trade at all West Coast ports.
The operation of the region's ports concerns an area much greater than the SCAG region. The los Angeles Customs District serves a market area encompassing the southern portion of California as well as all or part of seven other Western states, and products imported here are shipped throughout the country. Thus the region's ports are of national significance.
The SCAG Region is served by three major railroad companies: The Southern Pacific, the Union Pacific and the Atchison, Topeka and Santa Fe. It is by far the busiest rail market in the Western United States. 21% of all goods produced in the SCAG Region for shipment to U.S. markets are transported by rail.
A study of passenger rail feasibility was conducted recently for the San Diego-los Angeles Corridor Study. The Study found that, with only minor improvements, existing rights-of-way could provide reliable, frequent and environmentally acceptable inter-regional passenger transport in that corridor. In February 1978, additional commuter rail service was instituted in the los Angeles-San Diego Corridor, jointly funded by los Angeles County, Caltrans, and AMTRAK.
Actions
1. SCAG should take a more active role in regard to review of individual projects of regional significance at the Ports through 1) increased direct contact and communication with Harbor Commissioners and local Harbor Districts and 2) a strengthened EIR review process.
2. Continue to implement recommendations from the San Diego-los Angeles Corridor Study as outlined. These recommended actions are:
Short-Range
- Inaugurate weekend express service between los Angeles and San Diego.
- Decrease trip time between los Angeles and San Diego to two hours, twenty minutes (two hours, five minutes for express runs}. This can be accomplished with the following improvements:
Install fencing along 12.2 miles of track in the areas of Fullerton, Orange, Santa Ana, and San Clemente.
6-73

" < • i ' < ' • • • l • ,
02 • • .~0 0 • 02- • w-0 • 2<rw • -~<r • : • ~~" , • ::!ill< • • • ~ • ~0u % % i • ! 0 «ao0 • • • <rOW • • < I om~ • • %
~~~-- I oe ::E=t:!:
figure 6. 7-1
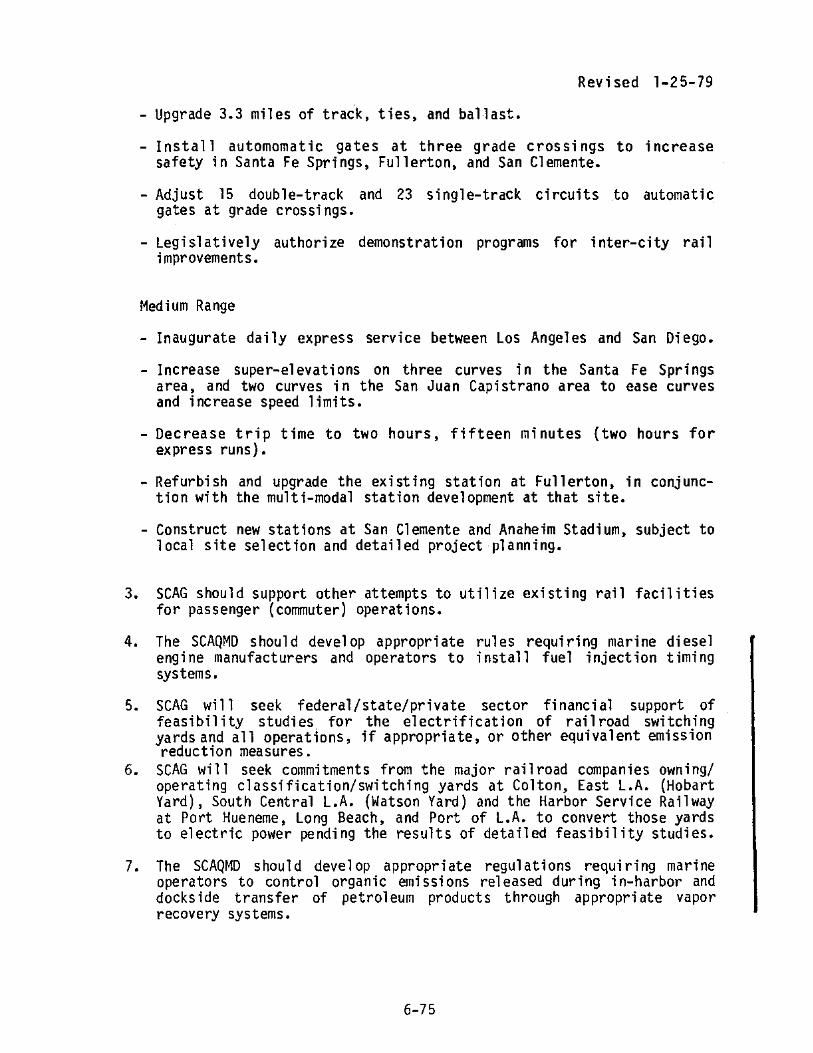
Revised 1-25-79
-Upgrade 3.3 miles of track, ties, and ballast.
Install automomatic gates at three grade crossings to increase safety in Santa Fe Springs, Fullerton, and San Clemente.
- Adjust 15 double-track and 23 single-track circuits to automatic gates at grade crossings.
- Legislatively authorize demonstration programs for inter-city rail improvements.
Medium Range
- Inaugurate daily express service between los Angeles and San Diego.
- Increase super-elevations on three curves in the Santa Fe Springs area, and two curves in the San Juan Capistrano area to ease curves and increase speed limits.
-Decrease trip time to two hours, fifteen minutes {two hours for express runs}.
Refurbish and upgrade the existing station at Fullerton, in conj unction with the multi-modal station development at that site.
Construct new stations at San Clemente and Anaheim Stadium, subject to local site selection and detailed project planning.
3. SCAG should support other attempts to utilize existing rail facilities for passenger (commuter) operations.
4. The SCAQMD should develop appropriate rules requ1r1ng marine diesel engine manufacturers and operators to i nsta 11 fue 1 inject ion timing systems.
5. SCAG will seek federal/state/private sector financial support of feasibility studies for the electrification of railroad switching yards and all operations, if appropriate, or other equivalent emission reduction measures.
6. SCAG will seek commitments from the major railroad companies owning/ operating classification/switching yards at Colton, East L.A. (Hobart Yard), South Central L.A. (Watson Yard) and the Harbor Service Railway at Port Hueneme, Long Beach, and Port of L.A. to convert those yards to electric power pending the results of detailed feasibility studies.
7. The SCAQMD should develop appropriate regulations requiring marine operators to control organic emissions released during in-harbor and dockside transfer of petroleum products through appropriate vapor recovery systems.
6-75

finance

Revised 1-25-79
7.0 Fl NANCE
I. Introduction
This element presents the financial data associated with the Regional Transportation Plan. It projects future revenues for transportation; it also indicates costs of transportation proposals including new recommendations for transportation control measures, construction of the Regional Transit Development Program, and Ridesharing.
Projected revenues will fund a substantial portion of the plan; some system facility improvements in both transit and highways will be possible without tax increases. However, a comparison of costs and projected revenues over a 10 year time period shows that there is an unfunded deficit if the plan is to be fully implemented in that time period. A series of recommendations are made in order to fund a 11 portions of the plan.
The detailed financial information is presented for two time periods: FY 79-83 and FY 84-88. The infonnation is also given by major mode/ facility (highways, transit, streets and roads and airports.) A breakdown of the funded dollar amounts are shown by mode or facility categories. Special attention is given to the transportation control measures being recommended in this amendment.
Figure 7-1 illustrates costs and revenues for the Regional Transportation Plan; public sector costs and revenues for system maintenance, system development, and air quality mobile source control are joined with private sector mobile source control measure costs. Projected pub 1 ic sector revenues of $15.5 bi 11 ion do 11 ars from existing sources wi 11 fund neither a 11 of the system rna i ntenance and deve 1 opment costs of $19.7 billion nor $1.2 billion in costs projected for public sector transportation control measures. In all, the public sector faces unfunded costs of $4.4 bill ion for system development and maintenance, and $1.0 billion for mobile source control measures. An additional $2.3 billion in mobile source measure cost is assumed to be borne by the private sector.
This deficit may be somewhat overstated for two reasons. First, it is assumed that the planned improvements are to be completed within the ten year period. As implementation is delayed, costs will rise but additional revenues will also become available. Second, the region is entitled to a large sur.1 of UMTA Section 3 funds for the Regional Transit Development Program. However, since these revenues are discretionary it is somewhat misleading to include them as available revenues. Therefore Section 3 funds are excluded from available revenues, but are treated in more detail as a funding source later in this chapter.
7-1

Revised 1/25/79 FIGURE 7-1
COSTS AND REVENUES FOR REGIONAL TRANSPORTATION MAINTENANCE, DEVELOPMENT AND AIR QUALITY CONTROL MEASURES
fy 1979-1988
$Billions $ Billions
z
"" -' ~
z 0 -.... ;5 "' 0 ~
"' z _,;:; ;ii>-0-' ;:::;1! -o c-:iiOl .... "'
COSTS 23.2 ---------------------
20 9 .
19.7
2.3
Private Sector Trans porta ti on Control Measures
1.2
Pub 1 i c Sector Transportation Control Measures
19.7
System Development
-------------------
System Maintenance
7-2
REVENUES --------------------.- 22.4
'
' ' '
2.3
Private Sector Costs
5.4
Unfunded Pub 1 i c Sector Costs
15.5
Projected Pub 1 i c Sector Revenues
20 9 .
15. 5
figure 7-1

Revised 1-25-79
There are alternatives methods to fund the public sector deficit. New sources of revenues are briefly discussed and the required amounts shown. A second approach is to achieve a greater return of the region's highway user tax dollar and the federal tax dollar being used for transit.
It is recommended that: (1} the percentage of regionally collected highway user revenues returned to the region be increased from 55% to 70%-75%. This would return approximately one billion additional dollars to the region by 1988; (2) 10%-15% of the national allocation of UMTA Section 3 funds (for transit capital) be allocated to the region during the ten-year period.
The second major recommendation is to index the state gasoline tax in the SCAG region so that revenues keep pace with rising costs.
A third alternative was also considered. This was to have reprogramming of funds from one plan proposal to another. This may be necessary to fund high priority items such as air quality projects. However, it does not provide a greater total amount of revenue which is what is needed if the Regional Transportation Plan is to be fully implemented.
There are additional policies that relate to greater financial flexibility in the use of transportation funds by local government. These are already a part of the Regional Transportation Plan.
The remainder of the financial element is broken into the following sections. Section II details the costs and revenues for transportation system maintenance and development. Section III deals with financial data for transportation contra 1 measures. Section IV e 1 aborates on the funding strategies ment i a ned above. Sect ion V presents the recommended financial actions.
II. System Maintenance and Development Costs and Revenues
Table 1 outlines total revenues projected to be available in the region for transportation purposes during the ten-year period. $6.1 billion is available for transit expenditure, $3.2 billion for highway expenditure, $4.9 billion for street and road expenditure, and $695 million for airport expenditures. An additional $600 million in State Proposition 5 gas tax and TDA funds has not been alloted to any mode. (A list of major assumptions used to develop these figures, as well as those in Table 7-2, can be found in Appendix I.) Several funding sources may, by law, be expended in more than one modal area. This results in some funding sources which are split into more than one mode (i.e., Federal Aid Urban). The distribution of revenues in Table 7-1 assumes that historical modal distribution of most revenues will be continued into the future.
Among funds allocated to transit, UMTA Section 5 revenues are projected to increase by over 30% as a result of newly enacted transit legislat ion (HB1738). A similar increase is projected after FY 1983. UMTA Section 3 funds are shown to decline during the second five year period. However, Section 3 funds which may be available pending approval of portions of the Regional Transportation Development Plan are excluded from
7-3

Revised l/25/79
Table 7-1
Revenues Existing Transportation
~rejected Through Fiscal Vear 1988 (Escalated$ Millions)
FY 1979- FY 1984- FY 1979- Alternative (1} TRANSIT F'i 1979 1983 1988 1988 nodal Uses
(21 lJHA Section 3 $ 52 $ 406 ! 251 $ 657
I 3 I UMTA Section 5 97 450 607 1057
(41 Federal Aid Urban 15 15 30 Highways. Streets ~ Roads
I 5 I TOA {l/4¢ Sales Tax) 111 625 893 1518 Streets and Roads
I 5 I FARES 102 557 1105 1662
(7} Miscellaneous 43 262 360 622
(8 I Article 19-Gas '" 0 44 44
(9 I Federal Aid Interstate 25 472 498''
TOTAL $ 405 $ 2341 $ 3747 $ 6088
HIGHWAYS
ll 0) Federal Aid Interstate"' BJ 459 448 919 Transit Guideway
I 11 I Federal Aid Primary* 40 189 182 J7l
(121 Federa 1 Aid Urban* 10 45 45 90 Transit, Streets & Roads
(131 Federa 1 Aid, Other* 4 32 52 84--
(14) Article 19-Gas Tax to 231 819 871 1690 State HfgtT.fays Transit Guideway
TOTAL $ 212 $ 1554 $ 1598 $ 3152
STREETS AND ROADS
(15) Federal Aid Urban 38 190 190 380 Transit,Highways
( 16) Federal Aid Other 17 110 170 280
( 1 7) Article 19-Gas Tax to Cities and Counties 180 900 900 1800 Transit Guideway
(Hl) TOA ('4¢ Sales Tax) 10 90 140 230 Tr~nsit
(lJ) Local 224 1125 1125 2250
TOTAL $ 459 $ 2415 $ 2525 $ 4940
AIRPORTS
(20) Airport Development Aid Program 19 190 NA 190+
(21 ) California Airport Aid Program 2 5 NA 5•
Local 9 500 NA 500+
TOTAL 5 30 5 595 ' NA $ 695+
( 22) TDA Available for 5 s 156 ' 320 ' 476 Transit Streets & Roads
( 23) Further Development State Article X!X-Proo. 5 55 80 145 Transit Guidewny, . ~ i !=::'-
:;?.AND TOTAL ' 1117 ' 7226 s 'l27Q .$15,496 ways
* For caoital exoenditure onlv.
table7-1 7-4
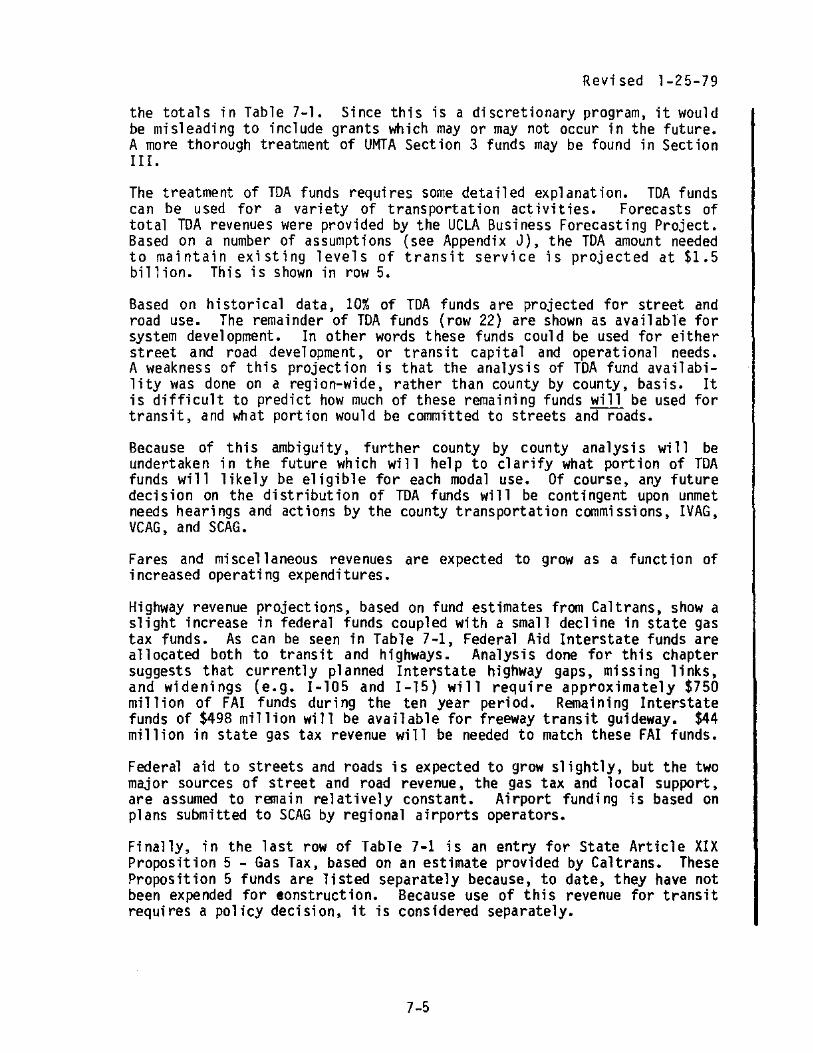
Revised l-25-79
the totals in Table 7-1. Since this is a discretionary program, it would be misleading to include grants which may or may not occur in the future. A more thorough treatment of UMTA Section 3 funds may be found in Section I I I.
The treatment of TDA funds requires some detailed explanation. TDA funds can be used for a variety of transportation activities. Forecasts of total TDA revenues were provided by the UCLA Business Forecasting Project. Based on a number of assumptions (see Appendix J), the TDA amount needed to maintain existing levels of transit service is projected at $1.5 billion. This is shown in row 5.
Based on historical data, 10% of TDA funds are projected for street and road use. The remainder of TOA funds (row 22) are shown as available for system development. In other words these funds could be used for either street and road development, or transit capital and operational needs. A weakness of this projection is that the analysis of TDA fund availability was done on a region-wide, rather than county by county, basis. It is difficult to predict how much of these remaining funds will be used for transit, and what portion would be committed to streets and roads.
Because of this ambiguity, further county by county analysis will be undertaken in the future which will help to clarify what portion of TDA funds will likely be eligible for each modal use. Of course, any future decision on the distribution of TDA funds will be contingent upon unmet needs hearings and actions by the county transportation commissions, IVAG, VCAG, and SCAG.
Fares and miscellaneous revenues are expected to grow as a function of increased operating expenditures.
Highway revenue projections, based on fund estimates from Cal trans, show a slight increase in federal funds coupled with a small decline in state gas tax funds. As can be seen in Table 7-1, Federal Aid Interstate funds are allocated both to transit and highways. Analysis done for this chapter suggests that currently planned Interstate highway gaps, missing links, and widenings (e.g. 1-105 and 1-15) will require approximately $750 million of FAI funds during the ten year period. Remaining Interstate funds of $498 million will be available for freeway transit guideway. $44 million in state gas tax revenue will be needed to match these FAI funds.
Federal aid to streets and roads is expected to grow slightly, but the two major sources of street and road revenue, the gas tax and local support, are assumed to rBllain relatively constant. Airport funding is based on plans submitted to SCAG by regional airports operators.
Finally, in the last row of Table 7-1 is an entry for State Article XIX Proposition 5 - Gas Tax, based on an estimate provided by Caltrans. These Proposition 5 funds are listed separately because, to date, they have not been expended for tonstruction. Because use of this revenue for transit requires a policy decision, it is considered separately.
7-5

TRANSIT
Operations, Short-Range Transit Plans $1742 $2560
Ca. pita 1 , Short-Range Trans f t Plans 437 358
Wilshire RafT line-RTDP Element IV 2ll 106 L.A. Downtown People Mover -
RTOP E1 ement I 11 141 41 Freeway Transit - :tTDP Element II 1 532 Santa Ana Corridor 0 0
TOTAL TRANSIT
HIGHWAYS Pmn-Capftal Capital 731 814 eoperatfonal Improvements
I) - Metered Freeway Ramps* 10 14 ) - Other 147 133 ~) •Rehabfl ftation 133 122
tNew Facil ftfes 521 485 !) - Missing linl:s, gaps,
wfdenings* 'I -Congestion relief
widenings*
TOTAL HIGHWAYS
RIDESHARE
f) Metered Ramp Bypasses* 5 18
TOTAL RIDESHARE
STREETS AND ROADS
i) Maintenance & Administration 1680 2165 ') Capital 722 348
TOTAL STREETS & ROADS
!} AIRPORTS
Capital 695 NA
TDA AVAILABLE FOR FURTHER DEVELOPMENT 139 293 STATE ARTICLE 19 PROPOSITION 5 65 80
GRAND TOTAL
* Capital COst Only
Revised l/25/79
Table 7-2
Funded and Unfunded Costs Transportation System Maintenance and Development
(escalated$ Millions)
$4302 $ 0 I 0 ' 0 $1742
795 0 0 0 437 126 1145 575 1720 1165
182 33 0 34 174 533 0 " 66 1
0 0 331 331 0
1545 0 62 62 731
24 0 0 0 10 280 0 0 0 147 255 0 0 0 133
1006 488 874 1362 1009 1009
0
23 0 0 0 5
3845 0 301 301 1680 1071 191 968 1158 913
695+ 0 NA 0+ 695
432 139} 293) 432)
145 65) 80) 145)
7-6
$2560
358 681
41 598 331
876
14 133 122
1359
""' 91
18
2456 1316
NA
$4302
795 1845
215 599 331
1607
24 280 255
2368 2277
91
23
4146 2229
695+
table 7-2

Revised l-2 5-79
Table 7-2 divides escalated costs for transportation system maintenance and development into funded and unfunded portions. Projected expenditures, escalated at 8% annually, are assumed to be completed no later than fiscal year 1988. Obviously, if some expenditures are delayed until after 1988, lower unfunded amounts during the ten year period will result. HO\;ever, delaying strategies have historically, during times of high inflation, resulted in less real purchasing power. This problem will be exacerbated in the future if revenue increases fai 1 to keep pace with cost increases.
Following is a discussion of the financial implications, by mode, of the figures presented in Table 2.
TRANSIT
The Regional Transportation Plan calls for maintenance and operation of the current transit system, coupled with expansion of service via the feasible Regional Transportation Development Program elements. As a result of Proposition 13, bus fleet expansion is likely to be curtailed. The RTDP, as mentioned in a previous chapter, is now being examined in terms of both a full program and a staged, currently implementable plan.
Transit expenditures for the FY 1979-1983 period are modified from ShortRange Transit Plans (SRTPs) submitted by regional operators prior to passage of Proposition 13. These SRTPs envisioned bus fleet expansion of 450 buses during the five year period, largely in Orange County. It has been assumed that, as a result of Proposition 13, no expansion wiTT occur. Projected costs have been reduced accordingly. Bus expansion is nonetheless a goal of the RTP. Costs for this measure are included in Table 7-3 as an air quality measure.
The costs for elements II, III and IV of the feasible Regional Transit Develop Program are also shown in Table 7-2. Revenues for these three elements fall short of costs by about $2 billion. Hm'lever, this phase is fundable contingent upon:
1. UMTA approval of projects and receipt of UMTA Section 3 funds,
2. Use of all available Proposition 5 funds for RTJ)P projects
.1\lso included in Table 7-2 is the cost of the Santa Ana Corridor transit developments, approximately $300 million.
HIGHWAYS
Highway revenues are projected to remain virtually constant over the ten year period. This is primarily the result of increasingly strict vehicle mileage standards coupled ltith increased travel. It means that non-capital costs (primarily maintenance and administration), which are rapidly growing, ~lill require a larger portion of the total revenues. Therefore, the portion of high\~ay revenues available for nel'/ facilities will dir.lini s h.
7-7
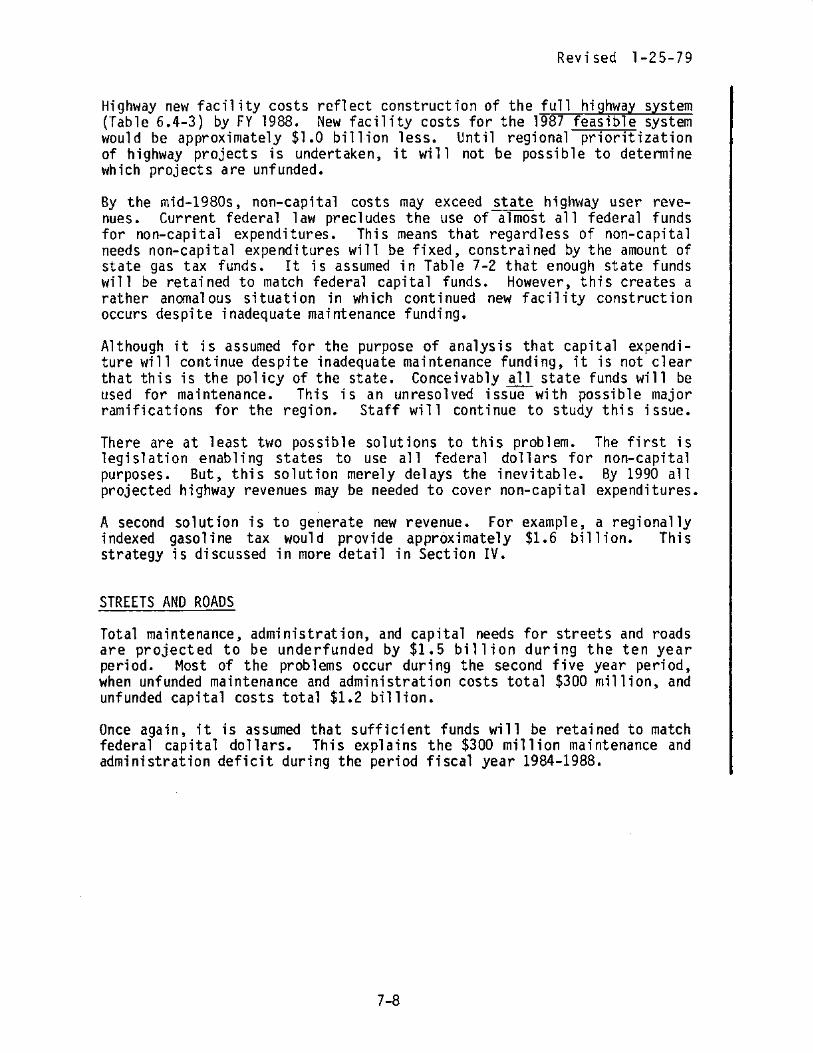
Revised 1-25-79
Highway new facility costs reflect construction of the full highway system (Table 6.4-3) by FY 1988. New facility costs for the 1987 feasible system would be approximately $1.0 billion less. llntil regional prioritization of highway projects is undertaken, it will not be possible to detennine which projects are unfunded.
By the mid-1980s, non-capital costs may exceed state highway user revenues. Current federal law precludes the use of almost all federal funds for non-capital expenditures. This means that regardless of non-capital needs non-capital expenditures will be fixed, constrained by the amount of state gas tax funds. It is assumed in Table 7-2 that enough state funds will be retained to match federal capital funds. However, this creates a rather anomalous situation in which continued new facility construction occurs despite inadequate maintenance funding.
Although it is assumed for the purpose of analysis that capital expenditure will continue despite inadequate maintenance funding, it is not clear that this is the policy of the state. Conceivably all state funds will be used for maintenance. This is an unresolved issue with possible major ramifications for the region. Staff will continue to study this issue.
There are at least two possible solutions to this problem. The first is legislation enabling states to use all federal dollars for non-capital purposes. But, this solution merely delays the inevitable. By 1990 all projected highway revenues may be needed to cover non-capital expenditures.
A second solution is to generate new revenue. For example, a regionally indexed gasoline tax would provide approximately $1.6 billion. This strategy is discussed in more detail in Section IV.
STREETS AND ROADS
Total maintenance, administration, and capital needs for streets and roads are projected to be underfunded by $1.5 billion during the ten year period. Most of the problems occur during the second five year period, when unfunded maintenance and administration costs total $300 million, and unfunded capital costs total $1.2 billion.
Once again, it is assumed that sufficient funds will be retained to match federal capital dollars. This explains the $300 million maintenance and administration deficit during the period fiscal year 1984-1988.
7-8

" f '
ct m
CD
~ LJ
(1 ) H-11 (2) H-13
\'' H-23 4) H-25
( 5) H-34
(61
(1) H-35 (81 H-36 (9) H-62 (lo) H.ug
H-111
H-114
H-118
( l1)
H-1 H-2 H-3 H-4 H-5 H-6
H-7
H-11 H-15 H-16
H-18 H-24 H-34 li-60
12) H-62
H-72 (13) N-13
Tab~-3
Funded and Unfunded Costs: Mobile Source Control Measures (esca Tated $ Ml111 ons)
PUBL_!!: SECTOR DIRECT COSTS
Electrify Rail Yards* $ 0 $ 0 l 0 0 Trip Reductior~ Program 0 0 0 " Increase Bicycle & Pedestrian Facilities TDA 17 27 44 53 Reduce Jet Aircraft Queuir~g Delays 0 0 0 4 Rideshare Program • Park-o-Pool Lots 0 0 0 1 1 Employer/ColllTluter Computer Matching, FAU, Highway User 1 2 1 14
Promotion, Administration* Revenues Trt~ffic Signal Synchronization Highwav User Rev. 19 22 41 57 Volufltary Retirement of Old Cars 0 0 0 75 Marine Vapor Recovery Operations* 0 0 0 0 Transit Improvements Fares 0 150 150 0 Purch~~, of" Gov't Cars for Low Emi~'>inn
and high Fuel Economy Undetermined Reg. Prgm. of lnsp/Maint for Gov't Veh
(Discounts Impact of H-18) Undetermined Non-Recurrent Congestion Relief Savings
TOTAL PUBLIC SECTOR I 37 I 201 I 238 228
PRIVATE/HOUSEHOLD SECTOR DIRECT COSTS
Increased Air Passenger Load Factor Savings
Jet Aircraft Ground Taxi Operation Savings
Triple Trailer Trucking Savin~s
Modified Work Schedules Savings
Carpool Preferential Parking tlo Direct Cost
New General Aviation Aircraft Engine Controls
Emissions Standards for tlew Non-Farm Heavy-Duty Off -Road Vehi c 1 es
Electrify Rail Yards* Emissions Standards for New Farm Equipment Modify Jet Aircraft Engines:
Proposed 1978 Standards Inspection & Maint. of Light-Duty Vehicles Improved Emission Controls for Motor Vehicles Rideshare Program* tlectric Vehicles Marine Vapor Recovery
Operations* Undetermined Improved Trucking Efficiency
Marine Di ese 1 Engine Contro 1 s
TOTAL PRiVATE/KOlisrnurn smutr
• Denotes a tactic which is assumed to be funded jointly by the public and private sectors .
l 14 $ 14 ' ' I 14 $ 14 <3 67 " 43 67 85 138 70 112 182 13 1 7 4 13 17
1 2 I I 2 42 56 15 " 50
114 171 "' 136 212 142 217 75 142 217
25 25 0 25 25 590 590 Q )40 740
$ 1069 $ 1297 $ 265
I 2 $ 17 I 19
0 13 IJ 0 14 " 0 12 12
"' 0 1 °>6 156 "' 361 u::7 1248 < -· 0 4111 401 ~
" "? 123 "' "-0 "' 117 -~ 0 :u 17 N
~ ~
0 ·g 29 .... '"'

Revised 1-2 5-79
Ill. MOBILE SOURCE CONTROL MEASURES
Mobile source transportation control measures are being recommended in the Air Quality Management Plan for the South Coast Air Basin. They are being hi ghl; ghted here because of their importance in making funding decisions. Table 7~3 shaHs escalated mobile source measure costs over two five-year periods, FY 1979 through FY 1983, and FY 1984 through FY 1988. 1t should be noted that costs for several measures -- freeway transit and carpool lanes (H-85), the Wilshire rail line (H~86), the los Angeles Downtown People Mover (H-87), and Congestion Relief Freeway Widenings (H-88) -have already been accounted for in Table 7-2 as system development costs.
The escalated costs for most of the measures in Table 7-3 were developed by:
(1) Dividing current capital costs by the number of years between the beginning of implementation (from Table 5.1-1) and fiscal year 1988, and
(2) Adding that figure to annual operating and maintenance costs, and finally,
(3) Escalating this figure yearly by 8%.
Total public sector costs were broken into funded and unfunded categories. The source of funding for the four partially funded measures -- Increased Bicycle and Pedestrian Facilities (H-23), Rideshare Program (H-34), Traffic Signal Synchronization (H-35), and Transit Improvements (H-89) -is given in the first column.
Over the ten year period, public sector mobile source control measures costs are projected to total $1.5 billion. However, costs for electrification of rail yards (H-11), reduction of jet aircraft queueing delays (H-25), voluntary retirement of old cars (H-36), and marine vapor recovery ope rat ions (H-62) , are not tradi t i ana lly viewed as pub 1 i c transportation costs. Therefore, after deducting costs for these measures, a total of $1.2 bi 11 ion is charged to the RTP for mobile source contra 1 measures. Approximately $1.0 billion of this cost is unfunded. Partially because transit improvements are scheduled to begin at the onset of the second five-year period, over 80% of the unfunded public sector expenditures \till be necessary after FY 1983. Approximately 80% of the $2.3 billion private sector costs are called for after FY 1983.
7-10
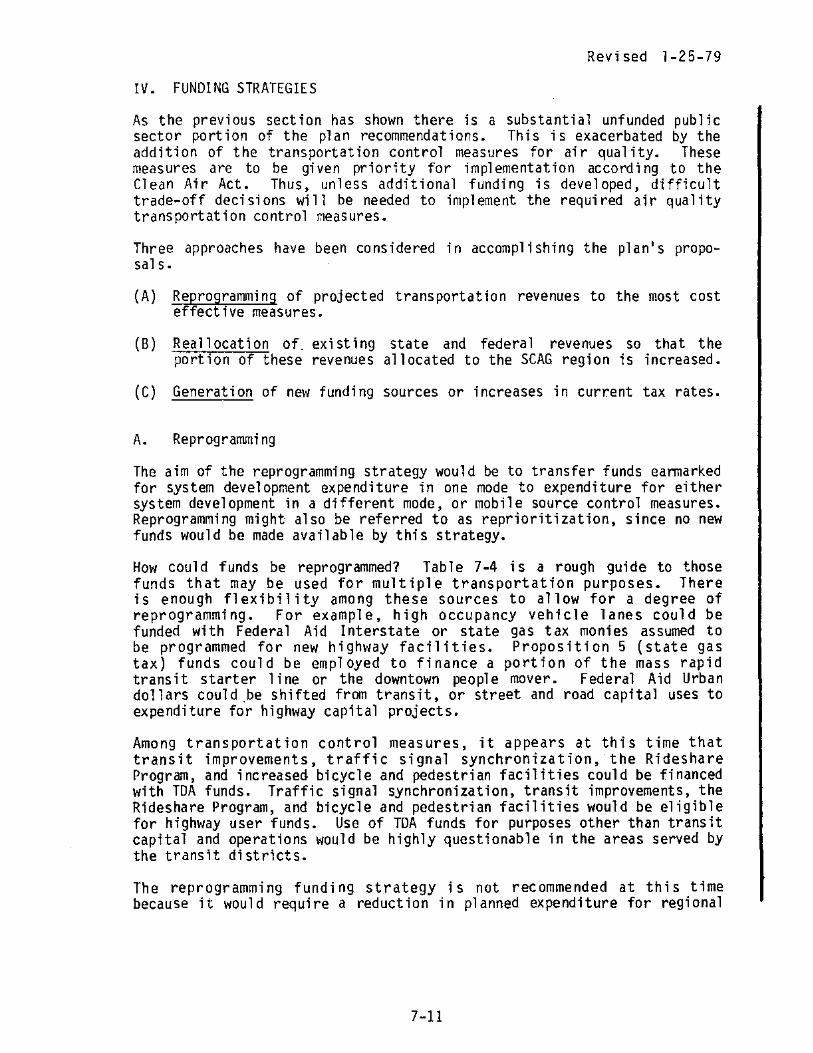
Revised 1-25-79
IV. FUNDING STRATEGIES
As the previous section has shown there is a substantial unfunded public sector portion of the plan recommendations. This is exacerbated by the addition of the transportation control measures for air quality. These measures are to be given priority for implementation according to the Clean Air Act. Thus, unless additional funding is developed, difficult trade-off decisions will be needed to implement the required air quality transportation control measures.
Three approaches have been considered in accomplishing the plan's proposa 1 s.
(A) Reprogramming of projected transportation revenues to the most cost effective measures.
(B) Reallocation of. existing state and federal revenues so that the portion of these revenues allocated to the SCAG region is increased.
(C) Generation of new funding sources or increases in current tax rates.
A. Reprogramming
The aim of the reprogramming strategy would be to transfer funds eannarked for system development expenditure in one mode to expenditure for either system development in a different mode, or mobile source control measures. Reprogramming might also be referred to as reprioritization, since no new funds would be made available by this strategy.
How could funds be reprogrammed? Table 7-4 is a rough guide to those funds that may be used for multiple transportation purposes. There is enough flexibility among these sources to allow for a degree of reprogramming. For example, high occupancy vehicle lanes could be funded with Federal Aid Interstate or state gas tax monies assumed to be programmed for new highway facilities. Proposition 5 (state gas tax) funds could be employed to finance a portion of the mass rapid transit starter line or the downtown people mover. Federal Aid Urban dollars could .be shifted from transit, or street and road capital uses to expenditure for highway capital projects.
Among transportation control measures, it appears at this time that transit improvements, traffic signal synchronization, the Rideshare Program, and increased bicycle and pedestrian facilities could be financed with TDA funds. Traffic signal synchronization. transit improvements, the Rideshare Program, and bicycle and pedestrian facilities would be eligible for highway user funds. Use of TDA funds for purposes other than transit capital and operations ~'/auld be highly questionable in the areas served by the transit districts.
The reprogramming funding strategy is not recommended at this time because it would require a reduction in planned expenditure for regional
7-11

Revised 1-25-79
transportation maintenance and development. If, however, other funding strategies fail it may become necessary to use reprogramming as a method for funding.
B. Reallocation
Table 7-5 shows three existing sources of revenue - highway user funds, UMTA Section 3 and state sales tax - from which the SCAG region might reasonably expect a greater allocation. The first, increased state highway capital expenditure, is based on the expectation that the SCAG region should receive an increased percentage of state and federal highway capital expenditures.
For example, a SCAG document entitled State Highway Expenditures, 1967-1976 states that during that ten year period the SCAG region provided 50% Ofall highway user revenues collected in the state. During the same period only 40% of highway capital expenditures statewide, and 30% of highway maintenance expenditures were made in the SCAG region. Had the region received 50% of statewide capital expenditures alone, an additional $700 million would have been expended in the region.
Perhaps it is clearer to state the concept of fair share in tenns of the percentage of tax dollars returned to the region.
Currently, approximately 55 cents of each highway user tax dollar collected in the SCAG region is spent here. As Table 7-5 illustrates, increasing this return to 75 cents would result in more than one billion dollars of additional expenditures in the region between now and !988.
Such an increased return would require not only a reallocation of funds within the state, but also an increased return of highway user revenues to the state for the federal government. Approximately 75% of al 1 highway user revenues generated in the state are currently returned. This policy would require a return of about 95% to the state.
UMTA Section 3 is a federal program which provides discretionary funds for transit capital projects on an 80/20 matching basis. The figures in Table 5 assume that those transit capital projects eligible for UMTA Section 3 funds will be funded at the 80% level. An allocation of Section 3 funds at the level specified in Table 7-5 would require that 10-15% of all UMTA funds distributed nationwide during that time period be allocated to the SCAG region.
Sales tax revenues could be reallocated from the state to the region in order to finance the Regional Transportation Plan. Assuming that the highway user revenue and UMTA Section 3 reallocations are fully successful, a reallocation of approximately one half cent per dollar of sales tax would be required to finance the remainder of the RTP. In other words, currently one fourth cent of the six cent sales tax is retained in the region for transportation expenditure, while five and three fourths cents is used for other purposes. This strategy would result in three fourths cent being retained for transportation and five and one quarter cents being used elsewhere.
7-12
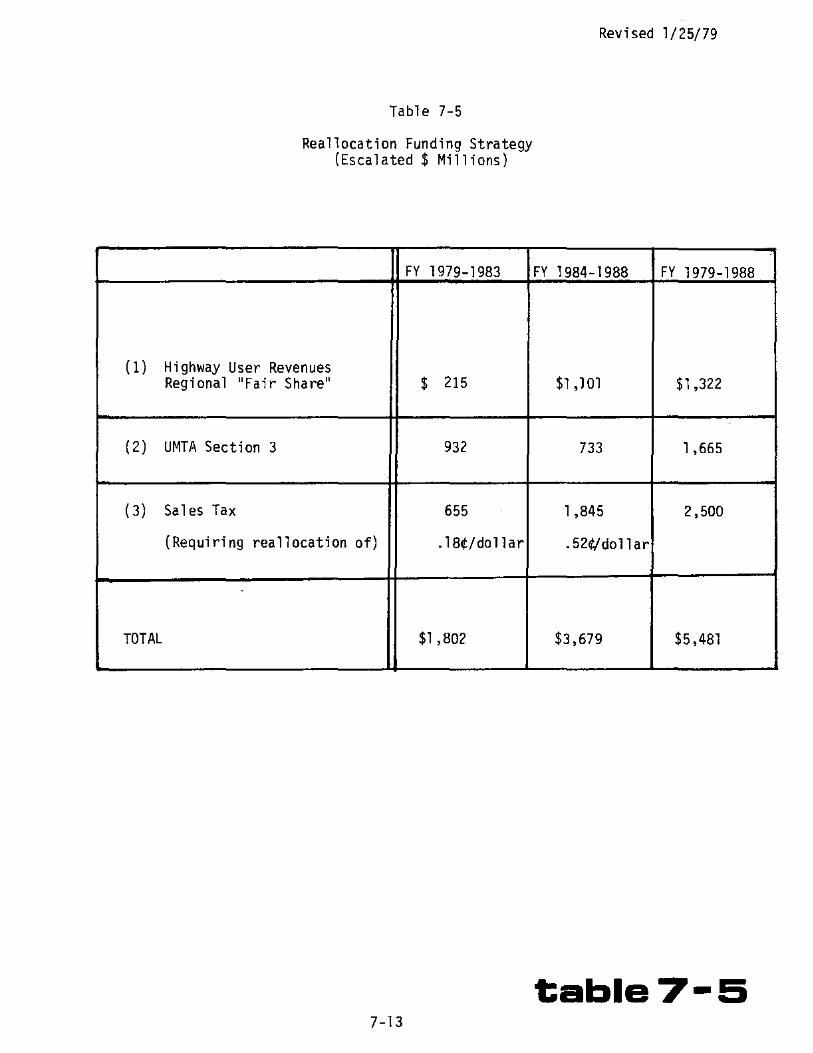
( 1)
( 2)
( 3)
TOTAL
Table 7-5
Reallocation Funding Strategy (Escalated$ Millions)
FY 1979-1983
Highway User Revenues Regional "Fair Share" $ 215
UMTA Section 3 932
Sa 1 es Tax 655
{Requiring reallocation of) .18¢/dollar
$1 ,802
7-13
Revised l/25/79
FY 1984-1988 FY 1979-1988
$1 ,101 $1 ,322
733 1 ,665
1 ,845 2,500
.52¢/dollar
$3,679 $5,481
table7-5

$400
350
300
250
200
150
100
50
0 • FY 72
FY 73
•
Figure 7-2
Historical Expenditures for State Highways in the SCAG Region
(Millions of Constant 1972 Dollars)
.... .... construction
..... ......
......
Revised l/25/79
...... .......
.......
• •---..:t. f.--<··--------·--·----'~" Maintenance
FY 74
FY 75
FY 76
FY 77
FY 78
FY 79
FY 80
FY 81
FY 82
Source: State Highway Program Financial and Statistical Reports, FY 1977, CALTRANS, and California Highway Construction Cost Index, CALTRANS.
7-13A figure 7-2

Revised 1-25-79
C. Generation of Additional Sources of Funds
A final strategy for financing the Regional Transportation Plan is generation of new funds via a tax rate increase{s) or imposition of a new tax(es).
Table 7-6 indicates what each of a series of different tax rate increases would have to be in order to fund the unfunded portion of the RTP. The top portion of the table shows the tax rate increases needed to finance the public sector gap assuming that UMTA Section 3 and highway user funds are successfully reallocated. The bottom portion of Table 6 indicates tax rate increases required to fund the entire unfunded portion of the RTP (i.e., none of the reallocation strategy is successful).
The first column in Table 7-6, FY 79-83, lists the rate increase required during that period. (The emissions tax and parking surcharge would be new taxes rather than tax increases.) The second column displays the additional tax required to fund measures during the FY 1984-1988 period. For example, in the top portion of the table (assuming successful reallocation) the sales tax would need to be increased immediately to 6.18% and would be increased to 6.51% in fiscal year 1984 in order to finance the gap.
Among the five potential tax sources, the sales tax and the gasoline tax are familiar rneans of revenue collection. A regional gasoline tax merely implies that any tax increase would be applied regionally rather than statewide, with additional revenues returned to the SCAG region. An indexed regional gasoline tax would link tax increases to some price index - wholesale, consumer, or possibly highway construction. For example, if prices increased by 8% in the first year of indexing, the state gas tax of 7 cents per gallon would also increase by 8%, to 7.6 cents per gallon.
An indexed gasoline tax is justified on the basis of the dwindling purchasing power of highway expenditure dollars. Figure 7-2 illustrates the decline of highway expenditures, in constant 1972 dollars, in the SCAG region. It s haws that wh 11 e maintenance expenditures have been increasing slightly in real dollars, real capital expenditures have plummeted. During the period 1972 to the first quarter of 1978, the cost of highway construction has skyrocketed by nearly 100%! Gas tax indexing would prevent the continued erosion of purchasing povmr in the future.
The emissions tax and parking surcharge are new taxes that have been frequently discussed in recent years. The forrner would probably be collected in conjunction with a vehicle inspection and maintenance program, with the charge based on a combination of vehicle miles traveled and emissions. The latter would be just what its name implies - an additional charge added to the normal price of parking a vehicle.
7-14

Revised l /25/79
Table 7-6
Potential Funding Sources and Tax Rate Increases
FY 1979-1983 FY 1984-1988
Public Sector Revenue Gap Assuming $655 million $1845 million Reallocation of UMTA Section 3 and State Highway Revenue
Potential Tax Sources Rate Increase !Additional! Rate Increase
a. Sales Tax £cents)
.l /Dollar ~centsj
. 3/Dol ar or b. Local Gasoline Tax 2.6 /Gallon 7.4 /Gallon or c. Errmi ssions Tax . 23/VMT .65/VMT or d. Parking Surcharge ~0/Park 55/Park or e. Indexed Regional Gas Tax 12%/Year
Total Public Sector Revenue Gap $1802 million $3679 million
Potential Tax Sources (cents) (cents)
a. Sales Tax .51/Dollar .66/Dollar or b. Local Gasoline Tax 7.2 /Gallon 14.7 /Gallon or c. Emmissions Tax .6 /VMT 1.3 /VMT or d. Parking Surcharge 55/Park ll 0/Park or e. Indexed Regional Gas Tax 20%/Year
7-15 table7-B

Revised 1-25-79
Evaluation of revenue generating measures should be done on the basis of numerous criteria including economic efficiency and equity, political and administrative feasibility, and amount of revenue generated. Preliminary analysis has indicated the following:
(1) The emissions tax, parking surcharge and to a lesser extent, both gasoline tax schemes serve the dual role of discouraging emissions while raising revenue for the public sector. Fran an economic efficiency standpoint these measures are desirable because those who pollute are forced to pay a greater portion of the social costs they create.
(2) The source which appears inequitable on ability-to-pay grounds is the emissions tax. The older car is generally owned by lower income persons who would be least able to pay a higher tax.
{3) On admi ni strat ive as well as po 1 it i ca 1 grounds the two taxes already in existence, the gas tax and the sales tax, are more easily justified because:
a. Increases in rates would not entail major administrative start-up costs, and,
b. The political difficulties assodated with instituting a totally new tax would be avoided.
(4) The sales tax and indexed gasoline tax would be most likely to provide a revenue base which would keep pace with future cost increases.
CONCLUSIONS
This analysis has shown that during the next ten years a m1n1mum of $15.5 billion dollars will be available for public expenditure on transportation in this region. This amount fonns the basis for the constrained, or funded portion of the Regional Transportation Plan, shown in Tables 7-2 and 7-3. In addition, the plan calls for other public sector expenditures of $5.5 billion l'lhich are unfunded with projected available revenues. Included in this total is $1.0 billion in unfunded mobile source control measures, and $4.5 billion in system development projects.
Based on the discussion in Section IV concerning funding strategies, the following combination of tax increases and reallocations of currently unavailable funds is recommended to finance mobi 1 e source control measures, and transportation system development projects.
(1) 2 Cent Local Tax Increase and Statewide. Indexing of the Gas Tax - The RTP calls for an increase of the gas tax by two cents per gallon, returned to local governments. This measure would generate approximately $100 million yearly. It is also recommended that the gasoline tax be 1 inked to some price index so as to keep pace with rising transportation costs. If the price index used is assumed to escalate by 8% yearly, an indexed regional gasoline tax begun in fiscal year 1980 would generate an additional $1.6 billion in revenue by fiscal year 1988. An indexed gas tax would continue to generate more than $300 million additional dollars yearly for the region after 1988.
7-16

Table 7-7
Financially Balanced Plan (escalated$ Billions)
Unfunded Costs
Mobile Source Control Measures*
Transportation System Development
Total Regional Transportation Plan
Revenues
2¢ Local Gasoline Tax Increase and Indexed Regional Gas Tax
Reallocation:
Highway User Funds
UMTA Section 3
Remaining Unfunded Costs
FY 1979-83
. 1
1 . 7
1.8
. 7
.2
.9
1.8
0
FY 1984 88
.9
2.8
3.7
1.8
1.1
.8
3.7
0
*Excludes Railyard electrification, reduced jet aircraft delays, voluntary car retirement, and marine vapor recovery operations. These are not considered to be traditional transportation costs.
Revised 1/25/79
FY 1979-88
1.0
4. 5
5.5
2.5
1.3
1.7
5. 5
0
7-17 table7-7

(2)
Revised 1-25-79
Reallocation of Highway User Revenues and UMTA Section 3 Funds to tfie SCAG Region. As mentioned earlier, a "fair share" return of highway capital funds, and maximum federal contribution for transit capital projects would channel approximately $3.0 billion into the SCAG region during the next ten years.
Table 7-7 displays a plan which is not only balanced financially, but which is also balanced in another, possibly more important way. It calls for a balanced effort by various groups to make the Regional Transportation Plan a reality. It calls for sacrifice by the private sector in the form of mobile source measure implementation. It calls for sacrifice by the general public within the SCAG region in the form of modestly increased gas tax contributions. Finally, it calls for sacrifice by geographic areas outside of the Southern California region, both inside and outside the state, in the form of increased return of tax dollars to the region via highway capital expenditures and UMTA capital grants.
7-18

Revised 1-25-79
5.0 Financial Actions
Multi-modal
1. SCAG urges the State Legislature to amend the TDA to relax restrictions (such as the 50% limitation, the maintenance of local effort requirement, and the 15% capital expenditure requirement) which limit the amount of funds a claimant may utilize for transit purposes.
2. SCAG supports legislation and amendments to Article 19 of the State Constitution, which would remove the "guideway" transit constraint and allow highway user revenues to be allocated for any type of transportation without percentage limitations.
3. SCAG urges the State Legislature to enact legislation to provide $25 million for the first year funding of an Old Car Fund and Used Car Dealer Credit. In addition, the Department of Motor Vehicles should increase registration fees for out-of-state veh i c 1 es over ten years old and establish a nominal registration fee in lieu of tax for the change of ownership of vehicles purchased to replace vehicles sold to the State under the program.
4. SCAG supports a 2-cent-per-gallon gasoline tax increase, with the funds to be returned directly to local governments for transportation purposes. Also, SCAG encourages the State Legislature to initiate necessary action to allow annual indexing of the gasoline tax in the SCAG region (A standard index such as the Consumer Price Index or Highway Construction Cost Index should be selected as a basis to keep revenues in pace with increasing prices).
Aviation
5. SCAG will seek methods for spreading the financial burden of constructing any major new general aviation facility among all areas in the region to be served by that facility.
7-19

Revised 1-25-79
Transit
6. SCAG will encourage increased efficiency of transit operations by development and implementation of transit efficiency standards, allocation incentives, and improved data gathering and analysis capabilities.
7. SCAG and the CTCs will encourage transit operators to establish a desired ratio of fares to subsidy. As costs increase over time, it is necessary for financial stability, that either a) this relative level be maintained through periodic review and increase of fares or
-b) the subsidy share of total costs be increased by increasing taxes.
8. SCAG and the appropriate CTCs will allocate available Section 5 funds within the los Angeles-Long Beach urbanized area ~ for operating assistance requirements.
9. SCAG will take the necessary united action to ensure the availability of Section 3 funds to meet all reasonable capital requirements as approved in the Regional Short Range Transit Plan.
10. SCAG, the CTCs and the transit operators will seek increased funding for transit operations.
11. SCAG the CTCs and the transit operators will make every effort to maximize the use of available federal transportation grants to support transit system operating costs and capital improvements.
12. SCAG and the CTCs will encourage local governments to use Federal Revenue Sharing funds for transit.
13. SCAG, the CTCs and the transit opertors wi11 seek necessary legislation and constitutional changes to facilitate implementation of value capture financing mechanisms by transit districts.
7-20

Revised 1-25-79
14. SCAG will examine more closely the possibility of utilizing loan financing as a means to fund transit improvements.
15. SCAG urges the State Legislature to amend the Transportation Development Act to allow a new category of claims to be filed by existing claimants to implement public transportation control measures to improve air quality, such as ridesharing programs, where such transportation control measures have been identified by the designated Regional Transportation Planning Agency through the Regional Transportation Plan.
16. SCAG will actively seek operating and capital funds to place in express service approximately 1000 high capacity buses to provi_de a high level of bus rapid transit over the regional freeway network.
17. SCAG wi 11 active 1 y seek operating and capita 1 funding to support expansion of local transit service as identified in the SRTP expansion plans.
Highways
18. SCAG wi 11 urge the state and region to take the necessary steps to allow federal highway dollars to be used for maintenance when circumstances demand such flexibility.
19. SCAG and the CTC's will urge the State Legislature to initiate necessary action to all ow a greater return of highway user funds within the State to the region in which such funds are generated.
20. Although it would be more appropriate for increases in gasoline taxes to be levied by state governments, it is possible that federal action may result in imposition of an additional gas tax. SCAG will oppose imposition of any federal tax from which revenues are not retained in the region for public transportation or highway purposes. Federal and state efforts to increase gasoline taxes should be coordinated to avoid simultaneous imposition of taxes on the SCAG region.
21. SCAG and the CTC • s wi 11 urge the state to seek a greater return on our federal highway user taxes than the present 75%.
22. SCAG, the CTC's and Caltrans will take all necessary steps to ensure adequate funding of maintenance, rehabi 1 it at ion, safety, and operational improvements on the existing highway system.
7-21

Revised 1-25-79
23. SCAG, in cooperation with CTCs and implementing agencies, will investigate additional funding for signal synchronization and prepare necessary recommendations to obtain such funding.
24. The SCAQMD and ARB should seek private-sector funding of the program for voluntary retirement of older vehicles, and allow it as a stationary-source offset action.
25. SCAG recommends that the state and federal governments consider ·a tax credit or tax deduction for low-income individuals to mitigate the vehicle maintenance costs attributable to a mandatory inspection and maintenance program.
7-22

Revised 1-25-79
7 .A INSTITUTIONAL ARRANGEMENTS
In the Southern California region there are a number of state and local government agencies involved in transportation activities. The large number of agencies involved, result in a complex set of interrelationships and procedures for transportation planning, programming, and implementation. These interrelationships are identified in Table 7.1A-l.
A brief survey of the roles and authorities of agencies at each level of government is helpful to understanding the transportation planning and implementation process in this region.
7.IA FEDERAL
Under the Department of Transportation, the Federal Highway Administration (FHWA), Urban Mass Transportation Administration {UMTA), and Federal Aviation Administration (FAA) each fund planning efforts and projects and have established rules and regulations for their programs based on the enabling legislation.
Funds made available for planning are programmed through the regional Overall Work Program (OWP) which documents specific work tasks, dollars to be used on them and which state, regional or local agency will actually complete the work. Included in the OWP are: specific tasks required to maintain the certification of the area so that project funds are available. Examples of the required tasks are development of a regional transportation plan and short range transit plans. These plans become the basis for programming specific projects and justifying their construction.
Of particular interest to state and local agencies are federal requirements for eligibility for the various projects, programs and any formulas or guidelines they use in allocating the funds. While some of these provisions are found in the law. others are left to the discretion of the agency. In addition, agency procecures shape the implementation process.
While federal funding agencies are not involved in the actual construction of projects, they do oversee implementation by local and state agencies. Agency approval must be obtained at varying project phases with final funding for the project available only after satisfactory completion according to agency standards.
Federal law requires that environmental impact analyses be conducted on all projects with the potential of affecting the environment. These documents are reviewed by the funding agency and Environmental Protection Agency as part of the funding approval process. An incomplete or inaccurate document, or one which shows unmitigated negative impacts on the environment can be the basis for denial of project funds.
In addition, under the Clean Air Act Amendments of 1977, standards for air quality have been established. The EPA has named programs for improving air quality. Such programs must be tied to the transportation systems of
7A-I

Fed~
FHWA 1,2,5,6, 7. 3
UMT.I\ - 1,2,5,6, 7. 8
FAA - 1,2,5,6, 7. 8
EPA 3, 5, 5
0~18 4. 5
HUD 1,5,7,8
KEH 1. 2' 4. 5, 7, G. 9
JPG - 4
Federal Peqional Council - 4. 5
Corps nf Engineers - 9
r; v i1 Aeronautics Board - 9
Conqress-rr;en - l . 2' 5,
I 6
-State
Governor's Office 4' 3
Office of PlanninQ and Research 3, 4 .. 5
Caltrans 6,7,8,9, 11' 12
State Air· Resources Board - 4. 5
California Transportation Co1m1ission - 4,5,6,7,
15' 16
Department of Finance 15
Coastal Commission 4, J' 6'
11
D~1V 14
CHP 14
Ener')y Resources Conservation and Development Commission 5 , II
Department of Rehabilitation 4. 9
Public Utilities Commission - 6. 9
Le~islators - 1 ' 2' J'
16
SC/\G _;;
;, I.J, 5, 7, a, 9, lL 17
Regiona 1/Loca 1 Regional/Local
6 Counties - 1,2,4,5, FAU Committees- 4, 5, 7, 3 6, 8, 9, 10, 11, 12, 14, Area Agencies 15, 16, 18 on Aging - 4,5,7.0,
131 Cities- 1,2,4,5, 9, 11
6, 9, 10, Community 11, 12, 14, Action 15, 16, 1B ,\gene i es - 4,5,7,0,
County g. 11.
Transportation 4, 5, 7, 11, Developmental comissions 13, 15 Llisabilities Area
"hnning Board 9' 17 SAt'IBAG - 3,4,5,7,8,
~' 11' 13 Other COG's 3, 4' 5' 7,
!VAG - 3,4,5,7,9, 8, 9, 11. 17
11' 13 Corrmunity Redevelo~ment
VCAG - 3,4,5,7,8, Agencies - l ' 2' 4, ~, y, 11 ' 13 9 , 11
CVAG - 3, 4' 5' 7' Coastal Zone 9, 11, 13 Corrmission5 - 3, 4' 3, 6,
Special 1,2,5,6, 11
8i;tricts 9, 11 Citizens
SCRTD - 1' 2' 5, 9, 10 COillfili ttees 17
OCTO - 1,2,5,9,10 Special Interest Groups - 9. I.'
~·1unicipJ1 Profession~]
Transit 1, ;>, ''• 9,'10 Associations 9. 17 Operators
Airp< rt 1' 2' 4, 5, 6' Operators 9, 18
Airline Operators l' 2' 10
Air Quality 1 ' 3 ' c S, 6, !1aintenance 9, 1 I, 11 r:~~.t~icts -
T-Jble 7.1~--
K.ey_
1) Funding source for planning 2) Capital/operational fundin~
source 3) En vi ronmenta 1 qua I i ty review
agency 4) Coordi native/ administrative
agency 5) Policy and priority setting
agency/individuals 6) Regulatory agency 7) Grant/project review agen~y 8) Grant program administrator g) Source of technical expertise
10) Transit operator 11) Planning agency 12} Highway/road construction
agency 13) Subregional agency 14) Enforcement agency 15) Fiscal review agency 16) Appropriations agency 17) Advice, informal input 1.:!) Airport/airline operator
table 7.1A-1
J,<TERRELATJONSn!PS BEHICt:N SCA\, A.'l.J OT:-~.OR rf\,<l'iShJ.<i,\TiGH RELATEl! ,%UiCI[~
Revised 1-25-79
these areas and will govern their development. The SCAG region, wi-th the exception of the far eastern desert portions of Riverside and San Bernardino Counties, is a non-attainment area. Therefore, a major area of emphasis of our transportation planning work will be directed towards meeting these c 1 ean air standards. The South Coast Air Basin, because of its severe air quality problems, is the main initial focus of these activities.
7.2A STATE
Transportation Planning, programming and implementation procedures at the state level were revised under AB 402 of 1977, providing an opportunity for local and regional agencies to join a partnership with the state.
7.2.!A CALIFORNIA TRANSPORTATION C014MISSION
AB 402 established the California Transportation Commission which assumes the responsibilities of four past boards: The California Highway Commission, State Transportation Board, California Toll Bridge Authority, and the State Aeronautics Board. The Commission has both planning and programming responsibilities. It is responsible for developing a biennial report on transportation to the legislature which serves as a California Transportation Plan. It will include an evaluation of significant transportation issues, an overview of necessary future investments, and recommendations for allocation formulas for highway funds. The state plan will consider all adopted regional transportation plans and long range issues, such as energy, which affect trans port at ion.
The Commission has considerable authority in the regional and statewide programming of projects. It detennines an estimate of state and federal revenues available to local, regional and state agencies under several funding programs including all state and federal highway funds processed through the state highway account, Propositi on 5 diversion trans it projects, capital improvements under the State Aeronautics Account, and Toll Bridge Authority funds. Local, regional and state agencies must be consistent with these estimates in their programming of projects.
A specific procedure and time-table are established for development of local, regional and state TIP 1 s. The California Commission receives regional TIP 1 s from throughout the state and a proposed TIP from Caltrans. The regional TIP•s are consolidated into a state TIP unless one of three findings is made: overriding statewide significance, insufficient funds, or a conflict between regional TIP 1 s. In the case of one of these findings, a regional TIP project can be dropped or a different project added. Once the statewide TIP is adopted by the Commission, it is implemented by all related state, regional, and local agencies.
7A-3

Revised 1-25-79
7.2.2A Department of Transportation Another principal actor on the state level is the Department of Transportation (Caltrans). Caltrans has planning, programming and implementation responsibilities, particularly for the state highway system. The department is a planning agency in that it studies long and short range needs for transportation in the state and proposes means of meeting those needs. It coordinates and develops research programs on tranportation issues of statewide concern. It is a programming agency in that it develops a proposed statewide TIP for submittal to the California Transportation Commission. It also estimates the funds available for TIP preparation and supplies this revenue estimate to the Commission for its final action.
Caltrans' role as an implementing agency gives it additional authority in the programming area. Caltrans has considerable control over the scheduling and completion of any work on state highways. Also through delegation by the Federal Highway Administration, Caltrans is involved in processing and approving local grant applications under federal highway programs. In Riverside-San Bernardino, Oxnard-Ventura-Thousand Oaks, and Simi Valley urbanized areas Caltrans has been named the designated recipient for UMTA Section 5 funds, giving it the responsibility of administering these transit funds. Caltrans also administers UMTA special funds for elderly and handicapped transit, as well as special bicycle funds.
7.2.3A State Air Resources Board
The Air Resources Board (ARB) is designated the state air pollution control agency for all purposes set forth in federal law. Under its mandate, the ARB ·is responsible for setting ambient air and vehicle emission standards and for administering Federal and State requirements. The ARB also reviews and comments on a multitude of programs which are not solely or primarily related to air quality. For example, the ARB reviews Regional Transportation Plans, and Environmental Impact Reports and Statements on projects of major significance.
The ARB is designated the State agency responsible for the preparation of the State Implementation Plan required by the Clean Air Act. Under the lewis Act, the ARB shall approve the Air Quality Management Plan unless it finds, after public hearing, that the plan does not include all reasonable and available methods to achieve and maintain the State ambient air quality standards. Upon such a finding, the ARB shall revise the submitted plan and approve it by June 1, 1979.
7.2.4A State Office of Planning and Research
The State Office of Planning and Research is involved in transportation development through two channels. First is any statewide development or land use policies it adopts, such as those incorporated in the State Urban Development Strategy. The second is through its role as the statewide clearinghouse for review of Federal Grant Applications. OPR comments on the conformance of potential projects with statewide policies and their potential impact on the environment.
7A-4

7.3.A REGIONAL
Revised 1-25-79
In this region, SCAG is the principal agency involved in transportation activities. Others include the South Coast Air Quality Management District, which is concerned with transportation as it affects air quality, and the South Coast and South Central Coastal Commissions which govern development in the coastal areas. As recommended by the Governor, SCAG has been designated by the federal Department of Transportation as the Metropolitan Planning Organization {MPO) for this region. Under this designation, SCAG serves as the coordinating and approval agency for all transportation planning undertaken with federal funds. SCAG passes through much of these federal funds to local agencies in the region which in turn complete studies and plans for local and regional transportation development.
As the MPO, SCAG is also responsible for a regional transportation plan (RTP). This requirement is similar to that under state law {AB 402) where SCAG has been designated Regional Transportation Planning Agency. As a part of the federally-required RTP, SCAG incorporates trans it operators' plans in the transportation system management and long range transit elements of the RTP. The RTP also includes major components on highways, aviation, and goods movement, in response to Federal and State mandates. Transportation strategies for improving air quality are also being developed jointly with the South Coast Air Quality Management District for incorporation in the RTP.
The adopted regional transportation plan serves as the policy basis for all transportation programming in the region, and in particular for the transportation improvement program {TIP) required under both federal regulations and state law (AB 1246/ AB 402). While there are different requirements for the state and federal TIP's, SCAG wlll prepare one consolidated TIP containing all required data. Essentially it will include all transportation projects for which local and state agencies seek federal or state funds. The California Transportation Commission has authority over projects funded from those moneys under lts jurisdiction (as previously discussed) and the federal agencies will have authority over projects funded from federal dollars, except those funds under the jurisdiction of the California Transportation Commission.
Under state law, SCAG bases its TIP for the four county transportation commission counties (los Angeles, Orange, Riverside, San Bernardino) on TIP's submitted to it by the commissions. {SCAG has also agreed to accept county TIP submittals from IVAG and VCAG for their respective jurisdictions.) SCAG may revise these commissions' TIP's in certain instances. The entire regional TIP must be consistent with the RTP.
Consolidated into the TIP-approval process are SCAG' s A-95 Clearinghouse responsibilities. SCAG is designated by the Governor on behalf of the federal Office of Management and Budget to review all federally-funded projects for consistency with regional plans and policies, for their environmental impacts, and to give to give interested agencies and parties notice of these proposed projects. SCAG then forwards comments it has and those it receives from concerned agencies to the project sponsor and funding agency for their use in detennining whether to fund the project.
7A-5

Revised 1-25-79
As state-designated Regional Transportation Planning Agency, SCAG administers the Transportation Development Act funds {sales tax funds available for transit, road, bicycle/pedestrian projects}. As in the case of the TIP, SCAG bases its approval of projects under these funds in the four commission counties on lists of projects submitted to it from the commissions. These lists can be revised if they are inconsistent with the plan or are an inappropriate use of funds under the law. In Ventura and Imperial Counties, IVAG and VCAG recommend projects for approval. SCAG has a further responsibility to detennine whether a portion of the TDA funds will be used for bicycle/pedestrian projects and, jointly with the commissions in Los Angeles and Orange Counties, if a portion of the funds will be available for community level transit projects.
SCAG is also the designated recipient for UMTA Section 5 funds for transit projects in the Los Angeles-Long Beach Urbanized Area. It detennines policies for use of these funds, and allocates the funds among the thr~ counties in that urbanized area. Again, state law provides for the county transportation commissions to allocate the funds within their counties with SCAG's final approval through the TIP.
SCAG is also responsible for the Federal Aid Urban Program for urbanized areas over 50,000 in population. SCAG approves the programming for these do 11 ars, the system of roads, and the urban area boundaries based on approvals received from the four county commissions and VCAG.
SCAG is not an implementing agency per se. It relies on its counties and cities, transit and airports operators, Caltrans and other operating agencies to implement mutually developed policies and plans. SCAG serves only as initiator and coordinator of programs to implements its policies.
7.4A LOCAL AGENCIES
There are a number of local agencies involved in transportation efforts in the SCAG region. Four groups of agencies have predominant roles: county transportation commissions, designated subregional agencies, cities and counties, and transit and airport operators. The planning, programming and implementation responsibilities of each are as follows:
7 .4.1A County Transportation Commissions
County Transportation Commissions were established in 1977 in Los Angeles, Orange, Riverside and San Bernardino Counties by AB 1246. These commissions set policies for and coordinate transportation development in their respective counties. They are given decision-making authority over short-range capital and service planning and programming for transit and highway projects. This includes the allocation of federal and state project funds within their county areas and establishment of priorities for project implementation.
7A-6

Revised 1-25-79
Each county commission has requested that SCAG designate it to coordinate transportation planning in its county. This involves a role for them in the Overall Work Program process. In most cases the commission delegates the planning responsibilities to other agencies such as the county or transit operators while overseeing their efforts and consolidating their work into a county-wide short range transportation plan and other related products.
The commissions have numerous programming responsibilities. They compile a county-wide TIP for submittal to SCAG as a part of the regional TIP. They allocate TDA transit and bicycle/pedestrian funds in their counties and jointly decide with SCAG if a portion of these funds should be available for Article 4.5 community level transit projects. The commissions develop service and productivity improvements to transit operators within their counties and make performance audits of the operators. They also allocate FAU and UMTA Section 5 funds among their jurisdictions. As in the case of SCAG, the commissions use the programming of these funds to implement policies they have adopted for transportation developr:~ent. All federally and state funded projects they approve must also be consistent with the regional transportation plan.
As in the case of SCAG, the commissions are not implementing agencies themselves. But to the degree that they set transportation priorities and program funds, they guide local agencies and Caltrans in their implementation process.
The los Ange 1 es Commission is given two add it iona 1 notab 1 e authorities. One is to place a sales tax measure on the ballot to generate revenues for transit purposes. Second is to report to the legislature on the status of transportation planning and programming in the county and to recommend any changes necessary to improve them.
With the growing importance of the transportation system in improving air quality, the commissions are becoming more active in this field as well. The San Bernardino Commission, for example, is also serving as the Air Quality Coordinating Committee for that county.
7.4.2A Designated Subregional Agencies
In the two counties where transportation commissions do not exist (Imperial and Ventura), SCAG has designated subregional transportation planning agencies to assume similar responsibilities. In Ventura County this agency is the Ventura County Association of Governments; in Imperial County it is the Imperial Valley Association of Governments. These agencies coordinate their counties• planning tasks under the Overall Work Program.
Each of these agencies is i nvo 1 ved in programming activities for their counties such as review of TDA and FAU projects. While these agencies do not have the legal authorities of the four commissions, SCAG looks to them as the decision-making bodies in their counties. SCAG depends on them for input on issues affecting their areas and jointly sponsors hearings and workshops on such topics as the regional transportation plan and um~et trans it needs.
7A-7

Revised 1-25-79
7.4.3A Cities and Counties
Cities and counties have a primary role in planning and implementing Southern California's transportation system. Local jurisdictions are required by state law to develop local circulation elements. These elements should be consistent with countywide and regional transportation plans. They are the initiating agencies for most highway and transit projects. They are also the implementing agencies for these projects. Locally elected officials also comprise the governing boards of many other transportation agencies such as county transportation commissions, other designated subregional agencies such as IVAG and VCAG, transit and airport boards and joint powers entities (such as airport land-use commissions), and the SCAG governing bodies.
Subregional air quality planning agencies have been designated by SCAG to prepare p 1 ans i dent ifyi ng measures or po 1 i ci es to improve air qua 1 ity in their jurisdictions. Los Angeles, Orange, Riverside, and San Bernardino Counties and the City of Los Angeles are acting in this capacity. AQMP Coordinating Committees have been established to advise the subregiona 1 air quality planning agencies in each county. In each of the counties the Executive Director of the County Transportation Commission serves on the committee to assure close coordination of local transportation/air quality planning.
7.4.4A Transit Operators/Airport Operators
Transit and airport operators are also planning and implementing agencies. They develop plans for their future development, such as short range transit plans for transit systems or master plans for airports. These plans meet state and federal requirements to provide the basis and justification for their application for funds for implementing projects. Throughout the planning and implementation process, operators function within the procedures and restrictions established by local, regional, state and federal agencies as described below.
7.5A INTERRELATIONSHIPS
Planning is required by state and federal law and is a prerequisite to receiving federal and state project grants. The transportation plan enumerates specific types of prograimling actions which should be used to implement broader policies.
Under federa 1 1 aw*, programs of projects resulting from regi ana 1 p 1 ans, for federal highway and transit funds are submitted to the Secretary of DOT. These programs are based on a continuing transportation planning process which results in multi-modal transportation plans and prograr.ns. Federal rules and regulations** further specify that programs of highway and transit projects included in the Transportation Improvement Program
• 23 USC 105, 134 (a) and 135 (b); 49 USC 1602, 1603 (a) and 1604 •• 23 CFR 450, Subpart C (Section 450.306)
7A-8

Revised 1-25-79
7.6A Institutional Arrangements Actions
1. SCAG will assume an advocacy role with the state and the federal governments 1 to make transportation planning and programming requirements more responsive to local and regional needs.
2. SCAG will develop and execute regional transportation memoranda of understanding with the County Transportation Commissions, Imperial Valley Association of Governments and Ventura County Association of Governments enumerating transportation roles and responsibilities of these agencies in relationship to SCAG and vice versa.
3. SCAG will work with Caltrans to update the current transportation memoranda of understanding between them.
4. SCAG will periodically review transportation planning. programming and project review processes and seek to reduce review time and red tape.
5. The county transportation commissions and the subregional air quality planning agencies should clarify transportation/air quality roles and responsibilities.
7A-9

appendices

APPENDIX A TECHNICAL ASSU~1PT IOI<S
A. l I NTR ODUCT ION
This appendix identifies the major assumptions rnade during the development of the Regional Transportation Plan {RTP). It is important to identify these assumptions and recognize their strengths and weaknesses, since they are often the basis for the conclusions reached in the RTP.
One of the inputs to transportation planning is estimates of future travel demand. Surface travel estimates are made with the LARTS Transportation Model. Inputs to the model include socioeconomic data and transportation system characteristics. A key elernent in developing the socioeconomic data is SCAG's growth forecast policy. The growth policy forecasts population, housing, employment, and land use. The forecasts represent a combination of trends, assumptions, and local and regional policies.
Also included in the RTP are estimates of future air travel demand from SCAG's Southern California Regional Airport System Plan.
Finally, in evaluating strategies for improving air quality and reducing energy consumption, a number of technical assumptions must be made. These are used both in establishing a baseline or reference case and in estimating the relative effectiveness of alternative strategies. These assumptions will be examined in the last section of this appendix.
A.1 GROWTH FORECAST POLICY
Although population growth is increasing in the less developed areas of the region, the SCAG-76-Modified Growth Forecast Pol icy* checks this trend by allocating a large share of the regional growth to existing urban areas.
Some of the basic assumptions of the SCAG-76-Modified forecast are listed in Table A-1. In addition to the assumptions listed in this table, other assumptions can be inferred from the design of the forecast.
*
o The SCAG region will continue to capture its present share of the national employment growth. Jobs will be created at a simple annual rate of 1.7% between the years 1975 and 2000.
0 The labor force participation rates will increase slightly. Male participation rates will decrease slightly due to earlier retirements and female participation rates will increase significantly. This will result in a higher ratio of jobs to populations.
SCAG-76 was adopted by SCAG' s Executive Committee in December 1975. It was modified slightly in November 1977 for analysis purposes. SCAG-78, scheduled fur adoption in January 1979, will be used as the basis for RTP amendments scheduled for adoption in February 1979.
A-1

SCAG '76 MODIFIED GROWTH FORECAST ASSUMPTIONS
A. Population
l. Fertility Rate
2. State Migration
3. Average Household Size
B. Natura 1 Environment
1. Air
2. Energy
c. 1nfras tructures
l. Transportation
2. Airport
3. Water Supply
l.
2.
3.
2.5 live Source:
100,000 Source:
births per woman. 1974 DOF 0-100 forecast
net immigrants per year. 1974 DOF D-100 forecast
A forecasted region a 1 average household size of 2.52 for 1990.
1. Air quality is expected to improve the next decade with implementation of stricter air quality standards. Some of the region, however. will continue to experience periods of heavy smog.
2. Energy will continue to be in short supply and at an increasing cost.
1. A more balanced transportation system wi 11 be developed over the next decades as specified in the 1975 RTP.
2. a. LAX will continue to be the region's major airport.
b. Palmdale Airport will be sma 11 to moderate, with 6 to 8 million passenger trips annually by 1990.
c. Ontario Airport will develop in accord with the criteria of the SCAG Airport Plan.
3. The water supply to the region will be adequate to accommodate forecasted growth.
table A-2-"1

o Housing supply will meet housing demand, despite a significant decrease in the number of persons per dwelling unit. This implies that consumer purchasing power will increase in proportion to the cost of housing; the supply of money will be sufficient for the investment in housing; housing technology and institutions will adjust sufficiently; conservation and rehabilitation of existing housing will increase over past rates; and federal, state and local programs will be developed to help meet the housing demand.
o The highway network from the 1975 Final RTP is dSSurned to be com-pleted. Significant improvements in trans1t service in the older urbanized areas of the City of Los Angeles are also assumed.
I '
I I
SCAG '76 MODIFIED POPULATION FORECASTS
------ -
COUNTY 1975 1995
- - ,\-------Imperial 83,250 !09,000
Los Angeles 7,020,772 7,732,000
Orange 1,684,500* 2,513,000
Riverside 531,679 797,000
San Bernardino 696,064 913,000
Ventura _____iR,iQ_I - 700,000 _
Regional Total 10,488,672 12,764,000
*County Total -- 1975 Cali forma Department of Finance Estimate
SCAG '76 1~00 l F 1 EO HOUSING Ul-1! T FORECASTS
COUNTY 1975 1995
- ---- -----
Imperial 26,256 35 ,300
Los Ange 1 es 2,695,401 3,100,600
Orange 607,631* 948,400
Riverside 214 ,!l89 336,300
San Bernardino 285,831 375,200
Ventura __ j44,10?_ _ ____11Q .• 200
Regional Total 3,974,ll6 5,036,000
* County Total - 1975 Ca. Department of Finance Estimate
tableA-2-2 tableA-2-3
A-3

SCAG '76 MODIFIED EMPLOn!ENT FORECASTS
COUNTY 1970 1995
Imperial 29,000 50,000
Los Angeles 3,170,000 4,008,000
Orange 4 75,700 1,201,000
Riverside 149,100 286,800
San Bernardino 219,400 359,100
Ventura 115,800 247,200
Regional Tot a 1 4,159,300 6,152,100
SCAG's adopted growth forecast is based on policies -- such as reducing vehicle miles traveled and balancing population with jobs -- which are described in the forecast report. The numbers themselves are policies; that is, targets to be sought through A-95 reviews, functional plans, and coordination. The forecasts are not just extensions of trends; instead they modify trends to fit policy. Prior to adopting a forecast, several alternatives are considered. Those alternatives include higher and lower total growth than the adopted forecast, and different distributions of the .adopted total. An environmental assessment has been prepared on SCAG-76.
table A-2-4 A-4

A.3 REGIONAL AIRPORT SYSTEM ELEMENT
Assumptions made in the 1978 RTP based upon the fo 11 owing tab 1 es. those contained in the 1977 RTP.
regarding future air travel demand are These tables have been updated from
Regional air transportation forecasts indicate an air passenger travel demand of 44 to 48 million annual passengers in 1985, and 88 to 97 million in 1995, compared to a 1977 level of 35.1 million. Air cargo shipment demand is expected to increase from 0. 83 mi 11 ion annua 1 tons today to 1.8 million in 1985 and 5.8 million in 1995. General-aviation denand is projected to grow from the current 11,825 based aircraft to 15,000 in 1985 and 20,000 in 1995 [Table A-1). '
SCAG REGION AVIATION FORECASTS
1977 1985 1995
Air Passengers* (millions of annual passengers) 35.1 44-48 88- 97
Air Cargo** {millions of annua 1 tons) 0.83 1.8 5. 8
General Aviation (thousands of based aircraft) IL8 15 20
*Air Passengers enplaned and deplaned at major airline airports **Air Cargo is defined here to include air freight, air express,
and air mail.
While the overall capacity of the regional airport system may be adequate to handle the forecasted air transportation demands through 1985, by 1995 capacity will be a problem unless additional capabilities are developed (Table A-6). Although some airport limitations may be necessary in the urban areas due to airspace conflicts, generally the airspace can accommodate the increased air traffic volumes. There will be runway capacity deficiencies by 1995 (Table A-7), in terms of both airline and generalaviation operational demands, especially if envirormental problems continue to necessitate operating restrictions. Again~ this problem will be confined mostly to the urban areas. Improvements in ground access, including a system of remote passenger-processing tenni nal s, wi 11 be necessary at most major airline airports in the region by 1995.
table A-3-1 A-5

' I I I i ' I
I ' i ! i I
,,JR PASSENGER VOLUHES AT 11AJOR AIRLINE AIRPORTS
{11!LLIONS OF AWIUAL PASSENGERS £NPLAPIEO AND OEPLAI~ED)
PASSENGERS TIRV'rO
1985 1995 AIRPORT 1977 Forecast Forecast
CURRENT MAJOR AIRLINE AIRPORTS
1: Los Angeles International (LAX) I 28.362 30 - 40 40
Orange County (SNA) 2.159 2 1 ,,
Hollywood-Burbank (BUR) I l. 999 2 - 3 1 - 3
Ontario International (ONT) I I;
1.681 4 - 6 14 - 10
Palm-Springs Munic1pal (PSP) 0. 506 0.8 L5
II Long Beach (LGB) ,, 0.491 0.5 0.5
1: ~~ ~~-- ~~-
TOTAL 35.198 39.3-52.3 60 - 67 j,
I FUTURE MAJOR AIRLINE AIRPORTS '
Palmdale Area i
0.006* 0.09 6 - lO
Imperial County (!PL) 0.005 0.06 0 - 11
Ventura County Area
I 0. 500** 0.05 0.7- 1.1 -- --
TOTAL I 0.061 0.20 6.8 -11.21
' TOTAL PASSENGERS SERVED -- :!
ALL MAJOR AIRLINE AI~PORTS I!
35.2 39 - 52 E7 - 78
ANTICIPATED REGIONAL DEMAND
Jl
35.2 44 - 48 88 - 97
UNSERVED DEMAND - 0 - 9 10 - 30
"Present airline service point is Palmdale- Air Force Plant 42 IPMD) **Presc>nt airline service point is Ventura County Airport at Oxnard IOXR)
The aviation forecasts adopted in the Regional Airport System Plan rely upon the forecasting model developed for the Division of Aeronautics of the California Department of Transportation. The use of this model provides a forecast revision capability and enables the SCAG region aviation forecasts to remain consistent with forecasts prepared for other parts of Ca 1 iforn i a. Inputs to the mode 1 i nvo 1 ve certain soci a 1 and economic factors, including population, employment, gross regional product and average disposable income per capita, as well as such aviation service characteristics as travel time and ticket price.
tableA-3-2 A-6

GENERAL-AVIATION BASED AIRCRAFT FORECASTS
19 77 1990
COUNTY Served by Airports County Served by Airports
in County Demand in County
IMPERIAL 265 465 460
LOS ANGELES 6, 785 10,295 9,445
ORANGE 2,2BO 3,140 2,450
RIVERS IDE 785 I ,315 1,795
SAN BERNARDINO 1,035 1,765 2,630
VENTURA 675 1,190 1,425
Regional Total II, B25 IB,l70 18,205
The original population assumptions employed in the model were the California Department of Finance ''Series D'' forecasts. These forecasts indicated a 1990 SCAG region population of 13.9 million. The SCAG-76 growth forecast policy has a revised 1990 forecast of 12.25 million. Because of lower population and economic forecasts, the SCAG Executive Committee approved using the aviation forecasts for a later five-year time period unti_l new aviation forecasts are developed for the region.
This modification is reflected in the preceding tables. and partially offsets the high population forecasts originally used in the model. The SCAG-76 1995 population estimate for the region is 12.8 million, which is 1.1 million below the 1990 projection used in the model. Based upon SCAG-76 population forecasts, the aviation forecasts of these tables 1nay still be too high.
The projected rise in aviation demand, though, is much more a response to forecasted economic growth, especially in gross regional product and per capita disposable income, than it is to increases in population. Revisions of the economic fOrecasts to conform with the new population forecasts are not yet comj.Jl eted. Although it is probable that employment and gross regional product projections will be lowered slightly, substantial overall regional economic growth is still anticipated.
tableA-3-3 A-7

RUNWAY DEMANDS AND CAPACITIES
DEMANDS
CARRIER
Tot<~l annual passengers (millions) Passengers per operation (regional a~erage) Annual aircraft operations (thousands)
GENERAL AVIATION
Based aircraft (thousands) Operations per based aircraft Annual aircrilft Operations (millions)
CAPAClTJES
6 Existing Major Air Carrier Airports
52 Other Civil Airports in Plan
Total for 58 Civil Airports
22 Other Public-Use Airports* (Not in Plan)
Total All Airports
CAPACITY EXCESS OR OEFICIEN~Y
AIR CARRIER
1972 1985
26.4 44 - 48 45 75
581 .4 587 - 640
8.6 15 650+ 700
5 .65 10.5
_::_z;] ~~~~ ANNUAL CAPACITY ~ILL IONS Of bP£RATION~
AIR CARRIER
. 885
GENERAL AVIAT!O'~
1.5
11.9
13 .4
3. s
1 7. 2
1995 ANNUAL AIRCRAFT OPERATIONS
1995
88 - 97 100
880 - 970
20 750 15.0
TOTAL
2.4
11 . 9
14.3
18. 1
Assuming only the six e~istino major air carrier airports and the current aircraft mixes: 'l.OOO exc(>~~ ~o 1'15 ,001.) def1 c iency
Asst~ming contint~ed restrictions due to environmental problems:
GENERAL AVIATION
Assuming only the 58 civil airports included in the plan:
Assuming all 80 public owned or p'.li:Jlic used ~irports
up to 300,000 deficiency
1,600,000 deficiency
(,2QQ,(l(1') ('!Ct'SS
*Most of the additional 22 airports are located ln outlying portions of tile region wnere tile den1and is low.
tableA-3-4
•
A.4 TRAVEL DEMAND FORECASTING
Estimates of future transit patronage and highway traffic expected on a given transportation alternative are based on forecasting methods employed by the California Department of Transportation in the Los Angeles Regional Transportation Study (LARTS). This travel-demand forecasting process was reviewed and accepted by the Urban Mass Transportation Administration for the recent SCRTD Technical Analysis of Alternatives for Los Angeles. The same models and processes have provided forecasts for the evaluation of regional and sub-regional transportation plans since 1971.
The LARTS multi-modal transportation model consists of four sequential sub-modes: Trip Generation Model, Trip Distribution Model, Modal Split Model, and Trip Assignment Model. These models were developed and calibrated for travel patterns and behavior observed in the origin-destination travel survey conducted by LARTS in 1967 and described in the LARTS 1967 Base Year Report, December 1971. The sub-mode models assume that the relationships established in the base year remain unchanged over time. These precepts are being reviewed and updated based on the 1976 Urban/Rural Travel Survey data. Analysis results to date indicated that trip rates and other behavior are actually very stable over time.
A detailed description of the LARTS model and its assumptions in Technical Re ort TR/2 The LARTS Trans ortation Model: and Assumptions, January 974.
is contained Descri tion
Trip generation is the process of forecasting the total number of trips that will begin and end in a given traffic analysis zone (generally two census, tracts). Trip generation is assumed to be based on the number of vehicles owned per household, which in turn is a function of median household income, population per housing unit, number of housing units, and proportion of single housing units to total housing units. Trip generation internal to the LARTS area is also assumed to be generated in the zone of residence. Non-home-based trips are assumed to be generated by household but modified by regression equations using population, retail employment, and total employment. Trips which cross boundaries of the LARTS area (external trips) are estimated independently of the internal trip generation procedure by assigning cordon volumes to each of 30 cordon stations.
The trip generation model essentially extrapolates trip-making behavior to a future year and reflects anticipated socioeconomic changes. It cannot predict changes in trip rates resulting from the unavailability of gasoline, for example, or the advent of an extensive mass transit system.
Trip distribution is the method by which the number Of person-trips between each pair of zones is determined. The resulting person-trip interchange table is the travel demand for any given land use forecast. Trip distribution is assumed to be a function of four variables: the inter-zonal travel times on the highway network~ the number and types of trips produced by each zone, the travel tlme factors as a function of inter-zonal travel time. and zonal attraction factors. The gravity model used to calculate trip distribution distributes trips between the zone of generation to zones of attraction by the following equation:
A-9

Where T;j=
T; =
Aj =
Fij
T;j = Ti F;jAj n
trips between any zone _j_
trips produced at
attraction factor
zone and any
zone i
for zone 1 = travel time factor for trips
between zones ...!. and _j_
n = total number of zones of attraction
The attraction factors used were derived by regression analysis from the 1967 0 & D data. The major assumption of the gravity mode 1 is that the relative frequency distribution of travel times observed in the 1967 Origin and Destination survey remains constant over time. The 1976 travel time distribution is not much changed frcxn that of 1967. The gravity model does not consider the effect of travel cost or mode on the choice of destination.
The mode choice portion of the model splits person trips into transit trips and vehicle trips. Walking is considered only in relation to access to and egress from the transportation system. The mode choice sub-model is the only place in which travel costs and levels of service are considered. The most important factors related to transportation system performance and mode choice are travel 11 running" times (operational speeds, vehicle acceleration, deceleration; highway speeds, duration- of required stops etc.), and "excess" time (walking and waiting times to gain access to the transportation system, and transfer waiting time). Travel costs are computed as functions of transit fare, auto operating costs, auto parking costs, and family income. It is assumed that increased travel costs or reduced levels of service for a particular mode will not reduce the total number of trips generated,. but will reduce the share of trips made by that mode.
The assignment portion of the model loads the transit trips (between each pair of zones) onto transit 1 ines represented by the input network, according to a minimum path algorithm, and loads vehicle trips onto the highway network, using two path values. For each zone-to-zone interchange, two paths are developed: a "minimum time11 route and a "city street" route (assumed to be l/3 time on all surface links), to avoid unrealistically high loadings on freeways. For highway assigruoents, trips between each pair of zones are divided between the two routes according to the California Diversion Formula:
A-10

p = 50 + 50(d + 0.5 t)
(d-0.5 t)2+ 4.5
where p = percentage assigned to the minimum time routing
d"' distance in miles saved on the minimum time routing over the city street routing
t time in minutes saved on the minimum time routing over the city street routing
Travel times between zones are based on average speeds for each 1 ink, LARTS subregion (rural, suburban, urban and central city), "peak" and "offpeak" conditions.
INPUTS TO THE LARTS r1DDEL
Primary inputs to the LARTS model are socioeconomic data and transportation system characteristics. Socioeconomic data such as population, housing, and employment are forecast by SCAG (see Table A.2.1, Growth Forecast Policy). LARTS, in turn, distributes the SCAG totals for the 46 regional statistical areas (RSA) contained within the LARTS area to the 1285 traffic analysis zones (AZ).
The following assumptions were made as part of this process:
o The median household income forecast assumed an annual real income compound growth rate of 1% between 1970 and 1990.
o The income growth rate was applied to the 1970 median household incomes of.all AZ's and maintained for those zones considered stable.
o For unstable zones, the median income was modified depending on the projected number and type of dwelling units, a knowledge of current and anticipated new single-family dwelling unit prices and apartment rents in the zone, and factors affecting the income stability of existing units.
While Caltrans is largely responsible for preparing the computerized description, transportation system characteristics are generally defined by the agencies conducting the analysis and evaluation of alternative transit/highway systems. For example, the RTDP regional-core transit lines were defined by SCRTD, with review by UMTA/local governments.
" "

A.5 TRAVEL FORECASTS; MOBILE-SOURCE EMISSIONS
Transit patronage, average daily traffic, vehicle miles traveled {VMT} and mobile-source emissions were estimated by the LARTS transportation model for three systems:
(1) The 11 No-Bu11d" system, consisting of the 1976 transit system and 1976 highway network, applies existing travel conditions and behavior to the 1990 growth forecast (SCAG-76 Modified).
(2) The 11 NULL TRANSIT., system projects the impacts on vehicle usage in 1990 of an improved highway system with no change in the 1976 transit system.
(3) The "RTDP" system estimates the impact that the Regional Transit Development Program would have on vehicle usage in 1990, given the 1990 highway system.
LARTS model travel forecasts for the three systems are compared in Table A-5-l to results obtained for the base year, 1976. The travel demand, i.e. person trips, was obtained in each case with revised trip generation rates and vehicle ownership models derived from data collected in the 1976 Urban/Rural Travel Survey. Analysis of the 1976 survey data showed that vehicle occupancy rates (by trip purpose) were essentially unchanged from those of 1967, when the first origin-destination survey was conducted. The distribution of home-based ~rk trip travel times had not changed significantly from 1967. While the average trips per vehicle remained nearly constant, the per-capita trip rate increased fr001 3.2 in 1967 to 3.45 in 1976. This is attributed primarily to an increase in the percentage of households owning two or more vehicles and a concomitant drop in the proportion of zero-car households. Furthennore, the average number of persons per household decreased from 1967 to 1976, increasing households at a greater rate than population.
The SCAG-76 Modified Growth Forecast assumes a further drop in family size by 1990, and projects more housing units than the previous growth forecast did, Table A-5-2. Then, given the updated trip generation model, the 1990 travel demand, 42,661,000 person trips per weekday, is about 700,000 person trips greater than the travel demand generated by SCAG-76 Revise-d. Thus vehicle:. (LDV) will travel 5,133,000 more miles in the No-Build system - 212s667,000 - under SCAG-76 Mod. than under SCAG-76 Revised. Transit and vehicle usage projected for the No-Build system is simply an estimate of what would result if today 1 s population, employments and housing were replaced by those of the growth forecast. An average vehicle occupancy factor of 1.2 for work trips was assumed because the 1976 highway system operating in 1990 is deened to offer no more carpooling incentives than it did in 1976.
With an improved highway system. which includes completed segments in the freeway system, ramp metering on all freeways and other TSM improvements, 1 ight duty VMT drops to 205 mill ion in the NULL Transit system. This decrease results primarily from the assumption of 1.3 for commuter vehicle

TABLE A-5-l
LARTS MODEL TRAVEL FORECASTS
Forecast Year
Growth Forecast
Population (LARTS)
Assumptions:
Auto Occupancy (Work)
Auto Occupancy (Non-~lork)
Fare Structure
Auto Operating Cost ( 1 67$
Person Trips (Weekday}
Average Trips Per Person
Transit Trips
% Transit Usage
Auto Driver Trips
Auto Passenger Trips
Total Vehicle Trips
Vehicle Miles-Work (LDV)
1976 BASE
1976
1976
10,133,893
1.2
1.52
'76 Zonal
5.29 ¢/mi
34,944,000
3.45
No-Build NULL Transil RTDP
- - 1990 -l- ~-- - - - - SCAG-76 Modified - - -
ll,82B,257 ----
1.2 l . 3 1.3
- l. 52 -
- - 40 ¢ local & 5 ¢/Fwy mile - -
- - - - - - 5.76 ¢ /mi - - - - -
------ 42,661,000-----
- - - - - - - - 3.6 - - - -
1,174,000 1,570,000 1.559,000 1,832,000
3.36 3.6B 3.65 4.29
23,920,000 29,119,000 28,359,000 28,164,000
9,850,000 11,972,000 12,739,000 12,661,000
33,770,000 41.091,000 41,098,000 40,825,000
67,015,000 81,832,000 75,034,000 73,162,000
Vehicle ~liles-Non-Work (LDV) 104,113,000 l3D,B35,DOO 133,168,000 131,291,000
Total VMT (LDV)
Vehicle Miles (HDV)
Total VMT
l7l,l2B,OOO 212,667,000 208,202,000 204,453,000
8,556,000 10,633,000 10,410,000 10,223,000
l79,6B4,000 223,300,000 218,612,000 214,676,000
table A-5-1

TABLE A-5-2
COMPARISON OF GROWTH FORECASTS
COUNTY SCAG-76 Revised
Population sou MOU
Los Angeles 7,561,540 1,631,561 1,228,780
Orange 2,368,370 490,257 336,935
Ventura 631,997 139,688 64,514
Riverside 549,510 164,858 35,762
San Bernardino 722,929 204,!10 45,260
SOU • Single Dwelling Units MOU • Multiple Dwelling Units
Source: LARTS Model Input Data
SCAG-76 Modified
Population sou
7,554,637 1,707,566
2,369,120 518,338
632,000 143,933
549,500 168600
723,000 212,595
table A-5-2
MOU
1,215,994
340,997
65,822
36,100
44,650

occupancy. This represents almost a 100 percent increase in carpooling by 1990, brought about by various carpooling incentives incorporated in highway improvements.
Addition of an extensive freeway line-haul bus transit system and a regional core rapid transit line converts 277,000 vehicle trips to transit usage in the RTDP System. This increase in patronage reduces auto driver trips by nearly 200,000 and VMT by nearly 4 million from the NULL Transit system. Achieving a 20 percent reduction of VMT requires the removal of another 14.57 percent, or 31 million vehicle miles, of No-Build VMT. Further reductions of VMT are possible by carpooling incentives or drive-alone disincentives, or ccrnbinations of them. These tactics and strategies are discussed in Appendix C-1.
Figure A-5-1 shows past and future estimates of VMT. The latest estimate for which data was available is 180 million VMT in 1976. The relatively low rate of change from 1970 to 1974 reflects the efffects of the 1973-74 oil embargo. From 1974 to 1976, vehicle usage accelerated as gasoline became more ava i 1 ab 1 e and price increases were absorbed by the economy. for the No-Build system, VMT is projected to increase by 24.1 percent over that of 1976, compared to a population increase of 16.7 percent. Implementation of the Regional Transit Development Program could potentially limit VMT growth to 17.3 percent of that in 1976.
Although VMT will increase, mobile source emissions are expected to decrease, as indicated in Table A-5-3. Emissions were calculated by means of the Direct Travel Impact Model (DTIM), which applies composite (vehicle} emission factors to VMT output by the LARTS model. The revised emission factors, released by the Envirom~ental Protection Agency in January 1978, take into account the mix of model year cars expected to occur in 1990. Thus as more and more "clean" cars enter the fleet, replacing older model year vehicles, mobile source emissions are expected to decrease. The reader should note that the 1990 emissions calculated with the revised EPA factors (January 1978) are about twice as high as the emissions calculated by earlier EPA factors, those published in AP 42 Supplement 5.
TABLE A-5-3
MOBILE SOURCE EMISSIONS INVENTORIES
SYSTEM THC NOx SOx co TOTAL
(tons/day) (tons/ day) (tons/day) (tons/ day)
1974 BASE YEAR 1184 931 40 7726 9881
No-Build 353 510 50 3054 3967
Source: Ca1trans Direct Impact Travel Model (Jan. 1978)
A-15 table A-5-3

VMT ESTHlATES
(Light and Heavy Duty Vehicles)
230
223.3 (No-Build) 220
(Null Transit)
210 ( RTDP)
200
~
~ 190
180
:;:: 160 ·~
u 150
·~
140 140.6
130
1970 1980 1990
Calendar Year
Source: Cal trans LARTS Transportation Model
figure A-5-.,
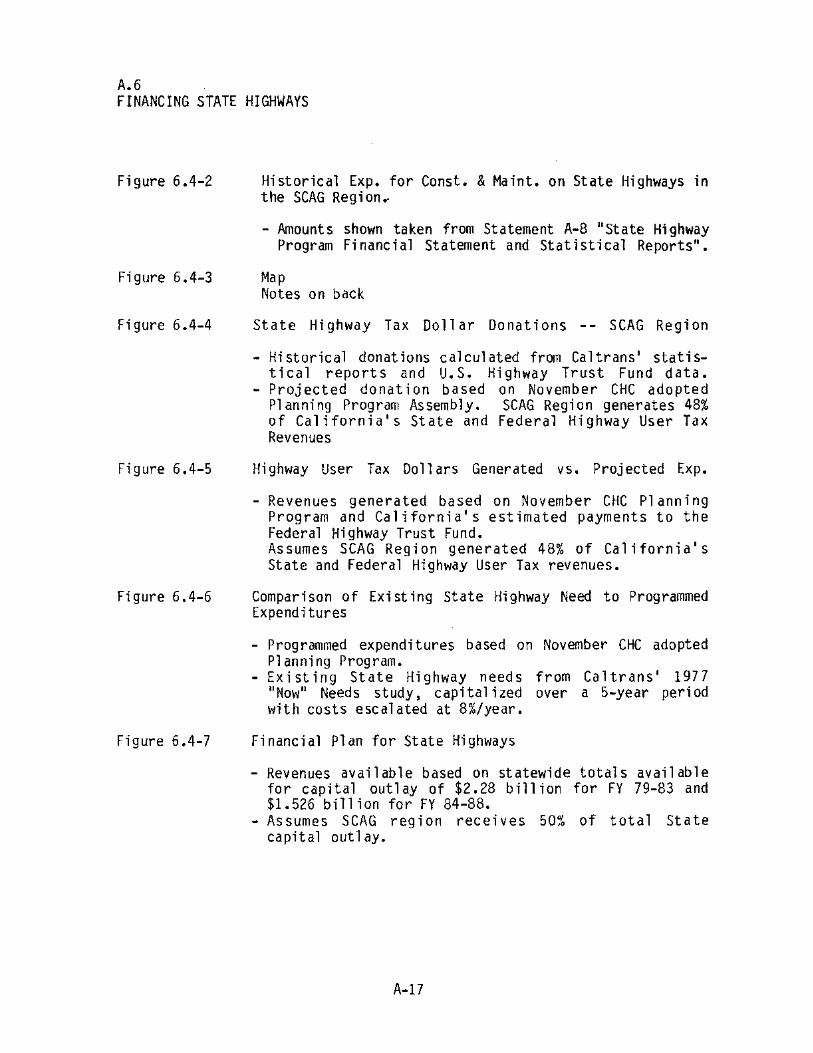
A.6 FINANCING STATE HIGHWAYS
Figure 6.4-2
Figure 6.4-3
Figure 6.4-4
Figure 6.4-5
Figure 6.4-6
Figure 6.4-7
Historical Exp. for Canst. & Maint. on State Highways in the SCAG Region~
- Amounts shown taken from Statement A-8 11 State Highway Program Financial Statement and Statistical Reports".
Map Notes on back
State Highway Tax Dollar Donations -- SCAG Region
-Historical donations calculated from Caltrans' statistical reports and U.S. Highway Trust Fund data.
- Projected donation based on November CHC adopted Planning Program Assembly. SCAG Region generates 48% of California's State and Federal Highway User Tax Revenues
Highway User Tax Dollars Generated vs. Projected Exp.
Revenues generated based on November CHC Planning Program and California's estimated payments to the Federal Highway Trust Fund. Assumes SCAG Region generated 48% of California's State and Federal Highway User Tax revenues.
Comparison of Existing State Highway Need to Programmed Expenditures
Programmed expenditures based on November CHC adopted Planning Program. Existing State Highway needs from Caltrans' 1977 "Now 11 Needs study, capitalized over a 5-year period with costs escalated at 8%/year.
Financial Plan for State Highways
-Revenues available based on statewide totals available for capital outlay of $2.28 billion for FY 79-83 and $1.516 billion for FY 84-88.
- Assumes SCAG region receives 50% of total State capital outlay.
A-17

APPENDIX 6
Summary of Public Participation Activities
The Southern Cal lfornia Association of Governments, as an areawide planning organization, formulates plans which affect the future of 10 million people in this six-county, 151-city region. SCAG thus tries to infom and involve members of the public in its activities, to ensure development of sound and viable plans.
Policies of the Public Participation Program
SCAG's public participation program has, over the years, developed its own set of policies for the overall, on-going planning process. These are:
o SCAG is committed to a broad-based public participation program which will:
a) involve a cross section of affected/interested parties and ensure participation from all segments of the population, including low-income and minority citizens;
b) provide public access to the planning and decision-making process through a variety of means, including the fonnal public hearing process;
c) include a public information component providing complete, readily understood information to help the public formulate their recommendations to decision-makers. In addition, technical material will be available on request.
o SCAG is committed to an on going process of pub 1 i c participation which encourages public input in all phases of the planning process, including development of public participation programs, plan development, evaluation, and program implementation. Further, SCAG formally considers and responds to inputs from local officials and technical staff, as well as the public. SCAG documents inputs from all of these sources throughout the planning process.
o SCAG is committed to developing a unified public participation program, with appropriate governmental units and participating agencies, which will emphasize joint responsibility for effectively involving the public in the planning process.
o Within the resources of the program, SCAG is committed to providing human and financial resources to implement the Public Participation Program.
A-16

Key Elements of the Program
Policies give the Public Participation Program only general direction. In presenting the DRTP, DEIR, and seeking public input for the final documents, these policies were translated into four primary functions: (1) information dissemination, involving a comprehensive media campaign; (2} public involvement in the planning process, through meetings, workshops, and hearings; (3) identification and communication of public concerns to elected officials; and (4) integration of public concerns into the planning process.
As in previous years, two key elements of the program were public workshops and hearings. Beginning at the end of May and continuing througtl June, public workshops were held in each of the counties, culminating in a public hearing in Los Angeles County.
A-19
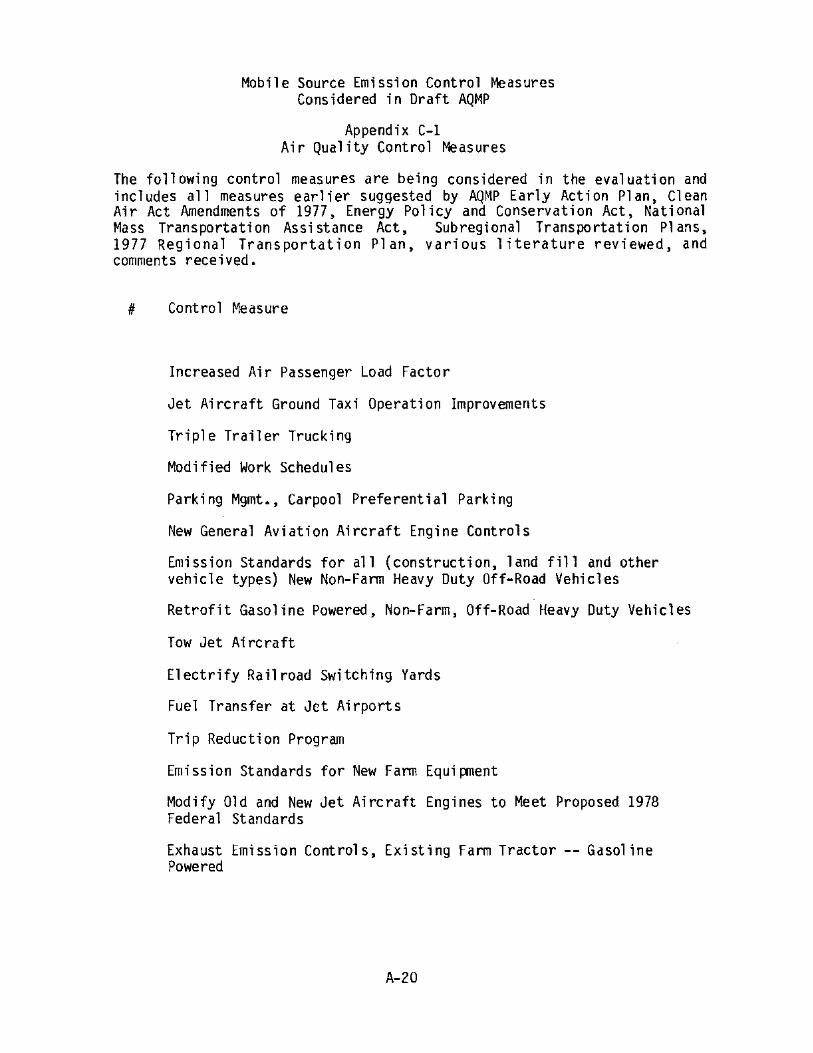
Mobile Source Emission Control Measures Considered in Draft AQMP
Appendix C-1 Air Quality Control Measures
The following control measures are being considered in the evaluation and includes all measures earlier suggested by AQMP Early Action Plan, Clean Air Act Amendments of 1977 ~ Energy Policy and Conservation Act~ National Mass Transportation Assistance Act~ Subregional Transportation Plans~ 1977 Regional Transportation Plan, various literature reviewed, and comments received.
# Control Measure
Increased Air Passenger Load Factor
Jet Aircraft Ground Taxi Operation Improvements
Triple Trailer Trucking
Modified Work Schedules
Parking Mgmt., Carpool Preferential Parking
New General Aviation Aircraft Engine Controls
Emission Standards for all (construction, 1 and fi 11 and other vehicle types) New Non-Farm Heavy Duty Off-Road Vehicles
Retrofit Gasoline Powered~ Non-Farm, Off-Road Heavy Duty Vehicles
Tow Jet Aircraft
Electrify Railroad Switching Yards
Fuel Transfer at Jet Airports
Trip Reduction Program
Emission Standards for New Farm Equipment
Modify Old and New Jet Aircraft Engines to Meet Proposed 1978 Federal Standards
Exhaust Emission Controls, Existing Farm Tractor-- Gasoline Powered
A-20

Inspection and Maintenance of Light Duty Vehicles
Increased Bicycle and Pedestrian Facilities
Improved Emission Controls for Motor Vehicles
Reduce Jet Aircraft Queuing Delays
Pedestrian Facilities
Rideshare Program
Traffic Signal Synchronization
Voluntary Retirement of Old Cars
Reduce Use of Aircraft Auxiliary Power Unit
Reduced Transit Fares
Auto Free Zones
Electric Vehicles
Marine Vapor Recovery Operations
Expanded Transit Level of Service
Off-Road Motorcycle Emission Standards
Tax Bunker Fuels
Parking Management: Increased Parking Surcharge
Congestion Pricing
Automobile Operating Cost Increase (Gas Tax}
Parking Mgmt: Reduced Carpool Parking Cost
Increase Use of Rail, Air~ and Bus for Intercity Travel
Increase Truck Trailer Piggy-backing on Rail
Eliminate On-Street Parking; Select Arterials Peak Hour
Motor Fuel Blended with Methanol and Ethanol
Paratransit
Expand Capacity and Improve Flow on Highway Network
A-21

Employers Rideshare Program
Emissions Tax
18 Year Old Licenses
Home Goods Delivery
Coordinate Tanker Arrivals
Pipeline Freight Transport
Freeway Facility and Transit Improvements Supporting High~ Occupancy Vehicle Movement
Wilshire Rail Line
Los Angeles Downtown People Mover
Congestion Relief-Freeway Widenings
Transit Improvements
Railroad Diesel Engines
Marine Diesel Engine Controls
A-22

APPENDIX D
LEVEL OF SERVICE STANDARDS FOR FIXED-ROUTE LOCAL SERVICE
1) I. Fixed-Route Service - Scheduled service operating repeatedly over the same street or highway pattern.
a. Local Service -- Routes or segments of routes having 4 or more stops per mile. {1) Primary Service-- Scheduled routes operating at least 5
bus trips per day, 5 days per week, and 52 weeks per year.
(2) Other Service-- All routes not included in primary service, such as seasonal service, and routes operating less than 5 trips per day and less than 5 days per week.
b. Express Service -- Routes or segments of routes having less than 4 stops per mile.
II. Demand-Responsive Service -- Unscheduled service which responds to demand and which is not restricted to a fixed street pattern (e.g., Dial-A-Ride).
2) Route-miles -- Sum of the street or highway mileage of all routes in the same service category, adjusted for duplication. For example, if two local primary routes operate along the same segment of street, regardless of the direction of travel, this segment should be counted only once. If a particular route operates in both directions over a street segment, this segment would be counted only once.
3) Bus-mi 1 e -- Sum of the tota 1 bus-mi 1 es of a 11 routes in the same service category. One bus-mile is one bus traveling one mile.
(1) Primary Service-- Scheduled routes operating at least 3 times per day, 5 days per week, and 52 weeks per year.
(2) Other Service -- All express routes not included in primary service.
A-23
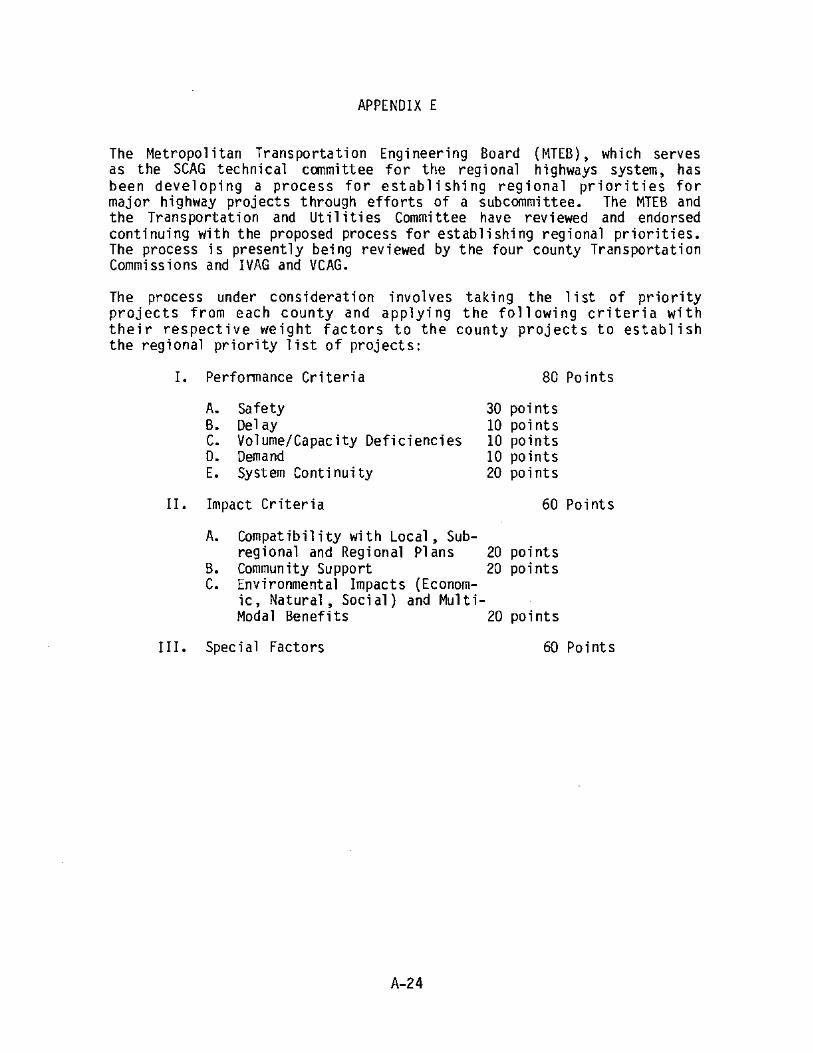
APPENDIX E
The Metropolitan Transportation Engineering Board (MTEB), which serves as the SCAG technical canmittee for the regional highways system, has been developing a process for establishing regional priorities for major highway projects through efforts of a subcommittee. The MTEB and the Transportation and Ut il iti es Committee have reviewed and endorsed continuing with the proposed process for establishing regional priorities. The process is presently being reviewed by the four county Transportation Commissions and IVAG and VCAG.
The process under consideration involves taking the list of priority projects from each county and applying the following criteria with their respective weight factors to the county projects to establish the regional priority list of projects:
I. Perfonnance Criteria 80 Points
A. Safety 30 points B. Delay ID points c. Volume/Capacity Deficiencies IO points D. Demand 10 points E. System Continuity 20 points
II. Impact Criteria 60 Points
A. Compatibility with Local~ Sub-reg i ana 1 and Regi anal Plans 20 points
B. Community Support 20 points c. Environmental Impacts (Econom-
ic, Natural, Social) and Multi-Modal Benefits 2D points
III. Special Factors 60 Points
A-24

APPENDIX F Subregional Plans
o Imperial Valley Association of Governments (IVAG 1977)
o County of Los Angeles, Transportation goals and policies, from County's Environmental Development Guide, adopted October 1, 1970. Goals policies and actions from the County's General Plan Element, adopted 1975: and the County's Preliminary General Plan, Transportation Element, January 1977; not adopted
o Riverside Countywide Transportation Study 1977, update; and Riverside Countywide Transportation Study Final Report 1977
o San Bernardino Associated Governments (SANBAG), Transportation Plan for San Bernardino County, January 1975: SB County Subregional Transportation Plan, pre-draft, 1977
o Ventura County (VCAG), Ventura County 1976 Subregional Plan, and Transportation Plan, Ventura County, update, adopted October 1977
a Orange County Issue Paper 3/24/78
A-25

APPENDIX G Airports of Regional Significance
The following criteria define airports of regional significance:
Any airport meeting or projected to meet one or more of the following minimum levels of activity.
50 based aircraft. 25,000 annual itinerant operations. 35,000 annual local operations.
Any airport served by a CAB or PUC certificated route air carrier.
Selected public use air?orts located more than 30 minutes ground access time {about 20 miles) from the nearest airport meeting the above minimum-activity-level criterion.
Other airports in the regional plan are airports having special significance.
A specially significant airport is one which provides special or unique services to the region as a whole or to a major portion thereof or has a direct effect on the operation of a regionally significant airport.
Airports of special significance to the region include:
All active military airports.
All publicly owned or operated airports.
Selected airports providing unique recreational -opportunities (e.g., skydiving and sailplane soaring).
Selected airports providing special emergency facilities (e.g •• fire fighting bases).
Selected airports having an existing or potential airspace conflict with an existing regionally significant airport.
All remaining airports in the region are considered to have local significance only and are not included in the regional plan. These airports include:
-Most privately owned, publicly used airports not meeting the minimum-activity-level criterion.
- Most privately owned, privately used airports.
-All civil heliports and helistops.
The regional or local significance of an airport is primarily an indication of its importance to the region as a whole, not to the local airport area. An airport is not necessarily of less importance to the community it serves because it is classified as having special or local significance rather than regional significance.
A-26
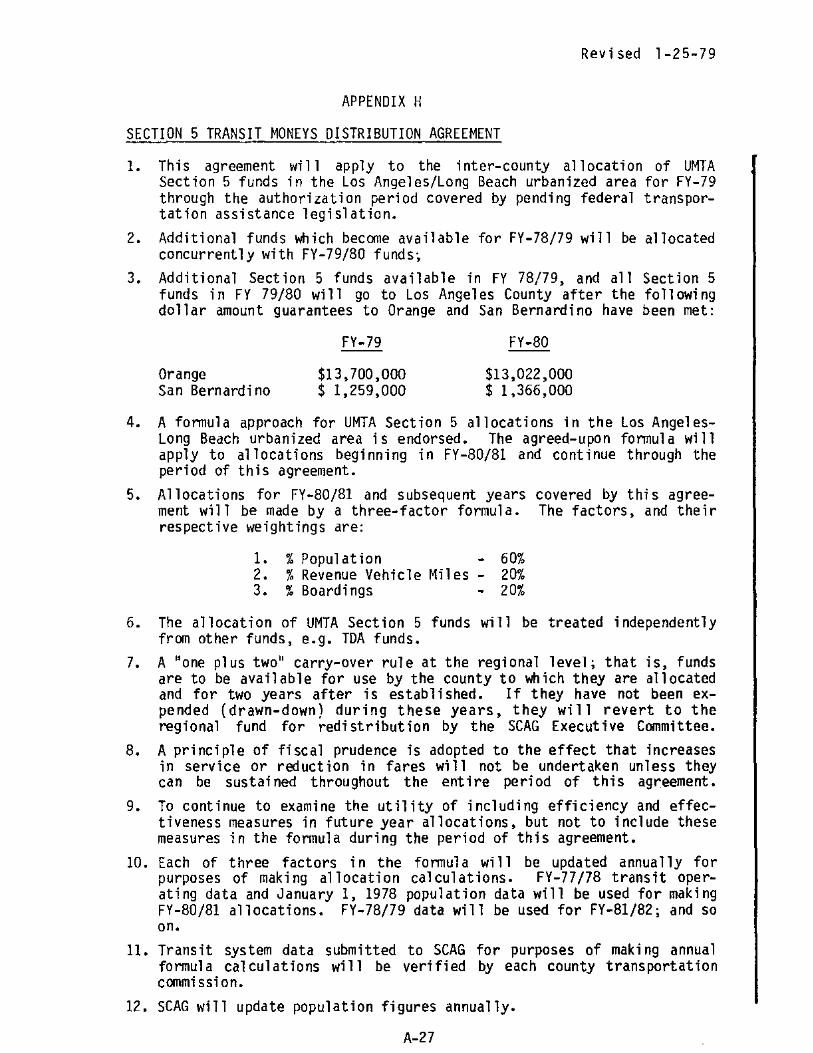
Revised 1-25-79
APPENDIX H
SECTION 5 TRANSIT MONEYS DISTRIBUTION AGREEMENT
1. This agreement will apply to the inter-county allocation of UMTA Section 5 funds in the Los Angeles/Long Beach urbanized area for FY-79 through the authorization period covered by pending federal transportation assistance legi slat ion.
2. Additional funds which become available for FY-78/79 will be allocated concurrently with FY-79/80 funds;
3. Additional Section 5 funds available in FY 78/79~ and all Section 5 funds in FY 79/80 will go to Los Angeles County after the following dollar amount guarantees to Orange and San Bernardino have been met:
Orange San Bernardi no
FY-79
$13,700,000 $ 1,259,000
FY-80
$13,022,000 $ ],366,000
4. A fonnula approach for UMTA Section 5 allocations in the Los AngelesLong Beach urbanized area is endorsed. The agreed-upon fonnul a wi 11 apply to allocations beginning in FY-80/81 and continue through the period of this agreement.
5. Allocations for FY-80/81 and subsequent years covered by this agreement will be made by a three-factor formula. The factors~ and their respective weightings are:
1. % Population - 60% 2. % Revenue Vehicle Miles - 20% 3. % Boardings 20%
6. The allocation of UMTA Section 5 funds will be treated independently from other funds, e.g. TDA funds.
7. A 11 one plus two 11 carry-over rule at the regional level; that is, funds are to be available for use by the county to which they are allocated and for two years after is established. If they have not been expended {drawn-down) during these years, they will revert to the regional fund for redistribution by the SCAG Executive Committee.
8. A principle of fiscal prudence is adopted to the effect that increases in service or reduction in fares will not be undertaken unless they can be sustained throughout the entire period of this agreement.
9. To cant i nue to examine the uti 1 ity of inc 1 ud i ng efficiency and effectiveness measures in future year allocations, but not to include these measures in the formula during the period of this agreement.
10. Each of three factors in the fonnula will be updated annually for purposes of making allocation calculations. FY-77/78 transit operating data and January 1, 1978 population data will be used for making FY-80/81 allocations. FY-78/79 data will be used for FY-81/82; and so on.
11. Transit system data submitted to SCAG for purposes of making annual fonnula calculations will be verified by each county transportation canmission.
12. SCAG will update population figures annually.
A-27

Revised l-25-79
Appendix I
Finance Element Major Assumptions
The following major assumptions were used in Section I and II of this analysis. {Other assumptions are detailed in the text and in the notes in Appendix J.)
(I) Costs will generally grow by 8% annually.
(2) Federal Highway Administration funds allocated to California will grow by approximately 5% annually.
(3) After fiscal year 1983 the state will continue to retain sufficient state cash to match all federal funds. This will be done despite a projection of inadequate funds for full highway maintenance after that time.
(4) Consistent with preliminary five year highway capital fund estimates provided by Caltrans, the SCAG region will be allocated 40% of revenues available statewide for highway capital outlay.
(5) Cities and counties will retain sufficient local funds to match federal capital revenue apportionments.
(6) Transit capital expenditures after 1982 will remain at approximately 15% of operating expenditures (the percentage for 1983 in the ·aggregated Short-Range Trans it Plans.)
(7) Caltrans will pay for maintenance costs of high occupancy vehicle lanes, highway transit stations, and park-n-ride 1 at s.
(8) All operating costs for the Mass Rapid Transit Starter Line, and the Downtown People Mover will be covered by fares, advertising, parking fees, and other miscellaneous operating revenues.
(9) Except for a small portion of the costs for element II of the complete RTDP all costs will be incurred by FY 1988.
A-28

Appendix J Cant i nued
Appendix J - Notes for Tables 1 - 6
Table I
Revised 1-25-79
(1) Except for UMTA Section 5, FY 1979 figures from short-range transit p1 ans of regional transit operators for all entries as noted. Section 5 funds are taken from the new transit legislation.
(2) Based on the SRTPs it is assumed that 70% of capital expenditures will be funded by UMTA Section 3 funds. An additional $100 million is assumed to be available for the DPM during FY 1979-1984.
(3) Federal legislation has increased the region•s Section 5 allotment by approximately 35%. It is assumed that the FY 1984·1988 allotment will be 35% greater than that for FY 1979-1983.
(4) Federal legislation leaves FAU funds at current levels. It is assumed that FAU funds will remain at current levels over the ten-year period.
(5) Total TDA forecasts from the UCLA Business Forecasting Project. It is assumed that system maintenance costs not covered by other sources are covered by TDA funds.
(6) Fares and miscellaneous revenues are assumed to provide 32% of operating revenues. This is a region-wide percentage taken from the SRTPs. Additionally, all operating costs for the DPM and MRT, as well as 32% of operating costs for commuter/express buses, are assumed to be financed via fares and miscellaneous revenues. For the sake of simplicity all of these revenues are included under fares.
(7) See Note 6.
(8) The portion of state gas tax needed to match Federal Aid Interstate for freeway transit guideway.
(9) Assumes that all FAI funds needed to complete the Interstate system in the SCAG region by FY 1988 will be made available. The portion going to transit is for freeway transit guideway.
(10) See note 9.
(11) Assumes that federal revenues to California will grow by 14% every three years. This percentage is based on analysis of federal highway legislation. All additional federal aid is assumed to be used for capital expenditure.
A-29

Revised 1-25-79
It is also assumed that the proportion of FAP, FAO, and state gas tax funds for capital expenditure is the same as in the 1979 Proposed ST!P for FV !980-1984 provided by Caltrans (39%).
(12) See note 4. After deducting FAU funds to transit, it is assumed (based on estimates of current FAU use provided by Caltrans) that approximately 19% of remaining funds go to highways, and 81% to streets and roads.
A-30

Revised 1-25-79
Appendix J Cant i nued
Appendix J - Notes for Tables 1 - 6
Table 1 (Continued)
(13)
( 14)
(15)
( 16)
See note 11.
Sum of Article 19 funds used for capital and non-capital purposes. Capital revenue amount based on assumption in note 11. All non-capital expenditures are assumed to be made from Article 19 funds.
See note 4.
Base numbers from State Controller's Financial Transactions Concerning Streets and Roads, FY 1976-1977. and SCAG working paper entitled, Preliminary Impacts of Proposition 13 on Transportation in the Re,ion. Assumed to grow 14% every three years beginning in FY 19 9.
(17) Base numbers, see note 15. Assumed to remain at FY 1979 level.
(18) Assumes that 10% of TDA funds will be allotted to streets and roads.
(19) See note 16.
(20) From 1978 Draft Regional Transportation Plan. No figures available for FY 1984-1988.
(21) See Note 6.
(22) Remainder of TDA funds after transit and streets and roads funds removed per notes 5 and 18.
(23) Estimate from 1979 Proposed STIP.
A-31

Revised 1-25-79
Appendix J Continued
Appendix J - Notes for Tables 1 - 6
Table 2
(1)
(2)
(3)
( 4)
(5)
( 6)
FY 1979-1983 calculated by deducting operating expense for 450 buses frcm the SRTPs. This adjustment is made to reflect the projected impact of Proposition 13, particularly in Orange County. Costs assumed to grow at 8% annually after FY 1983.
FY 1979-1983 calculated by deducting capital expense of 450 buses from the SRTPs. FY 1984-1988 costs assumed to be approximately 14% of operating expenditures. This percentage is consistent with the regionwide ratio provided in the SRTPs for FY 1983.
Alternative J, from the Regional Transit Development Program Integrated Program Report, November 1978. All operating ·costs are assumed to be financed by fares. All costs are escalated at 8% per year.
Fran the Regional Transit Development Program Integrated Program Report, November 1978. Assumes capital expenditures from FY 1979 through FY 1981, escalated at 8% yearly. All operating costs are assumed to be financed via fares, advertisements, parking, and other miscellaneous sources. $116 million of capital costs are assumed to be financed with UMTA Section 3 funds. $25 million in capital costs is assumed to be financed by the FHWA. Note that Proposition 5 funds which could be used for additional financing, are for the purpose of analysis, excluded.
From the Regional Transit Development Program Integrated Program Report, November 1978. Capital funding from FAI, and State Article 19. Based on SRTP's, 32% of bus operating revenue assumed to be covered by fares.
Estimates provided by Caltrans.
A-32

Revised 1-25-79
Appendix J Continued
Appendix J - Notes for Tables 1-6
(7) Highway expenditures are derived from the following assumptions about Caltran's revenues and expenditures.
(a} Capital and non-capital expenditures are constrained by total revenue.
{b) FAI and FAP revenues provided to Caltrans are assumed to grow by 14% every three years.
(c) All new federal monies are assumed to be used for capital expenditures during FY 1979-1984.
(d) After FY 1984, non-capital needs are assumed to grow by 6% annually.
(8) It is assumed that 30% of state non-capital revenues (assumed to be equivalent to expenditures) will be used in the SCAG region. Historically (1967-1976) approximately 30% of Caltrans maintenance expenditures have been made in the SCAG region. From the total~ all FAU~ other local federal aid. and Proposition 5 is deducted.
(9) Approximates totals fr001 the California Transportation Commission's 1979 Fund Estimate. Excludes the amount for metered ramp bypasses (Note 19) and traffic signal synchronization (Table 3, Note 7).
{10) Assumes an additional 82 or 83 ramps will be built per year between FY 1979 and FY 1988. Capital costs assumed to increase at 8% yearly. Operating costs assumed to be paid from Caltrans' non-capita 1 funds.
(11) Total for operational signals, ramp bypasses,
improvements less metered and Commuter Computer.
A-33
ramps, traffic

Revised 1-25-79
Appendix J Continued
Appendix J - Notes for Tables 1 - 6
Table 2 (Continued)
(12)
(13)
(14)
( 15)
(16)
( 17)
(18)
From the Proposed 1979 ST1P.
From Table 6.4-3. Assumes equal yearly costs {in current dollars) are escalated at 8% annually. Maintenance costs are assumed to be paid from Caltrans' noncapital funds.
Costs escalated beginning in FY 1980. Maintenance costs assumed to be paid from Caltrans' non-capital budget.
Assumes an additional 136 bypasses built during FY 1979-1983 {from the TIP) and 304 during FY 1984-1988. Capital costs escalated at 8% yearly funded from highway operat i o na 1 improvements. Maintenance costs assumed to be paid from Caltrans' non-capital funds.
Base data from State Controller's Financial Transactions Concerning Streets and Roads, FY 1976-1977. Assumed to escalate at 8% annually until all non-federal funds are expended, except for those needed to match federal funds.
Total street and road revenue less maintenance, administration, traffic signals, and rideshare ($1 million in FY 1984-1988).
See note 20, Table 1.
Table 3
(1) Costs escalated annually beginning in FY 1984. Costs are assumed to be borne 50% by the public sector and 50% by the private sector.
(2) Costs escalated annually beginning in FY 1979.
(3) Costs, escalated annually beginning in FY 1979, are assumed to be funded from TDA funds. Private sector costs are undetennined.
(4) Costs escalated annually beginning in FY 1982.
(5) Costs escalated annually beginning in FY 1979. Assumes 24 additional lots built yearly until FY 1984, plus 10 lots in 1985.
(6) Costs escalated annually beginning in FY 1979. One third of costs are assumed to be borne by the public sector.
A-34

Revised 1-25-79
(7) Assumes that 660 additional intersections will be synchronized per year by local governments and Caltrans beginning in FY 79. Extrapolating from the TIP, it is assumed that approximately $19 million will be funded during FY 1979 - 1983. Another $22 million is assumed to be funded during the next 5 years.
(8) Costs escalated beginning in FY 1981 and ending in FY 1987. Assumes that 53,000 cars will be purchased yearly.
(9) Annualized costs are taken from the Draft Air Quality Management Plan, August 1979. This cost is escalated beginning in FY 1984, and is assumed to be borne 50% by the public sector.
(10} Costs escalated yearly beginning in FY 1984. Assumes purchases of 200 buses yearly, and fare funding of 32% of operating costs. This is a regional percentage taken from the short-range transit plans of the transit operators.
(11) All private sector costs are derived per the explanation in the text except as noted below.
(12) Costs escalated beginning in FY 1ge1.
(13) See note g_
A-35

Appendix J Continued
Appendix J - Notes for Tables 1 - 6
Table 5
Revised 1-25-79
(1) Calculated by increasing the regionwide return on highway user revenues from approximately 55% to approximately 75%.
(2) Calculated by taking 80% of the capital costs for the Wilshire MRT and the Santa Ana Corridor.
(3) Assumes demand for taxed merchandise is perfectly price inelastic.
Table 6
(1) Assumes perfectly price inelastic goods (i.e., demand does not change with imposition of tax).
A-36

Revised 1-25-79
Appendix K Continued
Notes for A-3
(1) There will be an estimated 17% reduction in fuel consumption. There may be additional operating and maintenance costs. but these costs should be offset by a savings in fuel consumption.
(2) This measure should result in an actual savings in operating and maintenance costs, although exact costs haven't been determined.
(3) The public sector may assume 50% of the financing of this measure.
(4) Operating and_maintenance costs may be included in the street system budget.
(5) The costs included are for the first 5 years of the program only in order to be consistent with estimated emission reductions. The costs for the program are likely to continue into the future.
(6) Includes a savings from the resource recovery of scrap metals.
{7) Costs for this measure are undetennined at this time.
{8} The Project_ life for all elements of this measure is assumed to be 30 years with the exception of the commuter express buses which are assumed to have a project life of 12 years.
{9) Caltrans assumes that all costs are capital and that there will be no additional operating and maintenance co costs.
A-37

A(:IJ?:end1x 1-CAPITAL, OPERATING, AND MAINTENANCE COSTS FOR THE AQHP RECOMMENDED MEASURES
Direct Total Direct Private/ Annual Operating Annualized Househo 1 d
Total Annua 1 i zed and Maintenance Costs to Sector Total Unit Cost Number of Measure '=apital Costs Capital Costs Costs Public Sector Annualized Cost ( Currer:t $' s) Years Nund:ler Name of Measure {Crnt.$l,OOO's) {Crnt. $1 ,000' s) {Crnt.$l,OOO's) {Crnt. $l,OOO's) (CrnUl,OOO'sj Co}(:lital O+M of Project H-1 Increased air passenger load factor ,,, Savings H-2 Jet Aircraft Ground taxi operation ,,, Savlngs H-3 Triple Trailer Trucking ,,, Savings H-4 Modified work schedules ,,, Savings (to employers & employees) H-5 Parking Management: 0 0 0 0
Carpool Preferential Parking H-6 New General Aviation Aircraft 15,000 1 ,530 t 1 I 0 1 ,530 $700-$1,500/ 20 engine controls Vehicle H-7 Emission standards for all new 6,500 662 980 0 1 ,642 $450-$1 ,000/ 20 non-hrm heavy-duty off-road Vehicle
vehicles (construction, landfill and other vehicle types)
2,100(3) H-11 Electrify Rail yards 24,000 2,100 (2 I 0 H-13 Trip Reduction Program 0 0 5,000 5,000 0 H-15 [fllllissions stds. for new farm equip. 6,600 670 740 0 1 ,410 $500/Vehicle 20 H-16 1-bdify old and new jet aircraft 132,000 13,500 Undetermined 0 13,500 20
engines to meet proposed 1978 Federal Standards
H- 18 Inspection & maintenance of light- 250,000 37,000 69,505 0 106,505 $15/Vehlcle 10 )> duty vehi c 1 es
' H-23 Increased bicycle & pedestrian 120,000 10,600 ( 4 I 10,600 0 w facilities "' H-24 Improved emissions controls for 325,500 81,525 3,250 0 84,775 $100/Car 5
motor vehicles (1982-1987)( 5) (Annual $1,000/Truck H-25 Reduce jet aircraft queuing delays 15,000 1,530 -400 Savings) I, 130 0 20 H- '14 Rideshare Program 1,500 224 37,776 12,000 26,000 10 H-15 Traffic signal synchronization 49,500 5,040
1 ,3iio( 6 l 5,040 0 20
H-36 Voluntary retirement of older cars 153,100 21 ,200 22,500 0 $425/Car 7 H-fiO Electric Vehicles 0 0 lg,5oo 19,500 lg,5QO H-64 1\pply on-road Motorcycle elllT11ssions 37,500 5,600 11,500 0 17,100 $150/Vehicle 10
standards to off-road motorcycles $40/Vehlcle H-72 Improved trucking efficiency 171 (7) (71 (7) (71
30( 8 ) H-85 Freeway faci 1 ity & transit Improve~ 1 • 722,294 161,108 112,554 273,662 0 ments supporting high occupancy vehicle movement
H-86 Wilshire Rail Line 1,120,000 91,549 23,000 114,549 0 50 "' H-87 L.;.s Angeles Downtown People Mover 167,000 14,835(9) 4,000 18,835 0 30 " H~88 Congestion Relief-Freeway Widenings 77,800 0 6,911 0 30 < 6. 911 -· H-89 Transit Improvements 150,000 19,905 86,000 105,905 0 11 ~
H-113 Purchase of Gvt. Cars for Low Emission Undetermined " ~ and High Fuel Economy -H-114 Reg.Prgm. of Insp/Maint for Govt. Veh. Undetermined ~ {Discounts imoact of H-18) "' H-117 Santa Ana Corridor 207,500 18,432 0 18,432 0 30 ~ ~
H-118 Non-Recurrent Congestion Rei ief Saving ~ ~
---·---TOTAL ------- ---

"' ' w ~
YEAR
1973
1974
1.1 I . 2 1.3 1.4
2. I 2.1 2.3 1.4 1.5 1.6
2.7
1.8 1.9 2.10 2.11 2.11 2.12 2.13 2.14 2.15 2.16
1975 3.1
1976
3.2 3.3 3.4
4. I 4.2 4.3
4.4
4.5 4.6 4.7 4.8 4.9 4.10 4.11
4.12 4.13 4.14 4.' 5
4.16
APPE~ M KEY SCAG* OOCUMENTS
CONTRIBUTING TO THE ANNUAL REGIONAL TRANSPORTATION PlAN
Descriptive Title
Regional Development Guide Transportation Phn Evaluation Process Southern California Regional Airport System Plan SCAG 1990 Traosportation Study, Methodology, Analysis, Results: Phase 1
Criticill Decisions Pl<Hl for Regional Transportation Critical Decisions, Transportation Frameworks Critical Decisions, Highway Element
·Critical Decisions, Transit Element Short Rartge Transporti.ltion Plan Arl Assessment of Social Impacts Related to the SCAG Short Range
Transportation Plan The Regional Impacts of Near-Term Transportation Alternatives: A
Case Study of Los Angeles Short Range Planning for Reduced Vehicle Miles of Travel Transportation Energy in Southern California Energy Consumption by Transit lobde San Bernardino Freeway Express Busway Evaluation, First Year Report Transit Alternatives for the los Angeles Region Guideway Transit for Southern California, A Policy Analysis COIIIIIUter Railroad Feasibility Study .. . Co~~tnuter Railroad Feasibility Study ... Supplement San Bernardino Freeway Express Busway Evaluation, Second Year Report Procedural Guide for Development of the Regional Transportation Plan
1975 Regional Transportation Plan (EIR appended) Alternative Transportation Institutions for Southern California 1974-1975 SCAG Transportation Development Program Procedural Guide to the 1976 Regional Transportation Plan
1976 Regional Transportation Plan (EIR appended} SCAG '76 Growth Policy Needs and Deficiencies: Auto and Transit Accessibility in the
SCAG Region. Draft report Private Sector Study, An Analysis of Dial-A-Ride in the
SCAG Region. Draft report The farking Management Planning Study, Draft Final Report Planning for the Aut0100bile in the SCAG Region Transit Service Policies Transit Safety and Security: A Design Framework Institutional Arrangements for Transit Transportation Systems Management Element The 1976 Urbiln and Rurill Trilvel Survey. Volume I Background and
Description Transit Bilrriers, An Operators Guide to Identification of The Regional Economy and Trend Projections Guide for Economic Income Analysis The Use of Models in Evaluating the Imp~cts of Transport~tion Policy
on the Private Sector ... San Bernardino Freeway Express Busway Evaluation, Third Ye~r Report
Author
SCAG Gruen Associ~tes SCAG Ca 1 tr<~ns/LARTS
SCAG SCAG SCAG SCAG SCAG
ASI
Rand Voorhees, Alan M. L~nsing, Neal Ross, Howard, et. ill. Crain and Associates Ross, Howard, et. ill. Cambridge Systematics Englund, Carl Englund, Carl Bigelow-Crain Associates SCAG
SCAG Stern, Wendy, et ~I SCAG SCAG
SCAG SCAG
SCAG
SCAG SCAG SCAG SCAG SCAG SCAG SCAG
Cal trans SCAG Natelson Co. Nate lson Co.
Natelson Co. Crain and Associ11tes
* Documents preJ)ared by or for SCAG.
RTP !oE._js;/Subtopic
Development Guide Plan Development Aviation Pliln Development
Plan Plan Development Highwilys Transit Air Quality
lmrtilcts, Social
Impacts, Air Quality, Energy Impacts, Social. Economic, Politic~] Energy Energy Ride-sharing Transit Transit Maritime and Railroilds Maritime and Railroads Ride-sharing Plan Develop!llE'nt.
Plan Institutional Arrangements Transit Plan Development
Phn Development Guide
Plan Development
Ride-sharing Air Quality Auto Transit Tran~it Ins ti tut i ona I Arranqements TSM
Plan Development Transit Plan Development Plan Development
Plan Development Ride-shilring
il' < ~.
~
:g_ -N ~ -~ ~

,. ' ...
0
1977 5.1 5.2 5.3 5.4 5.5 5.6
]g78 6.1 6. 2 6. 3
6.4 6.5
6.6 6. 7 6.8 6.9 6.10 6.11 6.12
KEY SCf\f1 lJOCUMf NT~ (ton t i nued)
1977 Regional Transportation Plan Environmental Imp<~ct Report for the 1977 RTP Regional Short Range Transit Plcln Air Qu<1lity Impact of Lociil, State and Federal Plans Ground Access of Airports in the SCAG Region The Developm<.>nt of a Oisaggregate Behavioral Wor~ Mode Choice Model
1978 Regional T•·ansportation Plan [nvironmental Impact Report for the 1978 RTP San l!erni!rdino Freeway Express Busway, Evaluation of Hhed Mode
Operations, Final Report Air Quality Management Plan, Draft Prospettus for the SCAG Rei] ion (A Multi-Yeat' Hationale for the ~CAG Planning Work Program) Inventory of Para transit Services Vols. I-VIII 1978 Transportation Systems Management Report Regional Transit oevelop1nent Program SCAG Regional Airport System Plan Status, Draft 1978 Regional Transportation Plan Amendment Draft Environmental Impact Report Supplement to the Draft Jg78 RTP Amendment Come Together Ridesharing Progra1n Draft Report
SCAG SCAG SCAG SCAG SCAG Cambridge Systematics
SCAG SCAG
Crain and Associates SCAG
SCAG SCAG SCAG SCAG SCAG SCAG SCAG SCAG
Plan Impilct Transit Impact, Air Quality Aviation Plan De,velopment
Plan Impact
Ride-sharing Air Quality
Plan Development Ride-sharing TSM Transit Aviation Plan Impact Rideshari ng
~ m < ~.
~ m ~ -~ N ~ ~ ~ ~

IMPERIAL COUNTY
APPENDIX N SUBREGIONAL PLANS
CONTRIBUTING TO RTP DEVELOPMENT
Imperial Valley Association of Governments(IVAG)
o Public Transportation Element. September~ 1978.
Revised 1/25/79
o Im erial Count Subre ional Trans ortation Plan, prepared for Imperial Valley Association of Governments !VAG by Wilbur Smith and Associates. April, 1975.
LOS ANGELES COUNTY
County of Los Angeles
o Short-Range Transportation Plan for Los Angeles Cour1ty, by Los Angeles County Road Department. January 15, 1975.
o Plan of Bikeways {a sub-element of the Transportation Element) and final environmental impact report, by Los Angeles County Department of Regional Planning. July 30, 1975.
o Environmental Development Guide: General Plan Program, by Los Angeles County Regional Planning Commission. February, 1972.
o Noise Element, proposed element, draft environmental impact report for Los Angeles County General Plan, Los Angeles County Board of Supervisors. Adopted January 31, 1975.
o Safety Element, proposed element, draft environmental impact report for Los Angeles County General Plan, Los Angeles County Board of Supervisors. Adopted January 1, 1975.
o Scenic Highway Element, proposed element, draft environmental report for Los Angeles County General Plan. Los Angeles County Board of Supervisors. Adopted January 31, 1975.
o Draft Transportation Element, Los Angeles County Proposed General Plan, Department of Regional Planning. August, 1978.
City of Los Angeles
o Citywide Plan, City of Los Angeles, Department of Planning. April 3, 197 4.
o Circulation Distribution Program Phase One, the los Angeles Bunker Hill and Central Business District, a report prepared for the Community Redevelopuent Agency (Cfl.A) •. ~ugust, 1975.
o Circulation Distribution Program Phase One Community Participation ... The Los Angeles Bunker Hill and Central Business District, a report for the Community Redevelopment Agency(CRA). August, 1975.
A-41
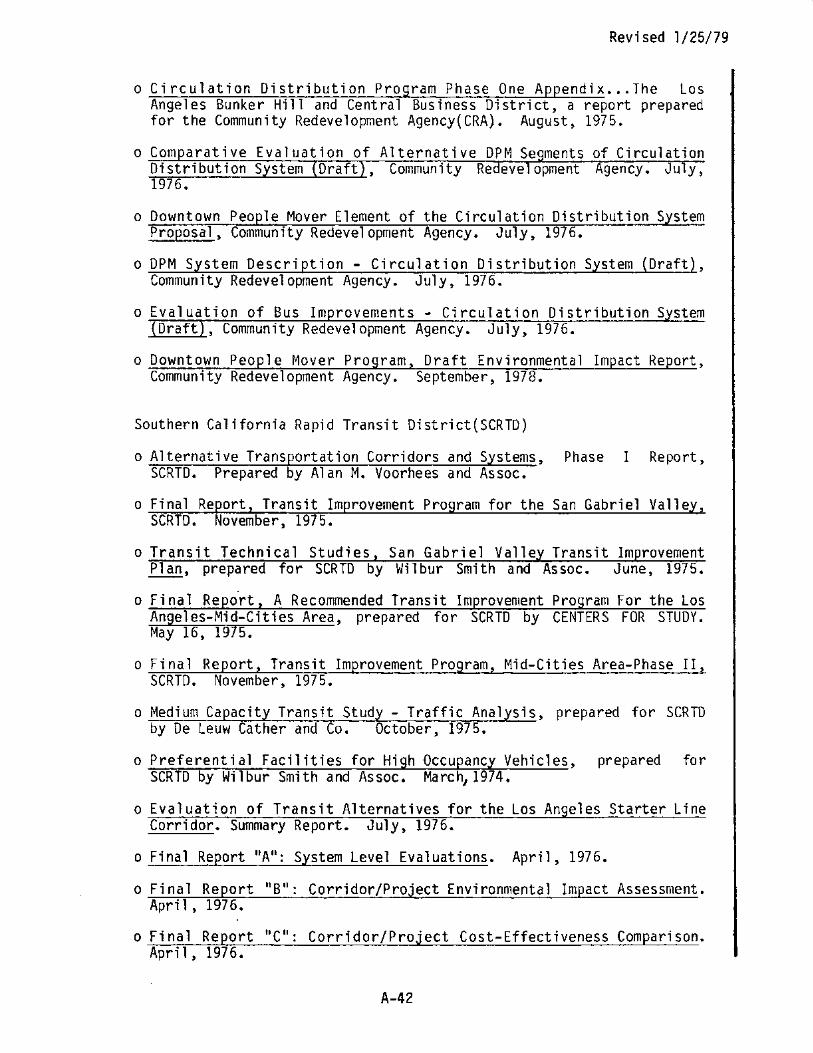
Revised 1/25/79
o Circulation Distribution Program Phase One Appendix •.. The los Angeles Bunker Hill and Central Business District, a report prepared for the Community Redevelopment Agency(CRA). August, 1975.
o Downtown People Mover Element of the Circulation Distribution System Proposal, Community Redevelopment Agency. July, 1976.
o DPM System Description- Circulation Distribution System (Draft), Community Redevelopment Agency. July, 1976.
a Evaluation of Bus Im rovements- Circulation DistributionS stem Draft , Community Redevelopment Agency. July, 1976.
o Downtown People Mover Program, Draft Environmental Impact Report, Community Redevelopment Agency. September, 1978.
Southern California Rapid Transit District(SCRTD)
o Alternative Transportation Corridors and Systems, Phase I Report, SCRTD. Prepared by Alan M. Voorhees and Assoc.
o Final Report, Transit Improvement Program for the San Gabriel Valley, SCRTD. November, 1975.
o Transit Technical Studies, San Gabriel Valley Transit Improvement Plan, prepared for SCRTD by Wilbur Smith and Assoc. June, 1975.
o Final Repo.rt, A Recommended Transit Improvement Program For the Los Angeles-Mid-Cities Area, prepared for SCRTD by CENTERS FOR STUDY. May 16, 1975.
o Final Report, Transit Improvement Program, Mid-Cities Area-Phase II, SCRTD. November, 1975.
o Medium Capacity Transit Study - Traffic Analysis, prepared for SCRTD by De Leuw Cather and Co. October, 1975.
o Preferential Facilities for High Occupancy Vehicles, prepared for SCRTD by Wilbur Smith and Assoc. March1 1974.
o Evaluation of Transit Alternatives for the Los Angeles Starter Line Corridor. Summary Report. July, 1976.
o Final Report 11A": System Level Evaluations. April, 1976.
o Final Report 11 B": Corridor/Project Environmental Impact Assessment. April, 1976.
o Final Report "C 11: Corridor/Project Cost-Effectiveness Comparison.
April, 1976.
A-42

Revised l/25/79
o Application for Preliminary Engineering. September, 1976.
o SCRTD Resolution R-74-12. Adoption of Transportation Goals and Objectives Policy Statement for Submission to Los Angeles County Citizens' Planning CounciL January, 1974.
o Technical Analysis of Rapid Transit Alternatives for Los Angeles. Summary Report. 1976.
o Short Range Transit Plan, Annual, FY 1977, FY 1978.
ORANGE COUNTY
Orange County Multi-Modal Transportation Committee (MMTC)
County of
o South East Orange County Circulation Study, prepared by VTN/AMV, August 15, 1975.
Orange County Transit District (OCTO)
o Orange County Transit District Alternative Transit Corridors Study, Vol. I and Vol. II, prepared for OCTD by VTN/AMV. May I975.
o Orange County Transit District County-Wide Market Research Study, prepared by Decision Making Information Inc. November, 1974.
o Short-Range Transit Plan and Transportation Improvement Program, Annual, FY 1977, FY 1978.
o FY 1977 Short-Range Transit Plan; Appendices. September, 1976.
RIVERSIDE COUNTY
County of Riverside
o A Five-Year Transit Development Program For ••• The Urban Portion of Riverside Co. Area I; The Western Portion of Riverside Co. Area II, The Coachella Valley of Riverside Co., Area III; The Palo Verde V a 11 ey of Riverside County, Area IV. Prepared by A 1 an M. Voorhees and Assoc. June, 1974.
o Riverside Countywide Transportation Study, Final Report, prepared for Riverside Co. by Alan M. Voorhees and Assoc. May, 1975.
o A Five-Year Transit Development Program for Riverside County, prepared by Riverside County Road Dept. June, 1975.
o Riverside Countywide Transportation Plan, Subregional Update, 1976, Fi na 1 Report, prepared by the Riverside County Road Department. September, 1975.
A-43

Revised 1/25/79
o Riverside Countywide Transportation Study, Final Report, prepared for Riverside Co. by Alan M. Voorhees and Assoc. May, 1975.
o A Five-Year Transit Development Program for Riverside County, prepared by Riverside County Road Dept. June, 1975.
o Riverside Countywide Transportation Plan, Subregional Update, 1976, Final Report, prepared by the Riverside County Road Department. September, 1975.
o Riverside Countywide Transportation Plan, Subregional Update, 1976, Final Re~ort 1 for ••• The Urban Portion of Riverside Co.f Area I; The Western ort1on of Riverside Co., Area II; The Coache Ia Valle* of Riverside Co., Area III; The Palo Verde Valley of Riverside Co.,rea IV. Prepared by Riverside County Road Dept. September, 1975.
o Riverside Countywide Transportation Study; Final Report, prepared for Riverside County and its incorporated cities by Alan M. Voorhees and Associates. 1977 Update.
o 1976 Riverside County Subregional Short-Range Transit Plan, by Rivers;de County Planning Department. Approved by the Riverside County Advisory Transportation Committee, July 19, 1976.
o Elderly and Department.
Handicapped Transit August, 1978.
SAN BERNARDINO COUNTY
Needs Study,
San Bernardino Associated Governments(SANBAG)
Riverside County Road
o Goals Summary, A Report to the San Bernardino Associated Governments, by Alan M. Voorhees and Assoc.
o A Trans ortation Plan for San Bernardino Count , ••• A Look at 1990 ec n1ca Report, prepared by SANBAG, CAL RANS D1strict 8 , and A an
M. Voorhees and Assoc. January, 1975.
o A Trans ortation Plan for xecut1ve ummary, prepared
Alan M. Voorhees and Assoc.
• •• A Look at 1990, 1 str1ct
o Transit Development Program for San Bernardino County, prepared for SANBAG by Alan M. Voorhees and Assoc. July, 1974.
o Transportation Plan Update Assessment, SANBAG. October, 1975.
o Short-Range Transit Plan, (SANBAG), Annual, FY 1976, FY 1978.
o Elderl or
A-44
prepared

Revised l/25/79
VENTURA COUNTY
Ventura County Association of Governments(VCAG)
o Transportation Plan, Ventura County, Annual, 1975, 1976, 1977, 1978.
A-45

)>
' ~ "'
Clean Air Act Reasonably Available Control Measures
• lnsp&tion/Maintenance
• Vapor Recovery
• Improved Public Transit
REASONABLY AVAILABLE CONTROL MEASURES COMPARISON OF SOUTH COAST AIR BASIN AQMP MOBILE SOURCE CONTROL MEASURES
TO THE TRANSPORTATION CONTROLS LISTED IN SECTION 108 OF THE CLEAN AIR ACT AMENDMENTS
Mopt<O ,.,,.,,,., ~;~~~~-~:sures o e ' l....,"talloo I< "'' Studied for. Possible
Measures Considered """"9 ::;- lnclusion in later Plan in the 1\naiYsis '"' Amendments Conments - ~~!~s~:'! on a~~. -
Maintenance of Light-Duty & -Expanded Vehicle Warranties A change of Ownership r~edium Duty Vehicles {Annual -1/M of Non-Light Duty Vehicles Program is currently Marketing) -Complementary Roadside underway H-114 l/M for Govt. Vehicle H-114 Ins ection
H~62 Marine vapor Recovery H~62 ~Drain Piston Aircraft tngfne SCAQMD has existing Operations Fuel (Pre~and post~flight) vapor recovery rules for H~12 Fuel Transfer at Jet -Control Purging and gas stations and marine airports Ballisting of Ships in Coastal petroleum transfers H~24 Improved Emission Waters controls for Motor Vehicles H~24 ~Bladd:~ttanks on Piston Engine
Air a
H~85 Freeway Facility and H-85 -Priority Treatment of Transit The baseline RTP Transit Transit Improvements on Streets and Roads Element maintains the Supporting High Occupancy -Additional Fi~ed Guid!!l;ay for current level of service. Vehicle Movement Transit H-B7 Los Angeles Downtown H-87 -Other Improvements to Increase People Mover Transit Use H-89 Transit Improvements H-89 H-63 Expanded Transit Level of Service H-71 Increase Use of Rail, Air, and Bus for Intercity Travel H-76 Paratransit H-41 Reduced Transit Fares H-102 Improve Bus Movement on Urban Street H-109 Increase Bus Benches and Bus Shelters H-117 Santa Ana Transporta-tion Corridor
' I ' '
Rationale for E~tclusion from AQMP
H~12 Absolute emission reduction is insignificant
H-63 Operating cost limitations preclude this tactic as finan~ cially feasible, especially if H-85 & H-89 are implemented.
H-71 Implementation not possible by 1982. By 1987, this measure would only result in the reduc-ti on of one ton of NOx. The cost of this measure is undeter-mined but expected to be very high. Phasing delays prohibit its immediate implementation. H-41 Transit operators in the region strongly oppose this measure based on its lack of financial feasibility. Additional deficit operations could ulti-mctely result in the cutback of essential transit services. There are limited funds available for this program, and there is a State Con-stitutional barrier to using any gas tax revenue to finance transit operating and main-tenance cost>. H-75 Undetennined emission reductions and costs.
"' " < ~.
~
8. ~ -N
"~ -~ <0
l;; , m z
" ->< 0

0 • ,,;;:: """ o·~ .,
""" ". -o~
~c.. 0:
"~ "0 " n>4- <: .... • 00
""""'~"' .._.! ~~ "'""' ~ 0: :5Bg~
0 ....,_,..,
~
' • ~"" 0' o-u' -· ~~ "" • •o <·e
" 0 • "" ,. •o • ·~ >
~ " ' • ~'
j~
0 0
" " ·~ ::;.., ·~ ~o-••" ., ,
.., ·~ Q.
•" - O< •e --~ E~'"' , " ::l§i!!§ !!!::::; .. -.::;
000
..... "''"' "'"'C"'C·..., ~E:;;.g
'
• < ..• "' 00
.,1!15 .. " 00 000 Noo .,~~ . " " .. • oo ,, ""• ,. " ••• """"!" "WO
' ' 0 ··-
" " 0 •o Ue
" 00 e·e . " -~-:;: " . "" •
Revised 1/25/79
Ae47
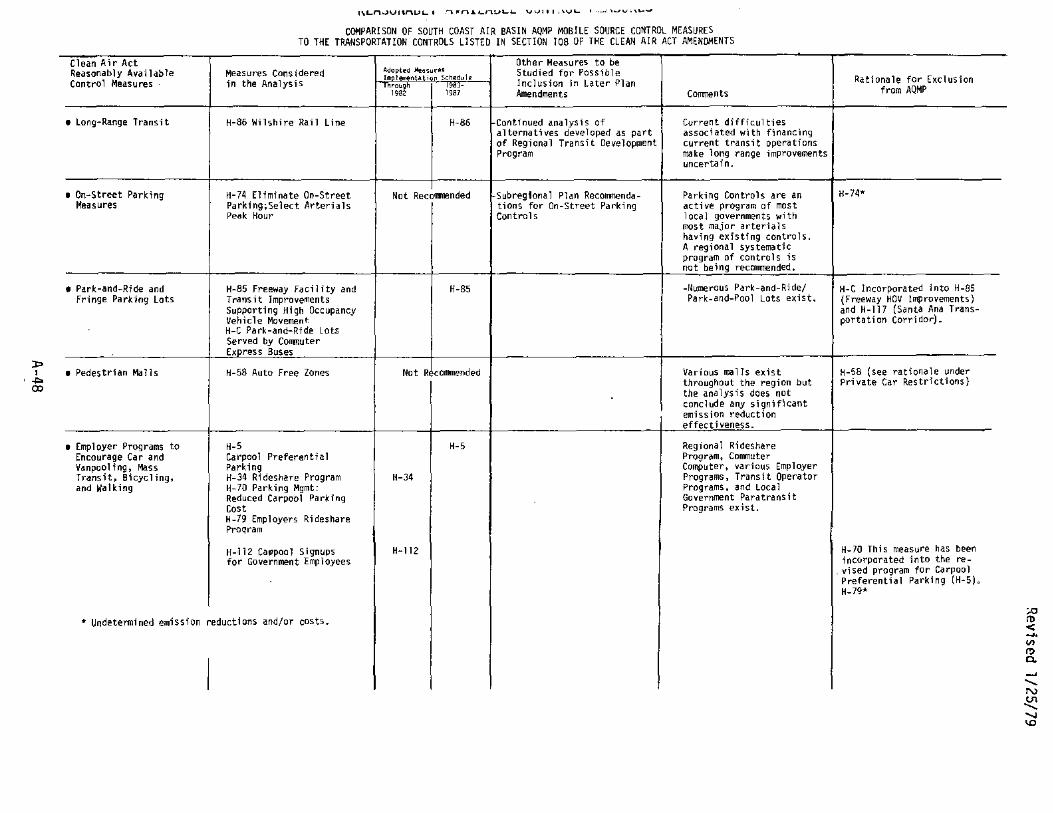
"" ' t;
o~Ln...>UI1nL>L 1 -. • .-. .. ._nv'-'- "''''' ,>v<- • ,_,,~..,., .... ~
COMPARISON OF SOUTH COAST AIR BASIN AQMP M{)BlLE SOURCE CONTROL MEASURES TO THE TRANSPORTATION CONTROLS LISTED IN SECTION 108 OF THE CLEAN AIR ACT AMEN[llo!ENTS
Clean Air Act Other Measures to be Reasonably Available Measures Considered /I.Oo~t.O II!!O'"C" Studied for Possible Control Measures in the Analysis ' lement•t•on Sch•d"l' Inclusion in Later Plan
'0"~ -198~ I 981 Amendments Cormnents
1 Long-Range Transit H-86 Wilshire Rail Line H-86 Continued analysis of Current diffi<:ul ties alternatives developed as part associated with financing of Regional Transit Development current transit operations Program make long range improvements
uncertain.
1 On-Street Parking H-74 Eliminate On-Street Not Reco~~~~~ended Subregional Plan Recormoenda- Parking Controls are an Measures Parking;Select Arterials tions for On-Street Parking active program of most
Peak Hour Contra 1 s l oca 1 governments with most major arterials having existing controls. A regional systematic program of controls is not being reconmended,
• Park-and-Ride and H-85 Freeway Facility and H-85 -r•umerous Park-and-Ride/ Fringe Parking Lots Transit Improvements Park-and-Pool Lots exist.
Supporting High Occupancy Vehicle Movement H-C Park-and-Ride Lots Served by CO!IIlluter (~press Buses
1 Pedestrian Malls H-58 Auto Free Zones Not R conmended Various malls exist throughout the region but the analysis does not conclude any significant emission reduction effectiveness.
1 Employer Programs to "·' "-5 Regional Rideshare Encourage Car and Carpool Preferential Program, Co11111uter Vanpooling, Mass Parking Computer, various Employer Transit, Bicycling, H-34 Rideshare Program H-34 Programs, Transit Operator and Walking H-70 Parking Mgmt: Programs, and Loca 1
Reduced Carpool Parking Government Paratransit Cost Programs exist. H-79 Employers Rideshare Proqram
H-112 Cavpool Signups H-112 for Government Employees
* Undetellllined emission reductions and/or costs.
I
Rationale for Exclusion from AQMP
H-74*
-H-C Incorporated into H-85 (Freeway HOV l~rovements) and H-117 (Santa Ana Trans-portati on Corridor).
H-58 (see rationale under Private Car Restrictions}
H-70 This measure has been incorporated into the re-
. vised program for Carpool Preferential Parking (H-5}. H-79*
'" ~ < -· ~ , c. -~ N
!i2 ..... ~
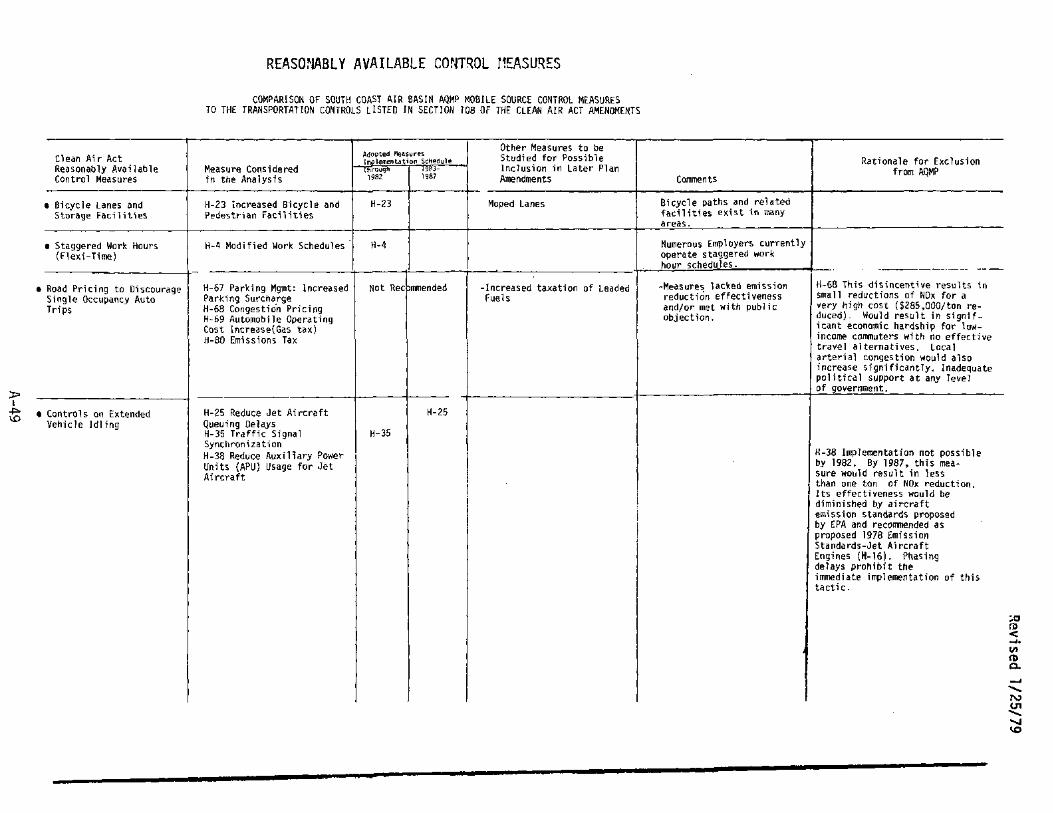
;p
' ;'i;
Clean Air Act Reasonably Available Control Measures
• Bicycle Lanes and Storage Facilities
1 Staggered Wor~ Hours (Flexi-Time)
• Road Pricing to Discourage Single Occupancy Auto Trips
• Controls on Extended Vehicle ldl ing
RE~SONABLY AVAILABLE CONHOL t!EASU~ES
COMPM!SON OF SOUTH COAST AIR BASIN AQMP MOBILE SOURCE CONTROl MEASURES TO THE TRANSPORTATION CONTROLS LISTED IN SECTION 106 Of THE CLEM AIR ACT AMENDMENTS
Measure Considered in the Analysis
H-23 increast!d Bicycle and Pedestrian Facilities
H-~ Modified Work Schedules
H-67 Parking Mgmt: Increased Parking Surcharge H-68 CongestiOn Pricing H-69 Automobile Operating Cost lnuease(Gas tax) H-80 Emissions Tax
H-25 Reduce Jet Aircraft Queuing Oeli!Ys H-35 Traffic Signal Synchronization H-38 Reduce Auxiliary Power Units (APU) usage for Jet Aircraft
Adooted ,. .. ,_., '""'l'""""t;oo sc••oulo ~~;;~~q" I :;~~-
H-23
H-4
Not RecbRJI1ended
H-25
H-35
Other Measures to be Studied for Possible Inclusion in Later Pla.n Amendments
Moped Lanes
-Increased taxation of Leaded Fuels
Comments
Bicycle paths and related facilities exht in lllilriY areas.
Numerous Employen currently operate staggered work hour schedules.
-Measures ]ac~ed emission reductiOn effect1veness and/or met with public objection.
Rationale for Exclusion from 1\QMP
H-68 This disincentive results in small reductions of NOx for a very high cost ($285,000/ton reduced). Would result in significant economic hardship for lOJWincome coRJI1uters with no effective travel alternatives. Local arterial congestion would also increase significantly. ln~dequate political support at any level of government.
H-38 Implementation not possible by 1982. By 1987, this measure would result in less than one ton of NOx reduction. Its effectiveness would be diminished by aircraft emission standards proposed by EPA and recorrrnended as proposed 1978 Emission Standards-Jet Aircraft Engines (lt-16). Phasing delays prohibit the immediate implementation of this tactic.
'" ~ < ~.
~
"' 0.
~ ..... N
~ .... <o

)>
' ~ 0
Clea~ Air Act Reasonably Available Control Measures
• Traffic Flot~ Improvements
REASOI:ABLY AVAILABLE CONTROL r:EASURES
COMPARISON OF SOUTH COAST AIR BASIN AQMP MOBIL£ SOURCE CONTROL MEASURES TO THE TRANSPORTATION CONTROLS LISTED IN SECTION 108 OF THE CLEAN AIR ACT PMENDMENTS
Measures Ccosidered in the Analysis
H~J Triple Trailer Trucking H-35 Traffic Signal Synchronization H-72 Improved Trucking Hficiency H-73 Increase Truck Trailer P1ggy Backing on Rail H-77 Expand Capacity and !111prove Flow on Highway !ietwDrk H-88 Congestion ReliefFreeway Widenings H-96 Improve Traffic Flow Through One Way Streets and Intersection Modifications H-97 Peak Period Truck Restrictions H-103 Jmprove access to and Within Major Airports H-107 Restrictions on Truck Delivery During Peak Hours H-118 Reduce Non-Recurrent Congestion H-0 Metered Ramps By-Pass Lanes
"""9"~ ~~"'"""' lmplo<n .. totlOo Stn<d,l•
~~;:;~g" I :m-,_,
H-35
IJ-72
H-88
H-118
Other Measures to be Studied for Possible Inclusion in Later Pl~n Amend,.-,ents
-Subregional P1an Recorm~endat1ons on Traffic Flow Improvements
-Exclushe Truck lanes and Routes
-Freeway-to- Freeway Metering
Conments
-Pilot Freeway-to-Freeway Metering Projects are currently under ~evelopment
-The Base RTP ca I ls for the completion of 1150 metered ramps by I 987 with 350 By-passes by
1982.
* Undetermined emission reductions and( or costs,
Rationale for Exclusion from AQMP
H-73 Implementation of additional piggy backing is not feasible by 1982. Additional study of this measure is needed to determine its effectiveness. The lack of flexible rail destination points limits the application of this measure to selected port operations. H-77 This program has been incorporated into the revised program for congestion relief- Highway Widenings (H-88). Much of the reductions which would occur due to H-77 wnl be realized if H-88 is implemented. H-96* H-97* H-103* H-107* H-D Now in AQMP Baseline
"" ro < ~.
~
ro ~ -~ ~ ~ ~
~
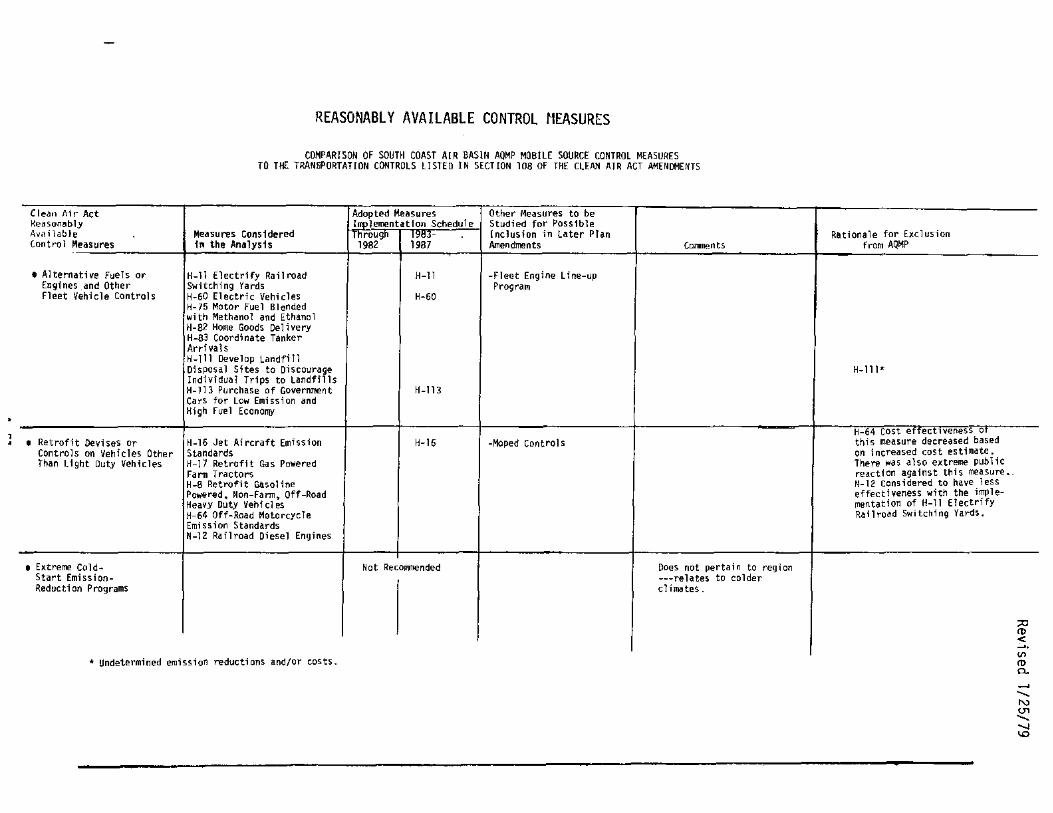
REASONABLY AVAILABLE CONTROL flEASURES
COMPARISON OF SOUTH COAST AIR BAS!Il AQMP MOBILE SOURCE CONTROL MEASURES TO TilE TRAN!iPORTATION CONTROLS liSTED IN SECTION lOS OF THE CLEAN AIR ACT AMENDMENTS
Cle~n Air Act Adopted Measures Other Measures to be ~e~son~bly llf4li_ementatlon Schedule Studied for Possible A•~ilable Measures Considered ~~~~aug 1~~r
Inclusion in later Plan Contr!)l Measures In the Analysis 1982 Amendments Cmm~ents
• Alternative Fuels or H-11 Electrify Railroad H-11 -Fleet Engine Line-up E~glnes and Other Switching Yards Program Fleet Vehicle Controls H-60 Electric Vehicles H-60
H-75 Motor Fuel Blended with Methanol and Ethanol H-82 Home Goods Delivery H-83 Coordinate Tanker Arrivals H-111 Develop Landfill Disposal Sites to Discourage Individual Trips to Landfills H-113 Purchase of Government H~113
Cars for Low Emission and High fuel ECOnOITIY
• Retrofit Devises or H-16 Jet Aircraft Emission H~16 -Moped Controls Controls on Vehicles Other Standards Than Ltght Duty Vehicles IH 7 Retrofit Gas Powered
Farm Tractors H~8 Retrofit Gasoline Powered. Non~Fann, Off~Road Heavy Duty Vehicl!!S H~64 Off~Road MotorcYcle Emission Standards N~12 Railroad Diesel Engines
• Extreme Cold- Not Recomended Does not pertain to region Start Emission- ---relates to colder Reduction Programs dimtes.
• Undetermined emission reductions and/or costs.
Rationale for Exclusion from AQMP
H~lll~
H~64 cost e ect1Veness o this measure decreased based on increased cost estimate. There was also extreme public reaction against this measure •. N-12 cons ide red to have 1 ess effectiveness with the imple~ mentation of H~ll Electrify Railroad Switching Yards.
"' "' < ~.
~
"' ~ -~ "' ~ "' ~

)>
' ~ N
OTHER SOUTH COAST AIR BASIN AQMP MOBILE SOURCE CONTROL MEASURES CONSIDERED
Other Adopted Contra 1 Measures
H-1 Increased Air Passenger Load Factor H-2 Jet Aircraft Ground Taxi Improvements H-7 Emission Standards-New Off-Road Heavy Duty Non-Farm Equipment H-15 Emission Standards-New Farm Equipment H-36 Voluntary Retirement of Older Cars
Measures Not Included in AQMP
H-10 Tow Jet Aircraft H-66 Tax Bunker Fuel H-78 Incorporate Non-Residential Uses into Residential Areas H-84 Pipeline Freight Transport H-104 Develop Design Standards for New Parking Facilities H-108 Parking Management Plan (City of los Angeles) H-116 Identify and Cluster Trip Attractions
)>
" ·o '" "' "' ~ X
0
il' < ~.
~ m ~ -~ N ~ ~
"' ~

9.0 GLOSSARY OF TERMS
Tenn
Accessibility
Full Accessibility
Action
Arterial
Article 19
Barrier Reduction
Bus-on-Freeway
Bypass
Carpool
Definition
Characteristic of the transportation system itself and not of users of that system. It relates to the geographic coverage of the system, time of operation, the way various transportation 1 inks connect, and the travel time required to reach any area within the region.
That characteristic of both demand-responsive and fixed-route systems that allows the maximum number of disabled persons in each disability category to move freely, unencumbered by barriers, on and between systems,from origin to desired destination. Specifically, full accessibility has three components:
1. Access to vehicles,
2. Access within and between modes,
3. Access to opportunities.
In practice, conversion of existing services and facilities to a higher 1 evel of accessibility can be accomplished by eliminating travel barri~rs associated with each of these three components.
A specific activity to be undertaken in the near-term as a step toward achieving a particular policy or objective.
General term denoting a roadway primarily for through traffic, usually on a continuous route.
Article of the State Constitution. Designates how State taxes on motor fuel and motor vehicles may be used for streets and highways and guideway transit,
Planning or action to reduce or eliminate impediments to movement by the elderly and physically handicapped in transportation systems and public facilities, or in the design thereof.
Line-haul express bus service on existing and future freeways.
A reserved traffic lane in a metered freeway ramp entry which permits buses or high-occupancy vehicles to bypass the ramp traffic control signal when entering the freeway.
Prearranged automobile ride-sharing.
9-1

Ci rcul at ion/ Distribution System
Community Level Transit
Commuter Computer
Commuter Rail
Constrained/ Unconstrained Financial Plan
County Transportation Commission
Di si ncent i ves
Demand-Responsive/ System
Dial-A-Ride
Directional Flow Experiments
Efficiency Standards
Provision of transit service in an activity center (such as downtown Los Angeles or Westwood) for improved intra-area circulation. May involve use of such measures as pedestrian overcrossings, mini-buses, or moving sidewalks. One element of the Regional Transit Development Program is a circulation/distribution system for the Bunker Hill-Central Business District area of Los Angeles.
System providing transit service within a local community.
Common name for non-profit corporation Commuter Transportation Services, Inc., which provides information to aid the formation of carpools and ride sharing.
Operation of rai 1 service on existing rail road lines for service to commuters.
The 1977 RTP has both a constrained and an unconstrained financial plan. The constrained plan limits construction, maintenance, and operation of the transportation system to that which can be funded without increasing taxes and using available state and federal funds. The unconstrained plan is the cost of funding all improvements recommended in the RTP. To fund this total package would require an increase in taxes.
AB-1246 created County Transportation Commissions in Los Angeles, Orange, Riverside and San Bernardino Counties for the purpose of short-range transportation planning. SCAG will be working closely with these commissions.
Measures designed to discourage certain actions or behavior. These include: parking surcharges, increased gasoline taxes (if intended to decrease travel), and ramp metering.
A transportation system which responds to the requests of users; may be non-stop or multistop service to destinations, e.g., Dial-aRide, taxi.
Transit service where individual trips are scheduled by means of a telephone call. The service is flexible, only responds to demands, and is usually provided by a van or mini-bus.
Use of one-way traffic flow on selected major arterials to accanmodate peak hour traffic and decrease travel time.
Criteria used to measure the operating efficiency of transit systems in tenns of service provided and costs involved.
9-2

Elderly
E/H Interim Program
Express Busway
Facility
Fixed-Guideway System
Fixed-Route Transit Service
Free-Flow Condition
General Aviation
Goal
Ground Access
Growth Forecast Policy
Handicapped
Persons 60 years of age or older.
A SCAG 1 nterim or near-term program to provide more accessible transportation to the elderly and the handicapped through identifying and eliminating barriers to travel on existing transit systems and identifying transportation services by other than municipal and district systems.
An exclusive freeway 1 ane either separated from or on one of the lanes of the freeway, i.e., the San Bernardino Freeway Express Busway, that allows buses to operate separate from normal traffic.
A facility allowing a transportation mode to operate (including travel, as well as discharge and 1 oad i ng of pasengers). This inc 1 udes highways, guideways, tenninals, and administrative support facilities.
A transit system with an exclusive guideway. This could be a rail transit system, a separated roadway for use of buses only, or other means of providing a separate right-of-way for transit.
Scheduled service operating repeatedly over the same street or highway pattern on a determined schedule.
Freeway condition where traffic flow is uninterrupted by stopping or excessive slowing.
All aircraft which are not commercial airlines, air-carrier aircraft or military aircraft.
A goal describes a desired condition or set of conditions toward which effort should be directed.
Ability of air passengers and air freight handlers to reach airport terminals through use of automobile, public transit, taxi, or other means of ground surface.
SCAG adopts forecasts of future population, housing, land use and employment which modify current trends. These growth forecast policies then become the basis for planning, grant reviews and sizing future public facilities.
Those individuals who, by reason of illness, injury, age, congenital malfunction, developmental disabilities, or other permanent or temporary incapacity or disability, including
9-3

Handicapped (Continued)
High-Occupancy Vehicle (HOV)
Incentives
Inspection Maintenance Program
Institutional Arrangements
Inter-modal Transfer Points
Jitney
Joint Powers Authority
Light-Duty Vehicle
Local Transportation Fund
Maintenance/ Rehabilitation
those who are non-ambulatory wheel chairbound and those with semi-ambulatory capabilities, are unable without special facilities or special planning and design to utll ize mass transportation facilities and services as effectively as persons \'lho are not so affected.
f1otor vehicle occupied by two or Vehicles include automobiles, and taxis.
more persons. vans, buses,
~1easures designed to encourage certain actions or behavior. These include inducements for the use of carpools, buses, and other highoccupancy vehicles in place of single-occupant automobile travel, e.g., preferential freeway lanes and parking, ramp bypasses, bus passes.
A program of periodic vehicle inspections to reduce air pollution. If, upon inspection, certain emission standards are exceeded, specific vehicle maintenance would be recommended, e.g., tune up, catalytic converter replacement.
The method of coordinating between agencies involved in related activities. This includes formal and/or operational relationships between transportation services, facilities, and control.
Transportation terminals or locations where people can change their travel from one mode to another, i.e., auto to bus, bus to airline, etc.
Motor vehicle operating continuously over a fixed route and supplying service to passengers who hail a ride any place along the routes.
A 1 egally binding agreement between two or more units of government which establishes a multi-jurisdictional special district with specified powers and responsibilities.
Any motor vehicle weighing 6,000 pounds or less (most passenger automobiles).
Pool of funds from state sales tax established by SB-325 and SB-821 for local transportation purposes, e.g., community level bus system, bikeways.
Activities associated with keeping the existing transportation system in a safe and usable state and protecting the pub 1 i c' s investment.
9-4

Maritime
Memorandum of Understanding
Metro
Missing Link
Mixed Flow
Mobility
Mode
Multi-modal
Non-rnotori zed
Objective
Off-Road Vehicle
Operator
Paratransit
Transportation facilities or operations relating to ports~ harbors, and water travel.
Formal document between agencies defining interagency coordination and agency respons i bi 1-ities. The SCAG public transit operator Memorandum of Understanding is an example.
Geographic area which is reasonably self-sufficient and geographically cohesive. It may or may not be encompassed by a single political boundary, e.g., the Wilshire District of Los Angeles or the City of San Bernardino.
A sect ion of roadway to be constructed to freeway or expressway standards connected to completed portions of a designated route or connecting a constructed portion of a designated rote to one other major facility where the proposed section is less than six miles in length and provides a continuity of service in an established travel corridor.
Traffic movement having autos, trucks, buses, and motorcycles sharing traffic lanes.
Mobility is a transportation system user characteristic. It refers to the ability of the user to take advantage of the available transportation services.
A means or method of conveyance, e.g., auto, airplane, bicycle, bus, etc.
Involving more than one mode of travel.
Transportation that is not powered by a motor, e.g., horseback riding, bicycling, hiking, walking, etc.
Precise and quantifiable statements of ends to be achieved in advancing toward goals.
Vehicles which do not operate on the public road and highway system, e.g., dirt bikes, sno~obiles, fann machinery, construction equipment.
Agency responsible for providing a service or operating a facility, e.g., SCRTD is a transit operator, CALTRANS is the operator of the state highway system.
Those types of public transportation whose characteristics are between those of the private automobile and conventional scheduled transit, e.g., taxis, jitneys, dial-a-ride-, carpools, vanpools, subscription bus service.
9-5

Parking Management Strategies
Peak Period
Phased DecisionMaking
People Mover
Person Trip
Planning Policies
Preferent i a 1 Treatment
Preliminary Engineering
Private Sector
Po 1 icy
Project Development
Propos it ion 5
Plan ned procedures whereby automobi 1 e parking in metropo 1 i tan areas is co ntro 11 ed or managed for purposes of controlling traffic~ access, and mobility.
Refers to the time of most intensive use of a service or facility. In terms of travel, generally there is a morning and an afternoon peak on the region 1 s streets and highways.
The phasing of decisions so that actions that are needed in the short-term are taken, but options are not foreclosed for future action.
A public transportation system where waiting time is minimal and usually consists of small vehicles or continuous conveyance operating over short distances, e.g., moving sidewalks, automated cars. A specific type of circulation/distribution system.
A trip made by a person.
Policies which direct the course of future transportation p1 anning in the region.
Privll eged treatment for high-occupancy vehicles and buses in the use of traffic 1 anes, freeway lanes and entry ramps, parking facilities, and traffic control for the purpose of inducing shifts to HOVs and buses.
Engineering design and cost analysis conducted prior to final detailed design and construction.
Non-governmental , profit oriented service providers. The economy minus the governmental sector.
A policy is a guide for decision-making. Policies imply commitment to goals and define courses of action directed toward fulfilling these goals.
Preliminary engineering and environmental assessment conducted prior to the start of project construction.
Ballot proposition adopted in 1974 which allows the use of gas tax funds available to a county area to be diverted to guideway transit use if the voters' county has passed a similar local proposition. In the SCAG region only los Angeles County voters have adopted such a local proposition.
9-6

Public Transit
Ramp Metering
Region
Regional Transit Development Program
Revenue Bond
Route Deviation Service
Section 5
Short-Range Transit Plan
South Coast Air Quality Maintenance Area
Starter Line
Subregion
Subscription Bus Service
Transportation service by bus, rail, paratransit, airplane, and ship offered by an operator on a scheduled basis to the general public.
Traffic signal control on an entry ramp to a freeway for regulating vehicle access.
The SCAG region is composed of Imperial, Los Angeles, Orange, Riverside, San Bernardino, and Ventura counties.
The adopted four-element program for improved transit service consisting of a transportation system management element, regional highlevel bus-on-freeway system, Los Angeles downtown ci rcul at ion-distribution system, and a regional core area rapid transit element.
Bonds whose principal and interest are payable exclusively from earnings of a public enterprise.
A transit system where the transit vehicles purposely deviate from their routes to provide more direct service to their patrons.
The UMTA Act of 1964, as amended by the Urban Mass Transit Assistance Act of 1974, provides a six-year mass transportation assistance program (capital or operating assistance) for urbanized areas apportioned on the basis of a statutory fonnul a.
The five-year plan for development of transit service in the SCAG region.
Area designated by the state for the purpose of air quality planning. The area encompasses portions of Ventura, Los Angeles, Orange and Riverside Counties, contains 97% of the region•s population, and is the most seriously impacted portion of· the region in tenns of air quality.
The initial segment of a fixed-guideway transit system.
A county or other smaller area within the SCAG six-county region.
Prearranged ride sharing of regularly scheduled transportation service, for which passengers generally agree to pay a monthly fee.
9-7

System Development
System Management
System Policies
Traffic Management (Traffic operational Improvements
Transit Corridors
Transit-Dependent
Transit Service Policies
Transportation Systems Management (TSM)
Value Capture Financing
Capital intensive additional development of the transportation system including road construction, rapid transit, expanded ports and new airports.
r~aklng better use of the existing transportation, using such 111ethods as encouraging carpooling, increasing transit ridership, and increasing the carrying capacity of highways, airports and other facilities. Generally, these methods cost 1 ess and can be impl ernented more quickly than system development actions.
Policies applicable to the entire transportat; on system.
Regulation and control of the movement of traffic to expedite flow and reduce congestion. Techniques inc 1 ude signa 1 synchronization and restriping to provide left turn lanes.
A path several miles in 1 ength and one-quarter mile to one mile wide within which line-haul transit service is provided or planned. An example is the Wilshire corridor.
Individual(s) dependent on public transit to meet private mobility needs, e.g., unable to drive, not a car owner, not 1 icensed to drive, etc.
Policies which establish a priority rating for allocation of available resources based on minimum coverage and intensity standards for local service. The first priority is to maintain existing service, second is to improve service to below-standard areas, and third is to support service improvements to abovestandard areas.
An element of the Regional Transportation Plan which addresses short-term improvements to maximize the efficiency of the existing transportation system. Areas for review include traffic engineering, public transportation, regulations, pricing structures, management, and operational improvements (does not include· system development).
Emergent concept based upon the ability to recoup the social and economic benefits created by the construction of a public facility (e.g., transit system), through the amount of income generated from the enhancement--the increased value--of real property. Tax increment financing is one example of a value capture financing technique.
9-8

ADAP AQr~P CAAP E!R FARE HOV TVAG LACTC LARTS DCTC RTDP RTP RCTC SANBAG SBCTC SRTP SCAQMD TSM VCAG
AB-69
AB-402
AB-1246
SB-325 (TDA)
SB-759
SB-821
SB-!687
ACRONYMS
Plans and Programs and Planning Agencies
Airport Oevelopr.Jent Aid Program Air Quality Maintenance Plan California Airport Aid Program Environmental Impact Report Uniform Financial Accounting and Reporting Elements High-Occupancy Vehicle Imperial Valley Association of Governments los Angeles County Transportation Commission Los Angeles Regional Transportation Study Orange County Transportation Commission Regional Transit Development Program Regional Transportation Plan Riverside County Transportation Commission San Bernardino Associated Governments San Bernardino County Transportation Commission Short Range Transit Plan South Coast Air Quality Management District Transportation System Management Ventura County Association of Governments
Legislative/Administrative
Established the state and regional transportation planning process, and mandates the preparation of a regional transportation plan.
Created California Transportation Commission and revised state and regional planning and programming procedures for transportation
Created county transportation commissions in Los Angeles, Orange, Riverside and San Bernardi no Counties.
California Transportation Development Act -- allocates portion of sales tax revenues fa transit and streets and roads.
Amended SB-325 (TDA) program requiring performance audits and other provisions re 1 at i ve to funding 1 i mitations.
Amended SB-325 to create a bicycle-pedestrian program.
Established funding for new (Article 4.5) Communitylevel transit in Los Angeles and Orange Counties from SB-325 moneys.
9-9

CBD
CD
LAX
LOS SAN
MAP
NMHC
NOx
PRT
RSA
VFR
VLF
VMT
Technical Abbreviations
Central Business District
Carbon Monoxide
Los Angeles International Airport
Los Angeles - San Diego Corridor
Millions of Airline Passengers
Non-methane hydrocarbons
Nitrous oxides
Personal Rapid Transit
Regional Statistical Area
Visual Flight Rules
Vehicle License Fee
Vehicle Miles Traveled
9-10