Embed Size (px)
Citation preview

REGIONAL SERVICE COMMISSION
Regional Service Commission 11
2017
Fredericton, NB E3B 5H1
To be submitted to the:Department of Environment and Local Government
Community Finances BranchP.O. Box 6000, 2nd Floor, Marysville Place

Page (i)
X Page RSC-1 is signed and sealed
X
X - Cooperative & Regional Planning Services Fund
X - Local Planning Services Fund
X - Solid Waste Services Fund
X - Electricity Generation Facility Fund
N/A - Other Shared Services Fund
Interest and Principal payments on long term debt are correct
N/A - Cooperative & Regional Planning Services Fund
N/A - Local Planning Services Fund
X - Solid Waste Services Fund
X - Electricity Generation Facility Fund
N/A - Other Shared Services Fund
X Copies have been forwarded to member Municipalities, Rural Communities, Local Service Districts,
Confirmed by: Date:
Title:
Please note: This checklist is part of the Budget Form and must be completed, signed and returned with your budget.
Regional Service Commission Budget
Fund Surplus' and Deficits are brought forward in accordance with paragraphs 27(7) and 27(8) of the Regional Service Delivery Act
the Community Finances Branch and the respective Local Services Manager of the Department of Environment and Local Government
Original Signed by D. R. Fitzgerald
Executive Director
October 25, 2016

OPERATING BUDGET
1. Cooperative & Regional Planning Services Fund (from page CRP-1) 88,177$
2. Local Planning Services Fund (from page LP-1) 1,291,927$
3. Solid Waste Services Fund (from page SW-1) 7,658,700$
4. Electricity Generation Facility Services Fund (from page GF-1) 1,220,954$
5. Other Shared Services Fund (from page OT-1) $
Total Regional Service Commission Operating Budget 10,259,758$
CAPITAL BUDGET
1. Total Capital Cost - Corporate Services (from page CS-1) $
2. Total Capital Cost - Cooperative & Regional Planning Services Fund (from page CRP-1) $
3. Total Capital Cost - Local Planning Services Fund (from page LP-1) 5,000$
4. Total Capital Cost - Solid Waste Services Fund (from page SW-1) 843,000$
5. Total Capital Cost - Electricity Generation Facility Services Fund (from page GF-1) $
6. Total Capital Cost - Other Shared Services Fund (from page OT-1) $
Total Regional Service Commission Capital Budget 848,000$
THIS IS TO CERTIFY that on the 25th day of October, 2016 the Board of the REGIONAL SERVICE COMMISSION 11
RESOLVED that the total operating budget for the Regional Service Commission for the 2017 calendar year would consist of
total Revenue of $ 10,259,758, and total expenditures of $ 10,259,758 and that the capital budget would consist of total
Adopted this 25 th day of October, 2016 by the Board of the REGIONAL SERVICE COMMISSION 11.
Executed this 25th day of October, 2016 by the Executive Director of said Commission.
Chairman
Executive Director
RSC - 1
REGIONAL SERVICE COMMISSION 11
2017 REGIONAL SERVICE COMMISSION OPERATING & CAPITAL BUDGETS
expenditures of $ 848,000.
Original Signed by Judy Wilson-Shee
Original signed by D. R. Fitzgerald

REGIONAL SERVICE COMMISSION 11
Reconciliation of Operating Budget to PSA Budget
Amortization Controlled Other Transfers Total
TCA Entities (Please explain) PSARevenue (Add) (Add) (Add /Subtract) (Add /Subtract) Budget
Member Charges 74,142 1,274,347 2,898,924 4,247,413 4,247,413$
Sales of services 4,635,990 1,100,000 5,735,990 5,735,990$
Government Transfers - -$
Transfers from own and other funds 507,245 507,245 (507,245) -$
Other transfers - -$
Interest 3,000 6,960 9,960 9,960$
Surplus of second previous year 14,035 14,580 101,826 120,294 250,735 (250,735) -$
Other revenue 15,000 660 15,660 15,660$
Total Revenue 507,245 88,177 1,291,927 7,658,700 1,220,954 10,767,003 (757,980) 10,009,023
Expenditures
Governance 62,500 62,500 62,500
Administration 437,978 65,677 544,322 1,318,407 9,200 2,375,584 (507,245) 1,868,339
Regional planning 10,000 10,000 10,000
Regional policing collaboration 2,500 2,500 2,500
Regional emergency measures planning - -
Regional sport, recreation & culture infrastructure planning & cost-sharing 10,000 10,000 10,000
Other services provided to all members - -
Planning and building inspection services 730,905 730,905 9,142 1,000 741,047
Operations - Solid Waste Service 5,579,359 326,089 5,905,448 1,598,600 2,000 7,506,048
Financial Services - -
- Interest 64,475 70,000 134,475 134,475
- Other Financing Charges 6,767 3,000 2,500 4,240 16,507 16,507
- Transfer to the Capital Fund - Debt Repayment 453,709 346,000 799,709 (799,709) -
- Transfer to the Capital Fund - Asset Acquisition 5,500 43,000 48,500 48,500
- Transfer to the Capital Reserve 465,425 465,425 (465,425) -
- Transfer to the Operating Reserve 700 700 (700) -
Closure & Post-closure expense 191,250 191,250 191,250
Second previous year deficit - -
Other Fiscal services 7,500 6,000 13,500 13,500
Total Expenditure 507,245 88,177 1,291,927 7,658,700 1,220,954 10,767,003 1,607,742 - 3,000 (1,773,079) 10,604,666
Surplus (Deficit) - - - - - - (1,607,742) - (3,000) 1,015,099 (595,643)
2017 REGIONAL SERVICE COMMISSION OPERATING BUDGET
Corporate Services Budget
Cooperative & Regional Planning Services Budget
Local Planning Services Budget
Solid Waste Services Budget
Generation Facility Budget
Other Shared Services Budget Subtotal
RSC
-PSA

OPERATING BUDGET
1. Total Corporate Services Budget (from page CS-4) 507,245$
2. Less: Revenue from other sources (from page CS-2) $
Net Budget to be allocated to other funds: 507,245$
Cooperative & Regional Planning Services (to page CRP-3) 65,677$
Local Planning Services (to page LP-3) 152,870$
Solid Waste Services (to page SW-3) 288,698$
Electricity Generation Facility Services (to page GF-3) $
Other Shared Services (to page OT-3) $
Total Allocation 507,245$
CAPITAL BUDGET
Total Capital Cost - Corporate Services (from page CS-Capital) $
Less: Total sources of funds $
Total Long-term borrowing $
CS- 1
REGIONAL SERVICE COMMISSION 11
2017 CORPORATE SERVICES OPERATING & CAPITAL BUDGETS

REGIONAL SERVICE COMMISSION 11
2016 2017BUDGET BUDGET
1.1.0.0.0 CORPORATE SERVICES
1.1.2.0.0 REVENUE FROM OTHER SOURCES
1.1.2.5.0 Government Transfers
1.1.2.5.1 (Specify)……….….…….….…….….…….….……
1.1.2.5.2 (Specify)……….….…….….…….….…….….……
1.1.2.7.0 Other Revenue (Specify)………………………….
1.1.2.T.T TOTAL REVENUE FROM OTHER SOURCES
CS-2
2017 CORPORATE SERVICES OPERATING BUDGET
REVENUE

REGIONAL SERVICE COMMISSION 11
2016 2017BUDGET BUDGET
2.1.0.0.0 CORPORATE SERVICES
2.1.1.0.0 GOVERNANCE
2.1.1.1.0 Board Members
2.1.1.1.1 Honorariums 40,000 40,000
2.1.1.1.2 Travel 13,500 13,500
2.1.1.1.3 Training and Development 3,000 3,000
2.1.1.1.9 Meetings 6,000 6,000
2.1.1.T.T TOTAL GOVERNANCE 62,500 62,500
2.1.2.0.0 ADMINISTRATION
2.1.2.1.0 Executive Director's Office
2.1.2.1.1 Salaries & Benefits 206,717 215,380
2.1.2.1.2 Travel 4,000 4,000
2.1.2.1.3 Training and Development 1,000 1,000
2.1.2.1.9 Memberships and Subscriptions 2,000 2,000
2.1.2.2.0 Human Resources
2.1.2.2.1 Salaries & Benefits
2.1.2.2.2 Travel
2.1.2.2.3 Training and Development
2.1.2.2.9 Other (Specify)……………………………
2.1.2.3.0 Financial Management
2.1.2.3.1 Salaries & Benefits 116,028 102,298
2.1.2.3.2 Travel
2.1.2.3.3 Training and Development 1,000 1,000
2.1.2.3.5 External Audit Fees 19,500 19,500
2.1.2.3.6 External Accounting Fees
2.1.2.3.7 Other Financial Management
2.1.2.3.9 Other (Specify)……………………………
2.1.2.4.0 Other Administration Services
2.1.2.4.1 Advertising and Public Relations 2,500 2,500
2.1.2.4.2 46,000 46,000
2.1.2.4.3 Professional Services 8,000 16,000
2.1.2.4.4 Legal Services 6,000 6,000
2.1.2.4.5 Office Building 4,000 4,000
2.1.2.4.6 Office Equipment & Supplies 5,000 5,000
2.1.2.4.7 Printing and Copying 1,000 1,000
2.1.2.4.8 Telecommunications 2,300 2,300
2.1.2.4.9 Translation 10,000 10,000
2.1.2.T.T 435,045 437,978
2.1.4.0.0 FISCAL SERVICES
2.1.4.1.0 Interest
2.1.4.1.1 Current Operations
CS-3
EXPENDITURE
2017 CORPORATE SERVICES OPERATING BUDGET
Liability Insurance
TOTAL ADMINISTRATION

REGIONAL SERVICE COMMISSION ______________________________________________
2016 2017BUDGET BUDGET
2.1.4.1.2 Short-Term borrowing for capital projects
2.1.4.1.3 Long-Term Debt
2.1.4.2.0 Other Financing Charges
2.1.4.2.3 Banking Service Charge 3,500 3,500
2.1.4.2.9 Other (Specify)……………………………
2.1.4.3.0 Transfers to Funds and Reserves
2.1.4.3.1 Capital Fund - Debt Repayment
2.1.4.3.2 Capital Fund - Asset Acquisition
2.1.4.3.3 Capital Reserve
2.1.4.3.4 Operating Reserve
2.1.4.4.0 Other Fiscal Services
2.1.4.4.9 HST Expense 2,840 3,267
2.1.4.T.T TOTAL FISCAL SERVICES 6,340 6,767
2.T.T.T.T 503,885 507,245
CS-4
TOTAL CORPORATE SERVICES
2017 CORPORATE SERVICES OPERATING BUDGET
EXPENDITURE
REGIONAL SERVICE COMMISSION 11
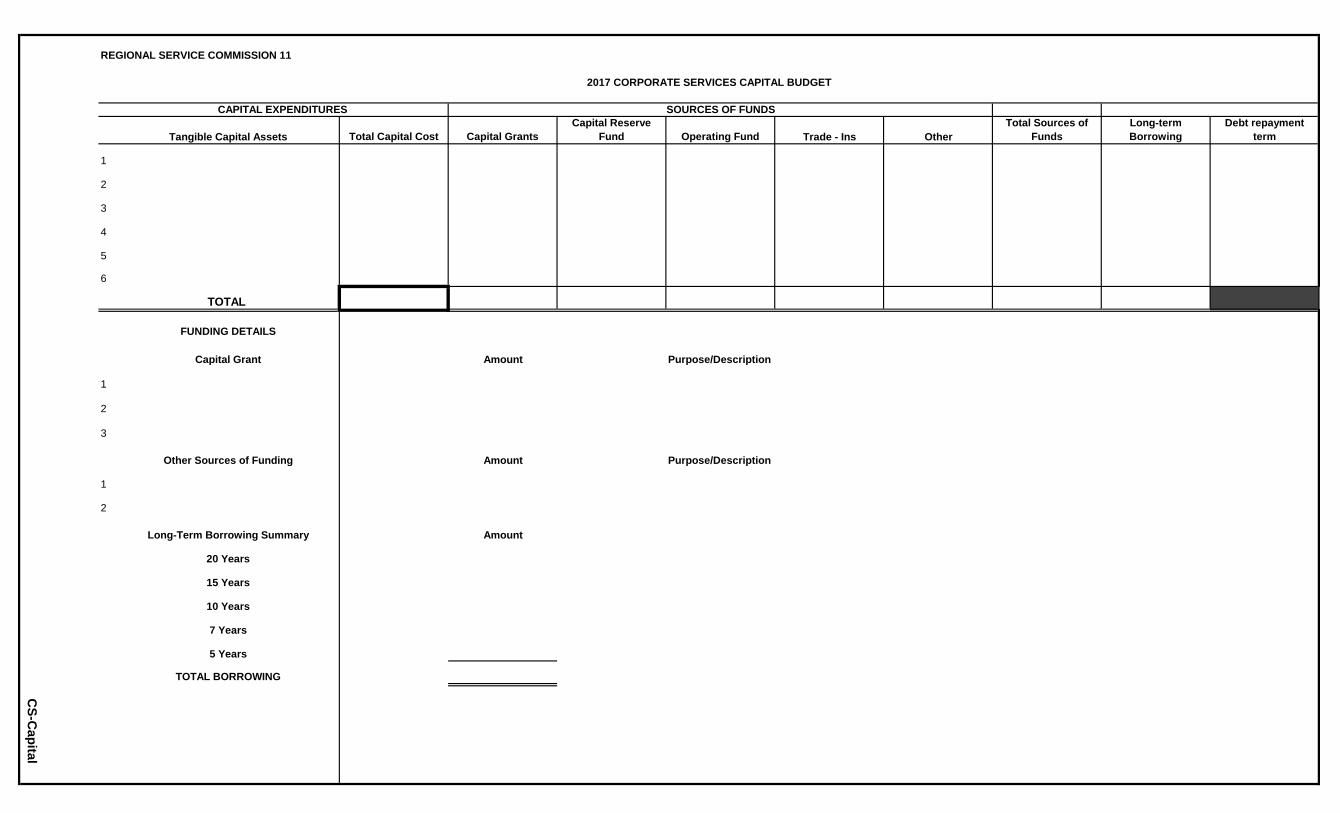
CAPITAL EXPENDITURES
Tangible Capital Assets Total Capital Cost Capital GrantsCapital Reserve
Fund Operating Fund Trade - Ins OtherTotal Sources of
FundsLong-term Borrowing
Debt repayment term
1
2
3
4
5
6
TOTAL
FUNDING DETAILS
Capital Grant Amount Purpose/Description
1
2
3
Other Sources of Funding Amount Purpose/Description
1
2
Long-Term Borrowing Summary Amount
20 Years
15 Years
10 Years
7 Years
5 Years
TOTAL BORROWING
SOURCES OF FUNDS
2017 CORPORATE SERVICES CAPITAL BUDGET
CS-C
apital

OPERATING BUDGET
1. Total Cooperative & Regional Planning Services Budget (from page CRP-4) 88,177
2. Less: Revenue from other sources 14,035
Net Budget to be raised from members 74,142
MEMBER CHARGES2011 Census 2016 Municipal
Member Population Tax Base Member Share*
1 Cambridge Narrows 620 95,118,100 454
2 Chipman 1,236 67,973,200 556
3 Fredericton 56,224 6,933,624,190 36,302
4 Fredericton-Junction 752 40,321,150 335
5 Gagetown 698 60,799,550 378
6 Hanwell 4,610 479,454,000 2,721
7 Millville 307 11,464,600 122
8 Minto 2,505 103,815,408 1,028
9 Nackawic 1,049 92,590,050 572
10 New Maryland 4,232 341,981,700 2,216
11 Oromocto 8,932 1,090,575,922 5,736
12 Stanley 419 29,726,600 208
13 Tracy 611 26,486,850 254
14 LSDs 44,976 3,533,903,100 23,260
127,171 12,907,834,420 74,142
CAPITAL BUDGET
Total Capital Cost - Cooperative & Regional Planning Services Fund (from page CRP-Capital) $
Less: Total sources of funds $
Total Long-term borrowing $
CRP- 1 * Note: Allocation on 50-50 proportional basis of population and tax base
REGIONAL SERVICE COMMISSION 11
2017 COOPERATIVE & REGIONAL PLANNING SERVICES OPERATING & CAPITAL BUDGETS

REGIONAL SERVICE COMMISSION 11
2016 2017BUDGET BUDGET
1.2.0.0.0 COOPERATIVE AND REGIONAL PLANNING
1.2.2.0.0 REVENUE FROM OTHER SOURCES
1.2.2.5.0 Government Transfers
1.2.2.5.1 (Specify)……….….…….….…….….…….….……
1.2.2.5.2 (Specify)……….….…….….…….….…….….……
1.2.2.6.0 Transfers from Own and Other funds
1.2.2.6.1 Second Previous Year Surplus 15,121 14,035
1.2.2.6.2 Operating Reserve Fund
1.2.2.7.0 Other Revenue
1.2.2.7.1 Interest Income
1.2.2.7.2 HST Rebate
1.2.2.7.9 Other (Specify)………………………………..
1.2.2.T.T TOTAL REVENUE FROM OTHER SOURCES 15,121 14,035
CRP-2
2017 COOPERATIVE & REGIONAL PLANNING SERVICES OPERATING BUDGET
REVENUE

REGIONAL SERVICE COMMISSION 11
2016 2017BUDGET BUDGET
2.2.0.0.0
2.2.3.0.0
2.2.3.0.1 65,680 65,677
2.2.3.1.0
2.2.3.1.1 Personnel
2.2.3.1.2 Administration
2.2.3.1.3 Travel
2.2.3.1.4 Professional Services 5,000 10,000
2.2.3.1.9 Other (Specify)……………………………
2.2.3.1.S.T Subtotal 5,000 10,000
2.2.3.2.0
2.2.3.2.2 Administration
2.2.3.2.3 Travel
2.2.3.2.4 Professional Services 2,500 2,500
2.2.3.2.9 Other (Specify)……………………………
2.2.3.2.S.T Subtotal 2,500 2,500
2.2.3.3.0
2.2.3.3.2 Administration
2.2.3.3.3 Travel
2.2.3.3.4 Professional Services
2.2.3.3.9 Other (Specify)……………………………
2.2.3.3.S.T
2.2.3.4.0
2.2.3.4.2 Administration
2.2.3.4.3 Travel
2.2.3.4.4 Professional Services 10,000 10,000
2.2.3.4.9 Other (Specify)……………………………
2.2.3.4.S.T Subtotal 10,000 10,000
2.2.3.5.0
2.2.3.5.2 Administration
2.2.3.5.3 Travel
2.2.3.5.4 Professional Services
2.2.3.5.9 Other (Specify)……………………………
2.2.3.5.S.T Subtotal 83,180 88,177
2.2.4.0.0 FISCAL SERVICES
2.2.4.1.0 Interest
2.2.4.1.1 Current Operations
2.2.4.1.2 Short-Term borrowing for capital projects
2.2.4.1.3 Long-Term Debt
2.2.4.2.0 Other Financing Charges
CRP-3
Other Service Provided to All Members
2017 COOPERATIVE & REGIONAL PLANNING SERVICES OPERATING BUDGET
Regional Sport, Recreation and Culture Infrastructure Planning and Cost-Sharing
EXPENDITURE
Subtotal
Regional Planning
COOPERATIVE AND REGIONAL PLANNING SERVICES
ALLOCATION FROM CORPORATE SERVICES (from page CS-1)
REGIONAL SERVICES
Regional Emergency Measures Planning
Regional Policing Collaboration

REGIONAL SERVICE COMMISSION 11
2016 2017BUDGET BUDGET
2.2.4.2.3 Banking Service Charge
2.2.4.2.9 Other (Specify)……………………………
2.2.4.3.0 Transfers to Funds and Reserves
2.2.4.3.1 Capital Fund - Debt Repayment
2.2.4.3.2 Capital Fund - Asset Acquisition
2.2.4.3.3 Capital Reserve
2.2.4.3.4 Operating Reserve
2.2.4.4.0. Other Fiscal Services
2.2.4.4.3 Second Previous Year Deficit
2.2.4.4.9 Other (Specify)……………………………
2.2.4.T.T TOTAL FISCAL SERVICES
2.T.T.T.T TOTAL EXPENDITURES 83,180 88,177
CRP-4
2017 COOPERATIVE & REGIONAL PLANNING SERVICES OPERATING BUDGET
EXPENDITURE
REGIONAL SERVICE COMMISSION 11
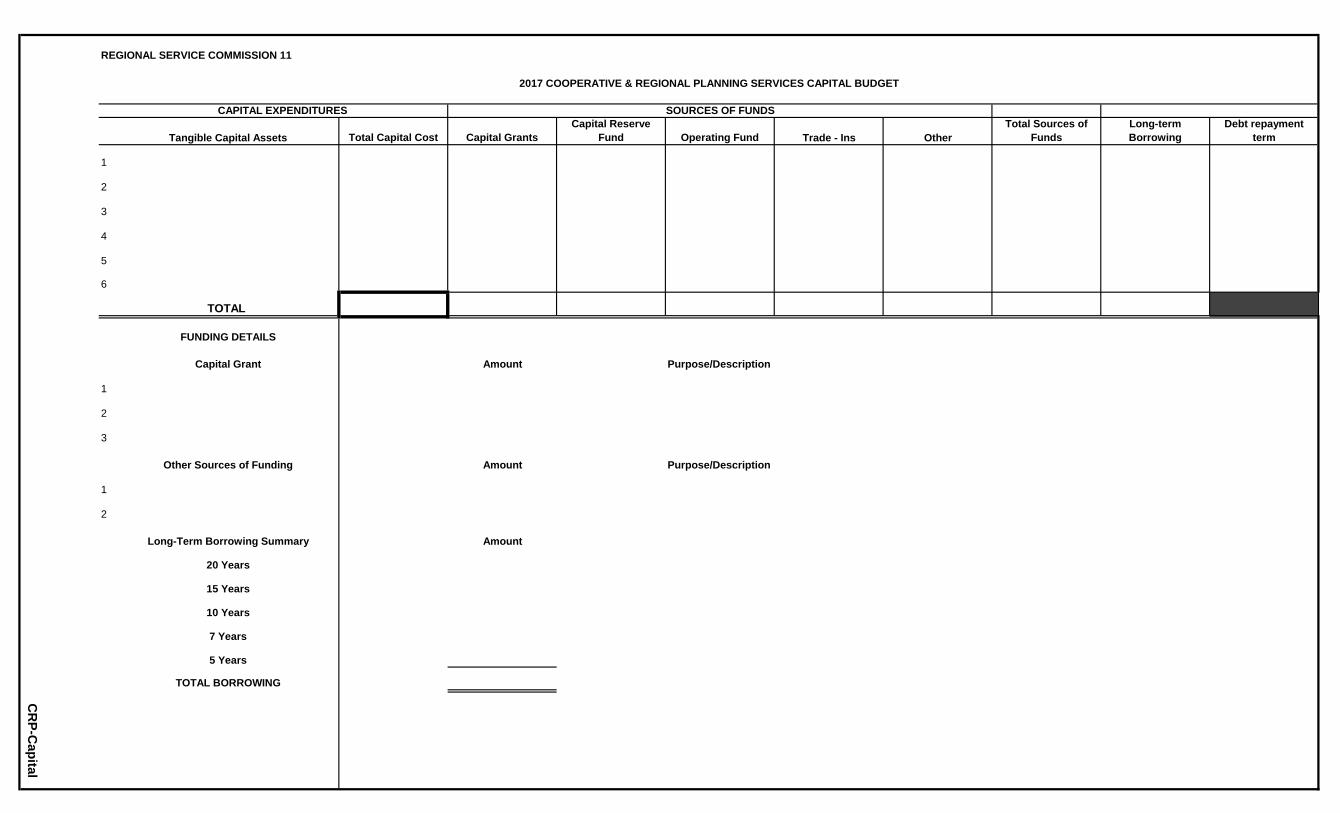
CAPITAL EXPENDITURES
Tangible Capital Assets Total Capital Cost Capital GrantsCapital Reserve
Fund Operating Fund Trade - Ins OtherTotal Sources of
FundsLong-term Borrowing
Debt repayment term
1
2
3
4
5
6
TOTAL
FUNDING DETAILS
Capital Grant Amount Purpose/Description
1
2
3
Other Sources of Funding Amount Purpose/Description
1
2
Long-Term Borrowing Summary Amount
20 Years
15 Years
10 Years
7 Years
5 Years
TOTAL BORROWING
SOURCES OF FUNDS
2017 COOPERATIVE & REGIONAL PLANNING SERVICES CAPITAL BUDGET
CR
P-Capital

OPERATING
1. Total Budget (from page LP-4) 1,291,927$
2. Less: Revenue from other sources (from page LP-2) 17,580$
Net Budget to be raised from members 1,274,347$
Portion of net budget relating to Planning Services 745,632$
Portion of net budget relating to Inspection Services 528,715$
MEMBER CHARGES
Member2016 Municipal Tax
Base Planning Service Inspection Service Member Share
1 Cambridge-Narrows 95,118,100 15,756 11,172 26,928 -
2 Chipman 67,973,200 11,260 7,984 19,244 -
3 Gagetown 60,779,550 10,068 7,139 17,207 -
4 Hanwell 479,454,000 79,420 56,315 135,736 -
5 Millville 11,464,000 1,899 1,347 3,246 -
6 Minto 103,815,408 17,197 12,194 29,391 -
7 Nackawic 92,590,050 15,337 10,875 26,213 -
8 Stanley 29,726,600 4,924 3,492 8,416 -
9 Tracy 26,486,850 4,387 3,111 7,499 -
10 LSDs 3,533,923,100 585,384 415,086 1,000,470
4,501,330,858$ 745,632$ 528,715$ 1,274,347$
CAPITAL
Total Capital Cost - Local Planning Services Fund (from page LP- Capital) 5,000$
Less: Total sources of funds 5,000$
Total Long-term borrowing -$
LP- 1
REGIONAL SERVICE COMMISSION 11
2017 LOCAL PLANNING SERVICES OPERATING & CAPITAL BUDGETS

REGIONAL SERVICE COMMISSION 11
2016 2017BUDGET BUDGET
1.3.0.0.0 LOCAL PLANNING SERVICES
1.3.2.0.0 REVENUE FROM OTHER SOURCES
1.3.2.1.0 Fees and Services
1.3.2.1.1
1.3.2.1.2 Inspection
1.3.2.1.9 Other (Specify)………………………………..
1.3.2.6.0 Transfers from Own and Other funds
1.3.2.6.1 Second Previous Year Surplus 51,668 14,580
1.3.2.6.2 Operating Reserve Fund
1.3.2.7.0 Other Revenue
1.3.2.7.1 Interest Income 3,000 3,000
1.3.2.7.2 HST Rebate
1.3.2.7.9 Other (Specify)………………………………..
1.3.2.T.T TOTAL REVENUE FROM OTHER SOURCES 54,668 17,580
LP-2
2017 LOCAL PLANNING SERVICES OPERATING BUDGET
REVENUE
Planning and Development

REGIONAL SERVICE COMMISSION 11
2016 2017BUDGET BUDGET
2.3.0.0.0
2.3.2.0.0 ADMINISTRATION
2.3.2.0.1 146,842 152,870
2.3.2.1.0 Director’s Office
2.3.2.1.1 Salaries & Benefits 232,986 238,635
2.3.2.1.2 Travel 5,000 7,000
2.3.2.1.3 Training and Development 2,800 2,800
2.3.2.1.9 Meetings 2,000 1,500
2.3.2.2.0 Other Administration Services
2.3.2.2.1 Advertising & Public Relations 1,500 1,500
2.3.2.2.2 Liability Insurance 4,000 2,000
2.3.2.2.3 Professional Services 6,000 4,000
2.3.2.2.4 Legal Services 10,000 5,000
2.3.2.2.5 Office Building 92,017 92,017
2.3.2.2.6 Office Equipment & Supplies 14,500 14,500
2.3.2.2.7 Printing and Copying 5,500 5,500
2.3.2.2.8 Telecommunications 17,000 17,000
2.3.2.2.9 Other (Specify)……………………………
2.3.2.T.T TOTAL ADMINISTRATION SERVICES 540,145 544,322
2.3.3.0.0 PLANNING AND BUILDING INSPECTION SERVICES
2.3.3.1.0 Planning Services
2.3.3.1.1 Salaries & Benefits 291,808 385,959
2.3.3.1.2 Travel 5,000 5,000
2.3.3.1.3 Training and Development 5,000 5,000
2.3.3.1.4 Maps and Reference Material
2.3.3.1.5 GIS Operating and Planet
2.3.3.1.6 Advertising (Legislatively Required) 6,000 7,000
2.3.3.1.7 Planning Review & Adjustment Committee 19,200 19,200
2.3.3.1.9 Meetings, Memberships, and Supplies 6,000 5,500
2.3.3.1.S.T Subtotal 333,008 427,659
2.3.3.2.0 Inspection Services
2.3.3.2.1 Salaries & Benefits 257,247 268,446
2.3.3.2.2 Travel 27,000 29,000
2.3.3.2.3 Training and Development 1,500 4,000
2.3.3.2.4 Maps and Reference Material
2.3.3.2.5 GIS Operating and Planet
2.3.3.2.9 Membership and Supplies 1,600 1,800
2.3.3.2.S.T Subtotal 287,347 303,246
2.3.3.T.T TOTAL PLANNING AND INSPECTION SERVICES 620,355 730,905
LP-3
ALLOCATION FROM CORPORATE SERVICES (from page CS-1)
LOCAL PLANNING SERVICES
EXPENDITURE
2017 LOCAL PLANNING SERVICES OPERATING BUDGET

REGIONAL SERVICE COMMISSION 11
2016 2017BUDGET BUDGET
2.3.4.0.0 FISCAL SERVICES
2.3.4.1.0 Interest
2.3.4.1.1 Current Operations
2.3.4.1.2 Short-Term borrowing for capital projects
2.3.4.1.3 Long-Term Debt
2.3.4.2.0 Other Financing Charges
2.3.4.2.1 Debenture Discounts
2.3.4.2.2 Cost of Issuing & Selling New Debentures
2.3.4.2.3 Banking Service Charge 3,000 3,000
2.3.4.2.9 Other (Specify)……………………………
2.3.4.3.0 Transfers to Other Funds
2.3.4.3.1 Capital Fund - Debt Repayment
2.3.4.3.2 Capital Fund - Asset Acquisition 5,500 5,500
2.3.4.3.3 Capital Reserve Fund
2.3.4.3.3 Operating Reserve Fund 1,000 700
2.3.4.4.0 Other Fiscal Services
2.3.4.4.3 Second Previous Year Deficit
2.3.4.4.9 HST Expense 7,500 7,500
2.3.4.T.T TOTAL FISCAL SERVICES 17,000 16,700
2.T.T.T.T TOTAL EXPENDITURES 1,177,500 1,291,927
LP-4
EXPENDITURE
2017 LOCAL PLANNING SERVICES OPERATING BUDGET

REGIONAL SERVICE COMMISSION 11
CAPITAL EXPENDITURES
Tangible Capital Assets Total Capital Cost Capital GrantsCapital Reserve
Fund Operating Fund Trade - Ins OtherTotal Sources of
FundsLong-term Borrowing
Debt repayment term
1 Computer Equipment 5,000$ 5000 5000
2
3
4
5
6
TOTAL 5,000$ 5,000$ 5,000$
FUNDING DETAILS
Capital Grant Amount Purpose/Description
1
2
3
Other Sources of Funding Amount Purpose/Description
1
2
Long-Term Borrowing Summary Amount
20 Years
15 Years
10 Years
7 Years
5 Years
TOTAL BORROWING
2017 LOCAL PLANNING SERVICES CAPITAL BUDGET
SOURCES OF FUNDS
LP-Capital

OPERATING BUDGET
1. Total Budget (from page SW-5) 7,658,700$
2. Less: Revenue from other sources (from page SW-2) 4,759,776$
Net budget to be raised through tipping fees 2,898,924$
TIPPING FEES
Category Tipping Fees
Member
Cambridge Narrows 230 85.00$ 19,550$
Chipman 525 85.00$ 44,624$
Fredericton 13,000 85.00$ 1,105,000$
Fredericton Junction 200 85.00$ 17,000$
Gagetown 240 85.00$ 20,400$
Hanwell 1,200 85.00$ 102,000$
Millville 100 85.00$ 8,500$
Minto 1,080 85.00$ 91,800$
Nackawic 335 85.00$ 28,475$
New Maryland 1,090 85.00$ 92,650$
Oromocto 2,420 85.00$ 205,700$
Stanley 115 85.00$ 9,775$
Tracy 170 85.00$ 14,450$
LSDs 13,400 85.00$ 1,139,000$
TOTAL REVENUE FROM MEMBER TIPPING FEES 2,898,924$
CAPITAL BUDGET
Total Capital Cost - Solid Waste Services Fund (from page SW-Capital) $ 843,000
Less: Total sources of funds $ 643,000
Total Long-term borrowing $ 200,000
SW- 1
REGIONAL SERVICE COMMISSION 11
2017 SOLID WASTE SERVICES OPERATING & CAPITAL BUDGETS
Tonnage Total Tipping Fees
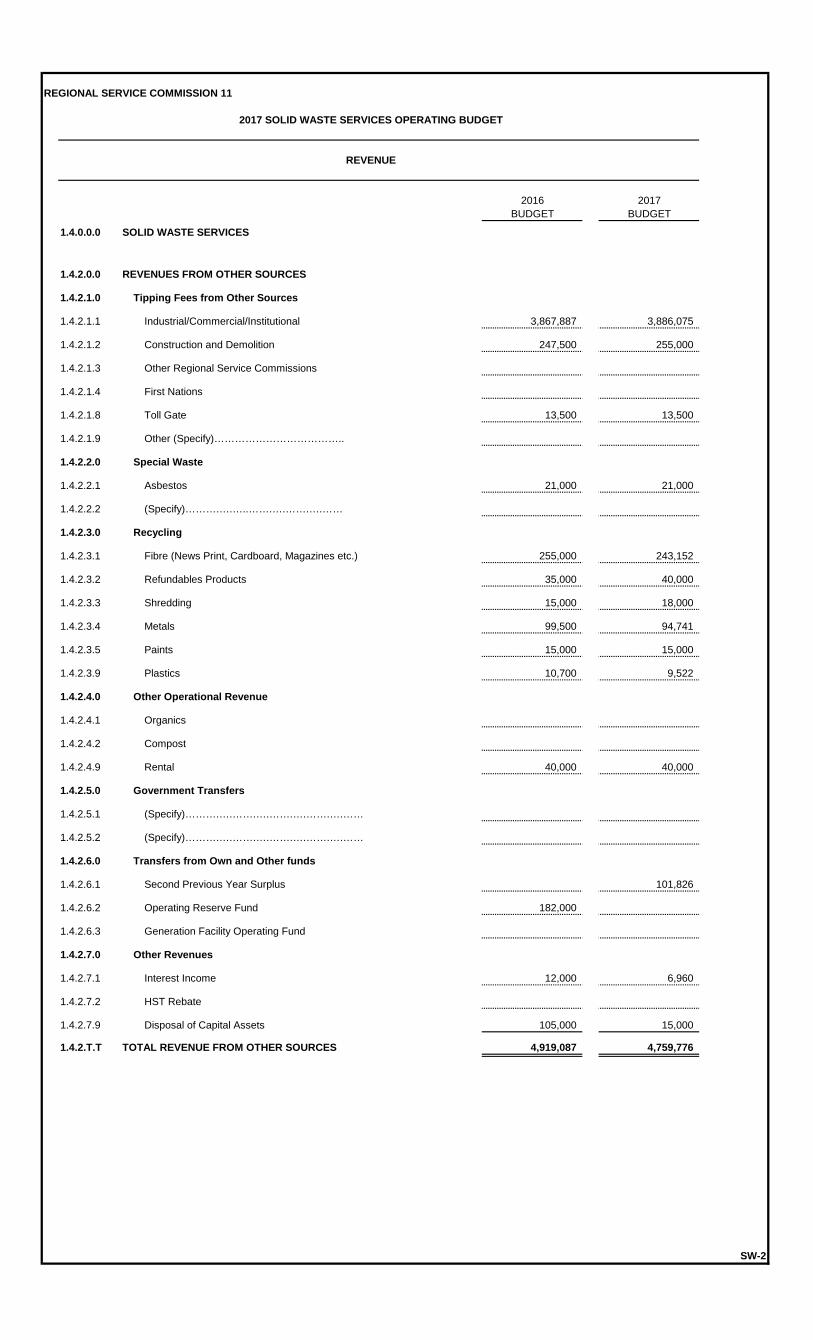
REGIONAL SERVICE COMMISSION 11
2016 2017BUDGET BUDGET
1.4.0.0.0 SOLID WASTE SERVICES
1.4.2.0.0 REVENUES FROM OTHER SOURCES
1.4.2.1.0 Tipping Fees from Other Sources
1.4.2.1.1 Industrial/Commercial/Institutional 3,867,887 3,886,075
1.4.2.1.2 Construction and Demolition 247,500 255,000
1.4.2.1.3 Other Regional Service Commissions
1.4.2.1.4 First Nations
1.4.2.1.8 Toll Gate 13,500 13,500
1.4.2.1.9 Other (Specify)………………………………..
1.4.2.2.0 Special Waste
1.4.2.2.1 Asbestos 21,000 21,000
1.4.2.2.2 (Specify)……….….…..…….….…….….……
1.4.2.3.0 Recycling
1.4.2.3.1 Fibre (News Print, Cardboard, Magazines etc.) 255,000 243,152
1.4.2.3.2 Refundables Products 35,000 40,000
1.4.2.3.3 Shredding 15,000 18,000
1.4.2.3.4 Metals 99,500 94,741
1.4.2.3.5 Paints 15,000 15,000
1.4.2.3.9 Plastics 10,700 9,522
1.4.2.4.0 Other Operational Revenue
1.4.2.4.1 Organics
1.4.2.4.2 Compost
1.4.2.4.9 Rental 40,000 40,000
1.4.2.5.0 Government Transfers
1.4.2.5.1 (Specify)……….….…….….…….….…….….……
1.4.2.5.2 (Specify)……….….…….….…….….…….….……
1.4.2.6.0 Transfers from Own and Other funds
1.4.2.6.1 Second Previous Year Surplus 101,826
1.4.2.6.2 Operating Reserve Fund 182,000
1.4.2.6.3 Generation Facility Operating Fund
1.4.2.7.0 Other Revenues
1.4.2.7.1 Interest Income 12,000 6,960
1.4.2.7.2 HST Rebate
1.4.2.7.9 Disposal of Capital Assets 105,000 15,000
1.4.2.T.T TOTAL REVENUE FROM OTHER SOURCES 4,919,087 4,759,776
SW-2
REVENUE
2017 SOLID WASTE SERVICES OPERATING BUDGET
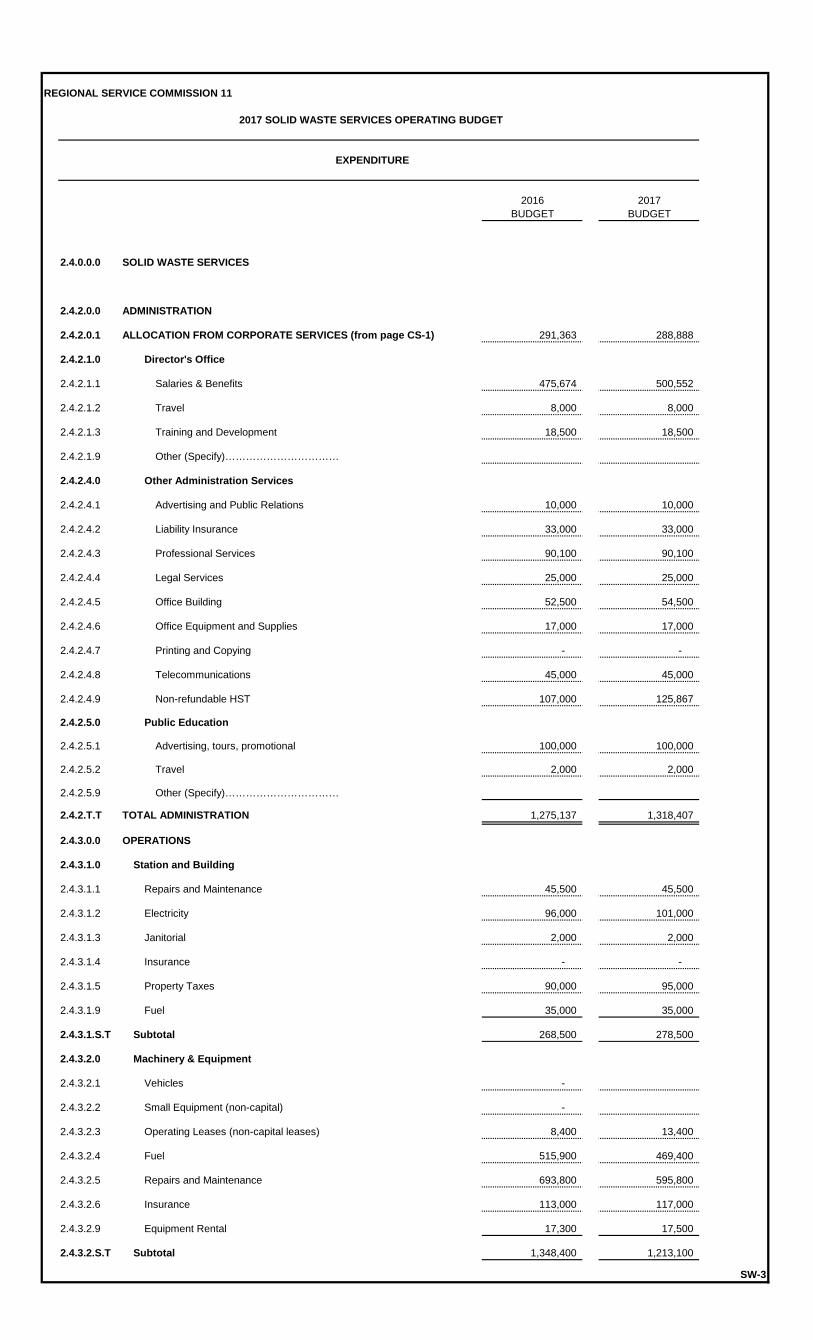
REGIONAL SERVICE COMMISSION 11
2016 2017BUDGET BUDGET
2.4.0.0.0
2.4.2.0.0 ADMINISTRATION
2.4.2.0.1 291,363 288,888
2.4.2.1.0 Director's Office
2.4.2.1.1 Salaries & Benefits 475,674 500,552
2.4.2.1.2 Travel 8,000 8,000
2.4.2.1.3 Training and Development 18,500 18,500
2.4.2.1.9 Other (Specify)……………………………
2.4.2.4.0 Other Administration Services
2.4.2.4.1 Advertising and Public Relations 10,000 10,000
2.4.2.4.2 Liability Insurance 33,000 33,000
2.4.2.4.3 Professional Services 90,100 90,100
2.4.2.4.4 Legal Services 25,000 25,000
2.4.2.4.5 Office Building 52,500 54,500
2.4.2.4.6 Office Equipment and Supplies 17,000 17,000
2.4.2.4.7 Printing and Copying - -
2.4.2.4.8 Telecommunications 45,000 45,000
2.4.2.4.9 Non-refundable HST 107,000 125,867
2.4.2.5.0 Public Education
2.4.2.5.1 Advertising, tours, promotional 100,000 100,000
2.4.2.5.2 Travel 2,000 2,000
2.4.2.5.9 Other (Specify)……………………………
2.4.2.T.T TOTAL ADMINISTRATION 1,275,137 1,318,407
2.4.3.0.0 OPERATIONS
2.4.3.1.0 Station and Building
2.4.3.1.1 Repairs and Maintenance 45,500 45,500
2.4.3.1.2 Electricity 96,000 101,000
2.4.3.1.3 Janitorial 2,000 2,000
2.4.3.1.4 Insurance - -
2.4.3.1.5 Property Taxes 90,000 95,000
2.4.3.1.9 Fuel 35,000 35,000
2.4.3.1.S.T Subtotal 268,500 278,500
2.4.3.2.0 Machinery & Equipment
2.4.3.2.1 Vehicles -
2.4.3.2.2 Small Equipment (non-capital) -
2.4.3.2.3 Operating Leases (non-capital leases) 8,400 13,400
2.4.3.2.4 Fuel 515,900 469,400
2.4.3.2.5 Repairs and Maintenance 693,800 595,800
2.4.3.2.6 Insurance 113,000 117,000
2.4.3.2.9 Equipment Rental 17,300 17,500
2.4.3.2.S.T Subtotal 1,348,400 1,213,100
SW-3
ALLOCATION FROM CORPORATE SERVICES (from page CS-1)
SOLID WASTE SERVICES
2017 SOLID WASTE SERVICES OPERATING BUDGET
EXPENDITURE

REGIONAL SERVICE COMMISSION 11
2016 2017BUDGET BUDGET
2.4.3.3.0 Landfill Operations
2.4.3.3.1 Personnel 1,494,131 1,664,278
2.4.3.3.2 Small Equipment (non capital) 2,500 2,500
2.4.3.3.3 Site and Road Maintenance 400,190 420,190
2.4.3.3.4 Monitoring 115,000 115,000
2.4.3.3.5 Site Security 15,000 15,000
2.4.3.3.6 Special Waste Handling -
2.4.3.3.7 Cells - 187,056
2.4.3.3.8 Leachate & Siltation Management 47,000 58,000
2.4.3.3.9 Supplies 135,880 135,880
2.4.3.3.S.T Subtotal 2,209,701 2,597,904
2.4.3.4.0 Transfer Station Operations
2.4.3.4.1 Personnel
2.4.3.4.2 Small Equipment (non capital)
2.4.3.4.3 Site and Road Maintenance
2.4.3.4.4. Site Security
2.4.3.4.5 Contracted Services
2.4.3.4.6 Special Waste Handling
2.4.3.4.9 Other (Specify)……………………………
2.4.3.4.S.T Subtotal
2.4.3.5.0 Scale house
2.4.3.5.1 Personnel 238,557 249,591
2.4.3.5.2 Small Equipment (non capital) -
2.4.3.5.3 Supplies -
2.4.3.5.9 Repairs and Maintenance 20,000 20,000
2.4.3.5.S.T Subtotal 258,557 269,591
2.4.3.6.0 Waste Diversion
2.4.3.6.1 Personnel 688,600 688,800
2.4.3.6.2 Recycling 158,620 211,620
2.4.3.6.3 Collection -
2.4.3.6.4 Equipment Maintenance 97,000 106,500
2.4.3.6.5 Contracted Services -
2.4.3.6.9 Fuel 51,650 44,450
2.4.3.6.S.T Subtotal 995,870 1,051,370
2.4.3.7.0 Composting Program
2.4.3.7.1 Personnel
2.4.3.7.2 Processing
2.4.3.7.3 Demonstration Site
2.4.3.7.9 Other (Specify)……………………………
2.4.3.7.S.T Subtotal
2.4.3.8.0 Hazardous Household Waste
2.4.3.8.1 Personnel 36,975 38,894
2.4.3.8.2 Collection -
2.4.3.8.2 Disposal 130,000 130,000
SW-4
EXPENDITURE
2017 SOLID WASTE SERVICES OPERATING BUDGET

REGIONAL SERVICE COMMISSION 11
2016 2017BUDGET BUDGET
2.4.3.8.9 Other (Specify)……………………………
2.4.3.8.S.T Subtotal 166,975 168,894
2.4.3.T.T TOTAL OPERATIONS 5,248,003 5,579,359
2.4.4.0.0 FISCAL SERVICES
2.4.4.1.0 Interest
2.4.4.1.1 Current Operations
2.4.4.1.2 Short-Term borrowing for capital projects
2.4.4.1.3 Long-Term Debt 62,270 64,475
2.4.4.2.0 Other Financing Charges
2.4.4.2.1 Debenture Discounts
2.4.4.2.2 Cost of Issuing & Selling New Debentures
2.4.4.2.3 Banking Service Charge 2,500 2,500
2.4.4.2.9 Other (Specify)……………………………
2.4.4.3.0 Transfers to Other Funds
2.4.4.3.1 Capital Fund - Debt Repayment 368,000 453,709
2.4.4.3.2 Capital Fund - Asset Acquisition 43,000 43,000
2.4.4.3.3 Capital Reserve Fund
2.4.4.3.4 Operating Reserve Fund
2.4.4.3.5. Generation Facility Operating Fund
2.4.4.4.0 Other Fiscal Services
2.4.4.4.1 Bad Debt Expense 6,000 6,000
2.4.4.4.2 Closure and Post-Closure Expense 182,746 191,250
2.4.4.4.3 Second Previous Year Deficit 451,044 -
2.4.4.4.9 Other (Specify)……………………………
2.4.4.T.T TOTAL FISCAL SERVICES 1,115,560 760,934
2.T.T.T.T TOTAL EXPENDITURES 7,638,700 7,658,700
SW-5
EXPENDITURE
2017 SOLID WASTE SERVICES OPERATING BUDGET

REGIONAL SERVICE COMMISSION 11
CAPITAL EXPENDITURES
Tangible Capital Assets Total Capital Cost Capital GrantsCapital Reserve
Fund Operating Fund Trade - Ins OtherTotal Sources of
FundsLong-term Borrowing
Debt repayment term
1 Loader 200,000$ 200,000 5 years
2 Utility Vehicle 38,000$ 38,000 38,000
3 Computer Equipment 5,000$ 5,000 5,000
4 Cell Development 600,000$ 412,944 187,056 600,000
5
6
7
8
TOTAL 843,000$ -$ 412,944$ 230,056$ -$ -$ 643,000$ 200,000$
FUNDING DETAILS
Capital Grant Amount Purpose/Description
1
2
3
Other Sources of Funding Amount Purpose/Description
1
2
Long-Term Borrowing Summary Amount
20 Years
15 Years
10 Years
7 Years
5 Years 200,000$
TOTAL BORROWING 200,000$
2017 LOCAL PLANNING SERVICES CAPITAL BUDGET
SOURCES OF FUNDS
SW-C
apital

OPERATING BUDGET
1. Total Budget (from page GF-4) 1,220,954$
2. Less: Revenue from other sources (from page GF-2) 120,954
Net Budget to be raised from sale of service 1,100,000$
SALE OF SERVICE
User # Kilowatts $/Kilowatt Sale of Service
NBPower 10,519,269 0.10457$ 1,100,000$
$…………………… $……………………
$…………………… $______________
TOTAL SALE OF SERVICE 1,100,000$
CAPITAL BUDGET
Total Cost Capital - Electricity Generation Facility Services Fund (from page GF-Capital) $
Less: Total sources of funds $
Total Long-term borrowing $
GF- 1
REGIONAL SERVICE COMMISSION 11
2017 GENERATION FACILITY OPERATING & CAPITAL BUDGETS

REGIONAL SERVICE COMMISSION 11
2016 2017BUDGET BUDGET
1.5.0.0.0 GENERATION FACILITY
1.5.2.0.0 REVENUE FROM OTHER SOURCES
1.5.2.5.0 Government Transfers
1.5.2.5.1 (Specify)……….….…….….…….….…….….…
1.5.2.5.2 (Specify)……….….…….….…….….…….….…
1.5.2.6.0 Transfers from Own and Other funds
1.5.2.6.1 Second Previous Year Surplus 95,486 120,294
1.5.2.6.2 Operating Reserve Fund
1.5.2.6.3 Solid Waste Services Operating Fund
1.5.2.7.0 Other Revenue
1.5.2.7.1 Interest Income 1,050 660
1.5.2.7.9 Other (Specify)………………………………..
1.5.2.T.T TOTAL REVENUE FROM OTHER SOURCES 96,536 120,954
GF-2
2017 GENERATION FACILITY OPERATING BUDGET
REVENUE

REGIONAL SERVICE COMMISSION 11
2016 2017BUDGET BUDGET
2.5.0.0.0
2.5.2.0.0 ADMINISTRATION
2.5.2.0.1
2.5.2.1.0 Personnel
2.5.2.1.1 Salaries & Benefits
2.5.2.1.2 Travel
2.5.2.1.3 Training and Development
2.5.2.1.9 Other (Specify)……………………………
2.5.2.2.0 Other Administrative Services
2.5.2.2.1 Advertising and Public Relations
2.5.2.2.2 Liability Insurance
2.5.2.2.3 Professional Services
2.5.2.2.4 Legal Services
2.5.2.2.5 Office Building
2.5.2.2.6 Office Equipment & Supplies
2.5.2.2.7 Printing and Copying
2.5.2.2.8 Telecommunications 1,200 1,200
2.5.2.2.9 Electricity 10,000 8,000
2.5.2.T.T TOTAL ADMINISTRATION 11,200 9,200
2.5.3.0.0 OPERATIONS
2.5.3.1.0 Personnel
2.5.3.1.1 Salaries & Benefits 79,103 84,589
2.5.3.1.2 Travel 500 500
2.5.3.1.3 Training and Development 5,000 5,000
2.5.3.1.9 Other (Specify)……………………………
2.5.3.2.0 Machinery & Equipment
2.5.3.2.1 Vehicles
2.5.3.2.2 Small Equipment (non-capital)
2.5.3.2.3 Operating Leases (non-capital)
2.5.3.2.4 Fuel
2.5.3.2.5 Repairs and Maintenance 276,000 150,000
2.5.3.2.6 Insurance 21,000 38,000
2.5.3.2.7 Oil 40,000 45,000
2.5.3.2.8 Supplies 3,000 3,000
2.5.3.T.T TOTAL OPERATIONS 424,603 326,089
2.5.4.0.0 FISCAL SERVICES
2.5.4.1.0 Interest
2.5.4.1.1 Current Operations
2.5.4.1.2 Short-Term borrowing for capital projects
2.5.4.1.3 Long-Term Debt 84,556 70,000
2.5.4.2.0 Other Financing Charges
2.5.4.2.1 Debenture Discounts 2,200 3,740
GF-3
EXPENDITURE
ALLOCATION FROM CORPORATE SERVICES (from page CS-1)
GENERATION FACILITY
2017 GENERATION FACILITY OPERATING BUDGET
REGIONAL SERVICE COMMISSION 11
2016 2017BUDGET BUDGET
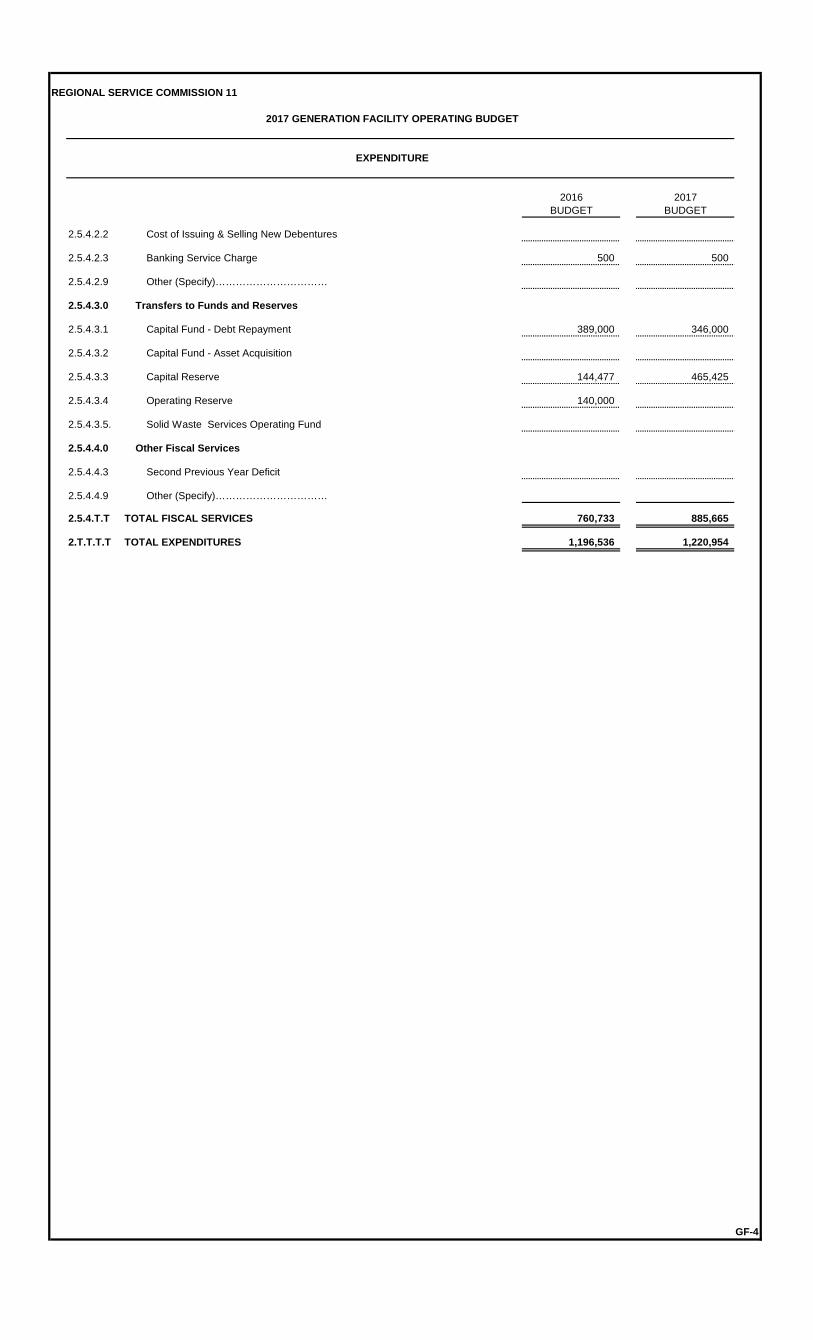
2.5.4.2.2 Cost of Issuing & Selling New Debentures
2.5.4.2.3 Banking Service Charge 500 500
2.5.4.2.9 Other (Specify)……………………………
2.5.4.3.0 Transfers to Funds and Reserves
2.5.4.3.1 Capital Fund - Debt Repayment 389,000 346,000
2.5.4.3.2 Capital Fund - Asset Acquisition
2.5.4.3.3 Capital Reserve 144,477 465,425
2.5.4.3.4 Operating Reserve 140,000
2.5.4.3.5. Solid Waste Services Operating Fund
2.5.4.4.0 Other Fiscal Services
2.5.4.4.3 Second Previous Year Deficit
2.5.4.4.9 Other (Specify)……………………………
2.5.4.T.T TOTAL FISCAL SERVICES 760,733 885,665
2.T.T.T.T TOTAL EXPENDITURES 1,196,536 1,220,954
GF-4
EXPENDITURE
2017 GENERATION FACILITY OPERATING BUDGET

REGIONAL SERVICE COMMISSION 11
CAPITAL EXPENDITURES
Tangible Capital Assets Total Capital Cost Capital GrantsCapital Reserve
Fund Operating Fund Trade - Ins OtherTotal Sources of
FundsLong-term Borrowing
Debt repayment term
1
2
3
4
5
6
7
8
TOTAL
FUNDING DETAILS
Capital Grant Amount Purpose/Description
1
2
3
Other Sources of Funding Amount Purpose/Description
1
2
Long-Term Borrowing Summary Amount
20 Years
15 Years
10 Years
7 Years
5 Years
TOTAL BORROWING
2017 GENERATION FACILITY CAPITAL BUDGET
SOURCES OF FUNDS
GF-C
apital

OPERATING BUDGET
1. Total Budget (from page OT-3) $
2. Less: Revenue from other sources (from page OT-2) $
Net Budget to be raised from participating members $
MEMBER CHARGES
Member Specify:……………………… Specify:……………………… Member Share
1 . . . . . . . . . . . . . . . . . . . . . . . . . . . . . . . . . . . . . . . . . . . . . . . . . . . . . . . . . . . .
2 . . . . . . . . . . . . . . . . . . . . . . . . . . . . . . . . . . . . . . . . . . . . . . . . . . . . . . . . . . . .
3 . . . . . . . . . . . . . . . . . . . . . . . . . . . . . . . . . . . . . . . . . . . . . . . . . . . . . . . . . . . .
4 . . . . . . . . . . . . . . . . . . . . . . . . . . . . . . . . . . . . . . . . . . . . . . . . . . . . . . . . . . . .
5 . . . . . . . . . . . . . . . . . . . . . . . . . . . . . . . . . . . . . . . . . . . . . . . . . . . . . . . . . . . .
6 . . . . . . . . . . . . . . . . . . . . . . . . . . . . . . . . . . . . . . . . . . . . . . . . . . . . . . . . . . . .
7 . . . . . . . . . . . . . . . . . . . . . . . . . . . . . . . . . . . . . . . . . . . . . . . . . . . . . . . . . . . .
8 . . . . . . . . . . . . . . . . . . . . . . . . . . . . . . . . . . . . . . . . . . . . . . . . . . . . . . . . . . . .
9 . . . . . . . . . . . . . . . . . . . . . . . . . . . . . . . . . . . . . . . . . . . . . . . . . . . . . . . . . . . .
10 . . . . . . . . . . . . . . . . . . . . . . . . . . . . . . . . . . . . . . . . . . . . . . . . . . . . . . . . . . . .
$
CAPITAL BUDGET
Total Cost Capital - Other Shared Services Fund (from page OT-Capital) $
Less: Total sources of funds $
Total Long-term borrowing $
OT- 1
REGIONAL SERVICE COMMISSION ______________________________________________
2017 OTHER SHARED SERVICES OPERATING & CAPITAL BUDGETS
Cost Sharing Data

REGIONAL SERVICE COMMISSION ______________________________________________
2016 2017BUDGET BUDGET
1.6.0.0.0 OTHER SHARED SERVICES
1.6.2.0.0 REVENUE FROM OTHER SOURCES
1.6.2.5.0 Government Transfers
1.6.2.5.1 (Specify)……….….…….….…….….…….….……
1.6.2.5.2 (Specify)……….….…….….…….….…….….……
1.6.2.6.0 Transfers from Own Sources
1.6.2.6.1 Second Previous Year Surplus
1.6.2.6.2 Operating Reserve Fund
1.6.2.7.0 Other Revenue
1.6.2.7.1 Interest Income
1.6.2.7.2 HST Rebate
1.6.2.7.9 Other (Specify)………………………………..
1.6.T.T.T TOTAL REVENUE FROM OTHER SOURCES
OT-2
2017 OTHER SHARED SERVICES OPERATING BUDGET
REVENUE

REGIONAL SERVICE COMMISSION ______________________________________________
2016 2017BUDGET BUDGET
2.6.0.0.0
2.6.2.0.0 ADMINISTRATION
2.6.2.0.1
2.6.2.1.0 Personnel
2.6.2.1.1 Salaries and Benefits
2.6.2.1.2 Travel
2.6.2.1.3 Training and Development
2.6.2.1.9 Other (Specify)……………………………
2.6.2.2.0 Other Administrative Services
2.6.2.2.1 Advertising and Public Relations
2.6.2.2.2 Liability Insurance
2.6.2.2.3 Professional Services
2.6.2.2.4 Legal Services
2.6.2.2.5 Office Building
2.6.2.2.6 Office Equipment and Supplies
2.6.2.2.7 Printing and Copying
2.6.2.2.8 Telecommunications
2.6.2.2.9 Other (Specify)……………………………
2.6.2.T.T TOTAL ADMINISTRATION
2.6.4.0.0 FISCAL SERVICES
2.6.4.1.0 Interest
2.6.4.1.1 Current Operations
2.8.1.1.7 Short-Term borrowing for capital projects
2.6.4.1.3 Long-Term Debt
2.6.4.2.0 Other Financing Charges
2.6.4.2.1 Debenture Discounts
2.6.4.2.2 Cost of Issuing & Selling New Debentures
2.6.4.2.3 Banking Service Charge
2.6.4.2.9 Other (Specify)……………………………
2.6.4.3.0 Transfers to Funds and Reserves
2.6.4.3.1 Capital Fund - Debt Repayment
2.6.4.3.2 Capital Fund - Asset Acquisition
2.6.4.3.3 Capital Reserve
2.6.4.3.4 Operating Reserve
2.6.4.4.0 Other Fiscal Services
2.6.4.4.3 Second Previous Year Deficit
2.6.4.4.9 Other (Specify)……………………………
2.6.4.T.T TOTAL FISCAL SERVICES
2.T.T.T.T TOTAL EXPENDITURES
OT-3
2017 OTHER SHARED SERVICES OPERATING BUDGET
ALLOCATION FROM CORPORATE SERVICES (from page CS-1)
OTHER SHARED SERVICES
EXPENDITURE
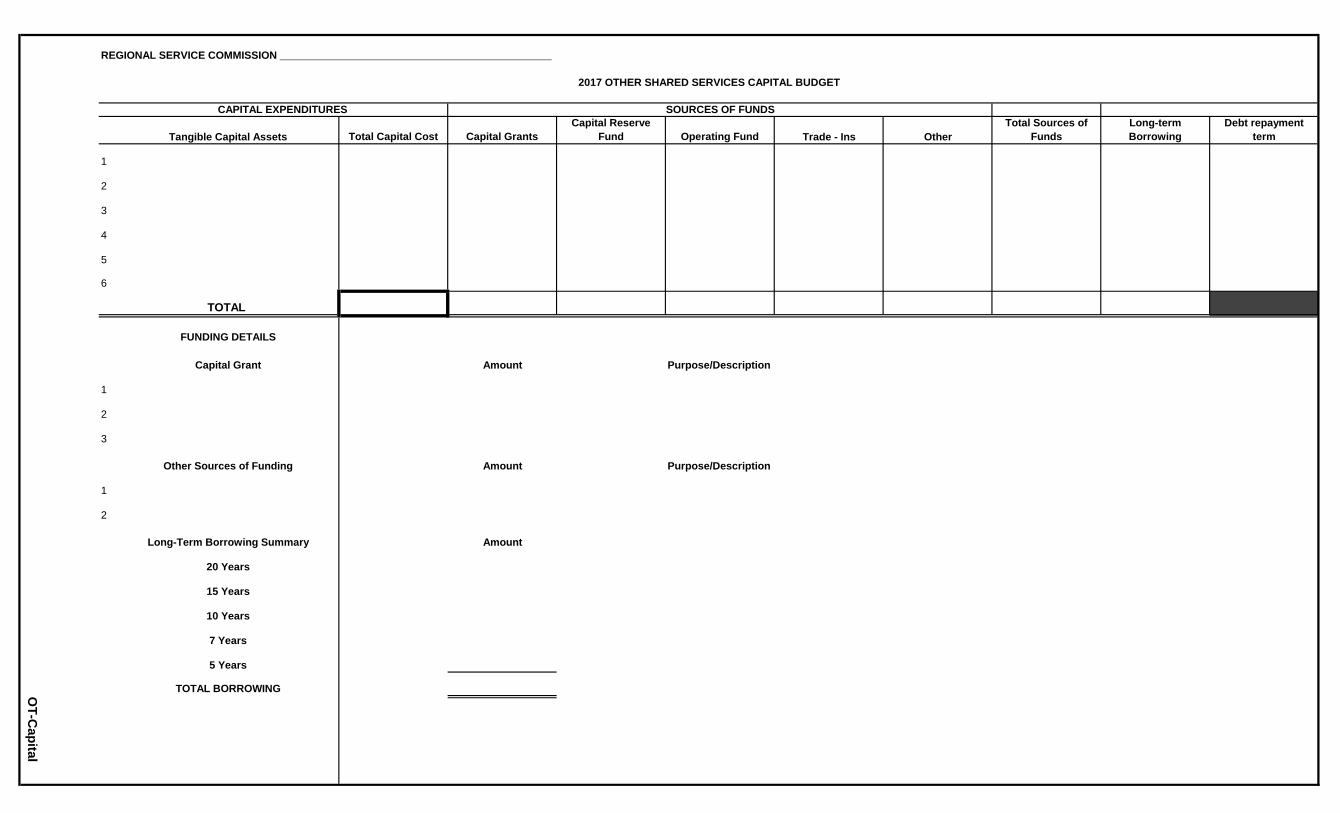
REGIONAL SERVICE COMMISSION ______________________________________________
CAPITAL EXPENDITURES
Tangible Capital Assets Total Capital Cost Capital GrantsCapital Reserve
Fund Operating Fund Trade - Ins OtherTotal Sources of
FundsLong-term Borrowing
Debt repayment term
1
2
3
4
5
6
TOTAL
FUNDING DETAILS
Capital Grant Amount Purpose/Description
1
2
3
Other Sources of Funding Amount Purpose/Description
1
2
Long-Term Borrowing Summary Amount
20 Years
15 Years
10 Years
7 Years
5 Years
TOTAL BORROWING
2017 OTHER SHARED SERVICES CAPITAL BUDGET
SOURCES OF FUNDS
OT-C
apital

1. Regular Garbage Tipping Fee $85.00 per metric tonne
2. C&D Tipping Fee $42.50 per metric tonne
3. CFC Removal Charge $15.00 + HST per unit
4. Scrap Tires Charge $100.00 per metric tonne
5. Asbestos Charge $140.00 per cubic metre
$750.00 minimum charge
6. Printing of Maps and Plans $4.00 per square foot
7. Parcel Being Added $200.00
8. Documents $100.00
9. Zoning Confirmation $100.00
10. Zoning Compliance $200.00
11. Variances (All) $250.00
12. Non Conforming Use Application $250.00
13. Terms and Conditions Application $250.00
14. Subdivision (Type 1) $200.00 plus $25/lot
15. Subdivision (Type 2) $500.00 plus $50/lot
16. Temporary Permit $250.00
17. Special PRAC Meeting $1,000.00
Schedule of Fees - 2017
REGIONAL SERVICE COMMISSION 11
2017 REGIONAL SERVICE COMMISSION SCHEDULE OF FEES


![generaltransfer.ingeneraltransfer.in/download/order.pdf85] THE KOLKATA EXTRAORDINARY, OCTOBER 8.2013 [PART I (h) "Regional Commission" means the West Bengal Regional School Service](https://img.dokumen.tips/doc/110x75/5ae86ead7f8b9a6d4f8f7d53/the-kolkata-extraordinary-october-82013-part-i-h-regional-commission-means.jpg)