Embed Size (px)
Citation preview

Regional hydrostratigraphy and groundwater flow modelingin the arsenic-affected areas of the western Bengal basin, WestBengal, IndiaAbhijit Mukherjee & Alan E. Fryar & Paul D. Howell
Abstract The first documented interpretation of theregional-scale hydrostratigraphy and groundwater flow ispresented for a ∼21,000-km2 area of the arsenic-affecteddistricts of West Bengal [Murshidabad, Nadia, North 24Parganas and South 24 Parganas (including Calcutta)],India. A hydrostratigraphic model demonstrates thepresence of a continuous, semi-confined sand aquiferunderlain by a thick clay aquitard. The aquifer thickenstoward the east and south. In the south, discontinuous claylayers locally divide the near-surface aquifer into severaldeeper, laterally connected, confined aquifers. Eight 22-layer model scenarios of regional groundwater flow weredeveloped based on the observed topography, seasonalconditions, and inferred hydrostratigraphy. The modelssuggest the existence of seasonally variable, regional,north–south flow across the basin prior to the onset ofextensive pumping in the 1970s. Pumping has severelydistorted the flow pattern, inducing high vertical hydraulicgradients across wide cones of depression. Pumping hasalso increased total recharge (including irrigational returnflow), inflow from rivers, and sea water intrusion.Consequently, downward flow of arsenic contaminatedshallow groundwater appears to have resulted in contam-ination of previously safe aquifers by a combination ofmechanical mixing and changes in chemical equilibrium.
Résumé Pour la première fois une interprétation del’hydrostratigraphie à l’échelle régionale et de l’écoule-ment des eaux souterraines est présenté sur une zone de
∼21,000-km2 des districts affectés par l’arsenic dansl’Ouest du Bengal en Inde (Murshidabad, Nadia, ParganasNord 24 et Parganas Sud 24 (incluant Calcutta)). Unmodèle hydrostratigraphique démontre la présence d’unaquifère continu et semi-captif recouvrant un aquitard épaisargileux. L’épaisseur de l’aquifère augmente vers l’est et lesud. Au sud, des couches discontinues d’argile partagentlocalement l’aquifère proche de la surface en plusieursaquifères captifs, plus profonds et connectés latéralement.Huit scénarios de modèle d’écoulement régional à 22couches ont été développés sur la base de la topographie,des conditions saisonnières et de l’hydrostratigraphiedéduite. Les modèles suggèrent l’existence d’un écoule-ment régional variable selon les saisons, orienté nord-sud àtravers le bassin avant l’intensification des pompages dansles années 1970. Le pompage a sévèrement modifié leslignes d’écoulement, induisant des gradients hydrauliquesverticaux élevés au droit de larges cônes de rabattement. Lepompage a également augmenté la recharge totale (rechargepar irrigation inclue, l’eau d’irrigation provenant desaquifères), l’écoulement par les rivières et l’intrusion d’eaude mer. Par conséquent, l’écoulement descendant des eauxphréatiques contaminées par l’arsenic apparaît comme lerésultat de la combinaison de mécanismes de mélange et dechangements des équilibres chimiques.
Resumen Se presenta la primera interpretación documen-tada de hidroestratigrafía y flujo de agua subterránea aescala regional para un área de ∼21,000-km2 de losdistritos afectados con arsénico en Bengala Occidental(Murshidabad, Nadia, Parganas 24 Norte y Parganas 24Sur -incluyendo Calcuta-, India. El modelo hidroestrati-gráfico demuestra la presencia de un acuífero de arenacontinuo semi-confinado que sobreyace un acuitardogrueso de arcilla. El acuífero aumenta su espesor haciael oriente y el sur. En el sur, las capas discontinuas dearcilla dividen localmente el acuífero cercano a la super-ficie en varios acuíferos confinados más profundosconectados lateralmente. Se desarrollaron ocho escenariosde modelos con 22 capas de flujo regional de aguasubterránea en base a la topografía observada, condicionesestacionales, e hidroestratigrafía inferida. Los modelossugieren la existencia de flujo regional norte-sur convariación estacional a través de la cuenca antes del iniciode bombeo extensivo durante los 1970s. El bombeo hadistorsionado fuertemente el patrón de flujo induciendo
Received: 6 December 2005 /Accepted: 9 July 2007
# Springer-Verlag 2007
Electronic supplementary material The online version of thispaper (doi:10.1007/s10040-007-0208-7) contains supplementarymaterial, which is available to authorized users.
A. Mukherjee :A. E. Fryar : P. D. HowellDepartment of Earth and Environmental Sciences,University of Kentucky, Kentucky, KY 40506-0053, USA
A. Mukherjee ())Bureau of Economic Geology, Jackson School of Geosciences,University of Texas at Austin,University StationBox X, Austin, TX 78713-8924, USAe-mail: [email protected]
Hydrogeology Journal DOI 10.1007/s10040-007-0208-7

gradientes hidráulicos verticales altos a través de anchosconos de depresión. El bombeo también ha incrementadola recarga total (incluyendo el flujo de retorno por riego),entrada de ríos, e incursión de agua de mar. Enconsecuencia, el flujo descendente de flujo de aguasubterránea somera contaminada con arsénico parece darpor resultado la contaminación de acuíferos previamenteseguros mediante una combinación de mezcla mecánica ycambios en equilibrio químico.
Keywords India . Hydrostratigraphy . Groundwater flow .Arsenic . WesternBengal basin
Introduction
More than 2% (120 million) of the total population (6billion) of this planet lives in an area of ∼200,000 km2
covering the eastern part of the state of West Bengal(India) and most of Bangladesh. This area, known as theBengal basin (Morgan and McIntire 1959), is the world’slargest fluvio–deltaic system (Coleman 1981; Alam et al.2003). The basin is drained jointly by the River Ganges,River Brahmaputra (also known as River Jamuna inBangladesh), River Meghna and their numerous tributariesand distributaries, and hence is also known as the Ganges–Brahmaputra–Meghna (GBM) basin.
Indiscriminate use of the rivers and streams as path-ways of sewerage and industrial waste by the Bengal basininhabitants has made the surface water impotable. More-over, the introduction of high-yielding dry-season rice(Boro) (Harvey et al. 2005) accelerated the demand forirrigation. This led to the shift of water supply policy fromsurface water to groundwater in both West Bengal andBangladesh during the early 1970s. As a consequence,several million wells (ranging from low yielding hand-pumped to heavy-duty motor-driven) were installed in orderto meet drinking, irrigation, and industrial water demands(Smith et al. 2000; BGS/DPHE/MML 2001; Harvey et al.2005; Horneman et al. 2004). However, by the 1990s, alarge part of the Bengal basin groundwater was determinedto have elevated concentrations of arsenic (As), which canimpact human health at concentrations of 10 μg/l indrinking water (WHO 1993). It has been hypothesized thatthe non-point source, geogenic As, mostly occurs in theHolocene shallow aquifers of the Bengal basin andprobably has been mobilized from the sediments by redoxreactions (e.g., Saha 1991; Bhattacharya et al. 1997;CGWB 1997; Nickson et al. 1998; BGS/DPHE/MML,2001; McArthur et al. 2001, 2004; Ravenscroft et al. 2001;Harvey et al. 2002; Mukherjee 2006). Estimates show thatat present about 25% (McArthur et al. 2004) to 33%(Horneman et al. 2004) of the wells have been identified tobe contaminated by As. Consequently, several hydro-geologic studies have been conducted in the Bengal basin(mostly in Bangladesh) to evaluate the groundwaterresources and to understand the role of groundwaterdynamics (local to regional scale) in influencing the
movement of As-contaminated water within the alluvialaquifers (e.g., MPO 1987; Burgess et al. 2002; Harvey2002; JICA 2002; Cuthbert et al. 2002; Nishant et al.2003; Ravenscroft 2003; van Wonderen 2003; Ravenscroftet al. 2005; Harvey et al. 2006).
In the western part of the Bengal basin (West Bengal), inspite of district-level surveys of groundwater resources bythe Central Ground Water Board (CGWB 1994a, b, c, d, e)and State Water Investigation Directorate (SWID 1998),detailed hydrogeologic studies are lacking. This reportprovides the results of a multiyear hydrogeologic study infour districts of West Bengal investigating groundwaterflow within the arsenic-affected alluvial aquifers. Theobjectives of the study were to delineate the regionalaquifer–aquitard framework of the study area and toevaluate the hydrostratigraphic controls, the effects ofseasonal variability, and the effects of pumping (primarilyfor irrigation) on the spatial and temporal patterns ofgroundwater flow. The study focused on the deeperregional-scale flow (Tóth 1963) instead of the shallower,local-scale flow, on the premise that understanding sub-basinal scale hydrodynamics is important for evaluating thepossibility of arsenic movement from contaminated shallowaquifers to the as-yet uncontaminated deep aquifers (e.g.,van Geen et al. 2003). Efforts were also made to understandthe interaction between the local and regional flow systems,along with estimating and understanding the control ofrecharge and hydraulic parameters on the regional flow.
Study area setting
ExtentFigure 1 shows the study area, which comprises∼21,000 km2 of the As-affected areas of four districts ofWest Bengal, India. These include the eastern part ofMurshidabad, Nadia, North 24 Parganas and South 24Parganas. About 40 million people reside in this area,which includes the city of Kolkata (formerly Calcutta) andseveral other important towns. The area represents aninterfluvial delta plain (Fig. 1b,c), bounded by the mainchannel of the River Ganges in the north, the RiverBhagirathi-Hoogly in the west, the rivers Jalangi, Bhairav,Ichamati, Raimangal and Kalindi in the east, flowingalmost along the Indo-Bangladesh border, and the Bay ofBengal in the south. The River Churni diverges from theRiver Ichamati and flows toward the River Bhagirathi-Hoogly, and the River Matla drains the southern parts ofSouth 24 Parganas (Survey of India 1971). These rivers arethe most important geomorphic features in the study area.
In general, the topography of the study area is very flat[maximum elevation of about 35 m above mean sea level(MSL) near Jangipur, Murshidabad, sloping toward theBay of Bengal in the south], with a gradient of ∼0.1 m/kmfrom north to south. In order to obtain detailed elevations,a digital elevation model (DEM) was acquired from theShuttle Radar Topography Mission (SRTM 90) of the USNational Aeronautics and Space Administration (NASA;
Hydrogeology Journal DOI 10.1007/s10040-007-0208-7

horizontal resolution of 3 arc-sec/90 m; vertical resolutionof 1 m) and processed for the study area (ESM Fig. 1).
Coordinate systemThe locations of the reference points within the study areawere measured in the field by a Trimble® hand-held GPSusing a spherical coordinate system of latitude andlongitude (datum WGS84). To minimize the distortionfor discretization of the grids for the lithologic andgroundwater models, the location data were projected toUniversal Transverse Mercator (UTM 1983), Zone 45(central meridian 87, spheroid GRS 80, reference latitude0, scale factor of 0.9996, false easting 500,000, falsenorthing 0). The coordinates of origin of the modeled areafor both type of modeling were easting 600,000, northing2,380,000.
Background
GeologyThe Bengal basin is a peripheral foreland basin formed asa consequence of subduction of the Indian plate below theEurasian (Tibetan) and the Burmese plates. The basin islocated at the junction of the three plates. It is bounded bythe Peninsular shield of India in the west, Chittagong hillsin the southeast, and the Dauki fault zone (Evans 1964)and Naga thrust in the north and northeast (Sengupta1966). At present, about 1–8 km of Permian to Recentclastic sediments are thought to rest on the western part ofthe basin (study area) (Imam and Shaw 1985).
The stratigraphy of the study area [after Biswas (1963)and Lindsay et al. (1991)] starts with the deposition of thepre-Jurassic Gondwana deposits, which are overlain bythe Late Jurassic to Early Cretaceous amygdaloidal basalts
Fig. 1 Map of the study area(a) showing its location withinWest Bengal in India, andneighboring countries. b Theextent of the groundwater modeland the important rivers (in blue)and towns (red stars) within thestudy area: 1 Raghunathganj,2 Behrampur, 3 Tehatta, 4Debagram, 5 Krishna Nagar, 6Ranaghat, 7 Bashirhat, 8Bongaon, 9 Barasat, 10Canning. The UTM coordinates(in parentheses) are listedbeside the respective latitudeand longitude coordinates. cThe broad geomorphic divisionsof the study area (after CGWB1994e)
Hydrogeology Journal DOI 10.1007/s10040-007-0208-7
and andesites and the ∼250-m-thick Late Cretaceousalternating sandstone–mudstone sequence of the RajmahalGroup. The Rajmahal Group is followed upward by athick, uninterrupted, arenaceous-argillaceous sedimentarysequence from the early Paleocene to the end of thePliocene, comprising the Jaintia Group (Paleocene–Eocene) and Bhagirathi Group (late Eocene to latePliocene). The only interruption in this sandstone–shalesequence is the deposition of the basin-wide, fossiliferousSylhet Limestone in the mid-Eocene. The sediments of theBhagirathi Group are unconformably overlain by the latePliocene–Pleistocene Barind Formation. These Pleisto-cene clays have a distinct yellow-orange hue and arefound as elevated outcrops in the Barinds north of thestudy area and Madhupur Hills in central Bangladesh(Morgan and McIntire 1959). In turn, the Barind Forma-tion is uncomformably overlain by the unconsolidatedHolocene sediments of the Bengal Alluvium, which formsmost of the surficial lithostratigraphic and geomorphicunits throughout the Bengal basin.
In the study area, fluvial processes have resulted in theformation of extensive Holocene flood plains with adominance of coarser grained sediments, representing theoverlapping of a number of sub-deltas (Morgan andMcIntire 1959). Avulsion of the major streams in thearea, which are tributaries or distributaries of the RiverGanges, within a time scale of 100 years, has resulted in athick layer of tens of meters (Allison et al. 2003) ofRecent overbank silts and clays incised by channel sands(Coleman 1969; Umitsu 1987; Goodbred and Kuehl2000). The coastal region in the south has a mixture offine-grained sand and mud deposits with peat layers,which have resulted from eustatic influence (Goodbredet al. 2003). Deposition of the lowest parts of the BengalAlluvium began at the onset of the Pleistocene glacialmaximum (Islam and Tooley 1999), with sea level (i.e.,regional base level) at least 100 m below present MSL.Thus, the rivers draining the plain during that time musthave scoured through the earlier plains (Umitsu 1993).Around 11,000 to 10,000 years before present (BP),deposition of lower delta mud over low-stand oxidizedsand units started, suggesting sea level rise (Goodbred andKuehl 2000) to about 45 m below present MSL (e.g.,Fairbanks 1989). The present GBM delta began toprograde into the Bay of Bengal at this time (Lindsay etal. 1991; Goodbred and Kuehl 2000). From ∼10,000 to∼7,000 years BP, rapid marine transgression occurred(Umitsu 1993; Islam and Tooley 1999; Goodbred andKuehl 2000), resulting in the deposition of fine sediments.Since ∼7,000 years BP to the present, the general trend ofthe eustatic sea-level curve shows continuing sea-levelrise, although with a decreased gradient (Umitsu 1993;Islam and Tooley 1999; Goodbred and Kuehl 2000).
HydrogeologyThe western Bengal basin groundwater system is stronglyinfluenced by the rainfall caused by the southeast monsoonwind. There are distinct dry seasons (October/November
to May/June) and wet seasons (June/July to September/October). Annual rainfall ranges from about<1,200 mm to1,600 mm (CGWB 1994e). Everywhere on the delta,precipitation exceeds annual potential evapotranspiration(Allison 1998). The heavy rainfalls during the monsoonperiod together with snow melt from the Himalayas causeextensive flooding in the Bengal lowlands.
There are very few published systematic descriptionsor stratigraphic classifications available for the alluvialaquifers for the study area (for exceptions, see AIP/PHED1991 and CGWB 1994e). However, several such studieshave been done in the Bangladesh part of the basin (e.g.,UNDP 1982; MPO 1987; Davies 1995; BGS/DPHE/MML 2001; Islam and Uddin 2002; Ravenscroft 2003;Uddin and Abdullah 2003; Ravenscroft et al. 2005). TheBritish Geological Survey, Department of Public HealthEngineering (Government of Bangladesh), and MottMacDonald Ltd (UK) did the most extensive hydro-geologic study of Bangladesh and recognized five poten-tial aquifers based on lithology (BGS/DPHE/MML 2001).Following their nomenclature, aquifers in the West Bengalpart of the basin probably belong to (1) Late Pleistoceneto Holocene Ganges sediments and (2) Early to MiddlePleistocene coastal and moribund Ganges delta deepaquifers composed of stacked, main-channel, medium tocoarse sands at depths more than 130 m. CGWB (1994e)suggested that the aquifers of South 24 Parganas district atmore than 250 m depth are of late Tertiary age. Manyworkers (e.g., BGS/DPHE/MML 2001; Horneman et al.2004; Ravenscroft et al. 2005; von Bromssen et al. 2007)have suggested that the older (probably Pleistocene)sediments of Bangladesh are generally yellow-brown incolor, in contrast to the more recent (Holocene) greysediments, and the older sediments generally have lowerhydraulic conductivity (K) values. However, such stratawith distinctive color have not been reported from thestudy area (Mukherjee 2006).
The aquifers of the study area are highly productive,with the water table mostly encountered within 15 mbelow ground level (bgl). Groundwater levels tend to besimilar from year to year at the beginning of each irrigationseason, which suggests sufficient recharge replenishing thegroundwater systems (BGS/DPHE/MML 2001). CGWB(1994a, b, c, d) and SWID (1998) estimated thattransmissivity (T) values (in m2/day) vary from 3,300 to7,000 in Murshidabad, 5,000 to 8,800 in North 24Parganas, and 500 to 3,000 in South 24 Parganas, withan average storativity (S) of 0.03. Values of porosity (n)were assumed to be 0.2 for the Bangladesh part of thebasin (Harvey 2002; JICA 2002). BGS/DPHE/MML(2001) suggested that the K values for Gangetic sedimentsin Bangladesh could vary from 10 to 100 m/day. In theirsite-specific model of Faridpur (central Bangladesh), theyclassified the sediment as sandy silt (K=4 m/day), finesand (8 m/day), medium sand (25 m/day), and coarsesand (46 m/day). The hydraulic gradient is about 1 m/kmin the northern part of the Bengal basin and about0.01 m/km in the southern Bengal basin (BGS/DPHE/MML 2001). The present-day, natural, regional ground-
Hydrogeology Journal DOI 10.1007/s10040-007-0208-7

water flux to the Bay of Bengal has been estimated bymass-balance calculations to be 2×10¹¹ m3/year (equal toabout 19% of the total surface water flux of 1.07×10¹²
m3/year) (Basu et al. 2001) and 1.5±0.5×10¹¹ m3/year(equal to about 15% of the Ganges-Brahmaputra riverflux) (Dowling et al. 2003).
The groundwater flow systems for the study area havebeen conceptualized [after Tóth (1963) and Ravenscroft etal. (2005)] to consist of (1) shallow flow systems (overlateral distances of a few kilometers) between localtopographic features and (2) intermediate- to regional-scale flows (tens to hundreds of kilometers long) betweenmajor topographic features or basin boundaries. In light ofthe low elevations throughout the study area, intermediate-scale flow may not be distinguishable from regional-scaleflow. Groundwater movement in areas of flat topographyin the Bengal basin may be mostly vertical and lateralflow may be limited to local scale (J. van Wonderen, SirMott Macdonald Ltd, personal communication, 2006).Sikdar et al. (2001) reported the presence of north–southregional flow near Calcutta in the 1950s, but flow haddramatically changed by the 1980s. Harvey (2002) arguedagainst the persistence of any regional flow system inview of the extensive irrigation pumping currentlypracticed in the Bengal basin. Surface water–groundwaterinteraction generally occurs within local flow systems.The River Bhagirathi-Hoogly is a losing stream alongmost of its length and recharges the shallow aquifers(Ghosh and Mukherjee 2002). Deeper groundwater gen-erally has insignificant interaction with the surface waterbodies, and the deeper aquifers have restricted recharge(Mukherjee et al. 2007).
Hydrostratigraphy
Previous studiesAIP/PHED (1991, 1995), CGWB (1994a, b, c, d, e, 1997),SWID (1998), Acharyya et al. (2000), Goodbred andKuehl (2000) and Goodbred et al. (2003) are the onlypublicly-available publications on the sedimentary frame-work of part of or the entire study area. All of thesereports tend to provide brief descriptions of the lithologywithout specifying the relations between the individualaquifers at the local or regional scale.
Data acquisition and sediment classificationLithologic data for this study were collected from 143lithologs of drinking-water, irrigation and observationwells [sources: B.M. Engineering (KrishnaNagar, WestBengal), unpublished data (2005); CGWB 1994d; SWID1998; PHED 2003a, b, c, d] drilled in and around thestudy area as shown in Fig. 2 and Electronic Supplemen-tary Material (ESM Table 1) (see also Mukherjee 2006).Depth of the lithologs ranges from 50 to 612 m bgl (mean240 m, and median 231 m bgl). They are distributedthroughout the area (horizontal spacing varying between<1 km to ∼10 km) except for some areas near the active
delta front and near the eastern border of central Nadiadistrict. To fill the data gap in this latter area, five logswere collected from the adjoining part of Bangladesh(JICA 2002). In the absence of reliable dates for aquifersediments from various depths, the hydrostratigraphy ofthe study area in this report has been based on sedimentgrain size, and older sediments have not been differenti-ated from younger sediments for hydrologic classification.
Fig. 2 Map showing location of the 143 lithologs used forlithologic interpolation and orientation of the cross-sections shownin Figs. 3a–d and 4
Hydrogeology Journal DOI 10.1007/s10040-007-0208-7
The lithology of the logs has been recorded at sub-metervertical resolution and consists of four major types ofunconsolidated sediment: gravel, sand, sandy clay andclay. A number of lithologs from various localities haverecorded further subdivision of sands in terms of grainsize (very coarse, coarse, medium, fine). Description ofthe color of these sediments and their scope of use in therelated studies has been documented by Mukherjee(2006). For the purpose of this study, only the majorsediment types were used. A relatively thin soil horizonwith a general thickness of 2–4 m covers the study area.The soil types are Entisols (Udifluvents) (north ofCalcutta), Alfisols (Tropaqualfs) (in most of South 24Parganas) and Aridisols (in the delta front) (CGWB1994e). These soils have not been included in themodeling or the description of the hydrostratigraphy.
From a general hydrogeologic point of view, thesesediments have been categorized as aquifer (sand andgravel) and aquitard (clay). The position of the sandy clayis ambiguous: it can act as either less permeable aquifer orhigher-permeability aquitard. Its exact category will varyfrom locality to locality based on the sand/clay ratio andpermeability. Although the less permeable sediments likeclay transmit some groundwater, they separate theoverlying aquifer(s) from lower aquifer(s) by hydraulicconductivity (K) contrast. In the study area, the extent,thickness and K of these clay or aquitard layers are veryimportant as they govern the three-dimensional flow ofgroundwater at the regional scale. In this report, the namesof the sediment types and hydrogeologic categories willbe used interchangeably for the description of bothhydrostratigraphy and groundwater flow modeling.
Lithologic modelingBased on the acquired lithologs, a lithologic model wasdeveloped with RockWorks (RW) version 2004® (Rock-Ware, Golden, Colo., USA). The lithologic solid modelwas created using a block-centric finite-difference grid.The gridding was done by eight nearest-neighbormethodology with 3-D interpolation by average mini-mum distance. The solid model was developed to a depthof 300 m below MSL and the topographic elevation wasdefined by the SRTM 90-DEM grid. The sensitivity ofthe model was tested by varying the horizontal andvertical spacing of the nodes and an optimized finalmodel was constructed that was least sensitive to changesin spatial resolution (i.e., smaller grid sizes). Theresolution of the final model was 1000 m (x)×1000 m(y)×2 m (z). The resulting discretization consisted of135×nodes×335 y nodes×165 z nodes, thus having7,462,125 solid model nodes, each with a voxel volumeof 2,000,000 m3. Four nodes were assigned around eachinterpolated datapoint. It should be noted that the resultsof the modeling are not free from uncertainties (whichmay improve with an increase in datapoints), butillustrate one of the most probable scenarios. Thesmallest scale of variation that the model is able todepict is equal to the resolution of one voxel.
Four north–south and 25 east–west manually interpo-lated lithologic cross-sections (11 of which are shown inFig. 2) were developed from the map of the study area,visually compared with their modeled counterparts, andcorrected for any obvious error or noise. The interpolationof the final model was verified by using 14 randomly-spaced lithologs (10% of the total number of lithologs),which were not used in the construction of the model, andwas found to be satisfactory by visual comparison. Anumber of profile sections and fence diagrams weredeveloped from this final model. It was observed that themodeled transects were closely comparable to the manu-ally interpolated transects, except that the computer-generated ones seemed to demonstrate/simulate the 3-Dextent of the lithologic bodies to a greater extent. Severalplan-view maps have also been developed for specificdepths in order to visualize the nature of the aquifers andaquitards at those depths.
ResultsThe lithologic modeling suggests the presence of a verycomplex 3-D hydrostratigraphic framework in the subsur-face of the western Bengal basin. A detailed description ofthe study area at the block scale is provided here toillustrate the general spatial trends in aquifer thickness andspatial variability. The cross-sections in Figs. 3a–d and 4and depth maps (ESM Fig. 2) provide detailed depictionsof the aquifer framework. The names of the localitiesmentioned henceforth represent the respective blocks (notshown on the map) or towns. These names are followedby numbers in parentheses corresponding to the locationsof lithologs shown in Fig. 2, listed in ESM Table 1. At adepth of ∼300 m below MSL (the base of the model), athick clay deposit covers the whole area. In the northern-most part of Murshidabad (from west to east, the blocksare Raghunathganj-II, Lalgola, Bhagwangola-I and -II andRaninagar-II), the topmost sand layer extends from nearthe surface to a depth of about 65–75 m (locations 73, 79).Below this unconfined aquifer is a basal clay aquitardextending from ∼80 m to more than 300 m in the west(73, 74, 75), and dividing into multiple layers toward theeast (80, 89). Near Raninagar-II, the upper clay layer isvery thin and is mostly replaced by a sandy clay horizon,which lies between thick sand layers. In the west, thisthick aquitard extends to near Beldanga (86) and Kaliganj(45), while it diminishes to form an extensive sand layertoward Karimpur-I and -II in the east to a depth of 110 m(58, 59, 60), gradually increasing to about 190 m (61, 62).The most noteworthy thing about this area is the presenceof isolated aquifers at depths of ∼200 to 230 m and ∼240to 265 m extending from Bhagwangola (76, 77) toBehrampur (84) through Murshidabad-Jiaganj, with thepossibility of southward extension. These isolated aquifershave water chemistry distinct from the shallower aquifer(Mukherjee 2006; Mukherjee and Fryar 2007). Towardsthe south, the unconfined sand aquifer thickens to a depthof about 190 m in Nakashipara (near Bethuadahari in thewest, 47) and to a depth of about 230 m in Tehatta (67,
Hydrogeology Journal DOI 10.1007/s10040-007-0208-7

Fig. 3 a–d Modeled cross-section along transects AA’, BB’, CC’, and DD’ in Fig. 2 (vertical exaggeration=265×). Litholog numbers arelabeled along the top of the sections
Hydrogeology Journal DOI 10.1007/s10040-007-0208-7

70). The basal aquitard exists from ∼230 m to more than300 m depth. There are also some isolated aquifers inTehatta from a depth of ∼120 to 160 m (42, 43).
The unconfined aquifer changes to a confined/semi-confined aquifer south of Shantipur (53) because of thickclay layers from near surface to a maximum depth of60 m. These layers thin to the east, toward Ranaghat-II(52), and ultimately vanish toward the Bangladesh border(137, 138). In the west, near the town of Kalyani (123),this surficial aquitard extends to about 65 m bgl, extendingsouth to the north-northeast of Calcutta, where it is thin(12 to 25 m bgl) near South Dumdum (129) andBidhannagar (130), and continues toward DiamondHarbour (100, 102). In the east, toward Ranaghat (51,52) and eastern Chakdah (56), this aquitard thins to about10–12 m before it disappears near the western border ofBagda (1). Near the India-Bangladesh border, two gravelhorizons exist at depths of about 110 to 120 m and 160 to180 m, as observed in Krishnachandrapur (136). Thesegravel horizons, probably indicating paleo-channels, thintoward the west, and only the top horizon is observable ata depth of about 75–100 m at Palashipara, Tehatta (68).The basal aquitard exists at 170–200 m depth in southNadia (51, 52, and 123). In the western part of North 24Parganas, the extensive basal clay layer splits to form asandwiched confined aquifer, which continues to the Bayof Bengal. This aquifer starts in the north of Calcutta andis prominently visible in Budge Budge (111) at a depth of212–280 m. Some gravel horizons are visible near theBangladesh border of northern North 24 Parganas at adepth of 138–148 m (3) and in Jessore, Bangladesh (115–120 m, 185–190 m, and 260–280 m).
Two thick clay lenses occur farther south of Calcutta,toward Budge Budge (111) (52–151 m) in the west andSwarupnagar block (82–204 m) in the east (4, 31),continuing toward south-central South 24 Parganas. Thehydrostratigraphy of southern South 24 Parganas isdominated by multiple aquitards (100, 118, 119, 121,and 126). Many of these clay layers contain fragments ofinvertebrate fossils, indicating a marine origin. These claylayers separate a succession of fresh–brackish–freshaquifers. The brackish aquifers exist at depths of 22–168 m in southern South 24 Parganas (CGWB 1994d).Around Karaibaria, Diamond Harbour (114) area, a gravelhorizon is visible at a depth of 98–150 m. This gravel bedis a marker horizon between the overlying brackishaquifer and fresh water below (CGWB 1994e).
Discussion and proposition of hydrostratigraphicnomenclatureHydrostratigraphic units have been defined as bodies ofrock with considerable lateral extent that compose ageologic framework for distinct hydrologic systems(Maxey 1964). Based on the hydraulic properties ofrocks/sediments, they were supposed to be practicalmappable fundamental units for describing hydrologicsystems in the field (Seaber 1988).
As mentioned in the Background section, the generalnature of the aquifer system in Bangladesh has beendiscussed by many workers, but for the western Bengalbasin there is a scarcity of such published studies. Thus,based on the discussion so far, a hydrostratigraphicnomenclature for the study area is proposed here. Seaber
Fig. 4 Modeled cross-sections along transects EE’, FF’, GG’, HH’, II’, JJ’, and KK’ in Fig. 2 (vertical exaggeration=80×)
Hydrogeology Journal DOI 10.1007/s10040-007-0208-7

(1988) commented that because of the lack of physicalmaterial in Maxey’s (1964) definition of hydrostrati-graphic units (dynamics of hydrologic regime), hydro-stratigraphic units have not been formally adopted by theNorth American Commission on Stratigraphic Nomencla-ture. Hence the proposed nomenclatures in this study arealso intended to be informal.
In summary, the study area is dominated by a majorsingle-aquifer system, which is mostly unconfined/semi-confined except in the southernmost part. In severallocalities, this main aquifer has been locally divided intomultiple layers by the presence of discontinuous aquitards(with a lateral extent of one to a few kilometers), butexcept in the southernmost part (southern portion of North24 Parganas and South 24 Parganas), the chemistry isgenerally similar throughout (Mukherjee 2006; Mukherjeeand Fryar 2007; Mukherjee et al. 2007), supporting theinterpretation of a single hydrostratigraphic unit. Thedeeper, isolated aquifers are differentiable from the semi-confined portions of this main aquifer on the basis ofgroundwater chemistry (Mukherjee 2006). The nameSonar Bangla (Golden Bengal) aquifer is proposed forthe main aquifer in the study area as shown in Fig. 5,after the poetic description of Bengal by Tagore (1905).The thick, extensive, basal clay layer that marks a definitedivision between the Sonar Bangla aquifer and any otheraquifer present below −300 m below MSL is named as theMurshidabad aquitard due to its best development in theMurshidabad area (Fig. 5). The Sonar Bangla aquiferprobably formed over the Murshidabad aquitard as amajor shift in the delta-building process of the Ganges-Brahmaputra. The top surface of the Murshidabadaquitard deepens toward the east and south, but it can bevertically traced to a depth of at least 300 m. In thesouthernmost part of the study area, distinct intermediate-depth aquitards extend northward from the active deltafront in the south and pinch out northward about themiddle of North 24 Parganas. These aquitards havedivided the main aquifer into multiple but occasionallyconnected (at intervals of tens of kilometers) layers, which
have some differences in chemistry (Mukherjee 2006).While the upper and lower portions of the aquifer in thisarea contain fresh water, the intermediate portion containsbrackish water (CGWB 1994e), probably as a result of seawater intrusion from the Bay of Bengal (Mukherjee et al.2007). These aquitards have confined a part of the SonarBangla aquifer from near a line between Calcutta andBashirhat (34), and thicken toward the south. They arenamed as the Ichamati-Bhagirathi-Hoogly aquitard sys-tem, after the two major rivers that drain the area (Fig. 5).
Groundwater flow modeling
Previous modeling effortsExcept for some local-scale models that have beendeveloped (e.g., for the Yamuna subbasin in North 24Parganas; Ghosh et al. 1999; Mukherjee 2004), no reportof comprehensive modeling was found for the study area.However, multiple hydrological modeling studies havebeen undertaken in the Bangladesh part of the basin,including northwestern Bangladesh (MMP 1982), Farid-pur and Chapai Nawabganj (BGS/DPHE/MML 2001),southwestern Bangladesh (Hassan 1992), Jennaidah andJessore (JICA 2002), the Jamuneswari, Lower Atrai andBarind basins and the Dhaka area (Hossain et al. 2003),and the country as a whole (MPO 1990; van Wonderen,2003).
Methodology and model designBecause of the heterogeneities and complexities associat-ed with the study area (e.g. local-scale variations ofaquifer properties, presence of numerous surface waterbodies etc.), several generalizations, simplifications andassumptions were made to construct the regional-scalemodel.
The modeled study area is bounded in the north, west,and east by the Rivers Ganges, Bhagirathi-Hoogly andJalangi/Ichamati, respectively, and to the south by the Bayof Bengal. The study area is 335 km in length and 110 kmin width. However, the total modeled area encompassesthe study area along with surrounding areas as shown inFig. 1b in order to prevent edge effects. The 3-D,constant-density groundwater flow was simulated by ablock-centric, finite-difference grid model using MOD-FLOW (McDonald and Harbaugh 1988). MicrosoftWindows® based Groundwater Vistas® (GV) version 4(Environmental Simulations International, Reinshold, Pa.,USA) was used as the pre and post-processor.
Ideally, the modeling should have been done intransient mode to show the continuous time-variant natureof flow under seasonal variations in recharge andabstraction rates. However, estimates of total inflow andseasonal surface water-groundwater interaction are poorlyconstrained, given the near-absence of time-variant fielddata (e.g., seasonal groundwater levels and stream stage)from the study area. Therefore, construction of detailedtransient models was unsuccessful, so steady-state
Fig. 5 Conceptual block diagram showing the proposed hydro-stratigraphic units (not to scale)
Hydrogeology Journal DOI 10.1007/s10040-007-0208-7

(dynamic-equilibrium) models were developed for indi-vidual seasons. However, a very simplified transientmodel (with approximated, seasonally varying groundwa-ter levels, inflows, and aquifer properties) was developedfor hypothesis testing. A plot of hydraulic heads versustime for this simplified transient model has a seasonally-periodic wave form (similar to observations by Michaeland Voss, unpublished). The maxima and minima of theplot occur at the ends of wet and dry seasons (definitionsof the seasons are given later), respectively, visuallymatching with the simulated steady-state heads for thoseseasons. This visual match suggests that the steady-statemodels are snapshots of the transient mode during thepeak of each season, and thus indicates suitability of thepresent approach.
Discretization and hydraulic parametersFor each of the models, the study area was horizontallydiscretized as 335 (x)×110 (y) (36,850 horizontal gridcells) with each grid cell having dimensions of 1,000 m(x)×1,000 m (y). Maximum thickness of the model was330 m. The SRTM DEM was used to define the surfaceelevation. The model was vertically discretized in 22layers (total of 810,700 3-D grid cells). Except for the toplayer, which had variable thickness as a result oftopographic features, and the 4th layer, which had athickness of 5 m in order to accommodate shallowirrigation wells, all layers were defined as 15 m thick.The aquifer-aquitard relationship of the model was basedon the hydrostratigraphic model (1,000 m×1,000 m×15 m) developed in RockWorks. The 22nd layer (285–300 m below MSL) was defined as the basal no-flowboundary, consistent with the extensive clay layer at about300 m below MSL. Transmissivity (T) values of sedi-ments were calculated iteratively, using the method ofMace (2001), from 132 specific capacity tests in the studyarea (35 from Murshidabad, 15 from Nadia, 56 fromNorth 24 Parganas and 26 from South 24 Parganas):
Tf ¼ Sc4p
ln2:25� Ti � tp
r2wS
� �ð1Þ
In this method, Ti is the initially assumed and Tf is thefinal T value, respectively, Sc is specific capacity, tp isduration of pumping, rw is the well radius, and S isstorativity (set to an average of 0.03; SWID 1998). Theaverage hydraulic conductivity (K) was calculated from theT and modeled aquifer thickness for the four districts, andwas found to range between 19.8 m/day and 65.0 m/day,with an mean of 42.1 m/day. Hence 42 m/day was used asthe initial horizontal K (Kx=Ky) value for sand, with Kz
assumed equal to 1/10 Kx (within the range given byDeming 2002). An initial Kx-y value of 4 m/day wasassigned for sandy clay according to BGS/DPHE/MML(2001) and 0.01 m/day was selected for clay according toJICA (2002). Porosity was assigned as 0.2 (Harvey 2002).
The final values of the aquifer parameters were ascertainedby inverse modeling and model response to sensitivityanalyses (mentioned later). The layers were allowed tohave seepage from the top and leakage through the base,making them hydraulically connected. The top-most layerwas defined as unconfined and the second layer asunconfined (T varying). The rest of the layers were definedas confined, as the water table was not expected to fall>30 m.
The rivers shown in Fig. 1b were used as the specifiedhead boundaries (Fig. 6a). The rivers were divided into 11reaches and were assigned attributes like channel width(W) and length (L), stream stage, channel bed elevationand thickness (h), and sediment type based on datacollected from the field or from various sources. Due tounavailability of measured conductance (C) data of riverbeds for the study area, C values were calculated as (inm2/day):
C ¼ K �W � L
h
� �ð2Þ
where K is the hydraulic conductivity (range: 25 to 15 m/d)of the bed sediments (assumed from the calculated K valuesfor similar sediment type of the adjoining aquifers). Belowthe boundaries, the layers were assigned with conductivityaccording to the modeled lithology. The Bay of Bengalwas set as a constant-head (0 m) boundary, which wasassigned to the southernmost rows at the edge of the studyarea along the coastline (low tide line) and to the top fourlayers of the model (Fig. 6a). The depth of the boundarywas based on the bathymetric data from Survey of India(1971).
RechargeThe total recharge inflow in the study area can beconceptualized as having several sources (after Ravenscroft2003): 1) precipitation, 2) irrigation return flow, and 3)seepage beneath standing surface water bodies (e.g.,lakes, ponds) and losing reaches of streams. No detailedprevious data on total recharge were available for thestudy area and hence it was one of the least certain inputparameters.
SWID (1998) estimated that meteoric recharge is up to15% of total precipitation. The average annual precipita-tion in the study area, which was calculated from 25locations in and near the study area (Fig. 6b) based onmultiple years’ data (mostly 1901 to 1970, maximumrange 1811 to 2005) obtained from the National ClimaticData Center (2005) is 1,484 mm. BGS/DPHE/MML(2001) estimated meteoric recharge in the range of 0.3–5.5 mm/d (i.e. ∼100 to 2,000 mm annually) for differentareas of Bangladesh. However, due to distinct wet(monsoon) and dry (pre-monsoon and post-monsoon)seasons, annual recharge needs to be considered in aseasonal perspective.
Hydrogeology Journal DOI 10.1007/s10040-007-0208-7

On average (1901 to 1970), the seasonal rainfall can beconsidered as pre-monsoon (January–May, 16.23% ofannual rainfall), monsoon (June–October, 82.21%) andpost-monsoon (November–December, 1.57%). This indi-cates that the bulk of the precipitation takes place duringthe wet season, and suggests that meteoric groundwaterrecharge also disproportionally takes place during thistime. The total rain water that is available for recharge canbe termed as potential recharge (PR):
R� ET ¼ PR ¼ ARþ SF ð3Þ
where R is total precipitation, ET is evapotranspiration, SFis the surface overflow and AR is the amount of meteoricwater that actually recharges the aquifer. During dryseasons, PR ≈ AR because SF is extremely low (availablePR is likely to infiltrate). However, during the wet season,after a period when the aquifers become completelyreplenished (aquifer-full conditions), any further PR isrejected (also sometimes termed as rejected recharge).This contributes to extensive flooding (as noted in BGS/DPHE/MML 2001; Ravenscroft 2003), and SF >> AR.
Accurate quantification of AR and SF requires long-termhydraulic head data and surface water stage measurementsfrom multiple locations in the study area. Because suchdata were not available, AR was estimated indirectly byapproximation of seasonal PR from meteoric data (years1901 to 1970 in most locations, 1811 to 2005 in Calcutta).As discussed earlier, during the pre- and post-monsoonseasons, the estimated PR was used as the AR in themodel. However, for the monsoon, inverse modeling withexpected hydraulic head data was used to estimate the ARfor aquifer-full conditions. The recharge was applied tothe top layer of the model.
The PR was estimated as a difference of the totalprecipitation and the ET in a specific area. ET wascalculated by the method of Pike (1964) as
ET mm=monthð Þ ¼ P
1þ PPET
� �2h i1=2 ð4Þ
where P is average precipitation (mm/month) and PET ispotential evapotranspiration (mm/month). Values of PET
Fig. 6 Maps of the study areashowing: a the boundary con-ditions used in the models alongwith the permanent water-logged areas (redrawn afterCGWB 1994e); b the 25 mete-orological stations in andaround the study area whosedata were used in contouring thezonal (developed by kriging)meteoric potential recharge (PR)used in the models
Hydrogeology Journal DOI 10.1007/s10040-007-0208-7

were approximated from the method of Malmstrom(1969):
PET mm=monthð Þ ¼ 40:9� e� Cð Þ ð5Þ
where e� ¼ 0:611� exp 17:3�CCþ237:3
� �, and τ is average month-
ly temperature (°C).The values obtained from these simplistic meteorolog-
ical methods, which are enhanced versions of the methodsof Penman (1948) and Thornthwaite (1948), are certainlynot as accurate as would have been obtained by usingsophisticated models (e.g., Penman-Monteith; FAO 1990).However, the simpler methods were preferred for thisstudy because they do not require approximation of a largenumber of parameters for which data were not available.The mean PR calculated for the study area, 587 mm/yearor 1.61 mm/day (range: 384–767 mm/year), is 39% of themean annual rainfall. This mean PR is very close to theempirical estimate of average recharge (600 mm/year or1.64 mm/day) by Basu et al. (2001) and Dowling et al.(2003) for the entire Bengal basin. The calculated PRvalues also fall in the range of annual PR estimated fromadjoining areas of Bangladesh by systematic multiyearstudies of MPO (1987) and BGS/DPHE/MML (1999),and by field experimentation of JICA (2002) in Jessore,southwest Bangladesh (709 mm). The monthly PR datafor each of the 25 locations were further groupedaccording to the previously defined seasons: pre-monsoon(mean: 0.18 mm/day, range 0.15–0.25 mm/day), monsoon(mean: 3.67 mm/day, range 2.41–4.86 mm/day), and post-monsoon (mean: 0.06 mm/day, range 0.05–0.08 mm/d).These calculated PR data from the 25 meteorologicalstations (as mentioned before) were used to develop zonalrecharge values by kriging in the seasonal flow models(Fig. 6b).
JICA (2002) noted that, in areas of Bangladeshadjoining the present study area, hydraulic heads inobservation wells (n=300) fall by 1–3 m during the pre-monsoon because of extensive pumping. These with-drawals are replenished annually, leading to similargroundwater levels at the beginning of each irrigationseason (BGS/DPHE/MML 2001). This indicates that the
total annual recharge is equal to the difference ingroundwater levels between the wet and dry seasons.During the pre-monsoon in the study area, hydraulic headsfall to a mean of 5.35 m bgl in observation wells (range:0.8–16.3 m, SD 2.8, n=97). Hence, assuming aquifer-fullconditions (as indicated by extensive flooding during eachmonsoon) in most parts of the study area, the total averageinflow is ∼2–4 m (excluding the upper <1–3.5 m of soil).Mass-balance calculations thus suggest that a majority ofrecharge is non-meteoric inflow (NMI), most probablyreturn flow from flood irrigation along with percolationfrom surface water bodies (as advocated by Harvey et al.2005, 2006 and Ashfaque and Harvey 2006). As therewere no previous estimates available for these inflowamounts, the observed heads in the study area (n=118)were used in inverse simulations with the present-daymodels, and the NMI input was estimated.
Groundwater abstractionIn the study area, four types of wells are typically used forabstraction of groundwater: private or government-owned,shallow (generally 10–50 m depth), low-yield, hand-pumptubewells (HTW); government-owned, electric-motor-driven, high-yield (50–100 m3/h), public-water-supplydeep tubewells (PDTW); private, relatively shallow(generally 10–70 m depth), low to medium yield (10–20 m3/h), shallow irrigation tubewells (STW), operated bydiesel-powered [4.5 horse power (h.p.)] centrifugal orsubmersible pumps; and government-owned, relativelydeep (60–180 m; CGWB 1994e), high-yield (up to200 m3/h), deep irrigation tubewells (DTW), operated byelectric (18–20 h.p.) turbine or submersible pumps.
The HTWs are discontinuously used throughout theday for domestic purposes and would have very limitedeffect on regional groundwater flow. The PDTWs aretypically used for 6 h/day for water supply through pipedschemes and, because of their limited numbers andrestricted hours of operation, they were not considered inthis modeling exercise, except in and around Calcutta,where the main abstraction takes place by a dense networkof PDTWs (Table 1). The STWs and DTWs are suspectedto have maximum effect on the groundwater flow systems
Table 1 Details of deep irrigation wells (DTWs) for each district and public-water-supply deep tubewells (PDTWs) for Calcutta that wereused in groundwater models
District Pump details Pre-monsoon Monsoon Post-monsoonNumbera Rate
(m3/h)bOperationhours(/day)b
Pumping(m3/m2/day)
Operationhours(/day)b
Pumping(m3/m2/day)
Operationhours(/day)b
Pumping(m3/m2/day)
Murshidabad 445 150 15 3.32E–04 4 8.84E–05 6 1.33E–04Nadia 757 150 15 4.67E–04 4 1.25E–04 6 1.87E–04North 24 Parganas 324 100 15 1.23E–04 4 3.29E–05 6 4.94E–05South 24 Parganas 29 75 15 3.23E–06 4 8.62E–07 6 1.29E–06Calcutta 500c 100 6 1.41E–03 6 1.41E–03 6 1.41E–03
aMID (2001)bM.K. Sinha, State Water Investigation Directorate, Government of West Bengal, personal communication, 2004cNumber of PDTWs estimated from The Statesman, Calcutta, 6 June 2004, local section, page 6
Hydrogeology Journal DOI 10.1007/s10040-007-0208-7

and hence were used in the model as pumping nodes.Their current estimated number for each district within thestudy area (according to the last census; MID 2001) andgeneralized estimates of hours of operation, depth, andpumping rate (local information and M.K. Sinha, SWID,Government of West Bengal, personal communication,2004) (Tables 1 and 2) were used to determine thepumpage for each grid cell following the equation:
Q ¼ N � r � t
A
� �� a ð6Þ
Here, Q=the assigned total pumpage (outflow) value toeach grid cell for a specified time [L3]; A=area of eachdistrict within the model boundary [L2]; N=number ofpumps; r=pumpage rate [L3/T]; t=hours of operation perday [T]; a=area of each grid cell.
In the study area, rice is cultivated by flood irrigationduring the pre-monsoon, requiring at least 1 m ofgroundwater abstraction, followed by mainly rainwater-fed cultivation during the monsoon, and groundwater-fedpost-monsoon cultivation. Based on the cultivation sea-sons and distribution of recharge, three sets of modelswere developed for this study:
i) with pumping: monsoon (M-p), post-monsoon(POSTM-p), pre-monsoon (PREM-p), based on num-bers of DTWs and PDTWs in 2001;
ii) without pumping: monsoon (M), post-monsoon(POSTM), pre-monsoon (PREM), assuming no DTWsor PDTWs (pre-1970s conditions);
iii) projected pumping: average population growth ofWest Bengal for 1991–2001 was 18.15%; rates bydistrict are tabulated in Table 3 (Census 2001).Assuming the same rate of population growth in thenext two decades, projected number of pumps andpumping rates for 2011 (2011-p) and 2021 (2021-p)for each district were calculated according to thefollowing equation:
N ¼ h� p ð7Þ
where N=projected number of pumps; η=number ofpumps per capita in 2001; p=projected population in theyear of interest. Based on these estimated data, two pre-
monsoon models (assuming same pumping rates, hours ofoperation and tapped depths as at present) were simulated.
The modeling was started with the M models,suggesting conditions at the end of monsoon season. Thetop of the uppermost layer was assigned as the initial headfor these models, simulating the aquifer-full condition.Subsequently, the post- and pre-monsoon models weredeveloped with starting head conditions forwarded fromthe end of the preceding model.
Inverse modeling and sensitivity analysesSome of the parameters used for modeling were betterknown (e.g., surface elevation, PR, pumping) than others(e.g., hydraulic properties, NMI). Hence, inverse model-ing was performed for parameter estimation for K of sandand clay, porosity, and NMI using recent hydraulic-headvalues (sources: field measurements; CGWB 1994d, e;SWID 1998; Public Health Engineering Department,Government of West Bengal, unpublished data, 2005).These were measured in different locations and seasons (n=97 for pre-monsoon and n=21 for post-monsoon), mostlyfrom deep wells in the main aquifer within the study area.Due to the larger number of data points available (mostlymeasured during April and May) for the PREM-p model,it was used as the base model for estimation of aquiferparameters and pre-monsoon NMI, while the POSTM-pmodel was used only for the post-monsoon NMI. In theinverse mode, initial values of aquifer parameters werebased on the values obtained from previous studies orfield measurements (as described above) and the totalinflow (meteoric recharge+NMI). The values obtained atthe end of the analyses were used for forward simulationsand determining the calibration statistics for PREM-p.Sensitivity of hydraulic heads in target wells to modelparameters was also analyzed in the PREM-p model bysequentially varying the Kx-y of sand and clay, NMI,stream bed conductance, stages of major streams, andgroundwater abstraction.
Results and discussion
Inverse modeling, sensitivity, and calibrationInverse modeling predicted an average value of 37.5 m/day(Kx) and 25 m/day (Ky) for the aquifer and 0.1 m/day
Table 2 Details of shallow irrigation wells (STWs) for each district that were used in groundwater models
District Pump details Pre-monsoon Monsoon Post-monsoonNumbera Rate
(m3/h)bOperationhours(/day)b
Pumping(m3/m2/day)
Operationhours(/day)b
Pumping(m3/m2/day)
Operationhours(/day)b
Pumping(m3/m2/day)
Murshidabad 66,664 10 12 2.65E–03 4 8.83E–04 6 1.32E–03Nadia 94,789 10 12 3.12E–03 4 1.04E–03 6 1.56E–03North 24 Parganas 63,202 10 12 1.93E–03 4 6.42E–04 6 9.63E–04South 24 Parganas 9,452 10 12 1.12E–04 4 3.75E–05 6 5.62E–05
aMID (2001)b Estimated from CGWB (1994e), SWID (1998), MID (2001) and field information
Hydrogeology Journal DOI 10.1007/s10040-007-0208-7
(Kx–z) for aquitards. These values are within the range ofsand and clay K values reported by BGS/DPHE/MML(2001) and JICA (2002), as noted above. The values alsoagree well with Michael and Voss (unpublished) whocalculated a mean Kx–y value of 43.2 m/day (range: 0.5–259 m/day) for the whole Bengal basin based on drillers'log analyses and on inverse simulations using hydraulicheads and groundwater ages. The inverse model convergedwith its initially assigned porosity value of 0.2.
The results of the sensitivity analyses showed thatthe model was most sensitive to changes in net inflow(and thus groundwater abstraction), followed by K ofthe aquifer. The model was found to be insensitive toporosity and stream-bed conductance. Moving theconstant-head boundary (Bay of Bengal) 10 km land-ward from the originally designated position had anegligible effect on the nearby calibration targets (<5%change in the computed heads). Stream stages (specifiedheads) controlled heads in adjacent cells, but nodiscernable effect was observed for targets that were∼5 km away.
Figure 7 shows the posted residuals (differencebetween observed and computed head) from the forwardmodel calibration of PREM-p and POSTM-p with thebest-fit parameter values obtained from the inversesimulations. The simulations yielded mean residuals of−1.2 m (range: −8.34–7.52 m, SD 3.10 m) and 0.52 m(range: −3.70 to 5.60 m, SD 2.17 m), respectively, andshowed r2 values of 0.81 and 0.93, respectively, forbivariate plots of computed head versus observed head.The residual (i.e., the error range) of the computed head atany individual calibration target point was probably acumulative manifestation of the assumption of basin-wideuniform values for each aquifer parameter, discrepancy oftopographic elevation of the target point (∼±2 m),and local flows (including effects of micro-topographyand small surface water bodies, such as paleochannels andponds). The residual subsumes the uncertainties associatedwith the simplification of seasonality, estimated rechargerate, stream stage estimation, difference between attributedand actual land use (e.g., pumping rate, number of hoursof pumping), and local-scale variations in lithology. Someareas have larger positive residuals (observed>computed;e.g., in and around Calcutta) or negative residuals
(observed<computed; e.g., northern parts of Murshidabadand south-central North 24 Parganas). These indicate thatzonal (local to intermediate-scale) refinement of the modelinput parameters is required for better simulation results inthose areas (which is beyond the scope of the presentstudy).
Net inflow and mass balanceSince the 1970s, pumping has lowered the water table inthe dry seasons. To balance groundwater abstraction whilestill attaining aquifer-full conditions at the end of themonsoon, recharge must have increased. Figure 8 showsthe comparison of mass balance between the variousmodel scenarios. The mean meteoric recharge calculatedis 183 mm/year (range: 148–211 mm/year) (Table 4).According to SWID (1998), recharge would be≤∼223 mm/year (15% of mean annual precipitation).Rangarajan and Athvale (2000) determined a mean naturalrecharge rate of 198 mm/year (13.6% of annual precipi-tation) from their study area in North 24 Parganas in 1995using a tritium injection method. The adjoining areas ofBangladesh were identified to have usable potentialrecharge of<250 mm/year (MPO 1987) to<300 mm/year(BGS/DPHE/MML 1999). The estimated total groundwa-ter abstraction from the study area is 8.7×10⁹ m3/year, ofwhich 89% is contributed by shallow pumping and 11%by deep pumping. Consequently, 274 mm/year of NMI isrequired to attain the observed heads (Table 4). The massbalance error ranges between 0.005% (PREM-p) and−0.0003% (2021-p). Using the estimated volume of theaquifer in the lithologic model and assuming a porosity of0.2 (Harvey 2002), the volume of groundwater underaquifer-full conditions would be ∼4.5×10¹¹ m3. Theestimated total recharge for the study area is between9.4×109 and 1.3×10¹⁰ m3, which is ∼2% of the totalgroundwater resource.
Groundwater flow
Prior to extensive pumping (pre-1970s)The sequence of the modeling for the study area startswith the monsoon model (M). However, hydraulic heads
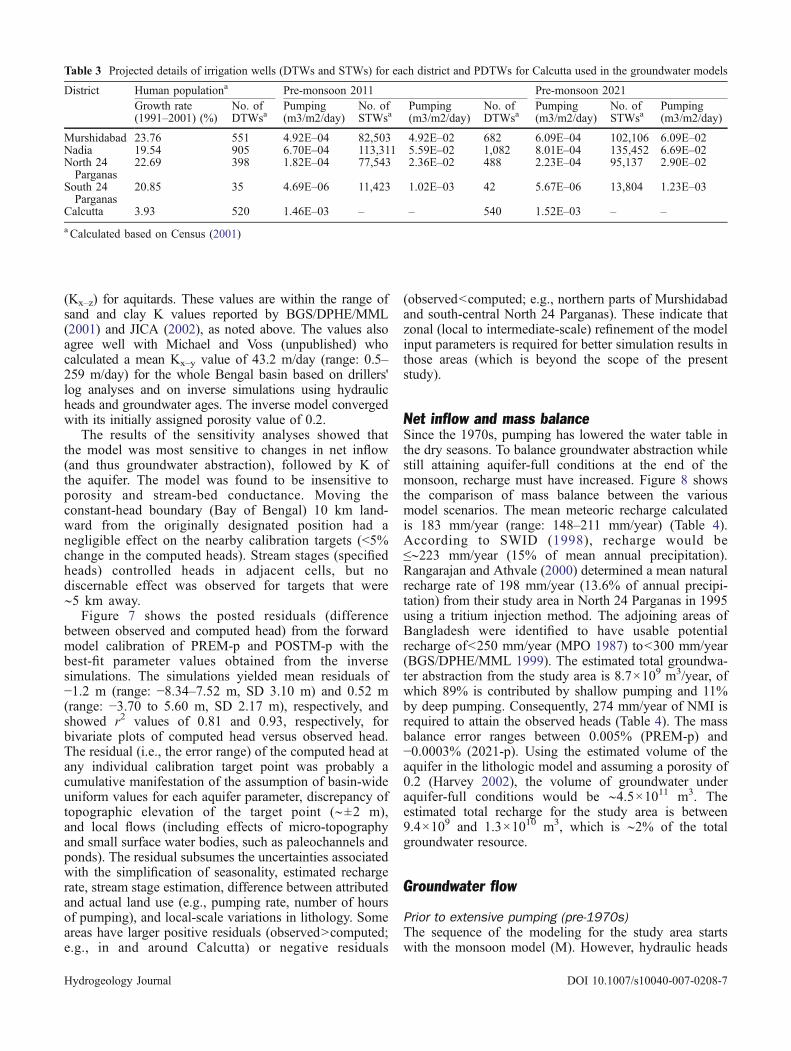
Table 3 Projected details of irrigation wells (DTWs and STWs) for each district and PDTWs for Calcutta used in the groundwater models
District Human populationa Pre-monsoon 2011 Pre-monsoon 2021Growth rate(1991–2001) (%)
No. ofDTWsa
Pumping(m3/m2/day)
No. ofSTWsa
Pumping(m3/m2/day)
No. ofDTWsa
Pumping(m3/m2/day)
No. ofSTWsa
Pumping(m3/m2/day)
Murshidabad 23.76 551 4.92E–04 82,503 4.92E–02 682 6.09E–04 102,106 6.09E–02Nadia 19.54 905 6.70E–04 113,311 5.59E–02 1,082 8.01E–04 135,452 6.69E–02North 24Parganas
22.69 398 1.82E–04 77,543 2.36E–02 488 2.23E–04 95,137 2.90E–02
South 24Parganas
20.85 35 4.69E–06 11,423 1.02E–03 42 5.67E–06 13,804 1.23E–03
Calcutta 3.93 520 1.46E–03 – – 540 1.52E–03 – –
a Calculated based on Census (2001)
Hydrogeology Journal DOI 10.1007/s10040-007-0208-7
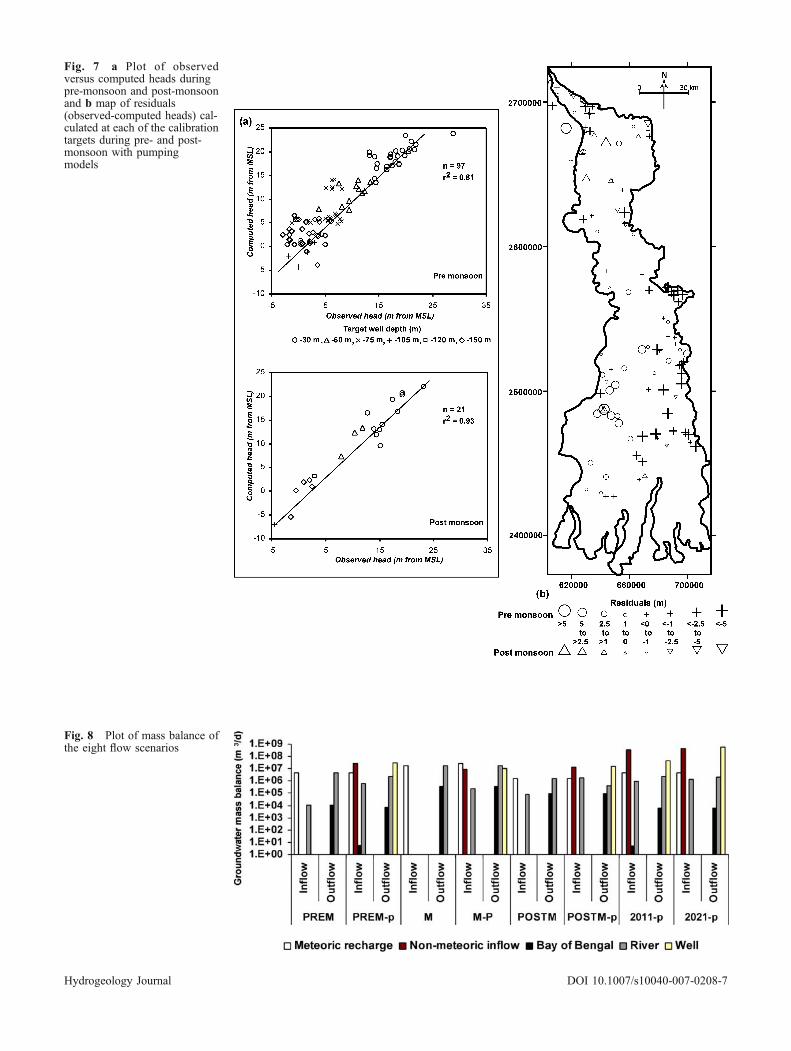
Fig. 7 a Plot of observedversus computed heads duringpre-monsoon and post-monsoonand b map of residuals(observed-computed heads) cal-culated at each of the calibrationtargets during pre- and post-monsoon with pumpingmodels
Fig. 8 Plot of mass balance ofthe eight flow scenarios
Hydrogeology Journal DOI 10.1007/s10040-007-0208-7

for M are not mapped because groundwater flowessentially ceases during aquifer-full conditions.Figure 9a,b shows the final simulation results of the dry-season models as contour maps of hydraulic heads in thearea. The dry-season models without pumping (POSTMand PREM) suggest that there was topographically-controlled, regional groundwater flow from the northernboundary of the study area to the south-southeast towardthe Bay of Bengal. This regional flow began during thepost monsoon (model POSTM). The flow patternconsists of widely-spaced water level contours suggest-ing groundwater flow along a low hydraulic gradient.The pattern is marked by a groundwater mound incentral North 24 Parganas. The pre-monsoon season(PREM) follows the post-monsoon with groundwaterflow along a steeper gradient. Groundwater mounds aremore numerous and larger in PREM, indicating areaswith aquifer saturation (in Lalgola and Bhagwangolaareas of northern Murshidabad, Palashi and Kaliganjareas of northern Nadia, and Haroa and Arsula areas ofeast-central North 24 Parganas). Such aquifer saturationshould be manifested by the presence of wetlands.CGWB (1994e) published a map of permanent water-logged areas of the study area (Fig. 6a). Most of theseareas show a good visual fit with the simulatedgroundwater mounds of PREM. The reason for thiswater-logging is probably a conjunctive effect of thepresence of a near-surface aquitard (Fig. 3a–c) and veryflat topography. The result is flow stagnation andgroundwater discharge to adjoining areas with lowerhydraulic heads. Near the active delta front, contours areconvex towards the south and broadly spaced, consistentwith tidal fluctuations and submarine groundwaterdischarge (SGD) to the Bay of Bengal.
Present-day and projectedThe M-p model exhibits aquifer-full conditions like thoseof model M. Similarly, Harvey et al. (2005) reportedcessation of groundwater flow during the monsoon inflooded parts of their study area in Bangladesh. BGS/DPHE/MML (2001) reported that up to 56.9% of the totalarea of Bangladesh flooded annually between 1954 and1988 (based on Miah 1988 and Brammer 1990). Althoughno such historical data were available for the current study
area, Sanyal and Lu (2003) reported that 75% of the areahas medium to very high flood hazard potential. Fieldobservations indicated that floodwater reached ∼2 mabove ground surface in northern Nadia (Jumpukur, 46)during the year 2000 flood.
The present dry-season models with pumping(POSTM-p and PREM-p) indicate that in all of thedistricts within the study area, except the southern halfof South 24 Parganas, the regional flow paths have beeneliminated by the formation of cones of depression (from~1 km to several km in diameter) due to pumping.Vertical, local-scale convective flow cells are found tohave developed corresponding to these depressions. Insouthern North 24 Parganas and South 24 Parganas, flowreversal with concave contours toward the Bay of Bengalhas developed, indicating increased inflow from the Bayof Bengal. This observation is supported by reports ofsalt-water intrusion in these areas (CGWB 1994d, e; SWID1998, Mukherjee 2006, Mukherjee et al. 2007; Mukherjeeand Fryar 2007). The POSTM-p model shows theinitiation of shallow cones of depression. The mostprominent groundwater low is in central North 24Parganas around Calcutta. The cones of depressionexpand during the pre-monsoon with the formation ofprominent groundwater lows in central Murshidabad[Murshidabad-Jiaganj (e.g., location 81, 82 in Fig. 2),Behrampur (e.g., 83, 84), Hariharpara (e.g., 141, 142) andDomkal blocks (e.g., 91), see ESM Table 1 for locations],northern Nadia [Kaliganj (e.g., 44, 45, 46, 57) andNakashipara blocks (e.g., 47, 48)], south-central Nadia[Shantipur (e.g., 53), KrishnaNagar-I (e.g., 54, 55) andRanaghat-I blocks (e.g., 51)], southern Nadia [Chakdah(e.g., 56), Haringhata (close to 56), Habra-II (e.g., 5) andAmdanga blocks (e.g., 8)], and northern North 24Parganas and Calcutta. The depression in and aroundCalcutta (CGWB 1994e; Sikdar et al. 2001) is most acute,corresponding to the aggregate urban pumping by thePDTWs. The abstraction supersedes any recharge in thearea. However, the aquifers near Calcutta have notcompletely dried up, and there is a cluster of higherpositive residuals (Fig. 7b) in this region (including theblocks of Rajarhat in North 24 Parganas and Sonarpur andBaruipur in South 24 Parganas). This suggests that moreinflow is available than estimated, probably from northernNorth 24 Parganas and southern Nadia, plus enhanced
Table 4 Calculated present-day net inflow (meteoric recharge and non-meteoric inflow) and total abstraction in the study area (per m2)
Parameter Pre-monsoon Monsoon Post-monsoon Annual mean
Meteoric recharge(mm/d)
1.8×10⁻¹ 1.0×100 6.0×10⁻² 5.0×10⁻¹
range2.5 to 1.5×10⁻¹
range1.1×100 to 8.0×10⁻¹
range8.0×10−2 to 2.0×10⁻²
range5.8×10−1 to 4.1×10⁻¹
Mean non-meteoricinflow(mm/day)
1.4×100 4.5×10⁻¹ 6.8×10⁻¹ 7.5×10⁻¹
Total abstraction(mm/day)
1.5×100 5.1×10⁻¹ 7.6×10⁻¹ 1.2×100
Hydrogeology Journal DOI 10.1007/s10040-007-0208-7

Fig. 9 a Modeled groundwater level maps obtained from Pre-monsoon (before 1970s i.e. the PREM model), Pre-monsoon (2001 i.e.PREM-p model), Projected Pre-monsoon (2011 i.e.2001-p model), and Projected Pre-monsoon (2021 i.e.2021-p model). The bold bluelines indicate the major rivers in the area. b Modeled groundwater level maps obtained from Post-monsoon (before 1970s i.e. the POSTMmodel) and Post-monsoon (2001 i.e. POSTM-p model). The bold blue lines indicate the major rivers in the area
Hydrogeology Journal DOI 10.1007/s10040-007-0208-7

inflow from the River Bhagirathi-Hoogly, as suggested byMukherjee et al. (2007). The groundwater mounds innorthern Murshidabad [near Jangipur (e.g., 74, 75) andBhagwangola (e.g., 76, 77, 78)] and south-central North 24Parganas have been substantially reduced in extent. Thecluster of high negative residuals in these areas suggeststhat the model is overestimating inflow (which probablycomes from the River Ganges in Murshidabad andmeteoric recharge in North 24 Parganas).
In the pre-monsoon models of 2011 and 2021 (2011-pand 2021-p), the cones of depression are projected tobecome more intense. For 2021, groundwater lowsbeneath the bottom of the first layer are simulated forcentral Murshidabad, northern North 24 Parganas, andsouth-southeast of Calcutta. These lows imply severeoverdraft (abstraction >> recharge). The modeled ground-water highs in Murshidabad and North 24 Parganas arebarely discernable. However, it should be noted that thegoodness of the prediction of the future groundwater flowwill largely depend on the real increase in abstraction ratein comparison to the projected increase, and also to someextent on the future climatic conditions like sea-level riseand seasonal distribution of rainfall.
Interaction of shallow and deep flowThe layer-by-layer mass-balance calculation of the undis-turbed groundwater flow (PREM) model (Fig. 10) sug-gests that the majority of groundwater flow occursbetween layers 2 and 9 (approximately MSL to 105 mbelow MSL). This indicates that the local flow systemspredominate, which agrees well with the conclusion ofHarvey et al. (2005) for their study area in Bangladesh.The volume of medium to regional-scale flow up to adepth of ∼200 m (layer 15) is less but still significant.However, below that depth to the base of the model (in thedeeper parts of the Sonar Bangla aquifer and the isolatedaquifers), there is minimal recharge or outflow, whichindicates relatively long residence times (negligible flush-ing). This deep groundwater has been identified asgeochemically distinct by Mukherjee (2006).
Interaction with rivers and Bay of BengalThe most important interaction of groundwater withsurface water bodies takes place as SGD through the deltafront in South and North 24 Parganas. The present-daytotal annual SGD has been estimated (Table 5) to be∼5.9×10⁷ m3, which decreased by about 4% from anannual SGD of 6.1×10⁷ m3 since the onset of pumping.Dowling et al. (2003) estimated annual SGD as about 1.5±0.5×10¹¹ m3 of water for the entire delta front (∼500 kmwide). Considering that the delta front in the present studyarea is 110 km (i.e., ∼1/5th of the total delta front), thepresent estimates for SGD are negligible. The probablereason for the difference is that Dowling et al. (2003)considered that all the recharge water reaching below30 m (first 2 layers of the present model) is discharged tothe Bay of Bengal. However, the present study suggeststhat a large amount of the recharge water is withdrawnthrough pumping and a considerable amount of water alsoupwells from the aquifer deeper than 30 m to the rivers.The present day annual sea water intrusion is estimated tobe only 8.8×10² m3 (it seems that the modeled intrusionhas been underestimated), which is still ∼100% more thanprior to the 1970s. Although the estimated presentseawater intrusion is several orders of magnitude lowerthan the SGD, intrusion causes significant modification ofgroundwater chemistry by mixing in southern South andNorth 24 Parganas (CGWB 1994d; Mukherjee 2006;Mukherjee et al. 2007; Mukherjee and Fryar 2007).
The inflow of river water into the subsurface hasincreased by ∼97% in the last three decades, but theannual total outflow to rivers is still an order of magnitudegreater than the inflow (Table 3). Comparison of water-level contours between the PREM and PREM-p modelssuggests that during summers prior to 1970 the RiverGanges and some reaches of the rivers Bhagirathi-Hoogly,Jalangi, and Ichamati were mostly gaining (primarily innorthern Murshidabad and southern Nadia southward toCalcutta). At present, western portions of the RiverGanges remain gaining, although the reach east ofBhagwangola (77 and 78 in Fig. 2) to the Bangladeshborder has become losing. The River Bhagirathi-Hoogly
Fig. 10 Plot of mass balancefor each layer for the undis-turbed groundwater flow in thestudy area, pre-monsoon with-out pumping (pre-1970s)
Hydrogeology Journal DOI 10.1007/s10040-007-0208-7

has become losing from south of Behrampur to Beldanga(86), near Kaliganj and Nakashipara (44, 45, 46, 47, 48),in central Nadia, in northern North 24 Parganas andaround Calcutta. The stable-isotope composition of Cal-cutta groundwater was found to be similar to that of theRiver Bhagirathi-Hoogly (Mukherjee et al. 2007), sup-porting this last observation. Excluding the northernmostreach, the River Jalangi and most parts of the RiverIchamati remain gaining.
Conclusions and implications for As-contaminatedgroundwater flow
The present study provides the first published interpreta-tion of the regional-scale hydrostratigraphic architectureand regional groundwater flow in the western Bengalbasin of India. The importance of the study rests on thefact that the investigated area is part of one of the worstnaturally-contaminated regions in the world. One of themain objectives of this study was to understand howhydrostratigraphy and pumping affect the movement ofthe potentially As-affected groundwater at the regionalscale. Although previous studies in Bangladesh (varyingfrom local to catchment scale) have tried to evaluate theseeffects (e.g., JICA 2002; Cuthbert et al. 2002; Harveyet al. 2005; Burgess and Ahmed 2006), no such publishedwork exists for the western Bengal basin.
Lithostratigraphic modeling indicates that the study areahas a major single-aquifer system, which lacks (except inthe southern parts) any continuous confining layer except atthe local scale (one to a few km). However, thesouthernmost areas exhibit a multilayer system where theaquifers are separated from each other by thick aquitards.Hence, the absence of confining layers may facilitatevertical and horizontal groundwater flow and mixing.
Groundwater modeling in the present study suggeststhat prior to the onset of extensive pumping in the 1970s,regional-scale flow occurred within the major aquifersystem during the dry season. This implies that As present
in the up-gradient region would be transported down-gradient (toward the south) and diluted unless other Assources were present along the flow path. However,because of the low topographic gradient (∼0.1 m/km),the regional flow rate, and thus the rates of contaminanttransport and flushing, were probably very slow.
With the initiation of pumping, several local tointermediate-scale flow systems replaced the dominantregional flow system. The hydraulic gradients weredictated by the pumping centers and aquifer architecture.Because of the absence of continuous confining layers inmuch of the study area, pumping induced mixing betweenrelatively shallow and deeper groundwater, which mayhave led As-enriched water to spread downward(Mukherjee 2006). Anthropogenically-altered groundwa-ter dynamics have also increased recharge rates during thelast three decades. Consequently, downward fluxes ofdissolved oxygen (Das et al. 1995) and organic carbon(Harvey et al. 2002) may have drastically increased,thereby perturbing redox- dependent biogeochemicalprocesses in the subsurface (Harvey et al. 2002, 2005;Mukherjee 2006). Moreover, much of the As that is beingpumped to the land surface is distributed on agriculturalfields, and the As that does not accumulate in crops couldre-circulate into the subsurface via enhanced recharge.This scenario may worsen if pumping increases in thefuture. The smaller rivers in the area were found to bemostly gaining, although groundwater discharge to rivershas decreased because of pumping. As a consequence, theoutflow from the shallow aquifers may impact thechemistry of smaller rivers, as indicated by recentdetections of As (Mukherjee 2006). In summary, in lightof the hydrostratigraphic framework of the basin, thepresent land-use patterns have made the regional aquifersystem more vulnerable to contamination.
Acknowledgements This project could not have been executedwithout the cooperation of the Public Health Engineering Director-ate and State Water Investigation Directorate, Government of WestBengal. However, the ideas presented in this report are those of the
Table 5 Comparison of surface water-groundwater interaction between present-day (2001) and pre-1970s. SGD=submarine groundwaterdischarge
Annualchange (topresent frompre-1970s)
Pre-monsoon(present)
Monsoon(present)
Post-monsoon(present)
Annual(present)
Pre-monsoon(pre-1970s)
Monsoon(pre-1970s)
Post-monsoon(pre-1970s)
Annual(pre-1970s)
Volume(m3)
%
SGD to Bay ofBengal (m3)
1.0E+06 5.2E+07 5.5E+06 5.9E+07 1.6E+06 5.4E+07 5.5E+06 6.1E+07 −2.2E+06
−3.7
Inflow from Bayof Bengal(m3)
8.8E+02 0.0E+00 3.0E+00 8.8E+02 0.0E+00 0.0E+00 3.0E+00 3.0E+00 8.8E+02
99.7
Outflow to rivers(m3)
3.7E+08 2.8E+09 2.4E+07 3.2E+09 7.3E+08 2.6E+09 9.6E+07 3.4E+09 −2.5E+08
−7.7
Inflow fromrivers (m3)
9.5E+07 3.7E+07 1.1E+08 2.5E+08 1.6E+06 0.0E+00 4.9E+06 6.5E+06 2.4E+08
97.4
Hydrogeology Journal DOI 10.1007/s10040-007-0208-7

authors and have not been officially endorsed by the Government ofWest Bengal or any other person or organization. Special thanks toP.K. De, A. Banerjee, A. Bhattacharya, G. RoyChowdhury, B.Hazra (PHED); M.K. Sinha (SWID); Dr. S.P. SinhaRoy (ArsenicCore Committee); and the late Prof. A. Chakraborty (Indian Instituteof Technology-Kharagpur). The authors are immensely grateful toB.M. Engineering, KrishnaNagar, for supplying lithologs; ESI andthe Hydrogeology Division, Geological Society of America, forproviding Groundwater Vistas; Terry Lahm, Maura Methany andMartin VanOort for advice on groundwater modeling; and WilliamA. Thomas, Bridget Scanlon, Stephen Workman, Sunil Mehta, JeanNicot, Holly Michael, and Jan van Wonderen for their advice andinformal reviews. The authors also express their gratitude to WilliamBurgess and Peter Ravenscroft for their journal reviews. The projectwas financially supported by the University of Kentucky (Departmentof Earth and Environmental Sciences, College of Arts & Sciences,and the Graduate School), the Kentucky NSF-EPSCoR program, andthe Geological Society of America (Grant No. 7751–04).
References
Acharyya SK, Lahiri S, Raymahashay BC, Bhowmik A (2000)Arsenic toxicity of groundwater in parts of the Bengal basin inIndia and Bangladesh: the role of Quaternary stratigraphy andHolocene sea-level fluctuation. Environ Geol 39(10):1127–1137
AIP/PHED (1991) National drinking water mission submissionproject on arsenic pollution in groundwater in West Bengal.Final report of Steering Committee, Arsenic InvestigationProject (AIP) and Public Health Engineering Directorate(PHED), Government of West Bengal, India 58 pp
AIP/PHED (1995) Perspective plan for arsenic affected districts ofWest Bengal. Arsenic Investigation Project (AIP) and PublicHealth Engineering Directorate (PHED), Government of WestBengal, India
Alam M, Alam MM, Curray JR, Chowdhury MLR, Gani MR(2003) An overview of the sedimentary geology of the Bengalbasin in relation to the regional tectonic framework and basin-fill history. Sediment Geol 155:179–208
Allison MA (1998) Geologic framework and environmental statusof the Ganges-Brahmaputra Delta. J Coast Res 14(3):826–836
Allison MA, Khan SR, Goodbred SL, Kuehl SA (2003) Strati-graphic evolution of the late Holocene Ganges-Brahmaputralower delta plain. Sediment Geol 155(3–4):317–342
Ashfaque KN, Harvey CF (2006) Groundwater flow dynamics andarsenic mobilization in Mushiganj, Bangladesh. GeologicalSociety of America, Abstracts with Programs 38(7):242
Basu AR, Jacobsen SB, Poreda RJ, Dowling CB, Aggrawal PK(2001) Large groundwater strontium flux to the oceans from theBengal Basin and marine strontium isotope record. Science293:1470−1473
BGS/DPHE/MML (1999) Groundwater studies for arsenic contam-ination in Bangladesh, Phase I: Rapid investigation phase.Department of Public Health Engineering, Govt. of Bangladesh,British Geological Survey and Mott MacDonald Ltd., UK
BGS/DPHE/MML (2001) Arsenic contamination of groundwater inBangladesh, vol. 2: final report, Kinniburgh, D.G., Smedley, P.L. (Eds.). British Geological Survey (BGS) Technical ReportWC/00/19, Keyworth
Bhattacharya P, Chatterjee D, Jacks G (1997) Occurrence of arsenic-contaminated groundwater in alluvial aquifers from the deltaplain, eastern India: options for a safe drinking water supply.Water Res Develop 13:79–92
Biswas B (1963) Results of exploration for petroleum in the westernpart of Bengal basin, India. Proceedings of Symposium onDevelopment of Petrology. Mineral Resource Division Service,no. 18(1):241–250
Brammer H (1990) Floods in Bangladesh II: Flood mitigation andenvironmental aspects. Geogr J 156:158–165
Burgess WG, Burren M, Perrin J, Ahmed KM (2002) Constraintson sustainable development of arsenic-bearing aquifers insouthern Bangladesh. Part 1: A conceptual model of arsenic inthe aquifer. In: Hiscock KM, Rivett MO, Davison RM (eds.)Sustainable Groundwater Development. Geological Society,London, Special Publications 193, 145–163
Burgess WG, Ahmed KM (2006) Arsenic in aquifers of the BengalBasin - from sediment source to tubewells for domestic watersupply and irrigation. In: Naidu R, Smith E, Owens G,Bhattacharya P, Nadebaum P (Eds.) Managing Arsenic in theEnvironment: From Soil to Human Health. CSIRO Publishing,Adelaide
Census (2001) Provisional population totals. Census of India,chapter 3, series 1. Government of India
CGWB (1994a) Hydrogeology and groundwater resource ofMurshidabad district, West Bengal. Technical Report, series D,Central Ground Water Board (CGWB), Eastern Region,Government of India
CGWB (1994b) Hydrogeology and groundwater resource of Nadiadistrict, West Bengal. Technical Report, series D, Central GroundWater Board (CGWB), Eastern Region, Government of India
CGWB (1994c) Hydrogeology and groundwater resource of North24 Parganas district, West Bengal. Technical Report, series D,Central Ground Water Board (CGWB), Eastern Region,Government of India
CGWB (1994d) Hydrogeology and groundwater resource of South24 Parganas district, West Bengal. Technical Report, series D,Central Ground Water Board (CGWB), Eastern Region,Government of India
CGWB (1994e) Hydrogeological atlas of West Bengal, scale 1:2,000,000. Central Ground Water Board (CGWB), EasternRegion, Government of India
CGWB (1997) High arsenic groundwater in West Bengal. TechnicalReport, series D, Central Ground Water Board (CGWB),Eastern Region, Government of India
Coleman JM (1969) Brahmaputra River: channel processes andsedimentation. Sediment Geol 3:129–239
Coleman JM (1981) Deltas: processes of deposition and models ofexploration, 2nd edition. Burgess, Minneapolis
Cuthbert MO, Burgess WG, Connell L, (2002) Constraints onsustainable development of arsenic-bearing aquifers in southernBangladesh. Part 2: Preliminary models of arsenic variability inpumped groundwater. Part 1: A conceptual model of arsenic inthe aquifer. In: Hiscock KM, Rivett MO, Davison RM (eds.)Sustainable Groundwater Development. Geological Society,London, Special Publications 193, 165–179
Das D, Chatterjee A, Mandal BK, Samanta G, Chakraborti D,Chanda B (1995) Arsenic in groundwater in six districts of WestBengal, India: the biggest arsenic calamity in the world. Part 2:Arsenic concentration in drinking water, hair, nails, urine, skin-scale and liver tissue (biopsy) of the affected people. Analyst120:917–924
Davies J (1995) The hydrochemistry of alluvial aquifers in centralBangladesh. In: Nash H, McCall GJH (eds.) GroundwaterQuality. Chapman & Hall, London, 9–18
Deming D (2002) Introduction to hydrogeology. McGraw-Hill,New York
Dowling CB, Poreda RJ, Basu AR (2003) The groundwatergeochemistry of the Bengal basin: weathering, chemsorption,and trace metal flux to the oceans. Geochim Cosmochim Acta67(12):2117–2136
DPHE/BGS/MML (1999) Groundwater studies for arsenic contam-ination in Bangladesh, Phase I: Rapid investigation phase.British Geological Survey and Mott MacDonald Ltd., UK
Evans P (1964) The tectonic framework of Assam. J Geol Soc India5:80–96
Fairbanks RG (1989) A 17,000 glacio-eustatic sea level record:influence of glacial melting rates on the Younger Dryas eventand deep ocean circulation. Nature 342:637–642
Hydrogeology Journal DOI 10.1007/s10040-007-0208-7

FAO (1990) Penman-Monteith equation. Food and AgricultureOrganization (FAO) method 56 (FAO–56)
Ghosh AR, Mukherjee A (2002) Arsenic contamination ofgroundwater and human health impacts in Burdwan District,West Bengal, India. Geological Society of America, Abstractswith Programs 34(2):107
Ghosh NC, Chakraborty B, Mazumder PK (1999) Groundwaterflow model. Proceedings of Workshop on Groundwater and ItsProtection with Special Reference to Arsenic Contamination,Calcutta, CGWB, India
Goodbred SL, Kuehl SA (2000) The significance of large sedimentsupply, active tectonism, and eustasy on margin sequencedevelopment: Late Quaternary stratigraphy and evolution ofthe Ganges-Brahmaputra delta. Sediment Geol 133:227–248
Goodbred SL, Kuehl SA, Steckler MS, Sarkar MH (2003) Controlson facies distribution and stratigraphic preservation in theGanges-Brahmaputra delta sequence. Sediment Geol 155(3–4):301–316
Harvey CF (2002) Groundwater flow in the Ganges delta. Science296:1563
Harvey CF, Swartz CH, Badruzzaman ABM, Keon-Blute N, Yu W,Ali MA, Jay J, Beckie R, Niedan V, Brabander D, Oates PM,Ashfaque KN, Islam S, Hemond HF, Ahmed MF (2002)Arsenic mobility and groundwater extraction in Bangladesh.Science 298:1602–1606
Harvey CF, Swartz CH, Badruzzaman ABM, Keon-Blute N, Yu W,Ali MA, Jay J, Beckie R, Niedan V, Brabander D, Oates PM,Ashfaque KN, Islam S, Hemond HF, Ahmed MF (2005)Groundwater arsenic contamination on the Ganges delta:biogeochemistry, hydrology, human perturbations, and humansuffering on a large scale. Cs R Geosci 337(1–2):285–296
Harvey CF, Ashfaque KN, Yu W, Badruzzaman ABM, Ali MA,Oates PM, Michael HA, Neumann RB, Beckie R, Islam S,Ahmed MF (2006) Groundwater dynamics and arsenic contam-ination in Bangladesh. Chem Geol 228:112–136
Hassan MQ (1992) Saline Water Intrusion and HydrogeologicalModelling in Southwest Bangladesh. Schezky & Jeep, Germany
Horneman A, VanGeen A, Kent DV, Mathe PE, Zheng Y, Dhar RK,O’Connel S, Hoque MA, Aziz Z, Shamsudduha M (2004)Decoupling of As and Fe release to Bangladesh groundwaterunder reducing conditions. Part I: Evidence from sedimentprofiles. Geochim Cosmochim Acta 68(17):3459–3473
Hossain AFMA, Siddiqui S, Khan ZH, Hassan M, Sadek S (2003)Development of groundwater modeling at SWMC. In: RahmanAA, Ravenscroft P (eds.) Groundwater resources developmentin Bangladesh. The University Press, Dhaka, 141–159
Imam MB, Shaw HF (1985) The diagenesis of Neogene clasticsediments from Bengal basin, Bangladesh. J Sediment Petrol55:665–671
Islam MS, Tooley MJ (1999) Coastal and sea level changes duringthe Holocene in Bangladesh. Quat Int 55:61–75
Islam MN, Uddin MN (2002) Country paper on hydrogeologysection. Proceedings of International Workshop on ArsenicIssue in Bangladesh, 23 pp
JICA (2002) The study on the ground water development of deepaquifers for safe drinking water supply to arsenic affected areasin western Bangladesh. Draft final report, book 1–3. JapanInternational Cooperation Agency, Kokusai Kogyo Co. Ltd. andMitsui Mineral Development Engineering Co. Ltd
Lindsay JF, Holiday DW, Hulbert AG (1991) Sequence stratigraphyand the evolution of the Ganges-Brahmaputra complex. AAPGBull 75:1233–1254
Mace RE (2001) Estimating transmissivity using specific-capacitydata. Geological Circular 0102, Bureau of Economic Geology,University of Texas at Austin
Malmstrom VH (1969) A new approach to classification of climate.J Geogr 68:351–357
Maxey GB (1964) Hydrostratigraphic units. J Hydrol 2:124–129McArthur JM, Ravenscroft P, Safiullah S, Thirlwall MF (2001)
Arsenic in groundwater: testing pollution mechanisms foraquifers in Bangladesh. Water Resource Res 37:109–117
McArthur JM, Banerjee DM, Hudson-Edwards KA, Mishra R,Purohit R, Ravenscroft P, Cronin A, Howarth RJ, Chatterjee A,Talukder T, Lowry D, Houghton S, Chadha D (2004) Naturalorganic matter in sedimentary basins and its relation to arsenicin anoxic groundwater: the example of West Bengal and itsworldwide implications. Appl Geochem 19:1255–1293
McDonald MG, Harbaugh AW (1988) A modular three-dimensionalfinite-difference ground-water flow model. U.S. GeologicalSurvey Techniques of Water-Resources Investigations, book 6,A1
Miah MM (1988) Flood in Bangladesh: A hydromorphologicalstudy of the 1987 flood. Academic Publishers, Dhaka
MID (2001) Report of 3rd Minor Irrigation Census in West Bengal2000–2001. Minor Irrigation Department, Government of WestBengal, India
MMP (1982) Northwest Bangladesh Groundwater Model. Sir MMacDonald & Partners, UK and Bangladesh AgriculturalDevelopment Corporation, Government of Bangladesh
Morgan JP, McIntire WG (1959) Quaternary geology of BengalBasin, East Pakistan and India. Geol Soc Am Bull 70:319–342
MPO (1987) Groundwater Resources of Bangladesh. TechnicalReport 5, Master Plan Organization (MPO), Dhaka, HarzaEngineering, USA, Sir M MacDonald & Partners, UK, MetaConsultants, USA and EPC Ltd, Dhaka
MPO (1990) Description of Groundwater Model Programs. Nation-al Water Plan Project Phase II, Master Plan Organization(MPO), Dhaka, Harza Engineering, USA, Sir M MacDonald& Partners, UK, Meta Consultants, USA and EPC Ltd, Dhaka
Mukherjee S (2004) Prerequisite studies for numerical flowmodeling to locate safe drinking water wells in the zone ofarsenic polluted groundwater in the Yamuna sub-basin, WestBengal, India. Proceedings of 32nd International GeologicCongress, Florence, Italy
Mukherjee A (2006) Deeper groundwater chemistry and flow inthe arsenic affected western Bengal basin, West Bengal, India.Unpublished Ph.D. dissertation, University of Kentucky,Lexington
Mukherjee A, Fryar AE (2007) Deeper groundwater chemistry andgeochemical evolution modeling of the arsenic affected westernBengal basin,West Bengal, India. Applied Geochemistry (in press)
Mukherjee A, Fryar AE, Rowe HD (2007) Regional scale stableisotopic signature and recharge of the deep water of the arsenicaffected areas of West Bengal, India. J Hydrol 334(1–2):151–161
National Climatic Data Center (http://www.ncdc.noaa.gov/oa/pub/data/ghcn/v2/ghcnftp.html), accessed June, 2005
Nickson R, McArthur JM, Ravenscroft P, Burgess WG, Rahman M(1998) Arsenic poisoning of groundwater in Bangladesh. Nature395:338
Nishat A, Bhuiyan, MA, Saleh FM (2003) Assessment of thegroundwater resources of Bangladesh. In: Rahman AA,Ravenscroft P (eds.) Groundwater resources development inBangladesh. The University Press, Dhaka, 87–114
Penman HL (1948) Natural evaporation from open water, bare soiland grass. Proc Royal Soc London A 193:120–145
PHED (2003a) Tubewell particulars of water supply schemes,district Murshidabad. Public Health Engineering Directorate,Government of West Bengal, Calcutta, India
PHED (2003b) Tubewell particulars of water supply schemes,district Nadia. Public Health Engineering Directorate, Govern-ment of West Bengal, Calcutta, India
PHED (2003c) Tubewell particulars of water supply schemes,district North 24 Parganas. Public Health Engineering Director-ate, Government of West Bengal, Calcutta, India
PHED (2003d) Tubewell particulars of water supply schemes,district South 24 Parganas. Public Health Engineering Director-ate, Government of West Bengal, Calcutta, India
PHED (2004) Map showing arsenic affected blocks in West Bengal.Public Health Engineering Directorate, Government of WestBengal, Calcutta, India
Pike JG (1964) The estimation of annual runoff from meteorologicaldata in a tropical climate. J Hydrol 2:116–123
Hydrogeology Journal DOI 10.1007/s10040-007-0208-7

Rangarajan R, Athvale RN (2000) Annual replenishable groundwater potential of India – an estimate based on injected tritiumstudies. J Hydrol 234:38–53
Ravenscroft P (2003) Overview of the hydrogeology of Bangladesh.In: Rahman AA, Ravenscroft P (eds.) Groundwater resourcesdevelopment in Bangladesh. The University Press, Dhaka, 43–86
Ravenscroft P, McArthur JM, Hoque B (2001) Geochemical andpalaeohydrological controls on pollution of groundwater byarsenic. In: Chappell WR, Abernathy CO, Calderon R (eds.)Arsenic exposure and health effects IV. Elsevier, Oxford, pp 53–77
Ravenscroft P, Burgess WG, Ahmed KM, Burren M, Perrin J (2005)Arsenic in groundwater of the Bengal basin, Bangladesh:Distribution, field relations, and hydrogeologic setting. HydrogeolJ 13:727–751
Saha AK (1991) Genesis of arsenic in groundwater in parts of WestBengal. Annual volume, Center for Studies on Man andEnvironment, Calcutta, India
Sanyal J, Lu XX (2003) Application of GIS in flood hazardmapping: a case study of Gangetic West Bengal, India.Proceedings of Map Asia Conference, GISdevelopment.net
Seaber PR (1988) Hydrostratigraphic units. In: Back W, RosensheinJS, Seaber PR (eds) The Geology of North America, vol. O–2,Hydrogeology. Geological Society of America pp 9−14
Sengupta S (1966) Geological and geophysical studies in the westernpart of the Bengal Basin, India. AAPG Bull 50:1001–1017
Sikdar PK, Sarkar SS, Palchoudhury S (2001) Geochemicalevolution of groundwater in the Quaternary aquifer of Calcuttaand Howrah, India. J Asian Earth Sci 19(5):579–594
Smith AH, Lingas EO, Rahman M (2000) Contamination ofdrinking-water by arsenic in Bangladesh: a public healthemergency. Bull World Health Org 78(9):1093–1103
Survey of India (1971) Map of West Bengal, scale 1: 1000,000.Publishing group of Survey of India, Government of India,Calcutta, India
SWID (1998) A comprehensive hydrogeological information ofMurshidabad district. Geologic Division No. III, State WaterInvestigation Directorate (SWID), Government of West Bengal,Calcutta, India
Tagore R (1905) Amar Sonar Bangla (My Golden Bengal). Baul(Folk Singer), Visva-Bharati Publications, Calcutta, India
Thornthwaite CW (1948) An approach toward a rational classifica-tion of climate. Geogr Rev 38:85–94
Tóth J (1963) A theoretical analysis of groundwater flow in smalldrainage basins. J Geophys Res 68:4795–4812
Uddin MN, Abdullah SKM (2003) Quaternary geology and aquifersystems in the Ganges-Brahmaputra-Meghna delta complex,Bangladesh. Proceedings of South Asian Geological Congress
Umitsu M (1987) Late Quaternary sedimentary environment andlandform evolution in the Bengal Lowland. Geogr Rev Japan,Series B, 60:164–178
Umitsu M (1993) Late Quaternary sedimentary environments andlandforms in the Ganges Delta. Sediment Geol 83:177–186
UNDP (1982) Groundwater survey: The hydrogeological conditionsof Bangladesh. UNDP Technical Report DP/UN/BGD–74–009/1
van Geen A, Ahmed KM, Seddique AA, Shamsudduha M (2003)Community wells to mitigate the current arsenic crisis inBangladesh. Bull World Health Org 82:632–638
van Wonderen JJ (2003) The use of groundwater models for resourceassessment in Bangladesh. In: Rahman AA, Ravenscroft P (eds.)Groundwater resources development in Bangladesh. TheUniversity Press, Dhaka, 127–140
von Brömssen M, Jakariya M, Bhattacharya P, Ahmed KM, HassanMA, Sracek O, Jonsson L, Jacks G (2007) Targeting low-arsenicaquifers in Matlab Upazila, Southeastern Bangladesh. Sci TotEnviron 379(2–3):121–132
WHO (1993) Guidelines for drinking-water quality. Vol. 1 recom-mendations, 2nd edn. World Health Organization (WHO),Geneva
Hydrogeology Journal DOI 10.1007/s10040-007-0208-7