Embed Size (px)
Citation preview
Regional HOT Lanes Study Preliminary
Findings
An Informational Hearing of the Senate Transportation and Housing Committee
Toll Roads and Managed Lanes
January 17, 2007
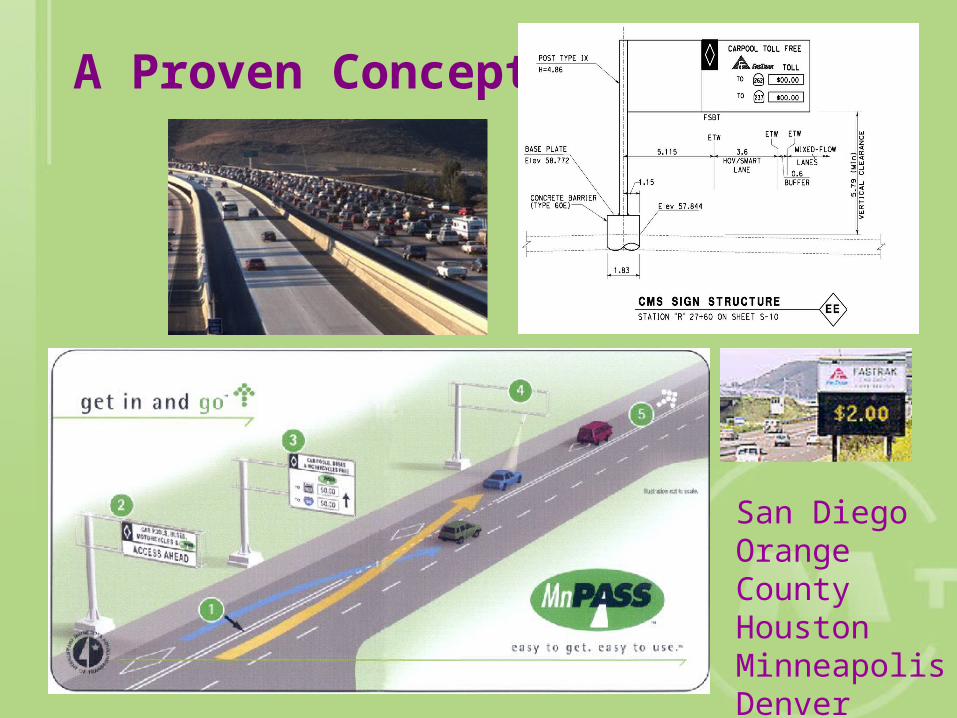
A Proven Concept
San DiegoOrange CountyHoustonMinneapolisDenver

HOV lanes will become crowded over time
but not as soon as we thought

HOT Lane Networks Under Study
1 Existing & Funded
Network
Convert HOV lanes that exist, are under construction or are fully funded

HOT Lane Networks Under Study
2 Connected NetworkFill gaps and extend the system
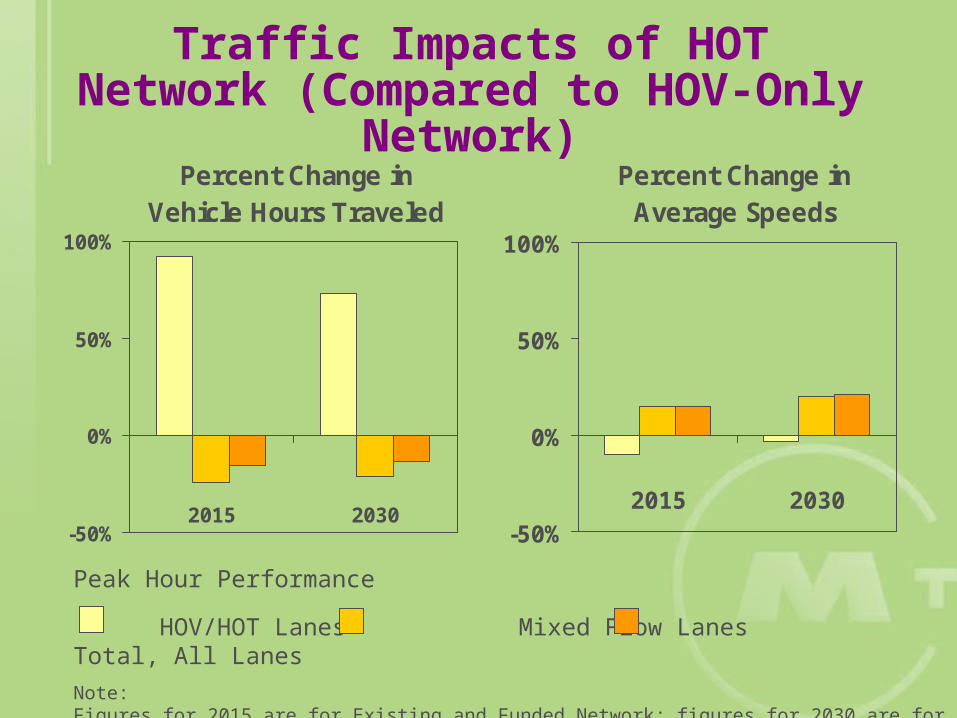
Traffic Impacts of HOT Network (Compared to HOV-
Only Network)Percent Change in
Vehicle Hours Traveled
-50%
0%
50%
100%
2015 2030
Percent Change in Average Speeds
-50%
0%
50%
100%
2015 2030
Peak Hour Performance
HOV/HOT Lanes Mixed Flow Lanes Total, All Lanes
Note: Figures for 2015 are for Existing and Funded Network; figures for 2030 are for Connected Network
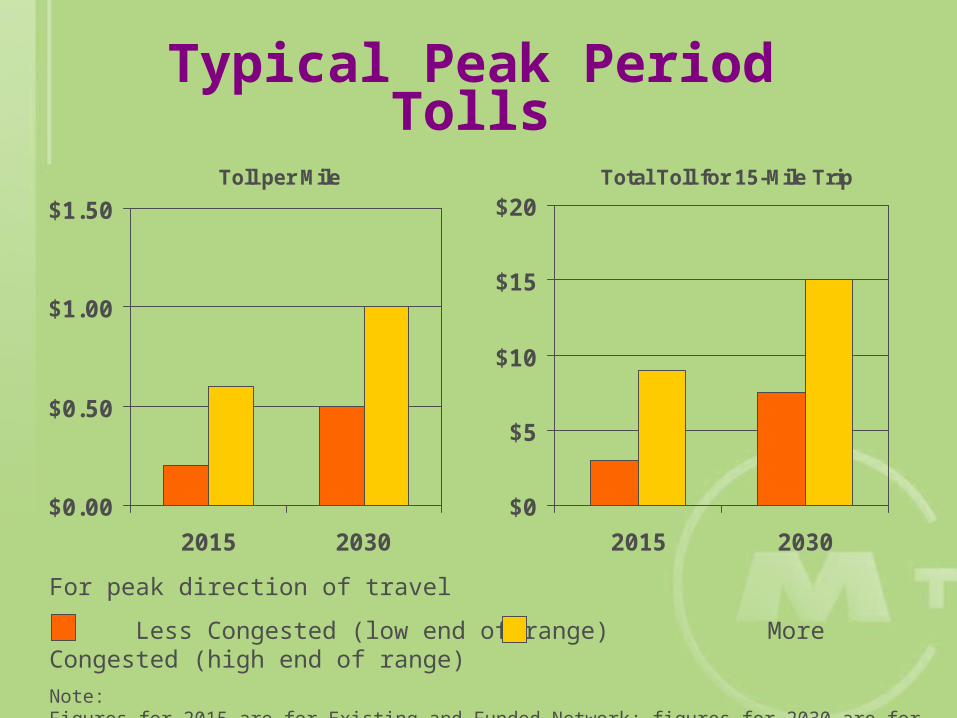
Typical Peak Period TollsTotal Toll for 15-Mile Trip
$0
$5
$10
$15
$20
2015 2030
Toll per Mile
$0.00
$0.50
$1.00
$1.50
2015 2030
For peak direction of travel
Less Congested (low end of range) More Congested (high end of range)
Note: Figures for 2015 are for Existing and Funded Network; figures for 2030 are for Connected Network

Capital Costs
• Cost to convert HOV lanes to HOT lanes (depends on paved right-of-way)
Low: $1.4 million per mile Medium: $2.2 million per mile High: $3.7 million per mile
• Total capital cost
Existing and Funded Network: $1.2 billion Expansion to Connected Network*: $3.5
billion* Above and beyond Existing and Funded Network; includes cost of widening to fill gaps in the HOV/HOT system
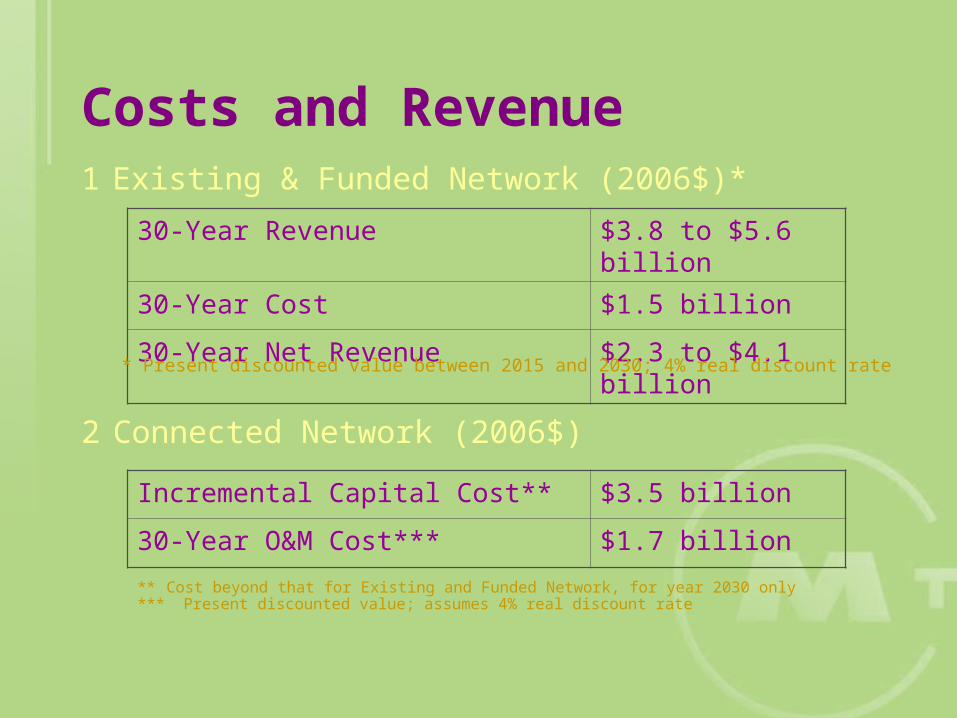
Costs and Revenue
30-Year Revenue $3.8 to $5.6 billion
30-Year Cost $1.5 billion
30-Year Net Revenue $2.3 to $4.1 billion
1 Existing & Funded Network (2006$)*
2 Connected Network (2006$)
* Present discounted value between 2015 and 2030; 4% real discount rate
** Cost beyond that for Existing and Funded Network, for year 2030 only*** Present discounted value; assumes 4% real discount rate
Incremental Capital Cost** $3.5 billion
30-Year O&M Cost*** $1.7 billion

Net Revenue Potential
1 Existing & Funded
Network

Net Revenue Potential
2 Connected Network
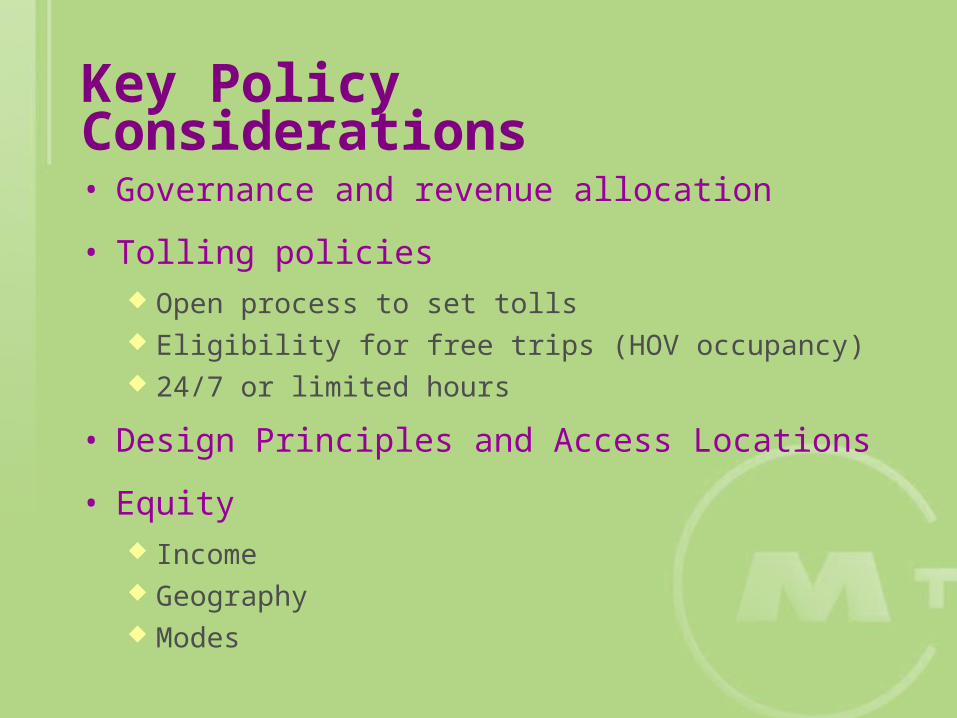
Key Policy Considerations• Governance and revenue allocation
• Tolling policies Open process to set tolls Eligibility for free trips (HOV occupancy) 24/7 or limited hours
• Design Principles and Access Locations
• Equity Income Geography Modes