Embed Size (px)
Citation preview


A Commission Report
REGIONAL GROWTH
Advisory Commission on Intergovernmental Relations Washington, D.C. 20575
June 1980


Preface
G rowing public discussion and controversy concerning the implications of uneven
patterns of economic growth in different re- gions of the United States, as well as allega- tions that federal government taxing and spending policies have contributed to such disparities, prompted the Advisory Commis- sion on Intergovernmental Relations to un- dertake a series of research studies on the subject. The results of the ACIR investiga- tions will be issued in a three-volume study entitled Regional Growth.
This first volume of the study, Regional Growth: Historic Perspective, examines the economic growth of the various regions of the United States and points out the importance of the converging growth rates throughout the nation.
The second volume, Regional Growth: Flows of Federal Funds, 1952-1976, focuses on the impact of federal financial activities, both spending and taxing, on states and re- gions. This study, too, found convergence: interstate and interregional differences in the ratio of federal expenditures to revenues were considerably narrower in 1974-76 than they were in 1952.
The third volume examines the issue of whether interstate tax competition has brought about any significant differential regional growth pattern.

Acknowledgments
J anet Rothenberg Pack prepared this his- torical perspective on regional economic
growth. She was assisted most immediately by Gordon Folkman, Jean Ryan, and Ruthamae Phillips. Will Myers prepared the manuscript for publication. John Shannon, assistant director for taxation and finance, supervised the research and publication process. Other members of the Commission staff reacted to drafts at several steps in the study.
The Commission and its staff sought and received help from many individuals during all stages of the report preparation. Special thanks go to a host of "thinkers" who gath- ered in Washington at the Commission's in- vitation and suggested the content of an encyclopedic Frostbelt-Sunbelt study. Per- sonnel and time limitations, unfortunately, forced the Commission staff to tackle the problem in a far less ambitious manner than was suggested at the thinkers' session. When the study reached draft report form, the Com- mission assembled "critics" to cast a percep- tive eye over the findings and conclusions. Particular thanks go to Arnold Cantor, Fried- rich Grasburger, I. M. Labovitz, George Peterson, Robert Reischauer, Roger Vaughan, and Bernard Weinstein. In casual and formal meetings and in telephone conversations with many other persons who have been studying regional growth and development, Mrs. Pack was able to gain new insights that helped to identify economic trends. Throughout the development of the report, she was able to call on an otherwise anonymous and certainly unpaid consultant, her husband, Howard Pack.
Full responsibility for the content and accuracy of the study rests, of course, with the Commission and its staff.
Contents . . . . . . . . . . . . . . . . . . . . . . . . . . . . . . . . . . . . . . . . . . . . . . . . 1 . Introduction 1
..................................... Regionalism in the 1970s 1 . . . . . . . . . . . . . . Contemporary Concerns and Historical Perspective 3
.......................... The Study and Its Major Conclusions 4 Findings ................................................ 5
2 . Regional Economic Convergence and the Geographical . . . . . . . . . . . . . . . . . . . . . . . . . . . . . . Dispersion of Economic Activity 9 ............................. Convergence in Per Capita Income 9
........................ Decentralization of Economic Activity 12 . . . . . . . . . . . . . . . . . . . . . . . . . . . . . . . . . . . . . . . . . . . . . Population 20
. . . . . . . . . . . . . . . . . . . . . . . . . . . . . . . . . . . . . . . . Personal Income 20 ............................................... Employment 20
............................. Manufacturing Employment 24 Unemployment . . . . . . . . . . . . . . . . . . . . . . . . . . . . . . . . . . . . . . . . . 26
. . . . . . . . . . . . . . . . . . . . . . . . . . . . . 3 . Determinants of Regional Shifts 31 ....................... Economic Maturity or Life Cycle Models 31
. . . . . . . . . . . . . . . . . . . . . . . . . . . . . . . . . . . . . . . The Demand Side 32 New York State. 1968.73. Disaggregated Sectoral Analysis .... 39
.................. Sources of the Changing Competitive Position 44 . . . . . . . . . . . . . . . . . . . . . . . . . . . . . . . . . . . Regional Wage Differences 44
. . . . . . 4 The Federal Government and Regional Economic Activity 49 . . . . . . . . . . . . . . . . . . . . . . . . . . . . . . . . . . . . . Macro-Economic Policy 50
. . . . . . . . . . . . . . . . . . . . . . . . . . . . . . . . . . . . . . . . Personal Income 51 Employment . . . . . . . . . . . . . . . . . . . . . . . . . . . . . . . . . . . . . . . . . . . 55
. . . . . . The Relationship Between National and State Growth 56 . . . . . . . . . . . . . . . . . . . . . . . . . . . . . . . . . . . . . . Federal Flows of Funds 59
Revenues .............................................. 62 Expenditures . . . . . . . . . . . . . . . . . . . . . . . . . . . . . . . . . . . . . . . . . . . 62
. . . . . . . . . . . . . . . . . . . . . . . . . . . . . Expenditure-Revenue Ratios 75 The Impact of Federal Flows of Funds on Regional Growth ..... - 8 2
. . . . . . . . . . . . . . . . . Further Examination of Flow-of-Funds Effects 83 5 . Conclusions ............................................... 89
Appendix .................................................... 93 . . . . . . . . . . . . . . . . . . . . . . . . . Revenue and Expenditure Equations 93

Charts 1 . Regional Per Capita Income as a Percent of U.S. Average.
Selected Years. 1900-75 .................................... 10 2 . Extrapolation to 1975 of Regional Relative Per Capita Income
Changes Between 1930 and 1950 . . . . . . . . . . . . . . . . . . . . . . . . . . . . 13 3 . GNP and Personal Income. 1960-77 ........................... 21 4 . Federal Taxes Per Capita and State Per Capita Income. by
State. 1975 ............................................... 64 5 . Federal Taxes Per Capita and State Per Capita Income. by
State. 1970 ............................................... 65 6 . Federal Taxes Per Capita and State Per Capita Income. by
State. 1960 . . . . . . . . . . . . . . . . . . . . . . . . . . . . . . . . . . . . . . . . . . . . . . . 66 7 . Federal axes Per Capita and State Per Capita Income. by
State.1952 ............................................... 67 8 . Federal Expenditures Per Capita and State Per Capital Income.
byState.1975 ............................................ 70 9 . Federal Expenditures Per Capita and State Per Capita Income.
bystate. 1970 ............................................ 71 10 . Federal Expenditures Per Capita and State Per Capita Income.
bystate. 1960 ............................................ 72 11 . Federal Expenditures Per Capita and State Per Capita Income.
............................................ bystate. 1952 73 12 . Federal Expenditure to Revenue Ratio and State Per Capita
Income Ratio. by State. 1975 ............................... 76 13 . Federal Expenditure to Revenue Ratio and State Per Capita
Income Ratio. by State. 1970 ............................... 77 14 . Federal Expenditure to Revenue Ratio and State Per Capita
Income Ratio. by State. 1960 ............................... 78 15 . Federal Expenditure to Revenue Ratio and State Per Capita
Income Ratio. by State. 1952 ............................... 79
Figures 1 . Summary of Shift Share Analyses ............................ 33 2 . Large Surpluses and Deficits on Federal Flow of Funds. 1960.
1970.1975 . . . . . . . . . . . . . . . . . . . . . . . . . . . . . . . . . . . . . . . . . . . . . . . . 81
Tables 1 . Regional Per Capita Income as Percent of U.S. Average.
Selected Years. 1900-75 .................................. 11 2 . Regional Per Capita Income as Percent of U.S. Average. 1970
and1975 . . . . . . . . . . . . . . . . . . . . . . . . . . . . . . . . . . . . . . . . . . . . . . 11 3 . Relative Per Capita Income Levels. 1975 . . . . . . . . . . . . . . . . . . . . 11 4 . Regional Distribution of U.S. Population. Selected Years.
1910-77 ................................................ 14 5 . Regional Distribution of Personal Income. Selected Years.
1900-77 ................................................ 14 .......... 6 . Regional Distribution of Manufacturing Labor Force 15
. . . . . . 7 . Regional Distribution of Value Added by Manufacturing 15 . . . . . . . . . . . . . . . . 8 . Regional Distribution of Services Labor Force 15
9 . Average Annual Rate of Growth of Population. by Region or State. Selected Periods. 1950-77 ........................ 16
10. Rates of Growth of Total Personal 'Income, by Region or . . . . . . . . . . . . . . . . . . . . . . . . . . State, Selected Periods, 1950-77 18
11. Total Nonagricultural Employment as a Percent of US. ............................... Total, by Region, 1950-77 . 2 2
12. Average Annual Rates of Growth of Nonagricultural ................... Employment, Selected Periods, 1950-75 . 2 2
13. Percent Change in Total Nonagricultural Employment, by . . . . . . . . . . . . . . . . . . . . . . . . . . . . . . . . Region or State, 1974-77 . 2 3
14. Total Manufacturing Employment as a Percent of U.S. . . . . . . . . . . . . . . . . . . . . . . . . . . . . . . . Total, by Region, 1950-77 . 2 4
15. Average Annual Rate of Growth in Manufacturing, by Region . . . . . . . . . . . . . . . . . . . . . . . or State, Selected Periods, 1950-75 . 2 5
16. Industrial Intensity, by Region, 1950 and 1977 .............. . 2 6 17. Unemployment Rates, by Region or State, 1950-75 . . . . . . . . . . . . 2 8 18. Actual and Hypothetical Growth of Manufacturing
Production Worker Employment in Four Business Cycles . . . . 34 19. State Total, Differential, and Proportionality Net Shifts in
Employment and the Industry Components of the ............................. Differential Shifts, 1939-54 . 3 6
20. Regional Growth Effects . . . . . . . . . . . . . . . . . . . . . . . . . . . . . . . . . . 3 8 21. Shift Share Analysis, 1963-72 . . . . . . . . . . . . . . . . . . . . . . . . . . . . . . 3 9 22. Change in Employment for the Electric and Electronic
Equipment Industry (SIC 36), Disaggregated to Three and ....................... Four-Digit SIC Branches, 1967-72 . 4 0
23. Average Deviations of Four-Digit SIC Industries from Selected Two-Digit SIC Aggregate Percentage Employment Changes . . 42
24. Shift-Share Analysis-New York State, 1968-73 ............. . 4 3 25. Index of Manufacturing Wage Rates, by Region, Selected
Years.1909-76 ......................................... 46 26. Average Hourly Earnings for Manufacturing Production
Workers, 1960 and 1975 . . . . . . . . . . . . . . . . . . . . . . . . . . . . . . . . . . 4 6 27. Behavior of Nonfarm Personal lncome During Postwar
Business Cycles, 1948-70 ................................ . 5 1 28. Selected Cyclical Characteristics of States . . . . . . . . . . . . . . . . . . . 5 2 29. Changes in Regional Employment Relative to National
Change, During Postwar Recessions and Expansions, . . . . . . . . . . . . . . . . . . . . . . . . . . . . . . . . . . . . . . . . . . . . . . . . 1948-75 55
Relationship Between Region and State and National Employment Growth, 1960-74 ........................... . 5 7
30. Interregional Variation in Employment Changes During Expansions and Recessions ............................. . 5 8
Comparative Data, New York State and Mississippi . . . . . . . . . . . 61 31. Ratio of Estimated Federal Government Expenditures
in Each Region and State to Estimated Federal Revenues from Residents of That Area, Selected Periods, 1952-76 ................................................ 68
32. Index Numbers of Estimated Federal Government Revenues Per Capita from Residents of Each Region or State,
................................. Selected Periods, 1952-76 74 33. Index Numbers of Estimated Federal Government Expenditures
Per Capita Allocated by Residence of Recipient or Location of Activity in Each Region or State, Selected Periods,
1952-76 . . . . . . . . . . . . . . . . . . . . . . . . . . . . . . . . . . . . . . . . . . . . . . . . 80 34. Estimated Federal Expenditure-Revenue Ratio for a State a t
. . . . . . Three Assumed Levels of Relative Per Capita Income . 8 1 35. Summary Relationships of Federal Flow-of-Funds Balances
and State Economic Growth Rates, 1950-75 . . . . . . . . . . . . . . . . 8 3 36. Employment Changes Resulting from $1 Billion Decrease in
Taxes, $1 Billion Increase in Federal Procurement and Construction Expenditures . . . . . . . . . . . . . . . . . . . . . . . . . . . . . . 86
37. Percentage of Total Labor Earnings Generated by Federal Government Purchases, 1947, 1958, 1962 Actual Year Data . . 87
A-1. Average Annual Rate of Growth in Per Capita Income, by Region and State, Selected Periods, 1950-78 . . . . . . . . . . . . . . . 104
A-2. Per Capita Personal Income, by Region and State, Selected Years,1950-78 . . . . . . . . . . . . . . . . . . . . . . . . . . . . . . . . . . . . . . . . 106
A-3. Personal Income in Current Dollars, by Region and State, Selected Years, 1950-78 . . . . . . . . . . . . . . . . . . . . . . . . . . . . . . . . . 108
A-4. Personal Income as a Percent of U.S. Total, by Region and State, Selected Years, 1950-78 . . . . . . . . . . . . . . . . . . . . . . . . . . . 110
A-5. Personal Income, Average Quarterly Rates of Growth, by Region and State, 1975 First Quarter to 1977 Third Quarter . . . . . . . . . . . . . . . . . . . . . . . . . . . . . . . . . . . . . . . . . . . . . . 112
. . . . . A-6. Population, by Region and State, Selected Years, 1950-78 114 A-7. Population as a Percent of U.S. Total, by Region and State,
Selected Years, 1950-78 . . . . . . . . . . . . . . . . . . . . . . . . . . . . . . . . . 116 A-8. Manufacturing Employment as a Percent of U.S. Total, by
Region and State, Selected Years, 1950-78 . . . . . . . . . . . . . . . . 118 A-9. Manufacturing Employment, by Region and State, Selected
Years.1950-78 . . . . . . . . . . . . . . . . . . . . . . . . . . . . . . . . . . . . . . . . 120 A-10. Nonagricultural Employment as a Percent of U.S. Total, by
. . . . . . . . . . . . . . . . Region and State, Selected Years, 1950-78 122 A-11. Nonagricultural Employment, by Region and State, Selected
Years,1950-78 . . . . . . . . . . . . . . . . . . . . . . . . . . . . . . . . . . . . . . . . 124 A-12. Rate of Growth of Nonagricultural Employment, by Region
. . . . . . . . . . . . . . . . . . . . . . . and State, Selected Years, 1950-78 126 . . . . . . . . . . A-13. Unemployment Rate, by Region and State, 1973-78 128
A-14. Unemployment Rate Relative to U.S. Average, by Region and State,1973-78 . . . . . . . . . . . . . . . . . . . . . . . . . . . . . . . . . . . . . . . . . 130
A-15. Total Wages Per Wage Earner in Manufacturing Establish- . . . . . . . ments, by Region and State, Selected Years, 1909-47 132
A-16. Average Hourly Earnings of Production Workers on Manu- facturing Payrolls, by Region and State, Selected Years, 1955-78 . . . . . . . . . . . . . . . . . . . . . . . . . . . . . . . . . . . . . . . . . . . . . . . 134
A-17. State Average Hourly Earnings for Production Workers on Manufacturing Payrolls Relative to U.S. Average, Selected Years.1965-78 . . . . . . . . . . . . . . . . . . . . . . . . . . . . . . . . . . . . . . . . 136
A-18. State and Local General Revenue from Own Sources Per $1,000 Personal Income, by Region and State, Selected
. . . . . . . . . . . . . . . . . . . . . . . . . . . . . . . . . . . . . . . . Years,1942-78 138 A-19. State and Local Taxes Per $1,000 Personal Income, by Region
. . . . . . . . . . . . . . . . . . . . . . . and State, Selected Years, 1942-78 140 . . . . . . . . . . . . . . . . . . . A-20. Personal Income, Selected Years, 1950-76 142
Chapter I
INTRODUCTION
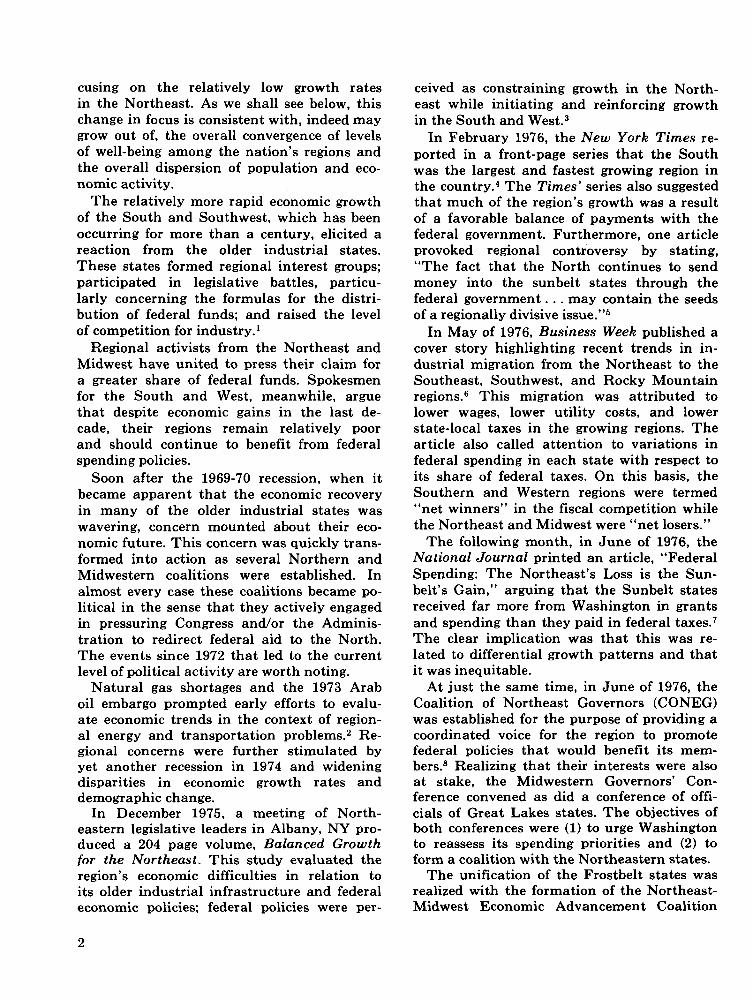
A t least since the late 19th century, eco- nomic activity and population have dis-
persed across the nation: there is less concen- tration in the Northeast. The economies of the regions have begun to look more alike in per capita income and in the division of the labor force between agricultural and other employment. As the regional economies be- come more similar in terms of development levels and well-being, the question arises as to whether future development will bring rel- ative equilibrium or new disparities. Put simply, if recent differences in rates of region- al growth are extrapolated into the future, it is possible that the Northeast will become substantially poorer than the Southeast and Southwest and that the Northeast's relatively slow growth may become absolute decline. I t is this type of extrapolation that lies behind the concern about "a new war between the states" and the increasing number of regional organizations and coalitions studying the questions of regional differential growth and urging changes in federal policy to compen- sate for these differences.
REGIONALISM IN THE 1970s The 1970s witnessed a transformation of
the discussion of regional economic dispari- ties within the United States from an earlier long-standing concern with the relative eco- nomic backwardness of the South to one fo-
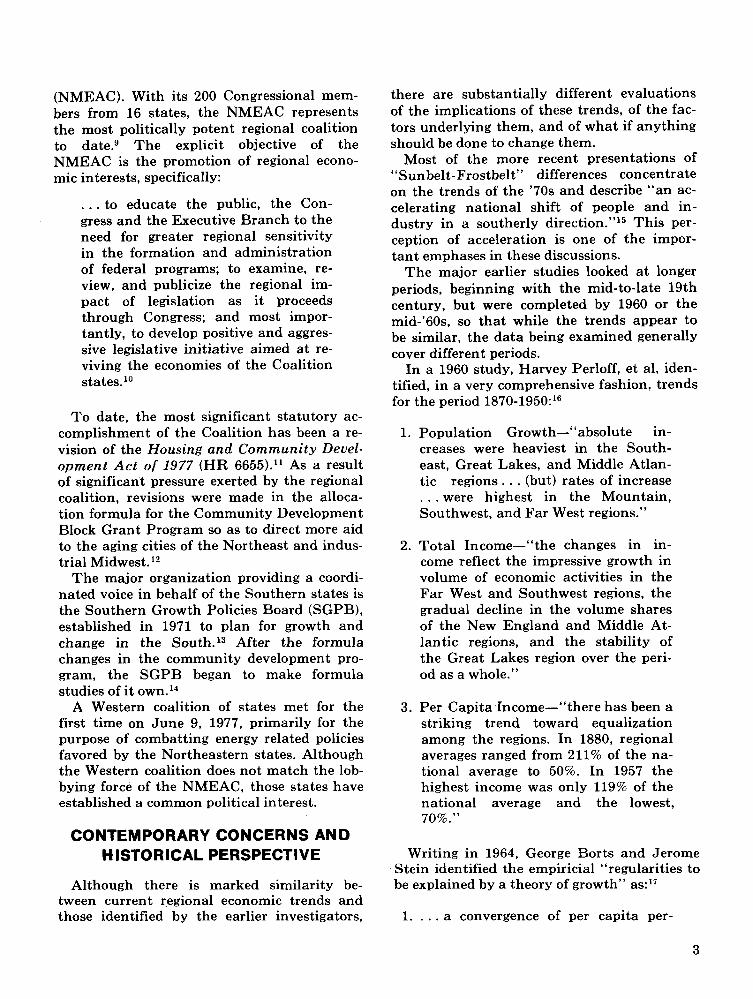
cusing on the relatively low growth rates in the Northeast. As we shall see below, this change in focus is consistent with, indeed may grow out of, the overall convergence of levels of well-being among the nation's regions and the overall dispersion of population and eco- nomic activity.
The relatively more rapid economic growth of the South and Southwest, which has been occurring for more than a century, elicited a reaction from the older industrial states. These states formed regional interest groups; participated in legislative battles, particu- larly concerning the formulas for the distri- bution of federal funds; and raised the level of competition for industry.'
Regional activists from the Northeast and Midwest have united to press their claim for a greater share of federal funds. Spokesmen for the South and West, meanwhile, argue that despite economic gains in the last de- cade, their regions remain relatively poor and should continue to benefit from federal spending policies.
Soon after the 1969-70 recession, when it became apparent that the economic recovery in many of the older industrial states was wavering, concern mounted about their eco- nomic future. This concern was quickly trans- formed into action as several Northern and Midwestern coalitions were established. In almost every case these coalitions became po- litical in the sense that they actively engaged in pressuring Congress andlor the Adminis- tration to redirect federal aid to the North. The events since 1972 that led to the current level of political activity are worth noting.
Natural gas shortages and the 1973 Arab oil embargo prompted early efforts to evalu- ate economic trends in the context of region- al energy and transportation problem^.^ Re- gional concerns were further stimulated by yet another recession in 1974 and widening disparities in economic growth rates and demographic change.
In December 1975, a meeting of North- eastern legislative leaders in Albany, NY pro- duced a 204 page volume, Balanced Growth for the Northeast. This study evaluated the region's economic difficulties in relation to its older industrial infrastructure and federal economic policies; federal policies were per-
ceived as constraining growth in the North- east while initiating and reinforcing growth in the South and West.3
In February 1976, the New York Times re- ported in a front-page series that the South was the largest and fastest growing region in the ~ o u n t r y . ~ The Times' series also suggested that much of the region's growth was a result of a favorable balance of payments with the federal government. Furthermore, one article provoked regional controversy by stating, "The fact that the North continues to send money into the sunbelt states through the federal government. . . may contain the seeds of a regionally divisive i~ sue . "~
In May of 1976, Business Week published a cover story highlighting recent trends in in- dustrial migration from the Northeast to the Southeast, Southwest, and Rocky Mountain region^.^ This migration was attributed to lower wages, lower utility costs, and lower state-local taxes in the growing regions. The article also called attention to variations in federal spending in each state with respect to its share of federal taxes. On this basis, the Southern and Western regions were termed "net winners" in the fiscal competition while the Northeast and Midwest were "net losers."
The following month, in June of 1976, the National Journal printed an article, "Federal Spending: The Northeast's Loss is the Sun- belt's Gain," arguing that the Sunbelt states received far more from Washington in grants and spending than they paid in federal taxes.7 The clear implication was that this was re- lated to differential growth patterns and that it was inequitable.
At just the same time, in June of 1976, the Coalition of Northeast Governors (CONEG) was established for the purpose of providing a coordinated voice for the region to promote federal policies that would benefit its mem- b e r ~ . ~ Realizing that their interests were also at stake, the Midwestern Governors' Con- ference convened as did a conference of offi- cials of Great Lakes states. The objectives of both conferences were (1) to urge Washington to reassess its spending priorities and (2) to form a coalition with the Northeastern states.
The unification of the Frostbelt states was realized with the formation of the Northeast- Midwest Economic Advancement Coalition
(NMEAC). With its 200 Congressional mem- bers from 16 states, the NMEAC represents the most politically potent regional coalition to date.g The explicit objective of the NMEAC is the promotion of regional econo- mic interests, specifically:
. . . to educate the public, the Con- gress and the Executive Branch to the need for greater regional sensitivity in the formation and administration of federal programs; to examine, re- view, and publicize the regional im- pact of legislation as it proceeds through Congress; and most impor- tantly, to develop positive and aggres- sive legislative initiative aimed a t re- viving the economies of the Coalition states.1°
To date, the most significant statutory ac- complishment of the Coalition has been a re- vision of the Housing and Community Devel- opment Act o f 1977 ( H R 6655).11 As a result of significant pressure exerted by the regional coalition, revisions were made in the alloca- tion formula for the Community Development Block Grant Program so as to direct more aid to the aging cities of the Northeast and indus- trial Midwest. l2
The major organization providing a coordi- nated voice in behalf of the Southern states is the Southern Growth Policies Board (SGPB), established in 1971 to plan for growth and change in the South.13 After the formula changes in the community development pro- gram, the SGPB began to make formula studies of it own.'*
A Western coalition of states met for the first time on June 9, 1977, primarily for the purpose of combatting energy related policies favored by the Northeastern states. Although the Western coalition does not match the lob- bying force of the NMEAC, those states have established a common political interest.
CONTEMPORARY CONCERNS AND HISTORICAL PERSPECTIVE
Although there is marked similarity be- tween current regional economic trends and those identified by the earlier investigators,
there are substantially different evaluations of the implications of these trends, of the fac- tors underlying them, and of what if anything should be done to change them.
Most of the more recent presentations of "Sun belt- Frostbel t" differences concentrate on the trends of the '70s and describe "an ac- celerating national shift of people and in- dustry in a southerly direction."15 This per- ception of acceleration is one of the impor- tant emphases in these discussions.
The major earlier studies looked a t longer periods, beginning with the mid-to-late 19th century, but were completed by 1960 or the mid-'60s, so that while the trends appear to be similar, the data being examined generally cover different periods.
In a 1960 study, Harvey Perloff, et al, iden- tified, in a very comprehensive fashion, trends for the period 1870-1950:16
1. Population Growth-"absolute in- creases were heaviest in the South- east, Great Lakes, and Middle Atlan- tic regions. . . (but) rates of increase . . . were highest in the Mountain, Southwest, and Far West regions."
2. Total Income-"the changes in in- come reflect the impressive growth in volume of economic activities in the Far West and Southwest regions, the gradual decline in the volume shares of the New England and Middle At- lantic regions, and the stability of the Great Lakes region over the peri- od as a whole."
3. Per Capita Income-"there has been a striking trend toward equalization among the regions. In 1880, regional averages ranged from 211% of the na- tional average to 50%. In 1957 the highest income was only 119% of the national average and the lowest, 70%."
Writing in 1964, George Borts and Jerome Stein identified the empiricial "regularities to be explained by a theory of growth" as:17
1. . . . a convergence of per capita per-
sonal incomes among states since 1880. The difference among states is narrowing over time.
. . . a stable pattern of growth of manufacturing employment since 1869. Some states have persistently grown more rapidly than others.
. . . a stable pattern of growth of non- agricultural employment and of the capital employed in nonagricultural industries. Again, some states have persistently grown more rapidly than others since 1919.
Certain states have experienced an absolute decline of employment. Many of the "depressed areas," as identified by various government agencies, are clustered in these states.
A group of states has persistently experienced a slower-than-average growth of earnings per worker in non- agricultural occupations.
The data supporting these assertions show that between 1880 and 1950, convergence among the different regions brought the high- est average per capita personal income, that of the Middle Atlantic states, to only twice that of the lowest average, the East South Central states. In 1880. the difference be- tween the highest and lowest income regions, the Pacific and South Atlantic states, had been nearly four-fold. The data also show how the changes in manufacturing employ- ment growth had been fairly consistent over the period 1869-1949: in nearly all of the eight decades, New England and Northeastern states had lower than national average growth rates and many of the South, South- west, and Western states had persistently higher rates of growth in manufacturing em- ployment.
The authors of these early studies con- cluded that these changes were generally a good thing: the movements observed and the differential rates of change were in the de- sired directions, toward greater equality among regions, with concomitant greater ef-
ficiency for the national economy as a whole as a result of the reallocation of both capital and labor to more productive uses. If any- thing, the authors argued that change had occurred too slowly, e.g., Perloff, et al, con- clude, "The adjustments have been made a t a painfully slow rate; as a result, levels of liv- ing in agricultural areas in various parts of the country, but especially in the Southeast, continue to be substantially below the na- tional average in spite of very heavy migra- tion from farming and from farm areas."'* In- deed, Perloff, et al, suggest that if anything is needed it is programs to increase migration from, or employment in, the poorer regions of the country (the Southeast).
Although Borts and Stein identify the older Northeastern states and the older farming and mining areas of the country as problems, their principal conclusion is that the "U.S. interregional and interindustrial growth pat- tern seems to be tending towards an inter- temporal competitive equilibrium and hence towards intertemporal efficiency." Given this, they argue that "The most efficient policy is the federal government subsidy of education, retraining, and migration."19
In the current context, differential regional economic growth (not differing levels of econo- mic development) has become cause for se- rious concern, particularly by persons whose interests are in the older industrial states. Analyses prepared by these interests cite growth patterns similar to those of the ear- lier studies, (generally limited, however, to examination of fairly recent data rather than long-term historical trends). The inference they draw is that the nation is moving not toward equilibrium among regions but rather to a new set of regional disparities.
THIS STUDY AND ITS MAJOR CONCLUSIONS
In this volume, we examine the major his- torical trends in regional economic activity. Although we are concerned with a long view, the years since the Second World War will be examined in greater detail for evidence of con- sistency with, or divergence from, earlier pat- terns. Several explanations of these patterns
of regional economic development will be ex- amined. These include models which empha- size maturity processes and demand shifts, relative cost differences, and finally, those which stress the role of federal intervention, in particular, the importance of the regional sources of federal revenues and the regional destination of expenditures. The differential regional implications of national stabilization policy are also considered.
This study attempts to integrate the find- ings of a highly varied body of literature, some explicitly addressed to questions of com- parative regional economics, some more con- cerned with general issues, but in which re- gional economic implications were derived. The studies cover different, sometimes over- lapping, time periods, use different variables in their analysis, as well as numerous mea- sures of change, divergence, and convergence. Yet, there is a striking consistency of findings, more qualitative than quantitative, about both patterns and explanations. Thus, many of the recent findings, summarized below, provide further evidence for conclusions of earlier studies. Our purpose has been to bring together a literature which has been highly dispersed, demonstrate the similarity of anal- yses and conclusions, and to fill some gaps, particularly in the analysis of the regional impact of the federal budget.
Findings
Convergence. Over the last 50 years (per- haps over the last century), economic activity and population movements have resulted in growing equalization of well-being among the eight regions of the country as measured by per capita incomes. In 1930 per capita in- comes in the Mideast states were more than twice those in the Southeast. By 1977 they were less than 25% greater.
Decentralization. The convergence in re- gional levels of well-being has been accompa- nied by a very substantial dispersion of pop- ulation and economic activity away from the regions of earliest industrialization. In 1900, for example, the Mideast states had 31% of the nation's total personal income and the
Southeast only 12%. By 1977 these figures were 21% and 20%, respectively.
Divergence in 1970s. During the early 1970s, the variations in the rates of regional economic growth appear to have widened. Although convergence and dispersion of the magnitudes observed have required generally lower rates of growth in the older industrial regions, they seem to have fallen even further behind national growth rates in the 1970s. Between 1950 and 1970, for example, the av- erage annual rate of growth of personal in- come in the Mideast states was only 8% or 9% below the national average. Between 1970 and 1975 it fell to 25% below the national av- erage growth rate.
Dislocation. These enormous regional shifts in economic activity have, by and large, been accomplished without concomitant disparities in regional unemployment rates. As recently as 1970, the states of the Mideast region all had below average unemployment rates.
Industrial Maturity. National changes in demand patterns for different products can- not account for differential regional growth rates. Despite their slower growth, the sec- toral mix of industries in the Northeast and Midwest is still favorable, although these advantages are disappearing. On the basis of its 1968 sectoral composition of employment, New York State would have been expected to show employment increases of about 13% be- tween 1968 and 1973 (about the same as the national average). In fact, employment de- clined by about 1% in New York State.
Competitive Factors. Since the turn of the century, regional manufacturing wage rates have generally been converging, largely as a result of a slow but steady relative increase in wages in the Southeast. The more rapidly growing regions are generally those with rela- tively low wages, although the Far West, with high wages and high growth, is an important exception, as is New England with relatively low wages and low growth. Despite the overall convergence in regional wages, the differences may still be large enough to be consistent with further competitive shifts of industry.
National Stabilization. For the last 25 years, at least, the economies of the Northeast and Midwest have been robust only when na- tional growth rates have been high. Other regions, however, continue to grow, some- times quite rapidly, even during recessions.
Federal Flows-of-funds. Over the last 25 years the rapidly growing states of the South- east and Southwest have received substan- tially more in federal government expendi- tures than they (their residents) have paid to the federal government in taxes and other revenues. The Northeast and Midwest states generally receive far less than they provide in
revenues to the federal government. In 1952, the ratio of expenditures to revenues was 1.51 in the Southeast and only .75 in the Mid- east. Over time these differences have nar- rowed very substantially. By 1974-76, the ra- tios were 1.11 and 1.02 in the Southeast and Mideast, respectively. The Great Lakes states, however, have consistently low ratios of expenditures received from the federal government relative to revenues paid.
Taxes paid by states (by their residents) to the federal government are very closely relat- ed to their per capita incomes, the higher in- comes, the higher taxes. No such relation- ship holds with respect to expenditures.
FOOTNOTES
'All of this concern and activity has been chronicled- less often analyzed-in a substantial number of articles in the newspapers and special interest magazines. Most of these are cited in the bibliography. Two pieces pro- vide a good introduction: Robert Rafuse, Jr., "The New Sectionalism Controversy: An Overview," paper pre- pared for the Center for Policy Research and Analysis, National Governors' Conference, January 26, 1977, and Neal Pierce, "Northeast Governors Map Battle Plan for Fight Over Federal Funds Flow," National Journal, Washington, DC, Government Research Corporation. November 27,1976.
2The New England Congressional Caucus and Economic Research Office was established in late 1972, and, in 1974, legislators from nine Northeastern states and Delaware met to discuss regional energy supply prob- lems. The 1974 conference resulted in a report entitled, The Northeastern States Confront the Energy Crisis.
3Balanced Growth for the Northeast, proceedings of a Conference of Legislators on the Future of the North- east, Albany. NY. New York State Senate, 1975.
4Robert Reinhold, "Sunbelt Region Leads Nation in Growth of Population: Section's Cities Top Urban Ex- pansion," New York Times, New York, NY, New York Times Publishing Co., February 8, 1976, pp. 1 and 42; Jon Nordheimer, "Sunbelt Region Leads Nation in Growth of Population: Area Spans Southern Half of Country," New York Times, February 8 , 1976, pp. 1 and 42; James P. Sterba, "Houston, as Energy Capital. Sets Pace in Sunbelt Boom," New York Times, Febru- ary 9, 1976, pp. 1 and 24; Wayne King, "Federal Funds Pour Into Sunbelt States," New York Times, February 9 , 1976, p. 24; Roy Reed, "Sunbelt Still Stronghold of Conservatism in U.S.," New York Times, February 10, 1976, pp. 1 and 22; Roy Reed, "Migration Mixes a New Southern Blend," New York Times, February 11, 1976, pp. 1 and 30; and B. Drummond Ayres, Jr., "De- veloping Sunbelt Hopes to Avoid North's Mistakes." New York Times, February 12, 1976, pp. 1 and 24.
5Nordheimer, New York Times, op. cit., p. 42. ="The Second War Between the States," Business Week, New York, NY, McGraw-Hill, Inc., May 17,1977.
?"Federal Spending: The Northeast's Loss is the Sun- belt's Gain," National Journal, Washington, DC, Gov-
ernment Research Corporation, June 1976. Wurrently seven states are represented: New Jersey, New York, Pennsylvania, Connecticut, Rhode Island, Massachusetts, and Vermont. CONEG held its first meeting in mid-November 1976 (for details see Neal Pierce; op. cit.) a t which it formulated a comprehensive plan of action. CONEG's action plan recommended such policies as: a revision of federal grant and procure- ment policies that would raise the share of funds going to areas experiencing above average unemployment; per- manent authorization for countercyclical grants-in- aids for public employment and public works; the in- clusion of tax effort and cost-of-living measures in grant formulas, the creation of a regional development and energy corporation which would issue federally guaranteed nontaxable bonds to finance loans for energy development purposes. In addition, CONEG re- ceived research support from the Council for Northeast Economic Action which received some $540,000 from EDA for this purpose.
gThe 16 NMEAC states are-Connecticut, Illinois, Indi- ana, Iowa, Maine, Massachusetts, Michigan, Minne- sota, New Hampshire. New Jersey, New York, Ohio, Pennsylvania, Rhode Island, Vermont, and Wisconsin.
loMichael J . Harrington, "In Congress, An Effort to Re- verse the Tide," Empire State Report, New York, NY, New York State Legislative Institute. Vol. 2, October- November, 1976. pp. 353 and 355.
"The National Journal, July 2, 1977, op. cit., described the Congressional battle over H R 6655 as follows:
The dividing line was neither political nor ideo- logical. as it usually is in Congressional debates. Instead, the split was a geographical one, with spokesmen for the aging, industrial Frostbelt lined up against representatives of the expand- ing Sunbelt. When the battle ended, the Frost- belt had routed the Sunbelt by a vote of 261- 149.
'?The NMEAC was also influential in the decision to continue countercyclical aid which also tends to greatly benefit Frostbelt cities. Their future agenda includes such items as: changing formulas in food stamp legisla- tion, welfare, and educational aid to take into account such factors as cost-of-living, tax capacity and effort, and new poverty indicators; encouraging the formation of a Regional Development Bank (a feature of President Carter's Urban Policy); changing federal tax laws which

now favor only new construction so that they include benefits for rehabilitation and maintenance of older infrastructure; reviving the legislative intent of the 1952 federal procurement guidelines that encourage spending in areas of high unemployment.
13The SGPB is an interstate agency comprised of 13 states: Alabama, Arkansas, Florida. Georgia, Ken- tucky, Louisiana, Mississippi, North Carolina, Okla- homa, South Carolina, Tennessee. Virginia, and West Virginia.
14"Regionalism in Congress: Formulas Debated," Con- gressional Quarterly, Washington, DC, Congressional
Quarterly, Inc., August 20, 1977, P. 1748. 15John E. Petersen. "Key Trends of the Seventies." Part 1 of Frost Belt vs. Sun Belt, Boston, MA, First Boston Corporation, Special Report, 1977, mimeo, p. 3.
IsHarvey Perloff, et el, Regions, Resources, and Eco- nomic Growth, Lincoln, NE, University of Nebraska Press, 1960.
"George H. Borts and Jerome Stein, Economic Growth in a Free Market, New York, Columbia University Press. 1964. p. 19.
18Perloff, et al, op. cit., p. 606. 'OBorts and Stein, op. cit.. p. 214.


Chapter II
Regional Economic Convergence and the Geographical
Dispersion of Economic Activity
0 ver the last 50 years economic activity and population movements have resulted
in growing equalization of well-being among the eight regions of the country.
CONVERGENCE IN PER CAPITA INCOME
In 1930, per capita incomes in the Mideast, Far West, and New England states were 30% to 40% above the U.S. average and in the Southeast only half this average. Put another way, per capita incomes in the wealthier re- gions were nearly three times those in the Southeast. By 1977, the highest regional per
REGIONS IN PER CAPITA INCOME ORDER, 1930 and 1977
I Rank 1930 1977
Highest Mideast Far West
New England
Great Lakes Rocky Mountain Plains
Lowest Southwest Southeast
Far West
Mideast Great Lakes New England
Rocky Mountain Plains Southwest Southeast
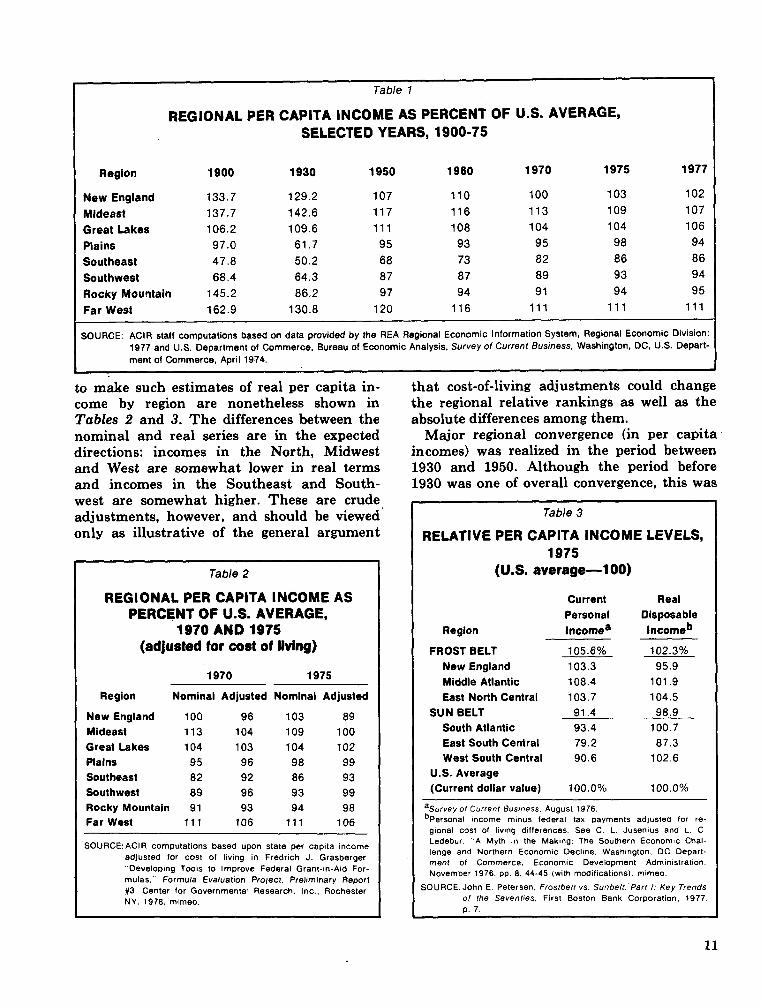
capita incomes, in the Far West, were only 11% above the national average and the lowest, in the Southeast, were only 14% below the national average. Table 1 and Chart 1.

Chart 1
1900 1930 1950 1960 1970 .75 .77* Great Lakes- - - Far West Plains Mideast ---.I Southwest New England- Southeast - Rocky Mountain..
'The 1977 figure is based upon 1976 population figures (state tax collections, 1977) and 1977 third quarter income estimates (Robert Bretdelder, Survey of Current Business, Washington, DC, U.S. Department of Commerce, January 1978, p. 20).
SOURCE: Table 1 , page 1 1.
The rich regions-Mideast, Far West, New England, and Great Lakes-have become relatively less rich and the poor regions- Southeast, Plains, and Rocky Mountain- have become less poor.
Nonetheless, the ranking of the regions is not very different in 1977 from what it was in 1930: the Far West, Mideast, and New Eng- land states are among the upper half of re-
gions in the nation and the Plains, South- west, and Southeast are the three lowest per capita income regions.
Cost of living adjustments to these regional per capita income figures might change their order, but the appropriate cost of living ad- justments are neither conceptually clear nor are good data available on actual cost of liv- ing differences among regions.' Two attempts
I Table I
REGIONAL PER CAPITA INCOME AS PERCENT OF U.S. AVERAGE, SELECTED YEARS, 1900-75
Region 1900 1930 1950 1960 1970 1975
New England Mideast Great Lakes Plains Southeast Southwest Rocky Mountain Far West
- - -
SOURCE: AClR staff computations based on data provided by the REA Regional Economic Information System, Regional Economic Division: 1977 and U.S. Department of Commerce. Bureau of Economic Analysis. Survey of Current Business. Washington, DC, U.S. Depart- ment of Commerce. April 1974.
to make such estimates of real per capita in- come by region are nonetheless shown in Tables 2 and 3. The differences between the nominal and real series are in the expected directions: incomes in the North, Midwest and West are somewhat lower in real terms and incomes in the Southeast and South- west are somewhat higher. These are crude adjustments, however, and should be viewed only as illustrative of the general argument
Table 2
REGIONAL PER CAPITA INCOME AS PERCENT OF U.S. AVERAGE,
1970 AND 1975 (adjusted for cost of living)
Region Nominal Adjusted Nominal Adjusted
New England 100 96 103 89 Mideast 113 104 109 100 Great Lakes 104 103 104 102 Plains 95 96 98 99 Southeast 82 92 86 93 Southwest 89 96 93 99 Rocky Mountain 91 93 94 9 8 Far West 1 1 1 106 1 1 1 106
S0URCE:ACIR computations based upon state per capita income adjusted for cost of living in Fredrich J. Grasberger "Developing Tools to Improve Federal Grant-in-Aid For- mulas." Formula Evaluation Project. Preliminary Report #3. Center for Governmental Research. Inc.. Rochester NY. 1978. mimeo.
that cost-of-living adjustments could change the regional relative rankings as well as the absolute differences among them.
Major regional convergence (in per capita incomes) was realized in the period between 1930 and 1950. Although the period before 1930 was one of overall convergence, this was
Table 3
RELATIVE PER CAPITA INCOME LEVELS, 1975
(U.S. average-1 00)
Current Real Personal Disposable
Region lncomea lncomeb
FROST BELT 105.6% 102.3% New England 103.3 95.9 Middle Atlantic 108.4 101.9 East North Central 103.7 104.5
SUN BELT 91.4 98.9 South Atlantic 93.4 100.7 East South Central 79.2 87.3 West South Central 90.6 102.6
U.S. Average (Current dollar value) 100.0% 100.0%
a~urvey 01 Current tlusmess. August 1976. b~ersonal mcome mlnus federal tax Dayments adjusted for re- gional cost of living differences. See C. L. Jusen~us and L. C. Ledebur. "A Myth In the M a k q The Southern Economlc Chal- lenge and Northern Econom~c Dechne. Washmgton. DC Depart- ment of Commerce. Econom~c Development Admin~stratlon. November 1976. pp. 8. 44-45 (with mod~ficatlons). mlmeo.
SOURCE. John E. Petersen. Frostbelt vs. Sunbelt. Part I: Key Trends of the Seventfes. First Boston Bank Corporation. 1977 D. 7.
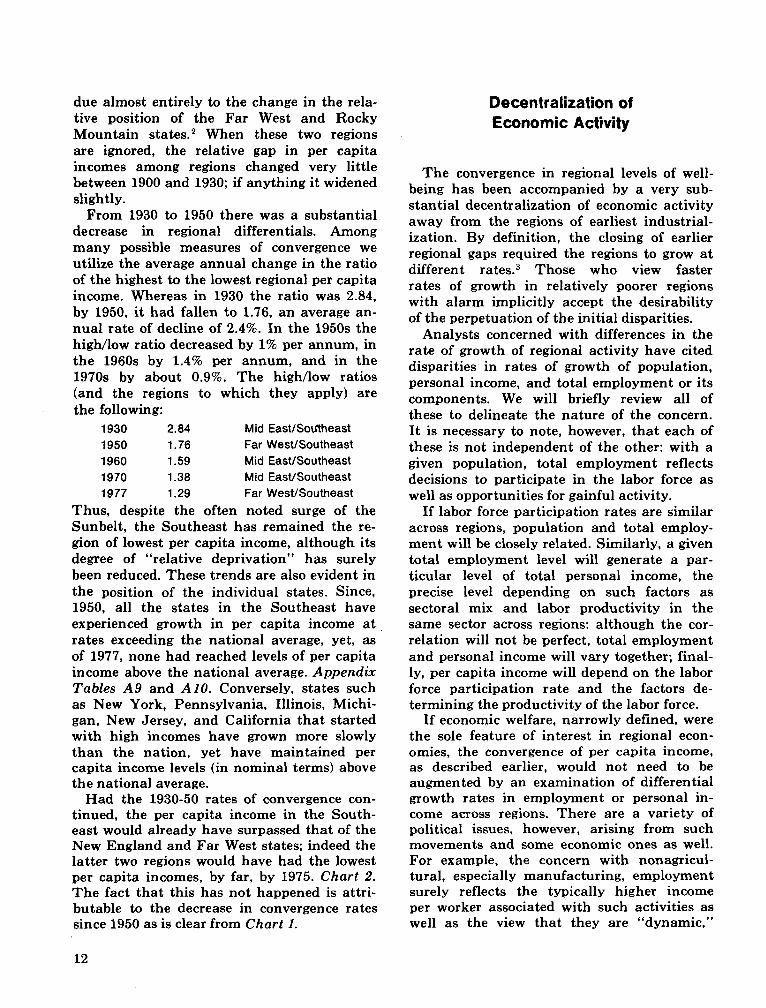
due almost entirely to the change in the rela- tive position of the Far West and Rocky Mountain statesd2 When these two regions are ignored, the relative gap in per capita incomes among regions changed very little between 1900 and 1930; if anything it widened slightly.
From 1930 to 1950 there was a substantial decrease in regional differentials. Among many possible measures of convergence we utilize the average annual change in the ratio of the highest to the lowest regional per capita income. Whereas in 1930 the ratio was 2.84, by 1950, it had fallen to 1.76, an average an- nual rate of decline of 2.4%. In the 1950s the highAow ratio decreased by 1% per annum, in the 1960s by 1.4% per annum, and in the 1970s by about 0.9%. The highllow ratios (and the regions to which they apply) are the following:
1930 2.84 Mid EastfSotftheast 1950 1.76 Far WestfSoutheast 1960 1.59 Mid EastfSoutheast 1970 1.38 Mid EastfSoutheast 1977 1.29 Far West/Southeast
Thus, despite the often noted surge of the Sunbelt, the Southeast has remained the re- gion of lowest per capita income, although its degree of "relative deprivation" has surely been reduced. These trends are also evident in the position of the individual states. Since, 1950, all the states in the Southeast have experienced growth in per capita income a t , rates exceeding the national average, yet, as of 1977, none had reached levels of per capita income above the national average. Appendix Tables A9 and AlO. Conversely, states such as New York, Pennsylvania, Illinois. Michi- gan, New Jersey, and California that started with high incomes have grown more slowly than the nation, yet have maintained per capita income levels (in nominal terms) above the national average.
Had the 1930-50 rates of convergence con- tinued, the per capita income in the South- east would already have surpassed that of the New England and Far West states; indeed the latter two regions would have had the lowest per capita incomes. by far. by 1975. Chart 2. The fact that this has not happened is attri- butable to the decrease in convergence rates since 1950 as is clear from Chart 1.
Decentralization of Economic Activity
The convergence in regional levels of well- being has been accompanied by a very sub- stantial decentralization of economic activity away from the regions of earliest industrial- ization. By definition, the closing of earlier regional gaps required the regions to grow a t different rates.3 Those who view faster rates of growth in relatively poorer regions with alarm implicitly accept the desirability of the perpetuation of the initial disparities.
Analysts concerned with differences in the rate of growth of regional activity have cited disparities in rates of growth of population, personal income, and total employment or its components. We will briefly review all of these to delineate the nature of the concern. I t is necessary to note, however, that each of these is not independent of the other: with a given population, total employment reflects decisions to participate in the labor force as well as opportunities for gainful activity.
If labor force participation rates are similar across regions, population and total employ- ment will be closely related. Similarly, a given total employment level will generate a par- ticular level of total personal income, the precise level depending on such factors as sectoral mix and labor productivity in the same sector across regions: although the cor- relation will not be perfect, total employment and personal income will vary together; final- ly, per capita income will depend on the labor force participation rate and the factors de- termining the productivity of the labor force.
If economic welfare, narrowly defined, were the sole feature of interest in regional econ- omies, the convergence of per capita income, as described earlier, would not need to be augmented by an examination of differential growth rates in employment or personal in- come across regions. There are a variety of political issues, however, arising from such movements and some economic ones as well. For example, the concern with nonagricul- tural, especially manufacturing, employment surely reflects the typically higher income per worker associated with such activities as well as the view that they are "dynamic,"

Chart 2
EXTRAPOLATION TO 1975 OF REGIONAL RELATIVE PER CAPITA INCOME CHANGES, 1930-50
Per capita income (percent ot U.S. 1 average)
Far West
Mideast New England
Great Lakes
Rocky Mountain Plains
South West
South East
- /SOUTH EAST e '
RANK ORDER EXTRAPOLATION TO 1975
HIGHEST Southwest Plains Rocky Mountain Great Lakes Mideast Southeast Far West
LOWEST New England
SOURCE: AClR staff computations.
ACTUAL 1975
Far West Mideast Great Lakes New England Plains Rocky Mountain Southwest Southeast
i.e., have the potential for rapid productivity growth.
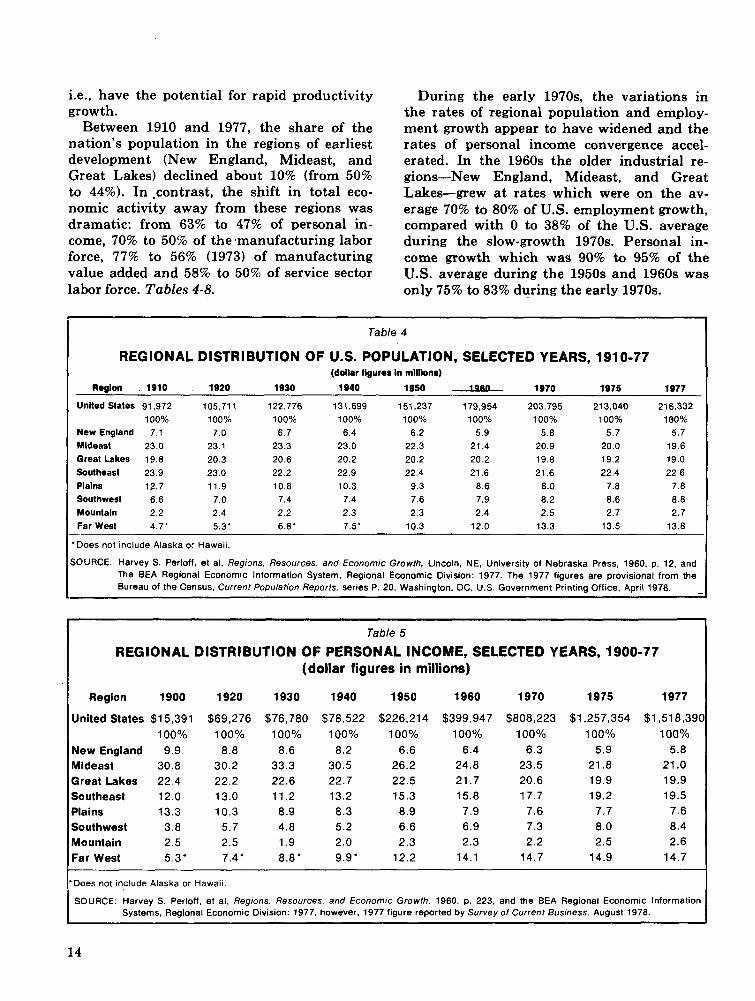
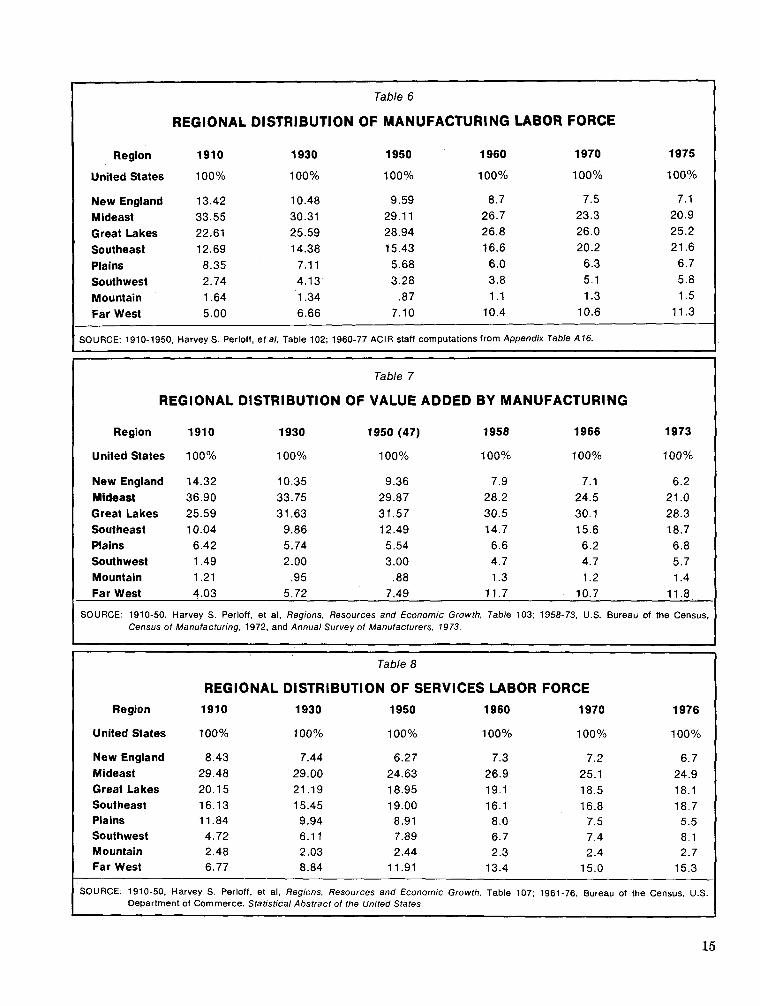
Between 1910 and 1977, the share of the nation's population in the regions of earliest development (New England, Mideast, and Great Lakes) declined about 10% (from 50% to 44%). In .contrast, the shift in total eco- nomic activity away from these regions was dramatic: from 63% to 47% of personal in- come, 70% to 50% of the,manufacturing labor force, 77% to 56% (1973) of manufacturing value added and 58% to 50% of service sector
During the early 1970s, the variations in the rates of regional population and employ- ment growth appear to have widened and the rates of personal income convergence accel- erated. In the 1960s the older industrial re- gions-New England, Mideast, and Great Lakes-grew at rates which were on the av- erage 70% to 80% of US. employment growth, compared with 0 to 38% of the US. average during the slow-growth 1970s. Personal in- come growth which was 90% to 95% of the US. average during the 1950s and 1960s was
labor force. Tables 4-8. only 75% to 83% during the early 1970s.
I Table 4
REGIONAL DISTRIBUTION OF U.S. POPULATION, SELECTED YEARS, 1910-77 (dollar tlgurer i n millions)
Raglon 1910 1920 1930 1940 lSSO lasn 1970 1975
United States 91,972 105.71 1 122.776 131.699 151.237 179.954 203,795 213.040
100% 100% 100% 100% 100% 100% 100% 100% New England 7.1 7.0 6.7 6.4 6.2 5.9 5.8 5.7 Mideast 23.0 23.1 23.3 23.0 22.3 21.4 20.9 20.0 Great Lakes 19.8 20.3 20.6 20.2 20.2 20.2 19.8 19.2
Southeast 23.9 23.0 22.2 22.9 22.4 21.6 21.6 22.4 Plains 12.7 11.9 10.8 10.3 9.3 8.6 8.0 7.8 Southwest 6.6 7.0 7.4 7.4 7.6 7.9 8.2 8.6 Mountain 2.2 2.4 2.2 2.3 2.3 2.4 2.5 2.7 Far West 4.7' 5.3' 6.8' 7.5' 10.3 12.0 13.3 13.5
I .Does not include Alaska 0: Hawail.
I SOURCE: Harvey S. Perloff, et al. Regions. Resources. and Economic Growth, Lincoln, NE, University of Nebraska Press. 1960, p. 12, and The BEA Regional Economic lnformation System, Regional Economic Division: 1977. The 1977 figures are provisional from the Bureau of the Census, Current Population Reports, series P. 20, Washington, DC, U.S. Government Printing Office. April 1978. -
Table 5
REGIONAL DISTRIBUTION OF PERSONAL INCOME, SELECTED YEARS, 1900-77 (dollar figures in millions)
Region 1900 1920 1930 1940 1950 1960 1970 1975 1977
Unitedstates $15,391 $69,276 $76,780 $78,522 $226,214 $399,947 $808,223 $1,257,354 $1,518,39( 100% 100% 100% 100% 100% 100% 100% 100% 100%
New England 9.9 8.8 8.6 8.2 6.6 6.4 6.3 5.9 5.8 Mideast 30.8 30.2 33.3 30.5 26.2 24.8 23.5 21.8 21 .O Great Lakes 22.4 22.2 22.6 22.7 22.5 21.7 20.6 19.9 19.9 Southeast 12.0 13.0 11.2 13.2 15.3 15.8 17.7 19.2 19.5 Plains 13.3 10.3 8.9 8.3 8.9 7.9 7.6 7.7 7.6 Southwest 3.8 5.7 4.8 5.2 6.6 6.9 7.3 8.0 8.4 Mountain 2.5 2.5 1.9 2.0 2.3 2.3 2.2 2.5 2.6 Far West 5.3" 7.4' 8.8' 9.9' 12.2 14.1 14.7 14.9 14.7
Does not include Alaska or Hawaii.
SOURCE. Harvey S. Perloff, et al, Regions. Resources. and Economic Growth, 1960, p. 223, and the BEA Regional Economic lnformation Systems. Regional Economic Division: 1977, however. 1977 figure reported by Survey of Current Business. August 1978.
I Table 6
I REGIONAL DISTRIBUTION OF MANUFACTURING LABOR FORCE
1 Region 1910 1930 1950 1960 1970 1975
1 United States 100% 100% 100% 100% 100% 100%
New England 13.42 10.48 9.59 8.7 7.5 7.1
Mideast 33.55 30.31 29.1 1 26.7 23.3 20.9
Great Lakes 22.61 25.59 28.94 26.8 26.0 25.2 Southeast 12.69 14.38 15.43 16.6 20.2 21.6 ' Plains 8.35 7.11 5.68 6.0 6.3 6.7
1 Southwest 2.74 4.13 3.28 3.8 5.1 5.8 Mountain 1.64 1.34 .87 1.1 1.3 1.5
1 Far West 5.00 6.66 7.10 10.4 10.6 11.3
/ SOURCE 1910-1950, Harvey S . Perloff, e t a / , Table 102; 1960-77 AClR staff computations from Appendix Table A16.
I Table 7
I REGIONAL DISTRIBUTION OF VALUE ADDED BY MANUFACTURING
I Region 1910 1930 1950 (47) 1958 1966 1973
I United States 100% 100% 100% 100% 100% 100%
New England 14.32 10.35 9.36 7.9 7.1 6.2 Mideast 36.90 33.75 29.87 28.2 24.5 21 .O Great Lakes 25.59 31.63 31.57 30.5 30.1 28.3 Southeast 10.04 9.86 12.49 14.7 15.6 18.7 Plains 6.42 5.74 5.54 6.6 6.2 6.8 Southwest 1.49 2.00 3.00 4.7 4.7 5.7 Mountain 1.21 .95 .88 1.3 1.2 1.4 Far West 4.03 5.72 7.49 11.7 10.7 11.8
SOURCE: 1910-50, Harvey S . Perloff, et al, Regions, Resources and Economic Growth. Table 103; 1958-73, U.S. Bureau of the Census, Census of Manufacturing. 1972, and Annual Survey of Manufacturers, 1973.
Table 8
I REGIONAL DISTRIBUTION OF SERVICES LABOR FORCE I Region 191 0 1930 1950 1960 1970 1976
I United States 100% 100% 100% 100% 100% 100%
New England 8.43 7.44 6.27 7.3 7.2 6.7 Mideast 29.48 29.00 24.63 26.9 25.1 24.9 Great Lakes 20.15 21 .19 18.95 19.1 18.5 18.1 Southeast 16.13 15.45 19.00 16.1 16.8 18.7 Plains 11.84 9.94 8.91 8.0 7.5 5.5 Southwest 4.72 6.1 1 7.89 6.7 7.4 8.1 Mountain 2.48 2.03 2.44 2.3 2.4 2.7 Far West 6.77 8.84 11.91 13.4 15.0 15.3
SOURCE: 1910-50. Harvey S. Perloff, et al, Regions, Resources and Economic Growth. Table 107; 1961-76, Bureau of the Census, U.S. Department of Commerce, Statistical Abstract of the United States.
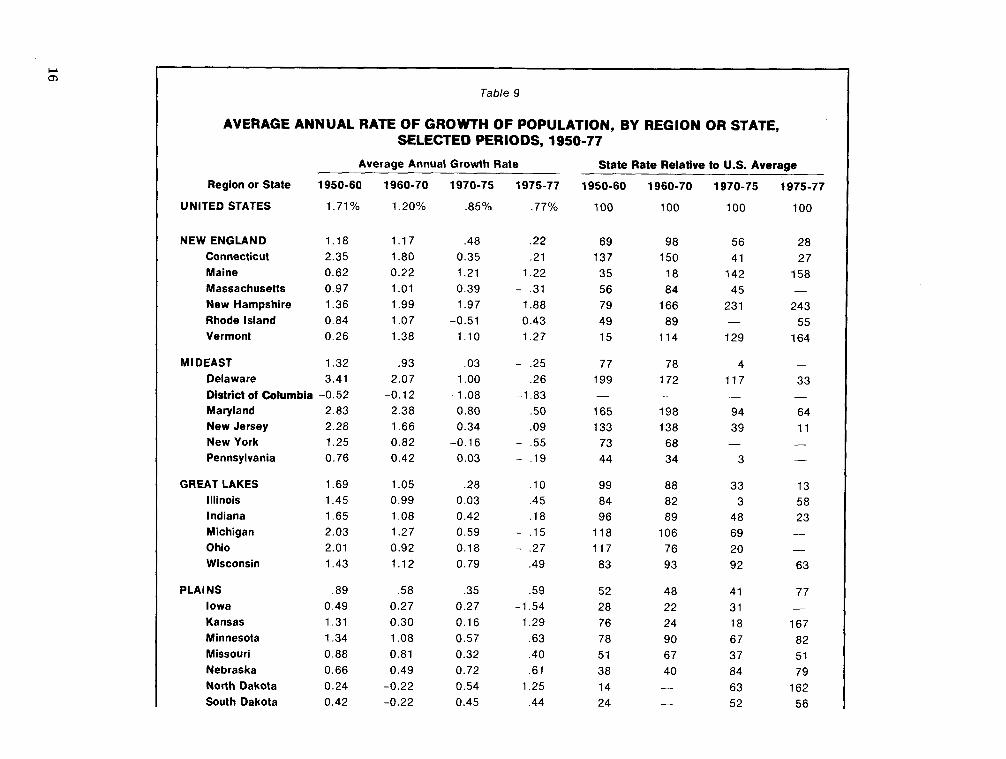
Table 9
AVERAGE ANNUAL RATE OF GROWTH OF POPULATION, BY REGION OR STATE, SELECTED PERIODS, 1950-77
Average Annual Growth Rate
Region or State
UNITED STATES
NEW ENGLAND Connecticut Maine Massachusetts New Hampshire Rhode Island Vermont
MI DEAST Delaware
District of Columbia Maryland New Jersey New York Pennsylvania
GREAT LAKES Illinois Indiana Michigan Ohio Wisconsin
Iowa Kansas Minnesota Missouri Nebraska North Dakota South Dakota
State Rate Relative to U.S. Average

SOUTHEAST Alabama Arkansas Florida Georgia Kentucky Louisiana Mississippi North Carolina South Carolina Tennessee Virginia West Virginia
SOUTHWEST Arizona New Mexico Oklahoma Texas
ROCKY MOUNTAIN Colorado Idaho Montana Utah Wyoming
FAR WEST California Nevada Oregon Washington Alaska Hawaii
SOURCE: AClR staff computations based on data in Appendix Table A6.

Table 10
RATES OF GROWTH OF TOTAL PERSONAL INCOME, BY REGION OR STATE, SELECTED PERIODS, 1950-75
Average Annual Growth Rate State Rate Relative to U.S. Average
Region or State
UNITED STATES
NEW ENGLAND Connecticut Maine Massachusetts New Hampshire Rhode Island Vermont
M l DEAST Delaware District of Columbia Maryland New Jersey New York Pennsylvania
GREAT LAKES Illinois Indiana Michigan Ohio Wisconsin
PLAINS Iowa Kansas Minnesota Missouri Nebraska North Dakota South Dakota
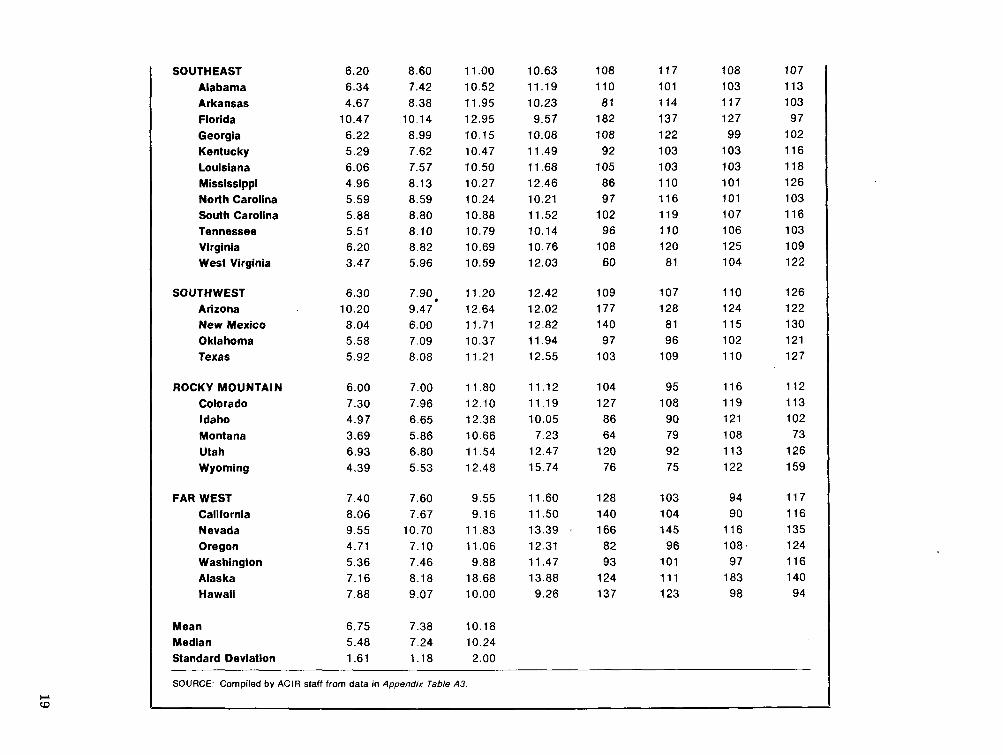
Alabama Arkansas Florida Georgia Kentucky Louisiana Mississippi North Carolina South Carolina Tennessee Virginia West Virginia
SOUTHWEST Arizona New Mexico Oklahoma Texas
ROCKY MOUNTAIN Colorado l daho Montana Utah Wyoming
FAR WEST California Nevada Oregon Washington Alaska Hawaii
Mean Median Standard Deviation
SOURCE: Compiled by AClR staff from data in Appendix Table A3.

Population The population shift away from the older
industrial states to the South and West is not a new phenomenon. Since the turn of the century, the proportion of total U.S. pop- ulation in the New England and Mideast regions has been declining while the propor- tion in the Southwest and Far West has been increasing. Table 4.
In recent years, however, the disparities in population growth have accelerated among the various regions of the country. Between 1960 and 1970 New England's average annual population growth was almost equal to that of the nation; between 1970 and 1975 the re- gion's population growth rate declined to only 56% of the U.S. average. In the Mideast, the average annual rate of population growth was approximately three-fourths of the U.S. average between 1960 and 1970 but only 4% between 1970 and 1975. In the Southeast and Southwest, however, the pattern was re- versed. Between 1960 and 1970 the rate of population growth in the Southeast approx- imated the US. average; in the Southwest it was 28% greater than the U.S. average. Dur- ing the 1970 to 1975 period these rates ac- celerated to 188% and 227% respectively of the U.S. average. Table 9.
Between 1975 and 1977, absolute as well as relative population growth rates accelerated in such energy rich states as Texas, Louis- iana, Oklahoma, Alaska, and West Virginia- each growing at a rate at least 200% of the U.S. average. In the Northeast and Great Lakes regions, six states actually lost popula- tion between 1975 and 1977. The largest de- crease occurred in New York which lost some 198,000 people from 1975 to 1977. The only Northern states to grow faster than the na- tional average over the 1975-1977 period were Maine, New Hampshire, and Vermont.
Personal Income The average annual changes in total per-
sonal income for states and regions indicate a very sharp decline in personal income growth in the Northeast region and states relative to the national average between the decade of the 1960s and the first half of the 1970s4 Table 10. Personal income in New England,
which had grown a t almost the national av- erage in both the 1950s and the 1960s, grew at only 75% of the national average between 1970 and 1975. Similar declines occurred in the Mideast and Great Lakes regions. These differences in growth rates are consistent with acceleration in the relative shift in the share of total personal income away from the Northeast states to the South and West dur- ing the 1970 to 1975 period.
During this period the country experienced two economic recessions which exerted a dis- proportionately adverse effect on personal income growth in the older industrial states of the Northeast and Great Lakes regi0ns.f~ Both 1970 and 1975 represented troughs in personal income. Chart 3. Indeed, the figures for 1975-77, a period of economic recovery, indicate some moderation of this pattern. In both the New England and Great Lakes re- gions the growth rates of personal income have moved much closer to the national av- erage. The Southwest and Far West regions have, however, increased even further their lead over the rest of the nation in personal income g r ~ w t h . ~
Between 1950 and 1975 nine states (Maine, Massachusetts, Rhode Island, New York, Pennsylvania, Illinois, Indiana, Michigan, and Wisconsin) in the Northeast and Mid- west consistently experienced below national average growth in personal i n ~ o m e . ~ Their combined relative share of total personal in- come dropped from 40.4% to 33.3%-a decline of 6.7 percentage points (16.2%). of which New York alone accounted for nearly 40%. Table A6. During the same period, however, ten states in the South and West (Alabama, Florida, Louisiana, South Carolina, Virgin- ia, Arizona, Texas, Colorado, Nevada, and Alaska) consistently grew a t rates above the national average, increasing their combined relative share of total personal income from about 13% to 18%; Florida alone accounted for over 40% of this relative increase.
EMPLOYMENT With few exceptions, total nonagricultural
employment has been increasing in all regions and states, albeit at very different rates. For many decades, the rates of increase in non- agricultural employment in the New Eng-
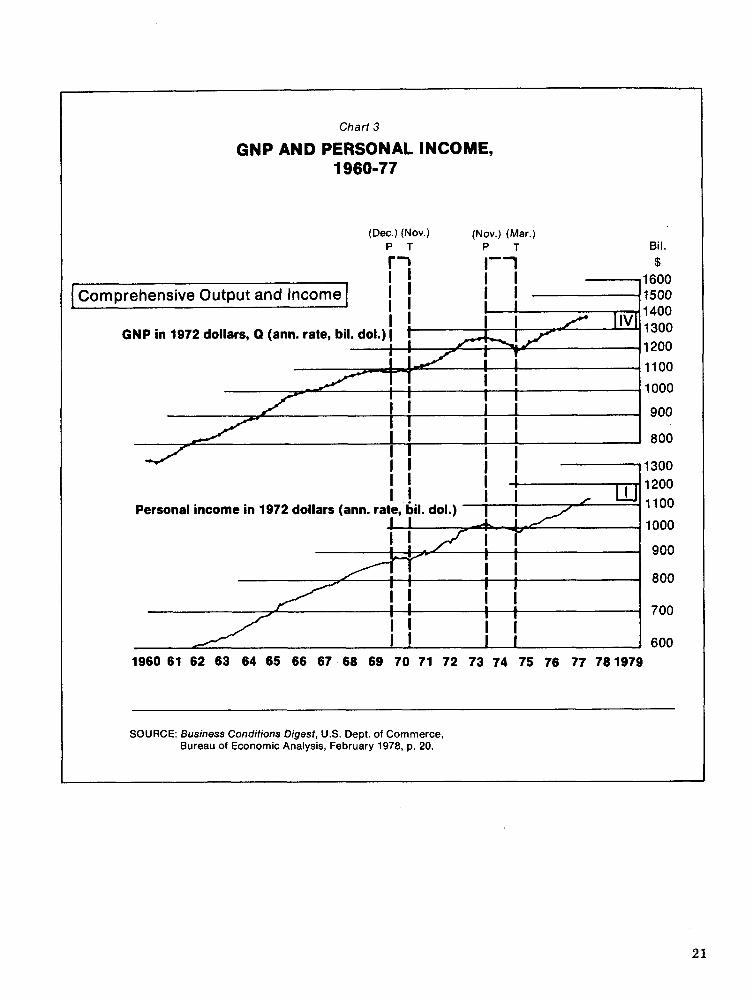
Chart 3
GNP AND PERSONAL INCOME, 1960-77
(Dec ) (Nov.) (Nov.) (Mar.) P T P T Bil.
$
+I600 Comprehensive Output and Income r 1500
1 1400
GNP in 1972 dollars, IiVl 1300
- 1200
1100
1000
900
800 I I I I
I I I I 1 1300
I I I /
1200 I !
Personal income in 1972 dollars (ann. rate, bil. dol.) I I I I,'
a 1100
I I - 1000
i I /?T I I 900
! ! I I
- 800
I I I I
j 700
I I , 600
1960 61 62 63 64 65 66 67 68 69 70 71 72 73 74 75 76 77 78 1979
SOURCE: Business Conditions Digest, US. Dept. of Commerce, Bureau of Economic Analysis, February 1978. p. 20.

Table Table 11
TOTAL NONAGRICULTURAL EMPLOYMENT AS A PERCENT OF U.S. TOTAL, BY REGION,
1950-77
I Region 1950 1960 1970 1975 1977 I New England 7.4% 6.8% 6.4% 6.1% 6.2
Mideast 27.1 25.0 23.0 21.1 17.4 Great Lakes 23.0 21.6 20.6 19.7 20.4 Plains 8.0 7.8 7.6 7.7 7.5 Southeast 16.5 17.7 19.5 20.7 21.9 Southwest 6.0 6.8 7.4 8.3 8.9 RockyMountain 2.0 2.2 2.3 2.7 2.8 Far West 9.7 12.1 13.2 13.8 14.7
I SOURCE: ACIR staff computations baaed on data from Appendix Table A 1 1. I
land, Mideast, and Great Lakes regions have been substantially below those for the U.S. as a whole, whereas the rates of growth in the Southeast, Southwest, Rocky Mountain, and Far West regions have been well above average. Tables 11 and 12. The result of these differences has been that the share of total nonagricultural employment in the three Northeastern regions declined from roughly 58% in 1950 to 44% in 1977.
As was the case with personal income, the
rate of growth in the national economy seems to have a disproportionate effect among the regions. The slower growth rate of the entire U.S. economy between 1970-75 clearly had the greatest adverse effect on employment growth among slow growing regions. In New England the average annual growth rate of nonagricultural employment was 77% that of the U.S. average between 1960 and 1970 but had fallen to only 38% (of a much lower av- erage growth) in the 1970-75 period. Similar patterns were observed in the Mideast and Great Lakes states. In contrast, in the more rapidly growing states, the rates of increase were 1.5 to 2.8 times as great as the national average between 1970 and 1975, compared with 1.1 to 1.3 times as large between 1960 and 1970.
In terms of employment growth, one could make a case (taking only slight license) that the recessions of the 1970s were largely con- fined to the New England, Mideast, and Great Lakes states. Between September 1974, and June 1975, for example, when national nonagricultural employment declined by 2.5%, employment in the Southwest and Rocky Mountain states actually grew and in the Far West the decline was negligible (-0.18%). Table 13.
In the initial state of the recovery, June 1975, to December 1976, employment grew by
Table 12
AVERAGE ANNUAL RATES OF GROWTH OF NONAGRICULTURAL EMPLOYMENT, SELECTED PERIODS, 1950-75
Regional Rate Relative to Region Rate of Growth Growth on U.S. Average
1950-60 1960-70 1970-75 1950-60 1960-70 1970-75
United States New England Mideast Great Lakes Plains Southeast Southwest Rocky Mountain Far West
I SOURCE: AClR staff computations based on data from Appendix Table A12
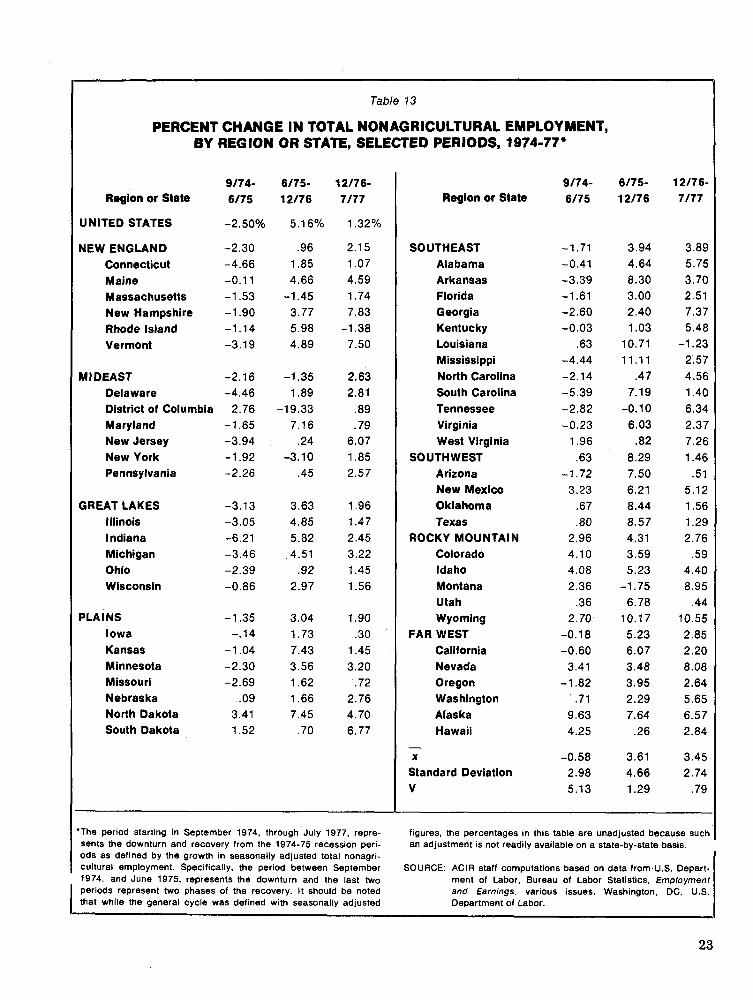
Table 13
PERCENT CHANGE IN TOTAL NONAGRICULTURAL EMPLOYMENT, BY REGION OR STATE, SELECTED PERIODS, 1974-77'
9/74- Region or State 6/75
UNITED STATES -2.50%
NEW ENGLAND -2.30 Connecticut -4.66 Maine -0.11 Massachusetts -1.53 New Hampshire -1.90 Rhode Island -1.14 Vermont -3.19
M l DEAST -2.16 Delaware -4.46 District of Columbia 2.76 Maryland -1.65 New Jersey -3.94 New York -1.92 Pennsylvania -2.26
GREAT LAKES -3.13 Illinois -3.05 l ndiana -6.21 Michigan -3.46 Ohio -2.39 Wisconsin -0.86
PLAINS Iowa Kansas Minnesota Missouri Nebraska North Dakota South Dakota
-- -
The period starting in September 1974, through July 1977, repre- sents the downturn and recovery from the 1974-75 recession peri- ods as defined by the growth in seasonally adjusted total nonagri- cultural employment. Specifically, the period between September 1974, and June 1975. represents the downturn and the last two
I periods represent two phases of the recovery. It should be noted that while the general cycle was defined with seasonally adjusted
Region or State
SOUTHEAST Alabama Arkansas Florida Georgia Kentucky Louisiana Mississippi North Carolina South Carolina Tennessee Virginia West Virginia
SOUTHWEST Arizona New Mexico Oklahoma Texas
ROCKY MOUNTAIN Colorado Idaho Montana Utah Wyoming
FAR WEST California Nevada Oregon Washington Alaska Hawaii
- X
Standard Deviation v
an adjustment is not readily available on a state-by-state basis.
SOURCE: AClR staff computations based on data from U.S. Depart- ment of Labor. Bureau of Labor Statistics. Employment and Earnings. various issues. Washington. DC. U.S. Department of Labor.
figures, the percentages in this table are unadjusted because such
5.16% for the nation. Employment continued to decline in the Mideast states, however, and grew by less than 1% in New England.
Since December 1976, the benefits of the recovery have been far more evenly dispersed. Indeed, the growth rate in nonagricultural employment in the Mideast states has ex- ceeded that in the Southwest and is about the same as that in the Rocky Mountain and Far West states.
In general, the regional rates of total per- sonal income and employment growth in the decade of the '60s were much more similar than they had been during the '50s and than they have been recently. Overall, the evidence is ambiguous, pointing to greater conver- gence-when the '50s and '60s are com- pared-and greater divergence-when the '60s and first half of the '70s are compared.
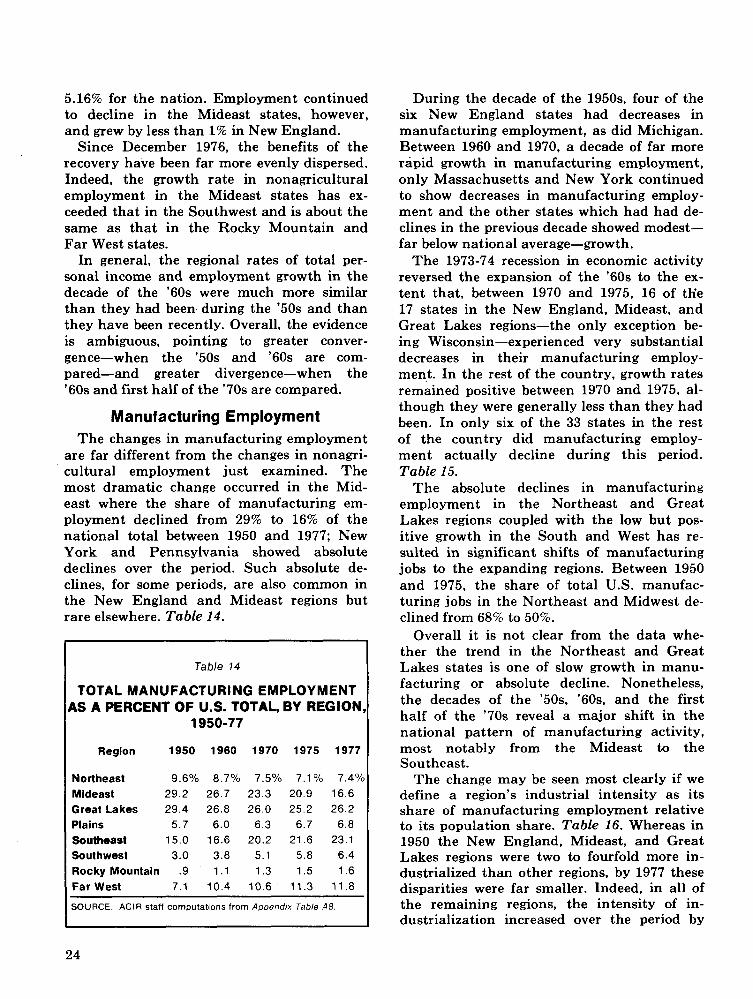
Manufacturing Employment The changes in manufacturing employment
are far different from the changes in nonagri- cultural employment just examined. The most dramatic change occurred in the Mid- east where the share of manufacturing em- ployment declined from 29% to 16% of the national total between 1950 and 1977; New York and Pennsylvania showed absolute declines over the period. Such absolute de- clines, for some periods, are also common in the New England and Mideast regions but rare elsewhere. Table 14.
Table 74
TOTAL MANUFACTURING EMPLOYMENT 4s A PERCENT OF U.S. TOTAL, BY REGION
1950-77
Region 1950 1960 1970 1975 1977
Northeast Mideast Great Lakes Plains Southeast Southwest Rocky Mountain Far West -- -
SOURCE AClR staff computations from Append~x Table A8 I
During the decade of the 1950s. four of the six New England states had decreases in manufacturing employment, as did Michigan. Between 1960 and 1970, a decade of far more rapid growth in manufacturing employment, only Massachusetts and New York continued to show decreases in manufacturing employ- ment and the other states which had had de- clines in the previous decade showed modest- far below national average-growth.
The 1973-74 recession in economic activity reversed the expansion of the '60s to the ex- tent that, between 1970 and 1975, 16 of tfie 17 states in the New England, Mideast, and Great Lakes regions-the only exception be- ing Wisconsin-experienced very substantial decreases in their manufacturing employ- ment. In the rest of the country, growth rates remained positive between 1970 and 1975, al- though they were generally less than they had been. In only six of the 33 states in the rest of the country did manufacturing employ- ment actually decline during this period. Table 15.
The absolute declines in manufacturing employment in the Northeast and Great Lakes regions coupled with the low but pos- itive growth in the South and West has re- sulted in significant shifts of manufacturing jobs to the expanding regions. Between 1950 and 1975, the share of total US. manufac- turing jobs in the Northeast and Midwest de- clined from 68% to 50%.
Overall it is not clear from the data whe- ther the trend in the Northeast and Great Lakes states is one of slow growth in manu- facturing or absolute decline. Nonetheless, the decades of the '50s. '60s. and the first half of the '70s reveal a major shift in the national pattern of manufacturing activity, most notably from the Mideast to the Southeast.
The change may be seen most clearly if we define a region's industrial intensity as its share of manufacturing employment relative to its population share. Table 16. Whereas in 1950 the New England, Mideast, and Great Lakes regions were two to fourfold more in- dustrialized than other regions, by 1977 these disparities were far smaller. Indeed, in all of the remaining regions, the intensity of in- dustrialization increased over the period by

Table 15
AVERAGE ANNUAL RATE OF GROWTH IN MANUFACTURING EMPLOYMENT, BY REGION OR STATE, SELECTED PERIODS, 1950-75
1950- 1960- 1970- Region or State 60 70 7 5
UNITED STATES .88% 1.43% -0.99%
NEW ENGLAND -0.06 .01 -2.10 Connecticut .70 .86 -2.95 Maine -0.42 .55 -2.96 Massachusetts -0.25 -0.74 -1.77
New Hampshire .96 .54 -1.30 Rhode Island -2.10 .10 -1.00 Vermont -0.44 1.38 -0.75
M l DEAST .01 .02 -3.05 Delaware 1.37 1.93 -1.51 District of Columbia .51 -0.82 -2.97 Maryland 1.10 .42 -2.82 New Jersey .67 .65 -3.29 New York -0.20 -0.65 -3.70 Pennsylvania -0.28 .57 -2.39
GREAT LAKES .01 1.08 -1.59 Illinois .10 1.04 -1.86 i ndiana .24 1.80 -1.76 Michigan -0.94 1.03 -1.53 Ohio .35 1.09 -2.02 Wisconsin .58 .85 .28
PLAl NS 1.33 2.01 .25 Iowa 1.35 2.01 1.75 Kansas 1.99 1.49 3.53 Minnesota 1.36 3.35 10 Missouri 1 .05 1.28 -1.82 Nebraska 2.52 2.44 .23 North Dakota .64 4.30 8.67 South Dakota 1.22 1.89 4.83
SOURCE: Compiled by AClR staff from data in Appendix Table A9
1950- 1960- 1970- Region or State 60 7 0 75
SOUTHEAST Alabama Arkansas Florida Georgia Kentucky Louisiana Mississippi North Carolina South Carolina Tennessee Virginia West Virginia
SOUTHWEST Arizona New Mexico Oklahoma Texas
ROCKY MOUNTAl N Colorado Idaho Montana Utah Wyoming
FAR WEST California Nevada Oregon Washington Alaska Hawaii
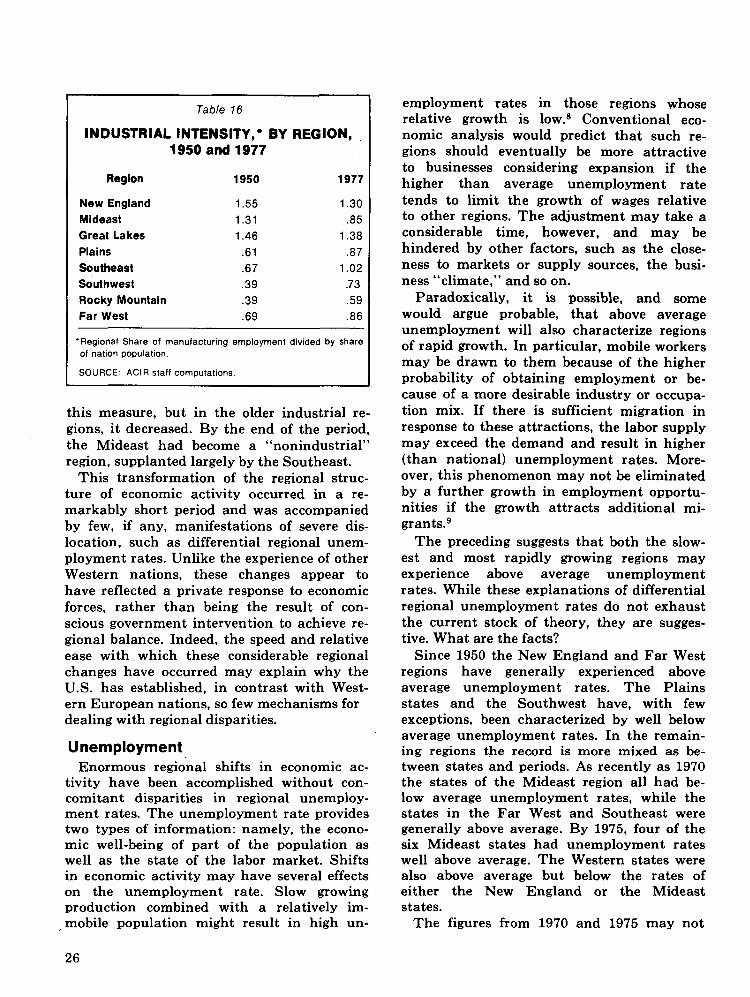
Table 16
INDUSTRIAL INTENSITY,' BY REGION, 1950and1977
Region 1950 1977
New England 1.55 1.30 Mideast 1.31 .85 Great Lakes 1.46 1.38 Plains .61 .87 Southeast .67 1.02 Southwest .39 .73 Rocky Mountain .39 .59 Far West .69 .86
'Reg~onal Share of manufacturing employment divided by share of nation population.
SOURCE: ACI R staff computations.
this measure, but in the older industrial re- gions, it decreased. By the end of the period, the Mideast had become a "nonindustrial" region, supplanted largely by the Southeast.
This transformation of the regional struc- ture of economic activity occurred in a re- markably short period and was accompanied by few, if any, manifestations of severe dis- location, such as differential regional unem- ployment rates. Unlike the experience of other Western nations, these changes appear to have reflected a private response to economic forces, rather than being the result of con- scious government intervention to achieve re- gional balance. Indeed, the speed and relative ease with which these considerable regional changes have occurred may explain why the U.S. has established, in contrast with West- ern European nations, so few mechanisms for dealing with regional disparities.
Unemployment Enormous regional shifts in economic ac-
tivity have been accomplished without con- comitant disparities in regional unemploy- ment rates. The unemployment rate provides two types of information: namely, the econo- mic well-being of part of the population as well as the state of the labor market. Shifts in economic activity may have several effects on the unemployment rate. Slow growing production combined with a relatively im- mobile population might result in high un-
employment rates in those regions whose relative growth is low.8 Conventional eco- nomic analysis would predict that such re- gions should eventually be more attractive to businesses considering expansion if the higher than average unemployment rate tends to limit the growth of wages relative to other regions. The adjustment may take a considerable time, however, and may be hindered by other factors, such as the close- ness to markets or supply sources, the busi- ness "climate," and so on.
Paradoxically, it is possible, and some would argue probable, that above average unemployment will also characterize regions of rapid growth. In particular, mobile workers may be drawn to them because of the higher probability of obtaining employment or be- cause of a more desirable industry or occupa- tion mix. If there is sufficient migration in response to these attractions, the labor supply may exceed the demand and result in higher (than national) unemployment rates. More- over, this phenomenon may not be eliminated by a further growth in employment opportu- nities if the growth attracts additional mi- g r a n t ~ . ~
The preceding suggests that both the slow- est and most rapidly growing regions may experience above average unemployment rates. While these explanations of differential regional unemployment rates do not exhaust the current stock of theory, they are sugges- tive. What are the facts?
Since 1950 the New England and Far West regions have generally experienced above average unemployment rates. The Plains states and the Southwest have, with few exceptions, been characterized by well below average unemployment rates. In the remain- ing regions the record is more mixed as be- tween states and periods. As recently as 1970 the states of the Mideast region all had be- low average unemployment rates, while the states in the Far West and Southeast were generally above average. By 1975, four of the six Mideast states had unemployment rates well above average. The Western states were also above average but below the rates of either the New England or the Mideast states.
The figures from 1970 and 1975 may not
represent " t rend values since the 1970 data reflect the cutbacks in defense procurement for the Vietnam War in the Western states and 1975 figures are associated with the gen- eral recession in the economy. Support for the assertion that "unemployment (in the North- east) has become fixed a t a higher rate than the national average,"1° is not unambiguous. Higher than average unemployment rates also have characterized most of the South- eastern and Far Western states since 1970. These may be cyclical phenomena. They are consistent, however, with the two behavioral models outlined at the beginning of this sec- tion, namely, relative immobility among the populace of declining areas, as well as the attraction of rapidly growing regions to some members of the labor force, leading to immi- gration of greater numbers of workers than can be absorbed even in rapidly growing re- gions. Table 17, pg. 28.
FOOTNOTES
'A recent evaluation of the available data on cost-of- living differences, conducted by the Poverty Studies Task Force, The Measure of Poverty: A Report to Con- gress as Mandated by the Education Amendment of 1974, Washington, DC, U.S. Department of Health, Education, and Welfare, April 1976, pp. 82, 86. and 90, concludes that:
(1) . . . although there may be goegraphical dif- ferences in cost-of-living, there is no known way to make satisfactory geographic adjust- ments.
(2) Evidence of geographic differences in living costs is sketchy and inconsistent.. . . The most prominently mentioned source of data is the Bureau of Labor Statistics' Family Budgets (published quarterly for 44 urban areas for two prototypical families and three levels of living). . . . These budgets have certain limitations which preclude their use as accurate measures of cost-of-living differences.
In addition, it was also noted that despite observation that living costs appear to be lower in the Southern states. these differences may stem from different in- come and expenditure patterns rather than prices. In- come levels are generally lower and poverty rates higher in the South than elsewhere. I t should be added that differences in living costs between cities within a region, even within the same state, are frequently quite signifi- cant.
2The extremely high per capita incomes in the Far West and Rocky Mountain states at the turn of the
At the metropolitan, rather than the re- gional level, both the immobility and inmi- gration models received limited support in a recent study that examined the association between unemployment rates and local em- ployment growth in the period between 1967 and 1974. In the 26 metropolitan areas with manufacturing employment growth greater than lo%, half had unemployment rates above 4% (average 5.5%). In the declining or stagnating SMSAs, somewhat less than half had high unemployment rates (average 5.10%) and the remainder had relatively low unemployment rates (average 3.2%). The con- clusion is that there is very little relationship between overall rates of growth in manu- facturing employment in an SMSA and the unemployment rate." This still leaves the possibility that unemployment rates are as- sociated with the overall rate of job creation not simply manufacturing.
century undoubtedly reflect the unusually distorted price structure in those relatively isolated regions a t time.
31n this section and throughout the remainder of the study it is assumed that regional income levels and in- come per capita largely reflect the level of regional pro- duction. This assumption is most accurate for wage recipients but is less precise for non wage income such as dividends, interest, and rents, which can, of course, be earned on investments in other regions. Even wage income may be tied to activity in other regions. No in- formation is available to relate regional measure of income originating (value added) to regional household incomes (personal income). Various versions of both are used interchangeably, although it is recognized that some, probably small, misestimates may be made.
4Note, however, absolute rates of growth were in fact higher in 1970-75 compared with 1960-70. This is due largely to the higher rate of inflation.
5This is discussed further in Chapter IV. 6Note this does not imply that the same holds for the level of per capita income.
71n this paragraph "consistently" refers to those states which experienced either below or above average growth in personal income for each of the periods 1950-60. 1960-70, and 1970-75.
8Earlier we noted that propulation shifts have been con- siderably smaller than shifts in economic activity.
gFor a formal model of the process see M. P. Todaro, "A Model of Labor Migration and Urban Unemployment," American Economic Review, Menasha, WI, George Banta Co., Inc.. Vol. 69, 1969. Empirical evidence on migration is given in J. R. Pack, "Determinants of Migration to Central Cities," Journal of Regional Sci- ence, Philadelphia. PA. Regional Science Institute, Vol. 13, No. 3, August 1973, and in Michael J. Green- wood, "Research on Internal Migration in the United

Table 7 7
UNEMPLOYMENT RATE, BY REGION OR STATE, 1950-75 Unemployment Rates Relative To
Unemployment Rates U.S. Average
Region or State 1950 1960 1970 1975 1950 1960 1970 1975
UNITED STATES 4.8 5.5 4.9 8.5 100 100 100 100
NEW ENGLAND 6.6 5.7 4.9 9.2 138 104 100 108 Connecticut 5.4 5.6 5.6 10.1 112 101 114 118 Maine 8.8 7.4 5.7 10.2 183 134 116 119 Massachusetts 5.8 5.1 4.6 12.5 120 92 93 147 New Hampshire 6.6 4.1 3.3 6.9 137 74 6 7 8 1 Rhode Island 7.2 6.7 5.2 14.6 149 121 106 171 Vermont 5.5 5.4 4.9 10.0 114 98 100 1 1 7
M l DEAST 4.7 5.5 4.1 9.0 98 100 84 106 Delaware 3.1 4.2 4.8 9.3 64 76 97 109 District of Columbia 3.9 2.6 3.1 8.1 8 1 47 63 9 5 Maryland 4.6 5.6 3.3 7.5 9 5 101 67 88 New Jersey 5.1 6.7 4.6 10.2 106 121 93 119. New York 6.0 5.6 4.5 10.1 124 101 91 118 Pennsylvania 5.4 8.0 4.5 8.9 112 145 91 104
GREAT LAKES Illinois Indiana Michigan Ohio Wisconsin
PLAINS Iowa Kansas Minnesota Missouri Nebraska North Dakota South Dakota
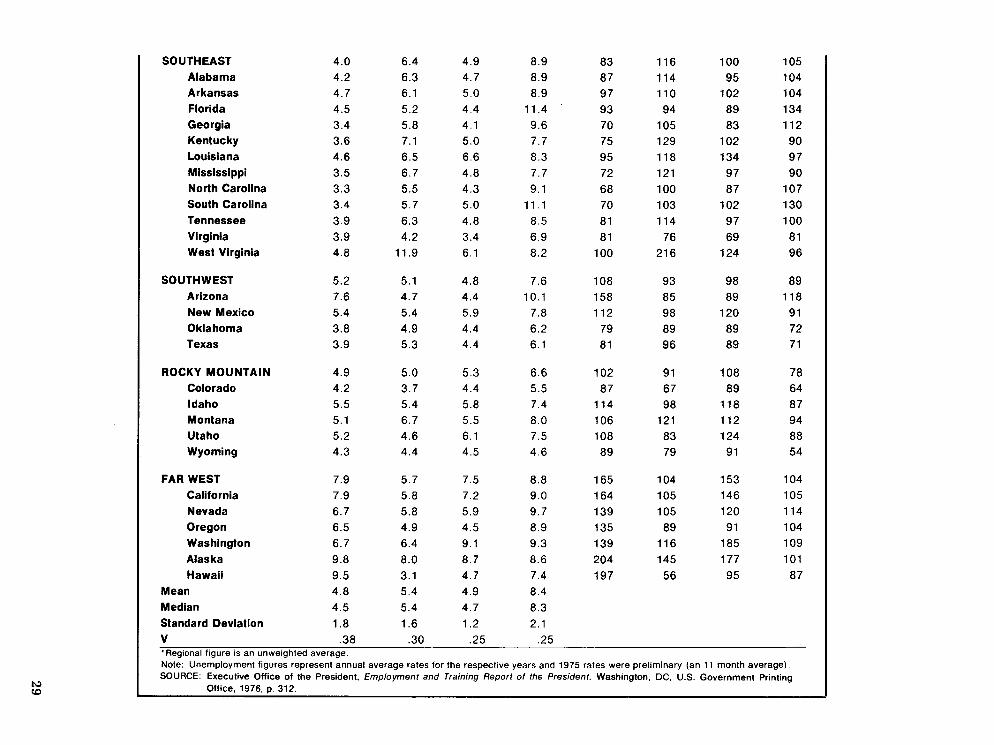
Alabama Arkansas Florida Georgia Kentucky Louisiana Mississippi North Carolina South Carolina Tennessee Virginia West Virginia
SOUTHWEST Arizona New Mexico Oklahoma Texas
ROCKY MOUNTAIN Colorado l daho Montana Utaho Wyoming
FAR WEST California Nevada Oregon Washington Alaska Hawaii
Mean Median Standard Deviation v 'Regional figure is an unweighted average. Note: Unemployment figures represent annual average rates for the respective years and 1975 rates were preliminary (an 11 month average). SOURCE: Executive Office of the President. Employment and Training Report of the President. Washington, DC, US. Government Printing
Office. 1976, p. 312.

States: A Survey," Journal o f Economic Literature, Vol. 2 , No. 9. October-November 1976. Nashville, TN, American Economic Association, Vol. "William C. Wheaton, "Area Wages, Unemployment, 13, June 1975. and Interregional Factor Mobility," paper prepared for
1°"The Future of the Northeast," Empire State Report, the Spring Conference of the Committee on Urban Pub- New York, NY, New York State Legislative Institute, lic Economics. May 5-6. 1978.
Chapter III
Determinants of Regional Shifts*
M uch of the discussion of differences in regional economies, particularly in their
growth rates, is embedded in economic matu- rity or life cycle concepts. The recurrent references to the "older" economies of the Northeast and Midwest as contrasted with the "newer" or "younger" economies of the West, Southwest, and more recently, the Southeast are reflections of these notions.
ECONOMIC MATURITY OR LIFE CYCLE MODELS
Maturity is seldom defined, although there are two characteristics implicit in the discus- sion: (1) chronological economic age, ex., years since manufacturing employment be- came important in the region, and (2) a per- formance criterion, e.g., relatively low rates of economic growth. This second is largely an outgrowth of the awareness that over time the growth rates of countries slow so that more mature economies are characterized by slower growth rates, newly emerging econo- mies by higher growth rates.' This latter criterion was employed by Borts and Stein in defining mature states: They looked at the growth rates of manufacturing employment in the state relative to that of the nation and defined as mature those which had persistent- ly grown more slowly.*
*N.B.-It should be noted that in this chapter the names and composition of the various regions of the country are those of the authors cited and do not agree in every instance with the regional breakdown and names used by ACIR in this volume.

What produces a mature economy, is it inevitable, what are its characteristics?
On the supply or capacity side of the econo- my, its supply of labor (its quantity and quality) and the availability of capital, the two primary inputs, together with the state of technology, will determine the output ca- pacity of the region. Changes in technology which favor the region, which make existing supplies of labor and capital more productive, will increase its productive capacity. Differ- ences in regional growth rates of total factor productivity may occur insofar as regions inevitably specialize in some sectors and the rate of technical progress differs among sec- tors.3 More broadly, innovation which results in new products is also likely to result in ad- vantages in specific regions. Yet, the factors resulting in the establishment of manufac- turing facilities for entirely new product lines in particular regions sometimes defy system- atic explanation (e.g., semiconductors in the Southwest and California).
On the demand side, there are three prin- cipal factors which influence the demand for the region's output: the direct demand stem- ming from its local population, the inter- mediate demands of its own industry and government, and demands from outside the region. Growth in national income will dif- ferentially affect the growth in regional de- mand depending upon the income elasticity of demand for the region's products.
I t might be supposed that as a regional economy matures it ultimately encounters obstacles in its capacity to produce output and to find new markets. The maturity pro- cess or life cycle posits as initial development of new industries; over time they take up space, use capital, and employ labor. They expand and ultimately mature, that is stop expanding, grow slowly, or perhaps decline. Plants become obsolete (i.e., their products can be produced more cheaply with newer technology), perhaps even labor in the region becomes characterized by relatively obsolete skills. If we assume that technological change is more rapid in newer sectors and the supply of land available in a region is limited, then aging would be associated with increasing densities of activity, perhaps reaching capac- ity limits and going beyond to congestion.
This would stimulate dispersion of activity to relatively less crowded regions-less mature economies. The aging of the capital stock-in physical and technological terms-would in- crease unit production costs relative to the cost of new plants. Development of new prod- uct lines may intensify the dispersion, espe- cially if economically attractive space is a limiting factor in the older economy.
On the demand side, the older region may be characterized by products with low income elasticity of demand and a slower sales growth to external (other regions') purchasers, perhaps reinforced by a population decline and its direct demands. The aggregate result is deaths of firms, slow growth, and perhaps relocation of firms.
In sum, the slow growth of a region relative to the national economy must be explained by a decline in quantity or quality of the labor force and capital stock over time, or changes in technology which favor less devel- oped regions, and/or a relative decline in the demand for its output over time. All other things considered, there is probably a set of factors internal to the region which, left to themselves, combine to produce a process that can be described as the aging or maturing of the regional economy.
In the earlier section on regional economic trends, it was shown that the older industrial regions of the nation are experiencing, and have for many years, generally lower employ- ment and income growth rates than the younger more recently industrializing regions. We now attempt to assess the origins and im- portance of contributors to this pattern. Most research on this has concentrated on the demand side and our discussion will reflect this. Nevertheless, as suggested above, supply side features may well be as important.
The Demand Side Estimates have been made of the extent to
which national demand changes may have been responsible for the differential fortunes of the nation's regions. The question usually posed is whether the sectoral employment distribution of the older regions is dispropor- tionately concentrated in industrial sectors which are growing more slowly than the national average. The effect of sectoral struc- ture has been investigated through compari-
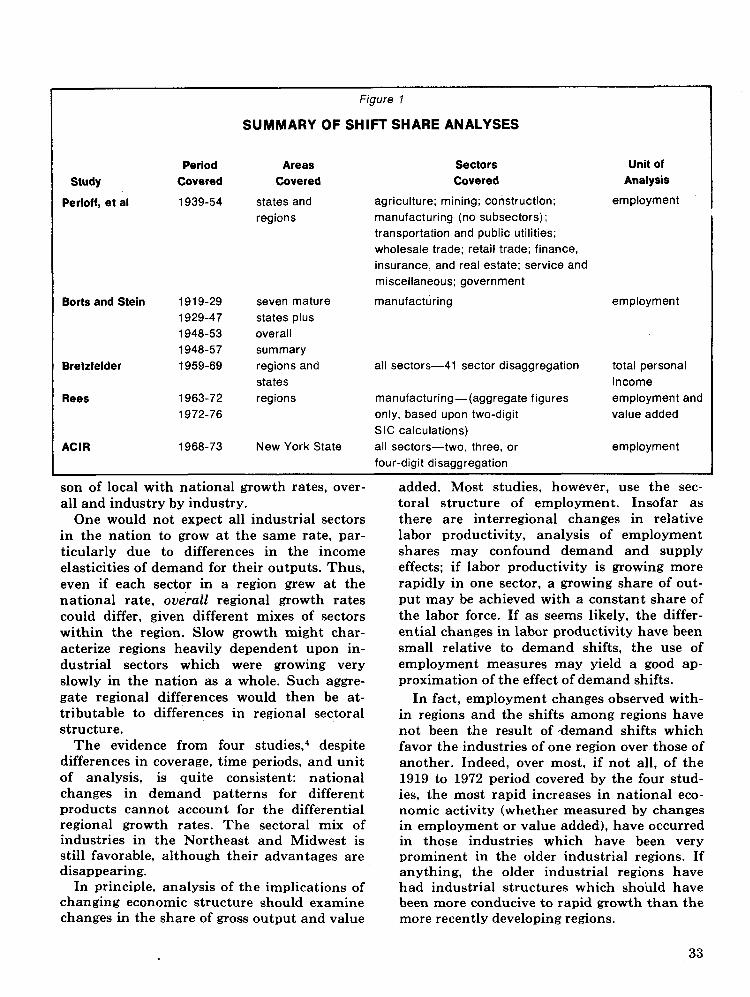
Figure 1
SUMMARY OF SHIFT SHARE ANALYSES
Period Areas Study Covered Covered
Perloff, et a1 1939-54 states and regions
Borts and Stein 191 9-29 1929-47 1948-53 1948-57
Bretzfelder 1959-69
Rees
AClR 1968-73
seven mature states plus overall summary regions and states regions
New York State
Sectors Covered
agriculture; mining; construction; manufacturing (no subsectors); transportation and public utilities; wholesale trade; retail trade; finance, insurance, and real estate; service and miscellaneous; government
manufacturing
all sectors-41 sector disaggregation
manufacturing-(aggregate figures only, based upon two-digit SIC calculations) all sectors-two, three, or four-digit disaggregation
Unit of Analysis
employment
employment
total personal income employment and value added
employment
son of local with national growth rates, over- all and industry by industry.
One would not expect all industrial sectors in the nation to grow at the same rate, par- ticularly due to differences in the income elasticities of demand for their outputs. Thus, even if each sector in a region grew at the national rate, overall regional growth rates could differ, given different mixes of sectors within the region. Slow growth might char- acterize regions heavily dependent upon in- dustrial sectors which were growing very slowly in the nation as a whole. Such aggre- gate regional differences would then be at- tributable to differences in regional sectoral structure.
The evidence from four ~ t u d i e s , ~ despite differences in coverage, time periods, and unit of analysis, is quite consistent: national changes in demand patterns for different products cannot account for the differential regional growth rates. The sectoral mix of industries in the Northeast and Midwest is still favorable, although their advantages are disappearing.
In principle, analysis of the implications of changing economic structure should examine changes in the share of gross output and value
added. Most studies, however, use the sec- toral structure of employment. Insofar as there are interregional changes in relative labor productivity, analysis of employment shares may confound demand and supply effects; if labor productivity is growing more rapidly in one sector, a growing share of out- put may be achieved with a constant share of the labor force. If as seems likely, the differ- ential changes in labor productivity have been small relative to demand shifts, the use of employment measures may yield a good ap- proximation of the effect of demand shifts.
In fact, employment changes observed with- in regions and the shifts among regions have not been the result of -demand shifts which favor the industries of one region over those of another. Indeed, over most, if not all, of the 1919 to 1972 period covered by the four stud- ies, the most rapid increases in national eco- nomic activity (whether measured by changes in employment or value added), have occurred in those industries which have been very prominent in the older industrial regions. If anything, the older industrial regions have had industrial structures which should have been more conducive to rapid growth than the more recently developing regions.
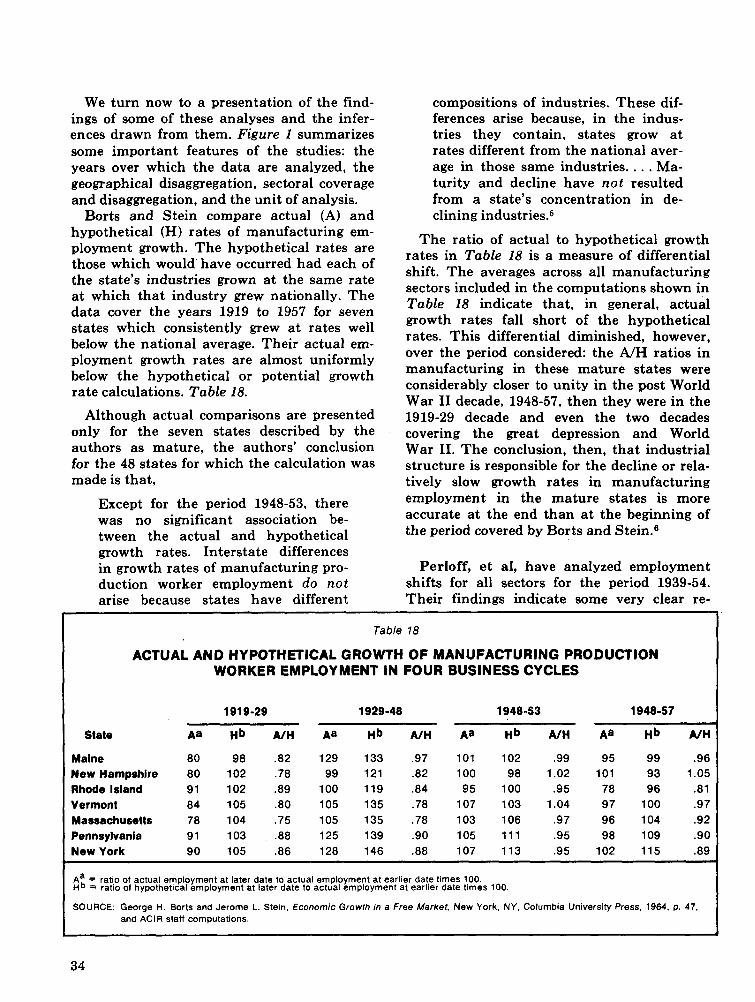
We turn now to a presentation of the find- ings of some of these analyses and the infer- ences drawn from them. Figure 1 summarizes some important features of the studies: the years over which the data are analyzed, the geographical disaggregation, sectoral coverage and disaggregation, and the unit of analysis.
Borts and Stein compare actual (A) and hypothetical (H) rates of manufacturing em- ployment growth. The hypothetical rates are those which would have occurred had each of the state's industries grown at the same rate at which that industry grew nationally. The data cover the years 1919 to 1957 for seven states which consistently grew at rates well below the national average. Their actual em- ployment growth rates are almost uniformly below the hypothetical or potential growth rate calculations. Table 18.
Although actual comparisons are presented only for the seven states described by the authors as mature, the authors' conclusion for the 48 states for which the calculation was made is that,
Except for the period 1948-53, there was no significant association be- tween the actual and hypothetical growth rates. Interstate differences in growth rates of manufacturing pro- duction worker employment do not arise because states have different
compositions of industries. These dif- ferences arise because, in the indus- tries they contain, states grow at rates different from the national aver- age in those same industries. . . . Ma- turity and decline have not resulted from a state's concentration in de- clining industries.5
The ratio of actual to hypothetical growth rates in Table 18 is a measure of differential shift. The averages across all manufacturing sectors included in the computations shown in Table 18 indicate that, in general, actual growth rates fall short of the hypothetical rates. This differential diminished, however, over the period considered: the A/H ratios in manufacturing in these mature states were considerably closer to unity in the post World War I1 decade, 1948-57, then they were in the 1919-29 decade and even the two decades covering the great depression and World War 11. The conclusion, then, that industrial structure is responsible for the decline or rela- tively slow growth rates in manufacturing employment in the mature states is more accurate at the end than at the beginning of the period covered by Borts and Stein.6
Perloff, et al, have analyzed employment shifts for all sectors for the period 1939-54. Their findings indicate some very clear re-
Table 18
ACTUAL AND HYPOTHETICAL GROWTH OF MANUFACTURING PRODUCTION WORKER EMPLOYMENT IN FOUR BUSINESS CYCLES
I 191 9-29 1929-48 1948-53 1948-57
State Aa Hb A/H Aa Hb A/H Aa Hb A/H Aa Hb A/H
Maine 80 98 .82 129 133 .97 101 102 .99 95 99 .96 New Hampshire 80 102 .78 99 121 .82 100 98 1.02 101 93 1.05 Rhode Island 91 102 .89 100 119 .84 95 100 .95 78 96 .81 Vermont 84 105 .80 105 135 .78 107 103 1.04 97 100 .97 Massachusetts 78 104 .75 105 135 .78 103 106 .97 96 104 .92 Pennsylvania 91 103 .88 125 139 .90 105 1 1 1 .95 98 109 .90 New York 90 105 .86 128 146 .88 107 113 .95 102 115 .89
I = ratio of actual employment at later date to actual employment at earlier date times 100. Hb = ratio of hypothetical employment at later date to actual employment at earlier date times 100.
I SOURCE: George H. Borts and Jerome L. Stein, Economic Growth in a Free Markef, New York. NY. Columbia University Press. 1964, p. 47. and AClR staff computations.
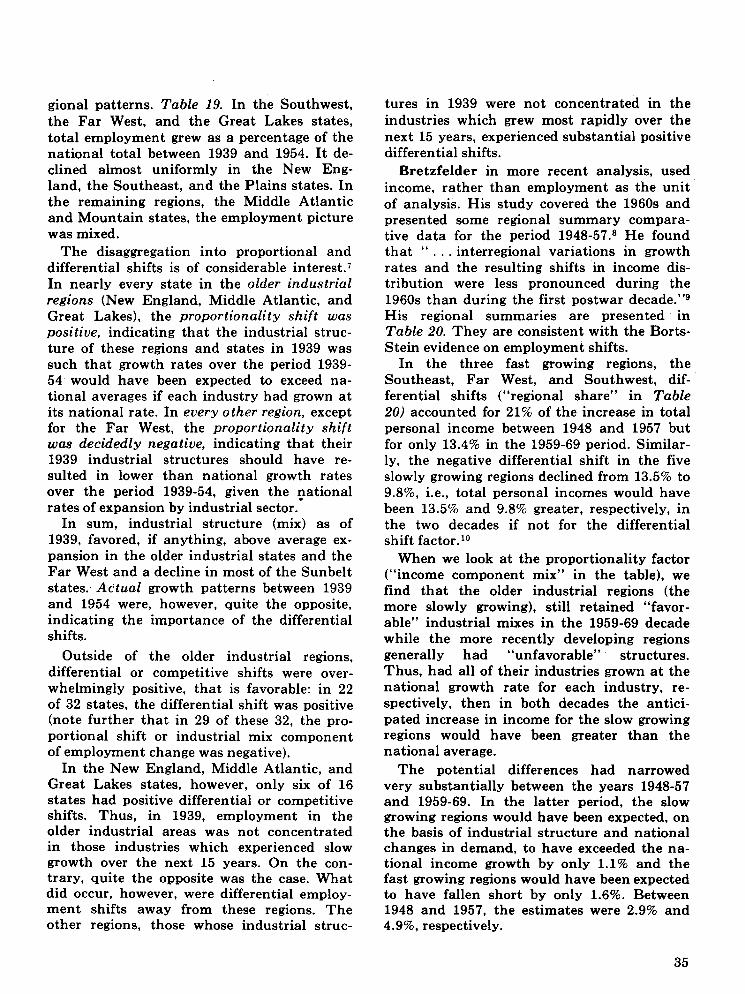
gional patterns. Table 19. In the Southwest, the Far West, and the Great Lakes states, total employment grew as a percentage of the national total between 1939 and 1954. I t de- clined almost uniformly in the New Eng- land, the Southeast, and the Plains states. In the remaining regions, the Middle Atlantic and Mountain states, the employment picture was mixed.
The disaggregation into proportional and differential shifts is of considerable i n t e r e~ t .~ In nearly every state in the older industrial regions (New England, Middle Atlantic, and Great Lakes), the proportionality shift was positive, indicating that the industrial struc- ture of these regions and states in 1939 was such that growth rates over the period 1939- 54 would have been expected to exceed na- tional averages if each industry had grown at its national rate. In every other region, except for the Far West, the proportionality shift was decidedly negative, indicating that their 1939 industrial structures should have re- sulted in lower than national growth rates over the period 1939-54, given the ~a t i ona l rates of expansion by industrial sector.
In sum, industrial structure (mix) as of 1939, favored, if anything, above average ex- pansion in the older industrial states and the Far West and a decline in most of the Sunbelt states. Actual growth patterns between 1939 and 1954 were, however, quite the opposite, indicating the importance of the differential shifts.
Outside of the older industrial regions, differential or competitive shifts were over- whelmingly positive, that is favorable: in 22 of 32 states, the differential shift was positive (note further that in 29 of these 32, the pro- portional shift or industrial mix component of employment change was negative).
In the New England, Middle Atlantic, and Great Lakes states, however, only six of 16 states had positive differential or competitive shifts. Thus, in 1939, employment in the older industrial areas was not concentrated in those industries which experienced slow growth over the next 15 years. On the con- trary, quite the opposite was the case. What did occur, however, were differential employ- ment shifts away from these regions. The other regions, those whose industrial struc-
tures in 1939 were not concentrated in the industries which grew most rapidly over the next 15 years, experienced substantial positive differential shifts.
Bretzfelder in more recent analysis, used income, rather than employment as the unit of analysis. His study covered the 1960s and presented some regional summary compara- tive data for the period 1948-57.8 He found that " . . . interregional variations in growth rates and the resulting shifts in income dis- tribution were less pronounced during the 1960s than during the first postwar de~ade."~ His regional summaries are presented in Table 20. They are consistent with the Borts- Stein evidence on employment shifts.
In the three fast growing regions, the Southeast, Far West, and Southwest, dif- ferential shifts ("regional share" in Table 20) accounted for 21% of the increase in total personal income between 1948 and 1957 but for only 13.4% in the 1959-69 period. Similar- ly, the negative differential shift in the five slowly growing regions declined from 13.5% to 9.8%, i.e., total personal incomes would have been 13.5% and 9.8% greater, respectively, in the two decades if not for the differential shift factor.1°
When we look at the proportionality factor ("income component mix" in the table), we find that the older industrial regions (the more slowly growing), still retained "favor- able" industrial mixes in the 1959-69 decade while the more recently developing regions generally had "unfavorable" structures. Thus, had all of their industries grown a t the national growth rate for each industry, re- spectively, then in both decades the antici- pated increase in income for the slow growing regions would have been greater than the national average.
The potential differences had narrowed very substantially between the years 1948-57 and 1959-69. In the latter period, the slow growing regions would have been expected, on the basis of industrial structure and national changes in demand, to have exceeded the na- tional income growth by only 1.1% and the fast growing regions would have been expected to have fallen short by only 1.6%. Between 1948 and 1957, the estimates were 2.9% and 4.9%, respectively.

Table 19 STATE TOTAL, DIFFERENTIAL, AND PROPORTIONALITY NET SHIFTS IN EMPLOYMENT
AND THE INDUSTRY COMPONENTS OF THE DIFFERENTIAL SHIFTS, 1939-54 TOUl Tot8l OnDlpnC#nponn(.o(ToPlDWknnW-h~pm(
Dl(hnn(i.l Pr0pwkn.C Tran.por- Fhmca, TOW sdft W- tat1011 ~d W*- Insurance S&CQ md
Employr~nt (ADS and (ADS Md Agricul- Comtruc- Manu- Pu#c sale R . U M and Real Mhcd- Govern- R.gion or SUtQ !Wl Percant') poreen(') t u n Mining tion faciuring UI*Y.S trade Tnd. €*(. I m o u s ment
NEW ENGLAND Maine
New Hampahire
Vermont
Massachuselts
Rhode Isiand
ConnwAicut
MIDDLE ATLANTIC New York
New Jersey
Pennsylvania
Delaware
Maryland and D.C.
GREAT LAKES ohlo
Indiana
INinoir
MkMgan
Wisconsin
SOUTHEAST Virginia
W n t Virginia
North Carolina
South Carolina
Gwrgia
Florida
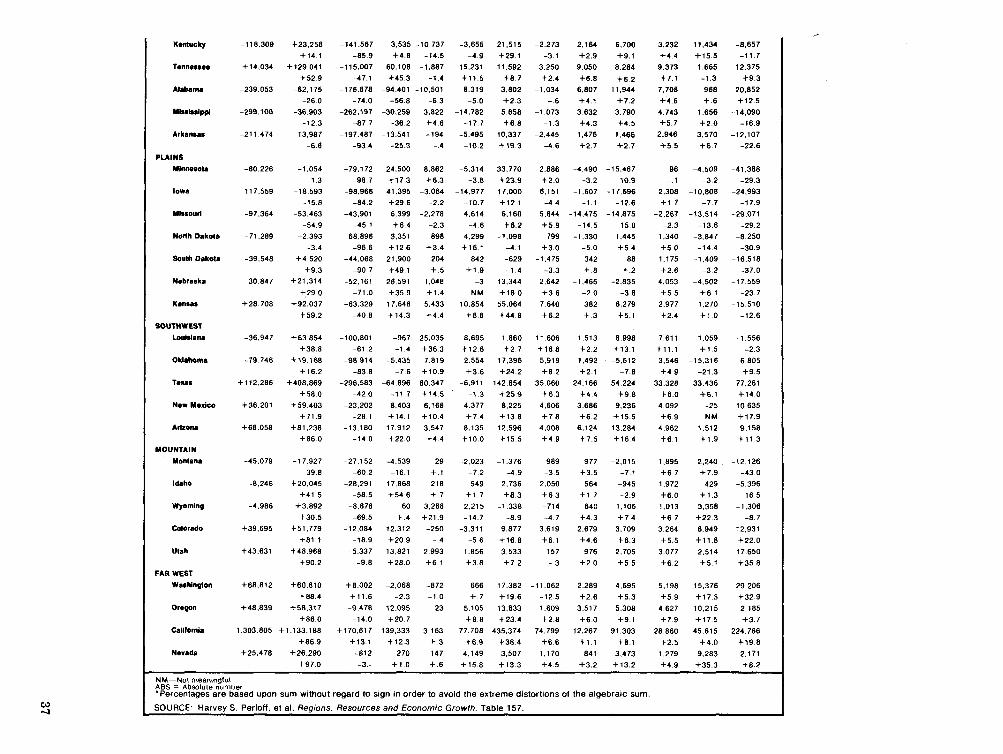
Kentucky
Tennessee
Alabama
Mbabslppi
Arkansas
PLAINS
Mlnnnota
Iowa
Mbsourl
NOrlh Dakota
South Dakota
Nebraska
Kansas
SOUTHWEST
b U l h M
Oklahoma
Tau.
New Mexico
Arizona
MOUNTAIN Montana
Idaho
Wyoming
Colorado
Utah
FAR WEST
Washington
Oregon
California
Nevada
- -
NM-No1 meanmgful ABS = Absolute number
Percentages are based upon sum w~thout regard to slgn In order to avo~d the extreme d~stortlons of the algebraic sum
SOURCE Harvey S Perloff, et al. Reg~ons Resources and Econorn~c Growth Table 157

In sum, when the two decades are com- pared, we find:
The gap in net relative changes in income between the fast and the slow growing regions was far larger during the 1948- 57 period than during the years between 1959 and 1969. Smaller positive and negative industrial mix (or income component mix) factors in the slow and the fast growing regions, re- spectively, indicate that the industrial mix in the older industrial regions is not as favorable to growth as it was, nor as unfavorable as it was in the South and Southwest. Smaller positive and negative differential shifts in the fast and the slow growing regions, respectively, yet they remain
quite substantial and still clearly the principal source of the overall relative changes in total personal income.
Rees' recent analysis of these industrial mix and differential shift effects (here referred to as mix and competitive effects) provides computations for manufacturing only, for the years 1963-72 (see Figure I and footnote 4). The regional patterns are very similar overall to those cited above:
Mix, or industrial structure, or propor- tionality shifts, are still positive in the older industrial regions, that is, in New England. Middle Atlantic, and Great Lakes states (the latter are grouped as East North Central in the paper).
Table 20
REGIONAL GROWTH EFFECTS
Income Growth Factors Income Growlh Factors Total Total
Personal Income Net Personal Income Net Income National Component Regional Reiative lncome National Component Regional Relative
Region Change Growth Mix Share Change1 Change Grow* Mhr Share Cha*
(billions of dollars) (billions of dollars)
UNITED STATES . . . . . . . . . . . 139.6 139.6 0 Fast Growlng Regions . . . . . . 54.7 45.8 -2.7
Southeast . . . . . . . . . . . . . 22.3 21.2 -3.1 FarWest . . . . . . . . . . . . . . 21.7 15.9 1.2 Southwest . . . . . . . . . . . . . 10.7 8.7 -0.8
Slow Growing Regions . . . . . . 85.0 93.6 2.5 New England . . . . . . . . . . . 8.7 9.2 1.2 Great Lakes . . . . . . . . . . . 30.8 31.9 1.4 Plains . . . . . . . . . . . . . . . . 8.3 13.1 -4.2 Mideasl . . . . . . . . . . . . . . . 34.0 36.3 4.8 Rocky Mountain . . . . . . . . 3.2 3.1 -0.7
- UNITED STATES . . . . . . . . . . .
Fast Growing Regions . . . . . . . . . . . . . . . . . . . Southeast
Far West . . . . . . . . . . . . . . Southwest . . . . . . . . . . . . .
Slow Growing Regions . . . . . . New England . . . . . . . . . . . Great Lakes . . . . . . . . . . . Plains . . . . . . . . . . . . . . . . Mideast . . . . . . . . . . . . . . . Rocky Mountain . . . . . . . .
Percent distribution of dollar change
100.0 0 0 83.7 -4.9 21.0 95.1 -13.9 18.8 73.3 5.5 21.2 81.3 -7.5 25.2
110.1 2.9 -13.5 105.7 13.8 -20.7 103.6 4.5 -8.1 157.8 -50.6 -9.6 106.8 14.1 -21.2 96.9 -21.9 25.0
Percent distribution of dollar change
100.0 100.0 0 0 0 100.0 88.3 -1.6 13.4 11.8 100.0 83.2 -2.3 19.1 16.8 100.0 92.0 .6 7.6 8.2 100.0 94.0 -4.2 10.2 6.0 100.0 108.7 1.1 -9.8 -8.7 100.0 102.7 3.6 -5.8 -2.2 100.0 107.5 1.1 -8.6 -7.5 100.0 108.7 -3.8 -4.6 -8.4 100.0 111.2 2.6 -13.8 -11.2 100.0 112.3 -4.1 -8.2 -12.3
'The sum of "income component mix" and "regional share." Note-Details may not add to totals because of rounding.
SOURCE: Robert '6. Bretzfelder. "Geographic Trends in Personal lncome in the 1960's." Survey of Current Business. August 1970

-- -
Table 21
SHIFT SHARE ANALYSIS 1963-72"
Competitive* * Competitive Region Effect Mix Effect Mix -- - -
New England (employment in thousands)
- 262 +37 (-7)
(dollar value added in millions) -3,407 +925' (-308)
Middle Atlantic - 692 +57 (-25.6) -1 1,031 +1,247 (+146)
East North Central - 242 + I47 (4-13.2) -5,656 . +2,387 ( + I ,265)
West North Central + 64 -6 (-I-3.2) +1,981 + I83 (+453)
South Atlantic +356 -8 (-75.3) $6,034 -444 (-1,237)
East South Central +263 -16 (-27.9) + 4,089 -117 (-217)
West South Central $265 -5 (-11.4) 4-4.764 -450 (+1,981)
Mountain + 70 -6 (-2.1) +1,321 -243, (+ 208) Paciflc -35 -1 (-19.2) +1,662 -470 (-9)
'Data in parentheses are based on Annual Survey of Manufactures for 1972-76 period. "Positive competitive effects on employment data do not cancel out negative ones because of disclosure rule for a few standard industrial
classification (SIC) groups.
SOURCE: John Rees. "Regional Industrial Shtfts in the U.S. and the Internal Generat~on of Manufacturing Growth in the Southwest." paper prepared for Committee on Urban Public Economics. May 1978.
Differential shift or competitive effects are still negative for these older industrial areas and far outweigh the positive indus- trial structure effects.
For the more rapidly growing regions, (a) the industrial mix effects remain nega- tive, although extremely small-indicat- ing that the shifts which have occurred in the last 50 years or so have reduced very substantially the negative effects of industrial structure; and (b) the differen- tial or competitive shifts remain posi- tive.ll
Rees has also computed the mix effects for the 1972-76 period and these are shown in parentheses in Table 21. We hesitate to infer any trend, since the period was one of slow growth and undoubtedly confounds cyclical with secular factors. If taken at face value, several reversals of direction are to be noted. For one thing, the still positive industrial structure effects present in the New Eng- land and Middle Atlantic states in the 1963- 72 period, have turned negative for the first time, though this may be a purely cycli- cal phenomenon rather than part of the long- er term regional shift. It should be noted in this connection that the negative mix effects in the more rapidly growing regions are gen-
erally much larger in the 1972-76 years than in the earlier period.
In terms of value added, only New England, of the three older industrial regions, shows a reversal from positive to negative mix effect. There was a large reduction in the positive magnitude of the industrial mix effect in the Middle Atlantic and East North Central re- gions. The Southwest, in contrast, shows a very substantial reversal from negative to positive mix effect, in value added terms. This, as Rees points out, however, is largely attributable to the "price escalations in . . . petroleum and chemicals, the major indus- trial endowments of that region."12
New York State, 1968-73, Disaggregated Sectoral Analysis
All of the analyses cited earlier have been based upon experience in broad general eco- nomic sectors-the two-digit level of Standard Industrial Classification (SIC). This may be too aggregated for meaningful testing of the hypothesis that slow growth in the demand for the outputs of the industries predominant in the older industrial regions plays a large part in the relative decline of these areas.
Consider the two-digit sectors, machinery, nonelectrical (SIC 35) and electric and elec- tronic equipment (SIC 36), which both experi-

enced overall decreases in economy wide em- two-digit level, 22 branches expanded and ployment between 1967 and 1972. In the more only ten declined when viewed from the four- specific segments of the nonelectrical ma- digit perspective. An examination of the four- chinery industry, at the four-digit SIC level, digit branches shows very great differences- 20 branches of the industry contracted but 15 large increases in employment in some, large expanded. Despite the overall decline in em- decreases in others. Unless these four-digit ployment in the electrical and electronic branches are evenly spread among the states, equipment industry when viewed from the very different patterns of economic growth on
Table 22
CHANGE IN EMPLOYMENT FOR THE ELECTRIC AND ELECTRONIC EQUIPMENT INDUSTRY (SIC 36),
DISAGGREGATED TO THREE AND FOUR-DIGIT SIC BRANCHES, 1967-72
SIC Code Branch Name
Total Employment
(000)
1967 1972 Percent Change
- - - - - -
36 Electric and Electronic Equipment 361 Electric Distributing
361 2 Transformers 361 3 Switch Gears, Boards
362 Electric lndustrial Apparatus 361 2 Motor Generators 3622 lndustrial Controls 3623 Welding 3624 Carbon and Graphite 3629 Other (NEC)
363 Household Appliances 3631 Cooking 3632 Ref rigerators 3633 Laundry 3634 Housewares and Fans 3635 Vacuum Cleaning 3636 Sewing Machinery 3639 Other (NEC)
364 Lighting and Wiring 3641 Lamps 3643 Current-Carry Wire 3644 Non-Current Carry Wire 3645 Residential Lighting Fixtures 3646 Commercial Lighting Fixtures 3647 Vehicular Lighting Equipment 3648 Other (NEC)
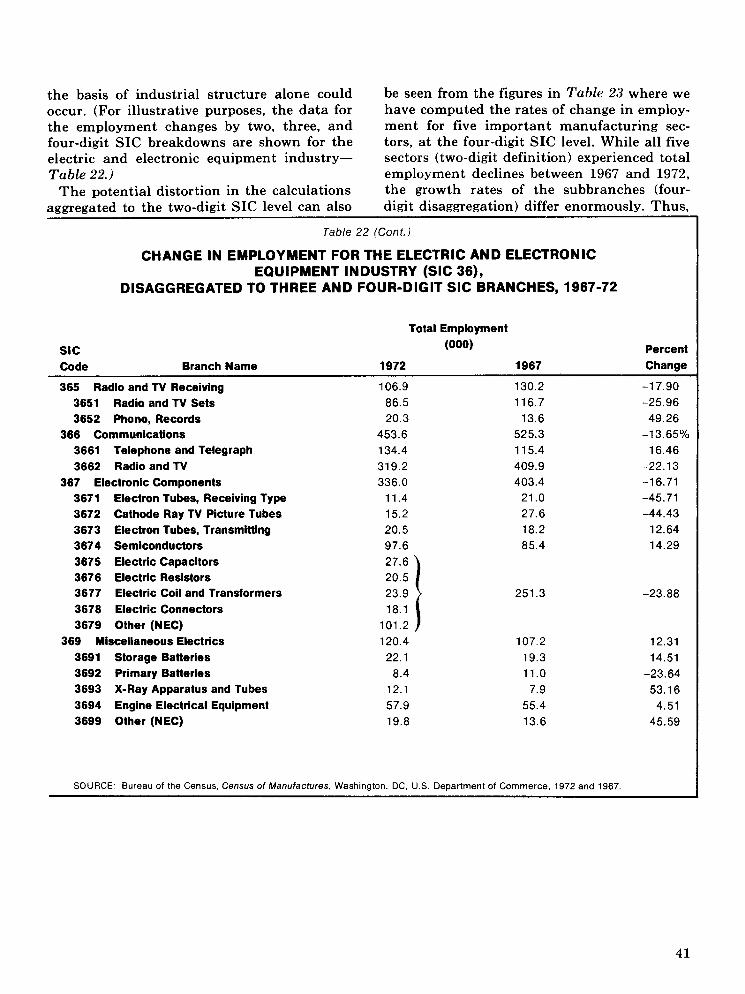
the basis of industrial structure alone could be seen from the figures in Table 23 where we occur. (For illustrative purposes, the data for have computed the rates of change in employ- the employment changes by two, three, and ment for five important manufacturing sec- four-digit SIC breakdowns are shown for the tors, at the four-digit SIC level. While all five electric and electronic equipment industry- sectors (two-digit definition) experienced total
Table 22 (Cont.)
CHANGE IN EMPLOYMENT FOR THE ELECTRIC AND ELECTRONIC EQUIPMENT INDUSTRY (SIC 36),
DISAGGREGATED TO THREE AND FOUR-DIGIT SIC BRANCHES, 1967-72
Total Employment
SIC (000) Percent Code Branch Name 1972 1967 Change
365 Radio and TV Receiving 106.9 130.2 -1 7.90
3651 Radio and TV Sets 86.5 116.7 -25.96
3652 Phono, Records 20.3 13.6 49.26 366 Communications 453.6 525.3 -13.65%
3661 Telephone and Telegraph 134.4 11 5.4 16.46
3662 Radio and TV 319.2 409.9 -22.13
367 Electronic Components 336.0 403.4 -1 6.71 3671 Electron Tubes, Receiving Type 11.4 21 .O -45.71
3672 Cathode Ray TV Picture Tubes 15.2 27.6 -44.43
3673 Electron Tubes, Transmitting 20.5 18.2 12.64 3674 Semiconductors 97.6 85.4 14.29
Table 22.) employment declines between 1967 and 1972, The potential distortion in the calculations the growth rates of the subbranches (four-
aggregated to the two-digit SIC level can also digit disaggregation) differ enormously. Thus,
-
-
3675 Electric Capacitors 3676 Electric Resistors 3677 Electric Coil and Transformers 3678 Electric Connectors 3679 Other (NEC)
369 Miscellaneous Electrics 3691 Storage Batteries 3692 Primary Batteries 3693 X-Ray Apparatus and Tubes 3694 Engine Electrical Equipment 3699 Other (NEC)
SOURCE: Bureau of the Census, Census of Manufactures, Washington, DC, U.S. Department of Commerce, 1972 and 1967.

Table 23
AVERAGE DEVIATIONS OF FOUR-DIGIT SIC INDUSTRIES FROM SELECTED TWO-DIGIT SIC AGGREGATE PERCENTAGE EMPLOYMENT CHANGES
Two-Digit SIC Industry
.I
Chemical and Allied Products Petroleum and Coal Products Primary Metals Machinery, Except Electrical Electric and Electronic Equipment
Percentage Change in
Employment (two-digit industry)
Average Deviation From Aggregate
Change in Employment
(four-digit industry)
SOURCE: Bureau of the Census, Census of Manufactures. 1972 and 1967
if employment in the rapidly growing states is concentrated in the rapidly growing sub- sectors and that in the more slowly growing states in the declining subsectors, then indus- trial structure may play a very important role in their differential rates of growth, a phenomenon masked at the two-digit level.
In order to evaluate the influence of aggre- gation, shift-share computations (for both proportionality and competitiveness) were made for New York State at the three or four- digit SIC level, for all sectors for the period 1968-73. The results, described below, do not contradict the more aggregated analysis pre- sented earlier. Generally, New York State in- dustries grow more slowly than they do na- tionally, i.e., New York's employment change is heavily influenced by differential shifts or negative competitive components.13
In Table 24, we summarize these computa- tions: the top half of the table is based upon the three or four-digit calculations and the bottom half summarizes the computations made at the two-digit level. The hypothetical change in employment which would have been expected had all New York State's in- dustries grown at the same rate as those in- dustries did nationally, is estimated at 12.8% when the four-digit disaggregation is used and at 13.3% when the two-digit disaggregation forms the basis for the calculation. National- ly, employment grew by 12.5% over the entire period.
Thus, had New York's industries (defined
at either the two or three or four-digit level of disaggregation) grown at their national rates, New York would have increased its employ- ment by about the same percentage as the nation as a whole. In fact, employment in New York declined over the period by about 196, indicating a very substantial differential shift away from New York. In terms of the summary tables, there is not one major sector in which New York State did not grow more slowly than its national counterpart. The more detailed subsector breakdown generally shows the same pattern.
None of the studies, discussed above, irre- spective of differences in industrial coverage, time periods, or unit of analysis support the hypothesis that slow growth in the older in- dustrial regions is attributable to their indus- trial structure, i.e., to national demand shift to the products of new industries. Differential or competitive shifts away from these regions occur in industries which remain quite robust. Moreover, the differences among regions, as measured by industrial mix shifts in employ- ment, are narrowing. The hypothetical posi- tive and negative deviations of regional em- ployment growth from national employment which could be attributed to industrial struc- ture have become much smaller. Similarly, it appears that the positive and negative com- petitive shifts have narrowed over time. Both point to more similar growth rates among regions over time.
Thus, the shifts observed earlier in the
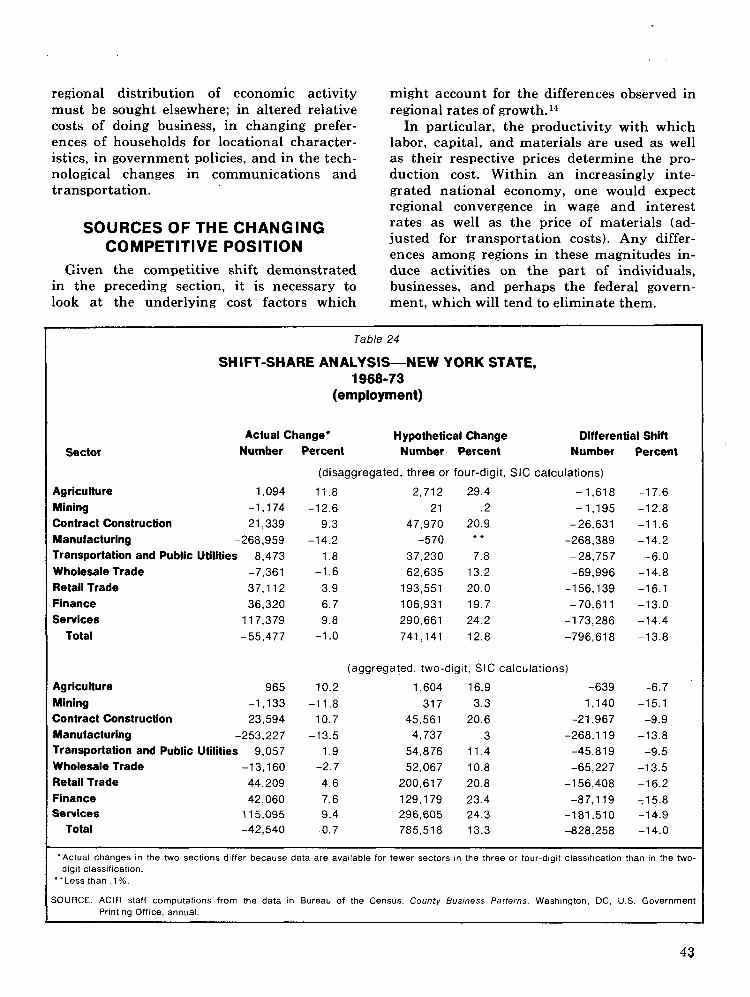
regional distribution of economic activity must be sought elsewhere; in altered relative costs of doing business, in changing prefer- ences of households for locational character- istics, in government policies, and in the tech- nological changes in communications and transportation.
SOURCES OF THE CHANGING COMPETITIVE POSITION
Given the competitive shift demonstrated in the preceding section, it is necessary to look at the underlying cost factors which
might account for the differences observed in regional rates of growth.14
In particular, the productivity with which labor, capital, and materials are used as well as their respective prices determine the pro- duction cost. Within an increasingly inte- grated national economy, one would expect regional convergence in wage and interest rates as well as the price of materials (ad- justed for transportation costs). Any differ- ences among regions in these magnitudes in- duce activities on the part of individuals, businesses, and perhaps the federal govern- ment, which will tend to eliminate them.
Table 24
SHIFT-SHARE ANALYSIS-NEW YORK STATE, 1968-73
(employment)
Actual Change* Hypothetical Change Differential Shift
Sector Number
Agriculture 1,094 Mining -1,174 Contract Construction 21,339 Manufacturing -268,959 Transportation and Public Utilities 8,473
Wholesale Trade -7,361 Retail Trade 37,112 Finance 36,320 Services 11 7,379
Total - 55,477
Agriculture 965 Mining -1,133 Contract Construction 23,594 Manufacturing -253,227 Transportation and Public Utilities 9,057 Wholesale Trade -1 3,160 Retail Trade 44,209 Finance 42,060 Services 11 5,095
Total -42,540
Percent Number- Percent Number
(disaggregated, three or four-digit, SIC calculations)
11.8 2,712 29.4 - 1,618 -12.6 21 .2 -1,195
9.3 47,970 20.9 -26,631 -14.2 -570 " * -268,389
1.8 37,230 7.8 - 28,757 -1.6 62,635 13.2 -69,996
3.9 193,551 20.0 -1 56,139 6.7 106,931 19.7 - 70.61 1 9.8 290,661 24.2 -1 73,286
-1 .O 741,141 12.8 -796,618
(aggregated, two-digit, SIC calculations)
10.2 1,604 16.9 -639
-1 1.8 317 3.3 -1,140 10.7 45,561 20.6 -21,967
-13.5 4,737 .3 -268,119 1.9 54,876 11.4 -45,819
-2.7 52,067 10.8 -65,227 4.6 200,617 20.8 -1 56,408 7.6 129,179 23.4 -87,119 9.4 296.605 24.3 -181,510
-0.7 785,518 13.3 -828,258
Percent
-1 7.6 -1 2.8 -1 1.6 -14.2 -6.0
-14.8 -1 6.1 -13.0 -14.4 -13.8
-6.7 -15.1
-9.9 -13.8
-9.5 -13.5 -1 6.2 71 5.8 -1 4.9 -1 4.0
'Actual changes in the two sections differ because data are ava~lable for fewer sectors in the three or four-d~git classification than in the two- dig~t classification.
"Less than . l%.
SOURCE: AClR staff computations from the data in Bureau of the Census, County Business Patterns. Washington, DC. U.S. Government Printlng Office, annual.
For example, in the presence of wage differ- ences (adjusted for skill) among regions, individuals are likely to migrate from low to high wage areas, while firms may locate new plant facilities in the former. The resulting smaller supply and larger demand for workers in the low wage area will tend to increase the wage level relative to high wage regions. Similarly, major lending institutions such as commercial banks and insurance companies scan the entire country for investment oppor- tunities and unusually high returns in any region are likely to elicit an increased flow of investment funds to it, eventually lowering the return (insofar as it was based on region specific factors). Through shifting factors of production, differences in returns are nar- rowed or removed and growth patterns should become more similar over time, that is, con- form to the type of regional convergence re- ported earlier.15
Even if regional convergence in underlying cost factors could be documented, the evi- dence would probably not allay concern about future divergence in regional growth. It would be alarming, however, if divergence in under- lying costs is found, with the more rapidly growing regions continuing to exhibit lower costs since the difference in growth rates of the last two decades might then continue. (The implications for the welfare of the aver- age low wage recipient in high growth areas would require some attention.) Some costs (e.g., interest rates) have been found to vary insignificantly among regions. Still others are place and industry-specific (e.g., land prices) and few useful data are available.
Regional tax differences, more accurately state and local differences, are usually cited as a source of cost difference. There is an extensive and growing literature on the im- portance of tax policies, the argument usually being made that high taxes discourage the location of new firms and investment in ex- pansion of existing ones. It is difficult to evaluate readily such assertions. In particu- lar, they tend to focus on total tax payments per capita in a state as an index of attractive- ness to investors.
Since tax differential comparisons ignore the difference between business and personal taxes. The former may well be shifted forward in the form of higher prices for a firm's prod-
uct. The ability of a firm to do so depends on a number of features of the markets in which it sells including the location of its competi- tors and their tax burdens.
Similarly, it is alleged that higher-than- average personal taxes will raise the produc- tion cost as firms must raise remuneration levels to compensate for such taxes. Apart from the likelihood that such compensatory increases would be required for only the most mobile members of each firm's labor force, and may thus constitute an insignificant addition to wages, any such addition may not discourage location if it can be reflected in higher product prices.
An analysis of the incidence of state and local taxes is required to support the initially plausible view that high taxes may lead to slow growth. Moreover, for both firms and individuals, the increase in public services made possible by higher taxes may yield de- sirable effects (a better pool of educated labor for the firm, cheaper higher education for the employee). Thus, even if firms were to bear the costs of higher-than-average taxes, the benefits derived from government expendi- tures might make a given state or local area a desirable location. Recent work investigating the response of households to local taxes and expenditures suggests that the increase in house values stemming from local expendi- tures is roughly equal to the decline caused by the taxation to finance them.16
In sum, while differences in interstate tax levels may affect the decisions of firms, the specific manner in which they do so is not as simple as implied by studies which calculate the tax "burden" measured by total collec- tions divided by an income measure. A study of the incidence of taxes and the effect of ex- penditures must be made before policy con- clusions can be drawn. While tax burdens may serve as a signal of the business "cli- mate" in a state as well as an indicator of future tax changes, the effect of such signals is, at this stage, conjectural.
REGIONAL WAGE DIFFERENCES The notion that lower wages in the South-
west and Southeast than in the nation's older industrialized areas have been a major factor in the shift of industry to these regions is well

embedded in our common lore. A discussion of relative regional wages, however, is not a simple matter. Lower hourly (or annual) wages, all other things the same, would make an area more attractive to industry, particu- larly to relatively labor intensive sectors. If, however, lower wages reflect lower labor pro- ductivity, the attraction of the lower wage may be offset. Low labor productivity should be understood as implying that workers equipped with the same complementary fac- tors (buildings, machines) produce less per hour.
The convergence in per capita incomes among regions which was described earlier, is not synonymous with a convergence in re- gional wages. Incomes are comprised of prop- erty as well as labor income. Moreover, they reflect labor force participation rates, e.g., identical annual wages in two states will be consistent with different per capita incomes if different proportions of the total population are at work. For a given population, the high- er the labor force participation rate, the higher per capita incomes.
In addition, differences in average wage rates may reflect sectoral composition, par- ticularly the relative importance of agricul- ture and manufacturing. Indeed, it is widely believed that a major factor in income and average wage convergence in the United
States has been the general reduction in the proportion of the labor force engaged in agri- culture. l7
It is clear that between 1909 and 1929 there was a very substantial convergence among regional wage rates in manufacturing, almost entirely the result of relative declines in the very high wage Western sections of the coun- try: the Far West, Rocky Mountain, South- west, and Plains states. Table 25.18 In the years since 1929 the overall convergence has been far more modest, the major change being the slow but steady increase in the relative manufacturing wages in the Southeast. Al- though the Southeast has remained the low- est manufacturing wage region of the country throughout, its wages moved from 67% of the national average in 1929 to 87% in 1976. The New England region, despite its reputation as a high wage area, has been the second lowest wage region in the country; by 1976, falling to parity with the Southeast.l9 In 1929, the average manufacturing wage in the Far West and the Great Lakes was 64% greater than that in the Southeast; by 1976, the difference was only 37%.
The only changes of any significance during the 1970s have been the relative declines in the manufacturing wages in the Far West and the New England states: in the former, from 21% to 12% above the national average in
I Table 25
INDEX OF MANUFACTURING WAGE RATES, BY REGION, SELECTED YEARS, 1909-76
Region 1909 1929 1947 1955 1960 1965 1970 1976
I United States 100 100 100 1 00 100 100 100 100 New England Mideast Great Lakes Plains Southeast Southwest Rocky Mountain Far West
SOURCE: 1909-47 data: Simon Kuznets. Ann Ratner Miller, and Richard A. Easterlin, Population Redistribution and Economic Growth, United States, 1870-1950; Vol. II of Analyses of Economic Change. Philadelphia, PA, The American Philosophical Society. 1960, Table A3.5. 1955-76 data: AClR computations based on data in Bureau of Labor Statistics, Handbook of Labor Statistics. Washington. DC. U.S. Department of Labor, 1972, 1974, 1977.
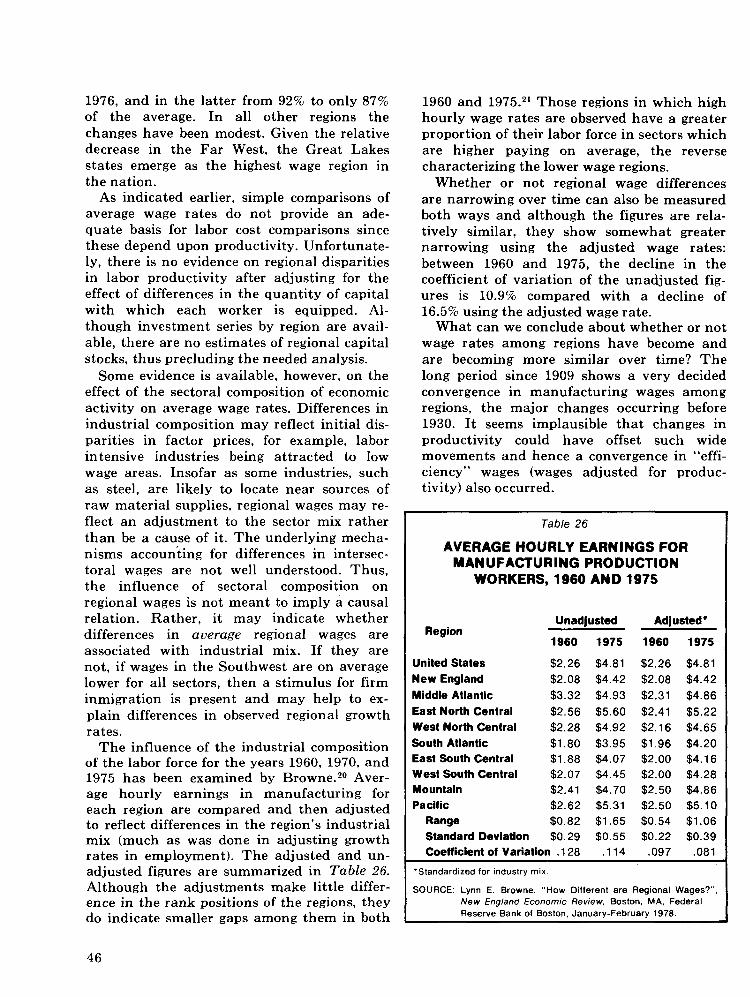
1976, and in the latter from 92% to only 87% of the average. In all other regions the changes have been modest. Given the relative decrease in the Far West, the Great Lakes states emerge as the highest wage region in the nation.
As indicated earlier, simple comparisons of average wage rates do not provide an ade- quate basis for labor cost comparisons since these depend upon productivity. Unfortunate- ly, there is no evidence on regional disparities in labor productivity after adjusting for the effect of differences in the quantity of capital with which each worker is equipped. Al- though investment series by region are avail- able, there are no estimates of regional capital stocks, thus precluding the needed analysis.
Some evidence is available, however, on the effect of the sectoral composition of economic activity on average wage rates. Differences in industrial composition may reflect initial dis- parities in factor prices, for example, labor intensive industries being attracted to low wage areas. Insofar as some industries, such as steel, are likely to locate near sources of raw material supplies, regional wages may re- flect an adjustment to the sector mix rather than be a cause of it. The underlying mecha- nisms accounting for differences in intersec- toral wages are not well understood. Thus, the influence of sectoral composition on regional wages is not meant to imply a causal relation. Rather, it may indicate whether differences in auerage regional wages are associated with industrial mix. If they are not, if wages in the Southwest are on average lower for all sectors, then a stimulus for firm inmigration is present and may help to ex- plain differences in observed regional growth rates.
The influence of the industrial composition of the labor force for the years 1960, 1970, and 1975 has been examined by B r o ~ n e . ~ O Aver- age hourly earnings in manufacturing for each region are compared and then adjusted to reflect differences in the region's industrial mix (much as was done in adjusting growth rates in employment). The adjusted and un- adjusted figures are summarized in Table 26. Although the adjustments make little differ- ence in the rank positions of the regions, they do indicate smaller gaps among them in both
1960 and 1975.21 Those regions in which high hourly wage rates are observed have a greater proportion of their labor force in sectors which are higher paying on average, the reverse characterizing the lower wage regions.
Whether or not regional wage differences are narrowing over time can also be measured both ways and although the figures are rela- tively similar, they show somewhat greater narrowing using the adjusted wage rates: between 1960 and 1975, the decline in the coefficient of variation of the unadjusted fig- ures is 10.9% compared with a decline of 16.5% using the adjusted wage rate.
What can we conclude about whether or not wage rates among regions have become and are becoming more similar over time? The long period since 1909 shows a very decided convergence in manufacturing wages among regions, the major changes occurring before 1930. I t seems implausible that changes in productivity could have offset such wide movements and hence a convergence in "effi- ciency" wages (wages adjusted for produc- tivity) also occurred.
Table 26
AVERAGE HOURLY EARNINGS FOR MANUFACTURING PRODUCTION
WORKERS, 1960 AND 1975
Unadjusted Region
1960 1975
United States $2.26 $4.81 New England $2.08 $4.42 Middle Atlantic $3.32 $4.93 East North Central $2.56 $5.60 West North Central $2.28 $4.92 South Atlantic $1.80 $3.95 East South Central $1.88 $4.07 West South Central $2.07 $4.45 Mountain $2.41 $4.70 Pacific $2.62 $5.31
Range $0.82 $1.65 Standard Deviation $0.29 $0.55 Coefficient of Variation .I28 ,114
Adjusted'
1960 1975
$2.26 $4.81 $2.08 $4.42 $2.31 $4.86 $2.41 $5.22 $2.16 $4.65 $1.96 $4.20 $2.00 $4.16 $2.00 $4.28 $2.50 $4.86 $2.50 $5.10 $0.54 $1.06 $0.22 $0.39 .097 ,081
'Standardized for industry mix.
SOURCE: Lynn E. Browne, "How Different are Regional Wages?". New England Economic Review. Boston. MA, Federal Reserve Bank of Boston. January-February 1978.
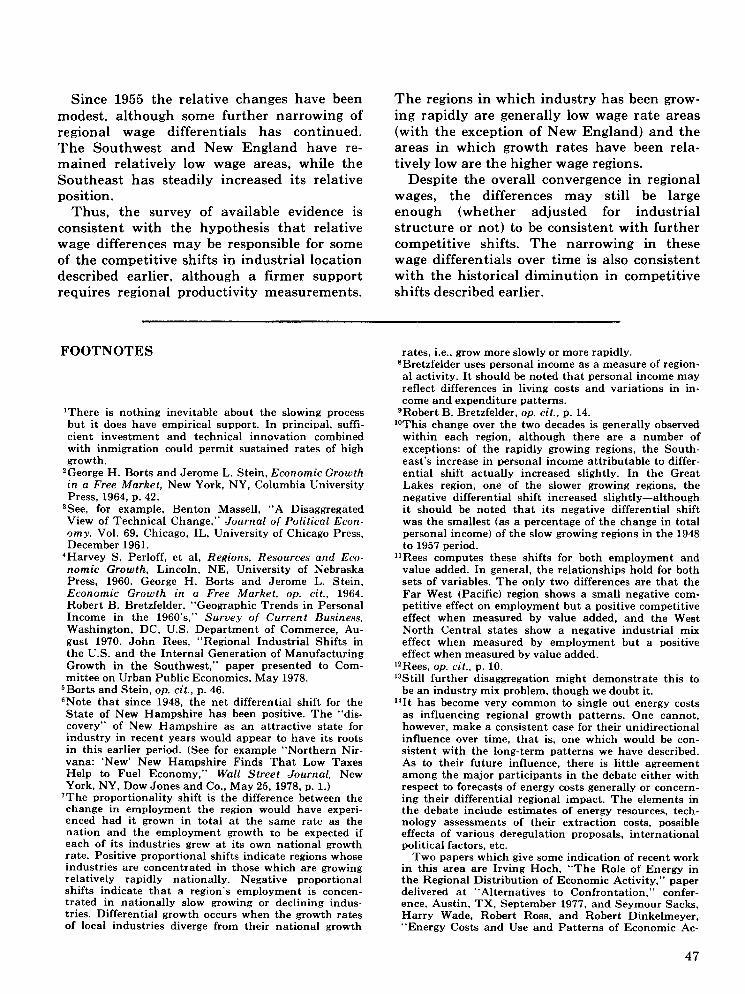
Since 1955 the relative changes have been modest, although some further narrowing of regional wage differentials has continued. The Southwest and New England have re- mained relatively low wage areas, while the Southeast has steadily increased its relative position.
Thus, the survey of available evidence is consistent with the hypothesis that relative wage differences may be responsible for some of the competitive shifts in industrial location described earlier, although a firmer support requires regional productivity measurements.
The regions in which industry has been grow- ing rapidly are generally low wage rate areas (with the exception of New England) and the areas in which growth rates have been rela- tively low are the higher wage regions.
Despite the overall convergence in regional wages, the differences may still be large enough (whether adjusted for industrial structure or not) to be consistent with further competitive shifts. The narrowing in these wage differentials over time is also consistent with the historical diminution in competitive shifts described earlier.
FOOTNOTES
'There is nothing inevitable about the slowing process but it does have empirical support. In principal, suffi- cient investment and technical innovation combined with inmigration could permit sustained rates of high growth.
2George H. Borts and Jerome L. Stein, Economic Growth in a Free Market, New York, NY, Columbia University Press, 1964, p. 42.
3See, for example, Benton Massell, "A Disaggregated View of Technical Change," Journal o f Political Econ- omy, Vol. 69, Chicago, IL, University of Chicago Press, December 1961.
4Harvey S. Perloff, et al, Regions, Resources and Eco- nomic Growth, Lincoln, NE, University of Nebraska Press, 1960. George H. Borts and Jerome L. Stein, Economic Growth in a Free Market, op. cit., 1964. Robert B. Bretzfelder. "Geographic Trends in Personal Income in the 1960's." Survey o f Current Business, Washington, DC, US . Department of Commerce, Au- gust 1970. John Rees, "Regional Industrial Shifts in the U.S. and the Internal Generation of Manufacturing Growth in the Southwest," paper presented to Com- mittee on Urban Public Economics, May 1978.
5Borts and Stein, op. cit., p. 46. 6Note that since 1948, the net differential shift for the State of New Hampshire has been positive. The "dis- covery" of New Hampshire as an attractive state for industry in recent years would appear to have its roots in this earlier period. (See for example "Northern Nir- vana: 'New' New Hampshire Finds That Low Taxes Help to Fuel Economy," Wall Street Journal, New York, NY, Dow Jones and Co., May 25, 1978, p. 1.)
'The proportionality shift is the difference between the change in employment the region would have experi- enced had it grown in total a t the same rate as the nation and the employment growth to be expected if each of its industries grew a t its own national growth rate. Positive proportional shifts indicate regions whose industries are concentrated in those which are growing relatively rapidly nationally. Negative proportional shifts indicate that a region's employment is concen- trated in nationally slow growing or declining indus- tries. Differential growth occurs when the growth rates of local industries diverge from their national growth
rates, i.e., grow more slowly or more rapidly. 8Bretzfelder uses personal income as a measure of region- al activity. It should be noted that personal income may reflect differences in living costs and variations in in- come and expenditure patterns.
gRobert B. Bretzfelder, op. cit., p. 14. l0This change over the two decades is generally observed
within each region, although there are a number of exceptions: of the rapidly growing regions, the South- east's increase in personal income attributable to differ- ential shift actually increased slightly. In the Great Lakes region, one of the slower growing regions, the negative differential shift increased slightly-although it should be noted that its negative differential shift was the smallest (as a percentage of the change in total personal income) of the slow growing regions in the 1948 to 1957 period.
llRees computes these shifts for both employment and value added. In general, the relationships hold for both sets of variables. The only two differences are that the Far West (Pacific) region shows a small negative com- petitive effect on employment but a positive competitive effect when measured by value added, and the West North Central states show a negative industrial mix effect when measured by employment but a positive effect when measured by value added.
12Rees, op. cit., p. 10. 13Still further disaggregation might demonstrate this to
be an industry mix problem, though we doubt it. "It has become very common to single out energy costs
as influencing regional growth patterns. One cannot. however, make a consistent case for their unidirectional influence over time, that is, one which would be con- sistent with the long-term patterns we have described. As to their future influence, there is little agreement among the major participants in the debate either with respect to forecasts of energy costs generally or concern- ing their differential regional impact. The elements in the debate include estimates of energy resources, tech- nology assessments of their extraction costs, possible effects of various deregulation proposals, international political factors, etc.
Two papers which give some indication of recent work in this area are Irving Hoch, "The Role of Energy in the Regional Distribution of Economic Activity," paper delivered a t "Alternatives to Confrontation," confer- ence, Austin, TX, September 1977, and Seymour Sacks, Harry Wade. Robert Ross, and Robert Dinkelmeyer, "Energy Costs and Use and Patterns of Economic Ac-

tivity in the Northeastern United States." paper pre- pared for the Northeast Regional Advisory Committee, Syracuse Research Corporation, December 1976.
16At a given moment these adjustments may not have been completed; indeed, it is the disequilib~ium that serves as a continuing impetus to change.
16See Wallace E. Oates, "The Effect of Property Taxes and Local Public Spending on Property Values: An Empirical Study of Tax Capitalization and the Tiebout Hypothesis," Journal of Political Economy, Vol. 77, Chicago, IL, University of Chicago Press, November/ December 1969. For a summary and additional evi- dence on the issue, see Howard Pack and Janet Rothen- berg Pack, "Metropolitan Fragmentation and Local Public Expenditures," National Tar Journal, Vol. 31, Lancaster, PA, National Tax Association, Tax In- stitute of America, December 1978.
'?"The most important [factors in the convergence in incomes per capita] appear to have been the nonagri- cultural share of the labor force, the countrywide ratio of agricultural to nonagricultural service income per worker, and the proportion in the labor force." Richard A. Easterlin, "Redistribution of Manufacturing" in Simon Kuznets, Anne Ratner Miller, and Richard A. Easterlin, Population Redistribution and Economic
Growth: United States, 1870-1950, Vol. 11, Analyses of Economic Change. Philadelphia, PA, The American Philosophical Society, p. 164.
Similarly, Perloff, et al, concludes that ". . . the strongest force for reduction in interstate income differ- entials between 1920 and 1950 was differential change among the states in the proportion of the labor force employed in agriculture."
18The figures for 1909 to 1947 are not entirely comparable with those for the later years. The earlier figures are total wages per wage earner (which does not adjust for hours worked or overtime pay, for example) and the second is average hourly wages for production workers on manufacturing payrolls.
lgThe reputation of New England as a high wage region is also found to be undeserved in the recent paper by Lynn B. Browne, "How Different Are Regional Wages?," New England Economic Review, Boston, MA, Federal Reserve Bank of Boston, January/February 1978.
20Browne, ibid. 211n 1960, the coefficient of variation for the unadjusted
wage rates was .I28 and in 1975, it was .114. The ad- justed figures were ,097 and .O81, respectively.

Chapter IV
The Federal Government and Regional Economic Activity
T he search for explanation (or blame) and for amelioration of regional economic
disparities leads frequently to the door of the federal government. The assessment of blame has focused principally on the net flow of funds, in particular, on the "deficit" posi- tions of many of the Northeastern and Mid- western states with the federal government, i.e., taxes paid to the federal government by their residents exceed expenditures made by the federal government in their areas. The argument has also focused on particular cate- gories of expenditure, most often, defense outlays, which are alleged to be similarly biased against the older industrialized states of the Northeast.
Proponents of a more "equitable" federal policy emphasize the size of the federal budget -of procurement expenditures and of federal employment-and its enormous potential for affecting the fortunes of regions. Such argu- ments underlie legislation already enacted which requires account to be taken of the unemployment rate in an area before relocat- ing military facilities, or proposals (ex., from the Joint Economic Committee) to permit the government to accept competitive bids above minimum (by 10%) if they come from areas of high unemployment.
More generally, there is a belief that the federal government's share of total economic activity has grown so large and its laws and
regulatory activities have become so pervasive that it influences in important ways what happens in the private sector of the economy. In this view, regional disparities (in growth rates or levels of well-being) are not unadul- terated market phenomena, the result of the pure working out of the regional economic efficiency calculus, but to a major extent they are related to the regional impact of federal activity. Even if federal activity is not amajor source of regional disparities, the belief is that such activity is capable of being reoriented to affect regional economic development.
Despite this focus on federal influences, generally on the part of the interested parties, most studies have concluded that the major determinants of differential regional economic growth are not public policies. Rather, the dominant importance of basic long-term forces is emphasized, e.g., adjustments to initial cost differences, technical change in transporta- tion and communications, or population movement (whether population movement precedes or follows the movement of jobs is, however, far from resolved). It would be er- roneous to assume, however, that the regional economic trends have been uniform over time or that the underlying forces have remained constant.'
Inevitably, the federal budget as well as regulatory activities have regional implica- tions. The extent and magnitude of their in- fluence, specifically, how regional growth rates would differ in the absence of federal policies or with a major restructuring of such policies, have not been determined. Clearly the many calls for abandoning "unconscious" regional policy (that which arises as a conse- quence of policies without regional intent but with regional effects) must be based upon the assumption that these unconscious or un- intended effects are quantitatively important.
In considering the possible federal influence on regional economic development, it should be remembered that regional economic shifts have been occurring over a very long period; federal expenditures were not a very large proportion of GNP; and regulatory behavior and tax laws have changed substantially during that history. Indeed, much of the attention now focused on federal policy re- flects the experience of the 1970s.
There are two aspects of federal influence which will be considered: (1) macro-economic policy, the extent to which the federal govern- ment succeeds in maintaining full employ- ment; (2) flow of funds to regions, that is, the extent to which individual regions or states receive more or less in federal expenditures than they pay in federal taxes.
MACRO-ECONOMIC POLICY
The various regions of the nation have been affected differently by the two recessions of the 1970s. The notion that economic slow- downs are not uniformly felt throughout the nation is not a new one. It has been formu- lated in terms of an industrial structure argu- ment, that is, different industries are well- known to be more or less sensitive to economic fluctuations. To the extent that industries which exhibit the greatest sensitivity are concentrated in given regions, these would feel the effects of economic fluctuations more severely than other regions. In particular, durable consumer goods and capital goods production-both concentrated heavily in the older industrial areas of the Northeast and Great Lakes states-fluctuate more than other manufacturing sectors' activities.
The 1970s' two recessions and the generally sluggish growth period between them may be responsible for the perceived increase in divergence of regional fortunes in the last few years. Seen in this light, macro-economic stabilization policy may be properly viewed as an important instrument of regional policy (if not in intent, certainly in effect). The targeting discussions, for example, in the countercyclical public works allocation for- mulas which take unemployment rates into account, recognize this reality.
Since national macro-economic policies are normally triggered, however, by statistics which measure national activity levels (ex., unemployment rates), subnational differences may not be adequately dealt with. If we think of the nation as two subnations, one growing steadily with some slowing in the rate during recessions, the other experiencing relatively high rates of unemployment and excess capac- ity during recessions, two very different

"macro" policies may be appropriate, pro- vided they could be implemented to avoid inflationary pressures in the boom region and deflationary pressures in the other.
The importance of aggregate growth for regional economies assumed importance be- fore political discussions of recent years un- derscored their relevance. For the last 25 years, at least, the Northeast and Midwest economies have been robust only when na- tional growth rates have been high. Other regions continue to grow, sometimes quite rapidly, even during recessions. Regional dif- ferences in growth rates have been smaller in periods of strong national expansion and wider during periods of severe economic slow- down.
The differences in annual growth rates of total personal income and nonagricultural employment among states and regions in the slow growth periods of the 50s and 70s far exceed the differences in the 60s. One mea- sure of this variation, the coefficient of varia- tion, is twice as large in the relatively low growth years as in the high growth years. Tables 10 and A12.
Personal Income This relationship may be seen even more
sharply in the behavior of nonfarm personal income during postwar business cycles. Dur- ing expansions, the lowest relative growth rates (in New England) have been about 89% of the average national growth rate.2 Table 27. The highest relative growth rates during expansions have been experienced by the Southeast, Far West, and Southwest states, with relative rates of 11396, 10876, and 109% of the national average.
During recessions (when aggregate personal income generally continues to expand albeit at a lower rate),3 the spread in relative growth rates in personal income is far larger. The Great Lakes states actually decline and the Mideast growth rate is only about 89% of the national average. In the South, South- west, and Far West, however, the rate of increase in personal income during recessions is one-and-one-half to two times that of the nation. Thus, although the postwar growth rates of the older industrial states have gen- erally fallen short of national growth rates, the relative disparities are far larger during
I Table 27
BEHAVIOR OF NONFARM PERSONAL INCOME DURING POSTWAR BUSINESS CYCLES, 1948-70
Mean Quarterly Index, US Average = 100
I Percent Changes Mean Quarterly at Annual Rate Percent Change
Postwar Postwar
I Annual In In Growth In In Regions Growth Rate Expansions Recessions Rate Expansion Contraction
United States 6.5% 7.6% 1.8% 100% 100% 100% I New England 6.1 7.1 2.0 9 4 93 105
Mideast 5.8 Great Lakes 6.0 Plains 6.3 Southeast 7.5 Southwest 7.4
I Rocky Mountain 7.0 7.4 5.2 108 97 2 74 Far West 7.4 8.3 3.7 114 109 195
- . --.-
'Since the percentage change was negative, the index number would be meaningless. SOURCE: Robert B. Bretzfelder. "Sensitivity of State and Regional lncome to National Business Cycles,'' Survey of current Business, April
1973. rearrangement of data in Table 1. p. 97.

- --
- Table 28
SELECTED CYCLICAL CHARACTERISTICS OF STATES
Figures indicate percentage declines in employment in states experiencing cycles. -indicates skipped cycles.
'-denotes one of ten states with largest absolute cyclical amplitude. I -indicates one of ten states with largest relative cyclical amplitude. #-indicates one of ten states with longest "return-to-peak" duration.
aGrowth ranking one to four (of 33 states) in pre-1960 cycles; growth ranking one to ten (of 47 states and Distric of Columbia) in post-1960 cycles.
b ~ a n k s among ten states with lowest share of total employment in manufacturing. C ~ o r e than 20% of the state's total employment was in agriculture for pre-1960 cycles; ranks among ten state: with largest share of employment in agriculture for post-1960 cycles.
d ~ a n k s among ten states with lowest share of manufacturing employment in durable goods
Region or State
UNITED STATES NEW ENGLAND AND MIDEAST
New England Maine New Hampshire Vermont Massachusetts
Rhode Island
Connecticut
Mideast New York
New Jersey
Pennsylvania
Delaware
Maryland District of Columbia
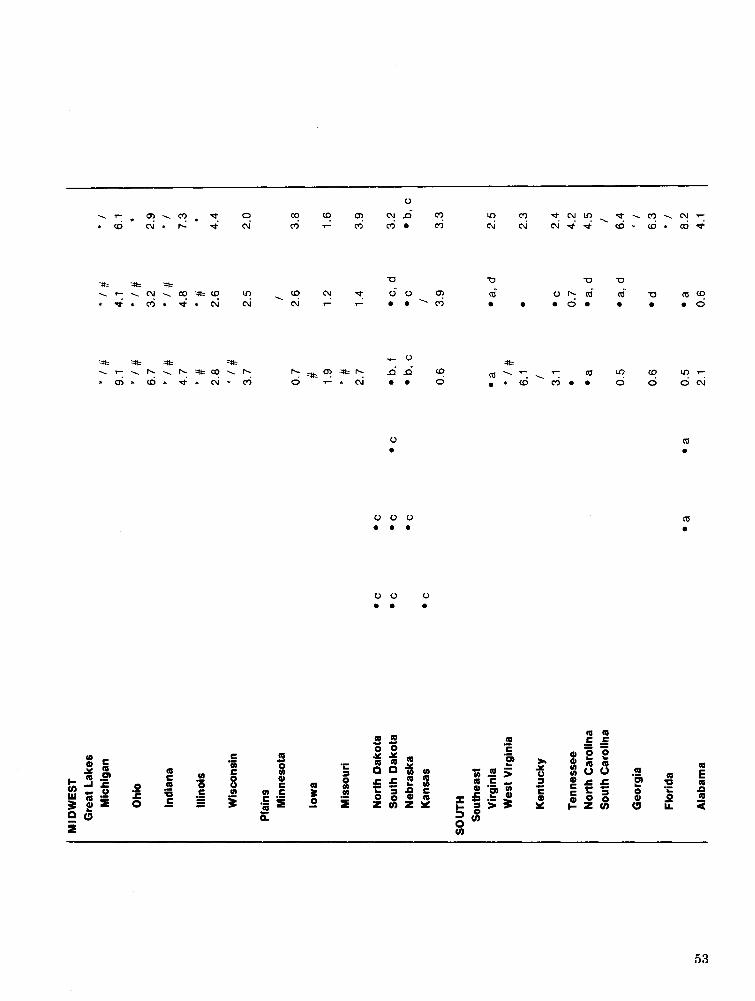


contractions than during expansions of the national economy.
Employment
Additional indicators of differential regional performance in relation to national employ- ment cycles exhibit similar t r a i k4 Table 28. The general conclusion is that the effects are more severe in the older industrial regions on all of these indicators-absolute or relative cycle amplitude, duration of the cycle, or the occurrence of the cycle at all: Indeed, in rela- tively mild downturns (as measured by na- tional aggregates), the effects are largely confined to these regions. Of all the New Eng- land, Mideast, and Midwest states, none, except for Maryland in 1970-71, skipped any of these cycles. (The District of Columbia, with its federal employment base, does skip most cycles.)
In the rest of the nation, many states skipped one or more cycles, depending upon the severity of the overall employment de- clines. In the Southeast and Southwest, these states are generally those which are among the most rapidly growing in the nation. In the Plains region, these are states with very little manufacturing employment. In the Rocky Mountain states, those which skip cycles are generally agricultural, nonmanufacturing, and/or rapidly growing. In particular, the effects of the very mild 1970-71 cycle were concentrated in the New England, the Mid- east, the Midwest, and to some extent, the Far West states. Indeed, this was more a re- gional than a national cycle. (The 1960-62 picture is very similar.)
A study by Syron also analyzes relative re- gional changes in nonagricultural employ- ment (as contrasted with total employment in the preceding table) and includes an addition- al downturn, 1973-75.5 Table 29. Very similar conclusions can be drawn about relative regional experiences over the cycle.6 Even though the Northeast and Midwest regions ex- perience substantially smaller improvements in nonagricultural employment during expan- sions than do the regions of the South and West, they fall even further behind during contractions.
If we omit the Rocky Mountain states, with their very small nonagricultural employment
I Table 29 I CHANGES IN REGIONAL EMPLOYMENT
RELATIVE TO NATIONAL CHANGE, DURING POSTWAR RECESSIONS
AND EXPANSIONS, 1948-75
Region
United States New England Mideast East North Central West North Central South Atlantic East South Central West South Central Mountain Far West
Average Average in Contractions in Expansions
SOURCE. Richard F. Syron, "Regional Experience During Busi- ness Cycles-Are We Becoming More Alike?". New England Economic Review. Boston, MA. Federal Re- serve Bank of Boston, NovernberIDecernber 1 978,
I Tables 3 and 5. I base, we find that during expansions the most rapidly growing region (on average)-the Far West-grew about 2.3 times faster than the most slowly growing region-the Mideast. During contractions, however, the East North Central region (the Midwest states) declined by 4.3 times the rate of the West South Cen- tral states and by 2.7 times the decline rate of the Southeastern states.' Thus, whether measured by employment or by personal in- come, the gaps between the more and less rapidly growing regions appear to be wider during contractions than during expansions.
Syron has also made separate computations for each of the six postwar expansions and contractions. From these, he concludes that interregional cyclical variation has increased over time, i.e., the experience of the regions during cycles has become more divergent. He computes a "summary statistic of variation" (the standard deviation of the relative growth or decline rates) for each of the contractions and expansions; the higher this figure, the more variation among regions. This measure indicates that during contractions divergence among the regions is increasing but no trend appears in expansions.
For purposes of this study, Syron's measure
THE RELATIONSHIP BETWEEN NATIONAL AND STATE GROWTH
Estimated equations relating state growth in employment to national employ- ment growth, for the years 1960 to 1974, indicate strong regional patterns. In a recent study, the following relationship was estimated:
t t+j e = a + P e + P ;
i i i n where ei is the growth rate of employment
in area i in month t Pi is the estimated coefficient relating na-
tional and local employment growth rates in area i
e nt+j is the monthly employment growth in the nation in month t + j
~r is a random disturbance term t = July 1960, . . . December 1974 j = -6, -3, -2, -1,0, 1.2, 3, 6 (leads or lags) (e's are three-month moving averages).
In these equations, estimated separately for each state and several labor market areas, the constant term a i, may be in- terpreted as the region's long-term (secular) growth rate independent of national growth. The coefficient, B i indicates the actual change in local employment which results from a 1% change in national em- ployment. The j values indicate whether and by how many months local changes lead or lag national changes. R2 indicates the conformity of the area to national pat- terns of employment change.
The results of these estimated equations indicate strong regional patterns for the state equations. In general, there is much higher conformity (R2 1 in the Mideast and Great Lakes states than in the rest of the nation. On average, national growth pat- terns in employment explain more than 50% of local employment growth in these two regions.
Conformity is lowest in the Rocky Moun- tain region; only 7% of the variation in local employment growth is attributable to national patterns; slight conformity ap- pears in the Southwest, 26%.
In the remaining regions, there is some conformity; just about one-third of the variation in employment in the Far West and Plains regions is explained by national variation. In the Southeast and in the New England regions, 42% and 43%, respective- ly, of the employment variation is explained by national growth rates.2
Thus, in general, the older industrialized regions of the nation are quite responsive to national growth patterns, a growing na- tional economy being required for local growth. In contrast, in the Rocky Moun- tain, Southwest and Western regions, ex- pansion continues even in the absence of national g r ~ w t h . ~
The importance of national growth to the older industrial regions may be made even clearer by looking a t the long-term secular trends, as indicated by the constant terms, a i, in these equations. Although no signifi- cant levels are provided by the authors, the consistency of, the regional patterns is striking.
In nine of 15 states of the New England. Midwest, and Great Lakes regions, the secu- lar trend is one of decline. This is true in only two of the remaining 31 state^.^ Thus, in more than half of the older industrial states, no national expansion means local contraction; in the rest of the country, growth (often substantial) continue^.^
FOOTNOTES 'Georges Vernez, Rogert Vaughan. Burke Burright, Sinclair Coleman, Regional Cycles and Employment Effects o f Public Works Investments, Santa Monica, CA, The Rand Corporation, January 1977.
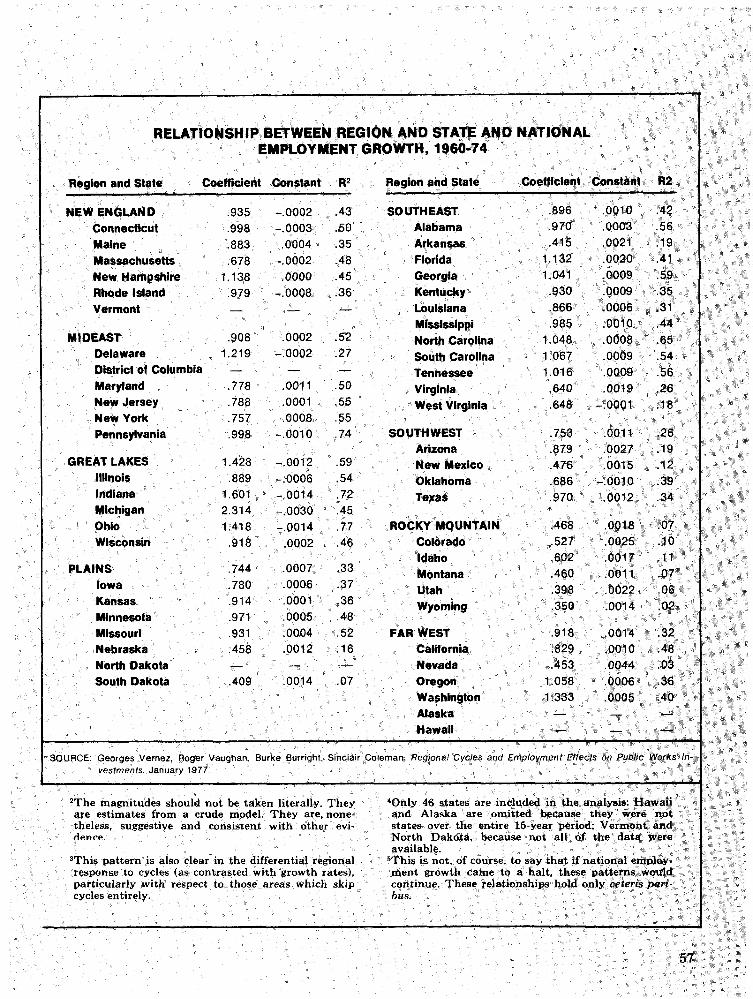
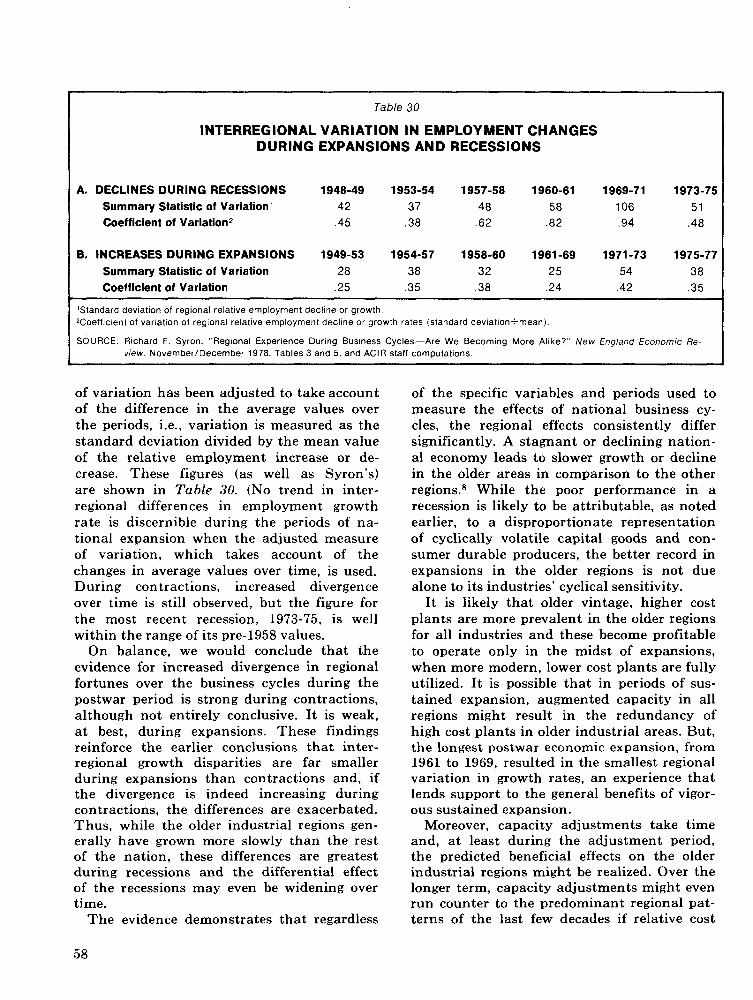
I Table 30
INTERREGIONAL VARIATION IN EMPLOYMENT CHANGES DURING EXPANSIONS AND RECESSIONS
A. DECLINES DURING RECESSIONS 1948-49 1953-54 1957-58 1960-61 1969-71 1973-75 Summary Statistic of Variation1 4 2 37 48 58 106 51 Coefficient of Variation2 .45 .38 .62 .82 .94 .48
B. INCREASES DURING EXPANSIONS 1949-53 195447 1958-60 1961 -69 1971-73 1975-77 Summary Statistic of Variation 28 38 32 2 5 54 3 8 Coefficient of Variation .25 .35 .38 .24 .42 .35
'Standard deviation of regional relative employment decline or growth. 2Coeffic~ent of var~ation of regional relative employment decline or growth rates (standard dev~at~on+mean).
SOURCE: Richard F. Syron, "Regional Experience During Business Cycles-Are We Becoming More Alike?" New England Economic Re- view. NovemberIDecember 1978, Tables 3 and 5. and AClR staff computatlons.
L
of variation has been adjusted to take account of the difference in the average values over the periods, i.e., variation is measured as the standard deviation divided by the mean value of the relative employment increase or de- crease. These figures (as well as Syron's) are shown in Table 30. (No trend in inter- regional differences in employment growth rate is discernible during the periods of na- tional expansion when the adjusted measure of variation, which takes account of the changes in average values over time, is used. During contractions, increased divergence over time is still observed, but the figure for the most recent recession, 1973-75, is well within the range of its pre-1958 values.
On balance, we would conclude that the evidence for increased divergence in regional fortunes over the business cycles during the postwar period is strong during contractions, although not entirely conclusive. I t is weak, a t best, during expansions. These findings reinforce the earlier conclusions that inter- regional growth disparities are far smaller during expansions than contractions and, if the divergence is indeed increasing during contractions, the differences are exacerbated. Thus, while the older industrial regions gen- erally have grown more slowly than the rest of the nation, these differences are greatest during recessions and the differential effect of the recessions may even be widening over time.
The evidence demonstrates that regardless
of the specific variables and periods used to measure the effects of national business cy- cles, the regional effects consistently differ significantly. A stagnant or declining nation- al economy leads to slower growth or decline in the older areas in comparison to the other region^.^ While the poor performance in a recession is likely to be attributable, as noted earlier, to a disproportionate representation of cyclically volatile capital goods and con- sumer durable producers, the better record in expansions in the older regions is not due alone to its industries' cyclical sensitivity.
I t is likely that older vintage, higher cost plants are more prevalent in the older regions for all industries and these become profitable to operate only in the midst of expansions, when more modern, lower cost plants are fully utilized. I t is possible that in periods of sus- tained expansion, augmented capacity in all regions might result in the redundancy of high cost plants in older industrial areas. But, the longest postwar economic expansion, from 1961 to 1969, resulted in the smallest regional variation in growth rates, a n experience that lends support to the general benefits of vigor- ous sustained expansion.
Moreover, capacity adjustments take time and, a t least during the adjustment period, the predicted beneficial effects on the older industrial regions might be realized. Over the longer term, capacity adjustments might even run counter to the predominant regional pat- terns of the last few decades if relative cost

changes which are more favorable to the older industrial'regions occur.
FEDERAL FLOWS OF FUNDS
As federal outlays have grown in amount, the regional flow-of-funds balance has as- sumed an increasingly prominent position in the national debate over the effect of the federal government on relative regional for- tunes. Already, a major change in a grant program formula (e.g., the addition of an age of housing stock variable to the Community Development Block Grant formula) has been brought about due to the attention given this issue. The Southeast, which "lost," appears to be organizing itself to fight additional "gains" of this type by the Northeast and Midwest.
The flow of funds to a region or state is calculated by adding all federal expenditures received by the area and subtracting from them all tax payments coming from the area. If the balance is positive, that is, the region is in surplus with the national government, the effect is regarded as economically stimu- lating to the region.
Proponents of this view seem to envision an analogy to the national economy. If the re- gion were not in deficit with the national government, local expenditures could be high- er-if the tax payment were lower, more could be spent on local consumption, including local government services. If federal expenditures were higher, the federal component would directly boost expenditures in the local econo- my and induce additional spending as well- local income and employment would be higher.
One objection to the inferences usually drawn from this analysis concerns leakages in and out of the area, i.e., to what extent would the lower taxes, for example, mean increased expenditures on the goods and ser- vices produced by the local economy vs. those produced elsewhere; similarly, to what extent are the surpluses in other regions spent on goods and services produced in the deficit region (both directly and indirectly)?
An additional objection is the extent to which the pattern of expenditures is a reflec- tion of efficiency conditions resulting in a larger overall gross national product (GNP) than would be obtained with a different pat- tern. Is regional economic activity stimulated more on balance by larger GNP (e.g., are the positive indirect purchases by others from the region greater than the negative deficit ef- fects) or by greater direct local expenditures? This is the basic question and it suggests that knowing the size of the surplus or the deficit on flow-of-funds account may provide little information about the effect of the combina- tion of federal expenditures and taxes on a region in an economy as integrated as that of the United state^.^
Although many concerned with federal- regional interaction have couched their argu- ments in terms of familiar, and perhaps mis- applied, aggregate demand arguments, a more sympathetic interpretation, focusing on the augmentation of productive capacity stimulated by positive flows of funds, might be made. While much current federal expendi- ture is redistributive in intent, a considerable fraction, ranging from educational support to procurement of military equipment and civil- ian goods, may contribute directly to addi- tions to the stock of physical capital (in the defense sectors and their suppliers) and to the growth of skilled labor supplies (via education and more importantly, the effects of learning by doing). ' O
Important organizational skills may also be learned by management. Even if the initial basis for the federal government spending decision was a particular institution's excel- lence, procurement based upon this initial advantage may further increase the discrep- ancy among regions. Conversely, the initially "backward" regions' capability to supply goods or fruitfully absorb federal outlays might have been strengthened by specific regional preferences (which have been fol- lowed in some programs).
Unfortunately, the role of federal expendi- tures in adding to regional supply abilities has not been widely investigated. Indeed, this is a difficult issue at the national level and has received only limited attention. Yet, given the inadequacies of the flow-of-funds analogy, on
the one hand, and, as we shall see, the strong association between flow-of-funds position and regional growth, on the other hand, an alternative approach emphasizing the supply side would seem a much more promising area of investigation for those concerned with re- gional discrepancies.
Within a normative framework, the demand that federal flows of funds should be in bal- ance, vis-a-vis particular states or regions, is inconsistent with the values which under- gird our fiscal system. The notion that im- balances are inequitable contradicts the redistributive objective of the public econ- omy,ll the principal instrument of which is the progressive income tax. Existing legisla- tion, presumably reflecting a consensus, re- quires those who have higher incomes to pay a higher proportion of their incomes to finance public sector expenditures. On the expenditure side there are many redistributive programs- redistributive to both lower income persons. e.g., income support programs and redistribu- tive to poorer places, e.g., the CDBG program and revenue sharing-which include local income in their allocation formulas.
With respect to procurement, federal policy seeks to minimize the cost of purchases of goods and, in general, competitive bidding and least cost site selection are followed.
The distribution of federal expenditures for fiscal years 1974-76 may be broken down as follows:12
Payments to personal incomes: Total ................................... 69.3%
Pay of federal personnel, military and civilian .......................... 19.3
Other payments to personal income ... 50.0 Military outlays except pay of personnel .... 10.7 Aid to state and local governments ......... 15.3 Interest on debt, other than payments to
personal incomes ....................... 3.5 All other expenditures .................... 1.2
.............................. Total 100.0%
Approximately 65% of this total-the "other payments to personal income," which include Social Security and other income support programs, and the aid to state and local governments-is, in part, redistributive to lower income persons and places. The re- maining 35%-which includes pay of federal
personnel both civilian and military, procure- ment expenditures, as well as interest on debt -has no purposive redistributional compo- nent and should thus bear little relation to per capita income.
Political influence, rather than efficiency, however, may be an important determinant of the distribution of the latter expenditures quite apart from equity or efficiency consid- erations. Certainly there is a substantial literature on the politics of federal expendi- tures, in particular, the influence of strate- gically placed members of Congress in deter- mining the locations of military installations and public works projects. This last issue looms large for those concerned with regional flow of funds.
Given these considerations, what should we expect the state or regional flows-of-funds balances to look like? The revenue side is fair- ly straight forward: given the progressive income tax (and the overwhelming dominance of personal tax receipts in federal revenues), if incomes are, on the average, higher in some states than others, we would expect tax pay- ments to be higher (both expressed in per capita terms). That is to say, we would expect equity principles to dominate the regional pattern of tax payments to the federal govern- ment.
The expenditure side is more complicated as about half are redistributive while the other half, procurement expenditures and wages and salaries, are not. Moreover, the redis- tributive component does not bear a simple relation to state per capita income. The size of federal payments to poor persons often depends upon the related state and local pro- grams available. In general, states with more generous public assistance programs receive in reimbursement higher payments than states which provide lower levels of public assistance.
On balance, New York State with a far higher per capita income than Mississippi, but with three times the number of poor per- sons, received more than nine times as many dollars in total federal welfare expenditures. Thus, equity considerations redistribute in- come to poor persons, but the amounts differ depending upon place of residence.
To return to the original question concern-

COMPARATIVE DATA, NEW YORK STATE AND MISSISSIPPI
Consider the states of Mississippi and New York: New York in 1975 had a per capita personal income which exceeded that of Mississippi by 62% and might, thus, be expected to receive smaller per capita federal aid. This was not the case. In 1976, New York received $181 in federal welfare spending per capita, compared
with $158 for Mississippi. The explanation for this difference lies in the fact that federal assistance is positively related to the level of state and local assistance. New York State's poor received $2,859 per person (federal plus state and local funds) and Mississippi's poor only $530. Thus, higher dollar payments are made to New York than to Mississippi by the federal government. However, the differences are not proportional and federal funds pay nearly 90% of Mississippi's welfare expenditures but only 50% of those of New York State.
Mississippi New York
1. Per Capita Income, 1975 2. Number of Poor Persons, 1970 3. Total Federal Spending
a) for poor persons, FY 76 b) per capita, 1975 c) per poor person, FY 76
4. State and Local Spending Per Poor Person 5. Total Federal, State, and Local Spending Per Poor Person, FY 76 6. Ratio of Federal to Total Government Spending Per Poor Person
SOURCE: AClR staff computations
$4,051 755,000
$353 million $1 58 $468
$62 $530 ,883
$6,564 2,208,000
$3,234 million $181
$1,465 $1,394 $2,859
,512
ing the relationship between federal expen- ditures and state incomes, we would not, as a result of the above considerations, expect even redistributive expenditures, like welfare, to bear a close (negative) relationship to state per capita income.
To recapitulate:
1. The discussion of federal flow-of-funds balances (as contrasted with discussions of particular categories of expenditures) focuses on revenue minus expenditures or the ratio of expenditures received to revenues paid. The implicit (often ex- plicit) expectation is that the two should be in balance as a matter of equity.
2. The most frequent rejoinder to this argu- ment is that we should not expect ex- penditures received and taxes paid to be in balance; our federal fiscal system is redistributive and, thus, we should ex- pect the poorer states or regions to re- ceive more than the relatively wealthier ones; that is, we should expect positive
balances (surpluses) in the poorer states and negative balances (deficits) or ratios of less than one. in the wealthier states.
3. Although the expectation of point 1 is clearly not warranted, the rejoinder of point 2 is insufficient. For one thing, although taxes may be expected to be positively related to income (that is, the wealthier states pay more and the poorer states less), the expenditure side is more complex, both in terms of the relation- ship of the explicitly redistributive ex- penditures to state incomes and of the nonincome related expenditures, pro- curement of goods and services, which will be determined by efficiency consid- erations and perhaps also by political influence. In addition, the arguments that surpluses or deficits in a state or region have expansionary or deflationary impacts on the local economy (in much the same way as national budget sur- pluses and deficits do on the national economy) or on its productive capacity
are not covered by either point 1 or point 2 and warrant further attention.
Estimates of federal flows-of-funds ratios for states and regions for selected years be- tween 1952 and 1976 have been prepared by I. M. Labovitz for this Commission study. The methodology and data are presented in the ACIR publication on regional growth con- cerned with the flow of federal funds. Table 31.
The allegation that federal revenue and expenditure patterns favor the Sunbelt states is certainly borne out by the data insofar as the indicator of favorable treatment is that a state (its residents) receives more from the federal government in expenditures than it pays in taxes. The Southeast, Southwest, Far West, and Rocky Mountain states have consistently received substantially more from the federal government than they have sent back in revenues. The Great Lakes, Mideast, and New England states generally receive far less than they provide in revenues to the fed- eral government. Over time, however, these differences have narrowed very substantially. Indeed, by the 1974-76 period the differences were smaller by far than they had been; re- gions with federal expenditure to revenue ratios of greater than one in 1969-71 had moved closer to equality between the two, as had those whose ratios had been less than one.
Revenues Revenues received by the federal govern-
ment from states (from their residents and businesses) are very closely related to their per capita incomes. The estimated statistical relationships between state per capita reve- nue payments and per capita incomes for the years 1952, 1960, 1970, and 1975 indicate that the differences among the states in per capita income explain between 67% and 93% of the observed variation in per capita revenue pay- ments.13 Charts 4- 7.
The statistical estimates indicate that the relative increase or decrease in state revenues per capita paid to the federal government has been more than proportional to relative in- comes. For example, in 1952, a per capita in- come of 1% greater than the national average resulted, on average, in a per capita revenue
payment to the federal government 1.5% greater than the national average. While pro- gressivity has fallen substantially over the period, it still exists. Thus, in 1975, the esti- mated relationship indicates that a per capita income 1% above the national average is asso- ciated with a relative per capita revenue payment 1.17% greater than the national average.
Using the estimated statistical relation- ships, we have also calculated the relative revenue payments assuming relative income 75% and 125% of the national average. For states at the lower level, federal tax payments per capita would have risen from 68% to 71% of the national average between 1952 and 1975; for those a t 12576, they would have fallen from 143% to 130%. Measured in this way, the tax system may be said to be less redistributive among states in 1975 than it was in 1952.14
Since state per capita incomes have con- verged over the period (see Chapter I I ) , actual tax collections per capita have become even less dispersed. This is quite clearly seen from the figures in Table 32. In 1952, federal reve- nues per capita in Mississippi were only 29% of the national average (the lowest in the nation), compared with revenues from the State of Delaware (the highest in the nation) which were 238% of the national average-an eight-fold difference. l5
By 1974-76 the difference between the low- est federal revenues paid per capita (still in Mississippi) and the highest (in the District of Columbia) had fallen to just over two-fold. The very substantial convergence in per capi- ta revenues paid, regionally and among states, is due almost entirely to the narrowing of regional and state per capita income differ- ences described earlier.
Expenditures The relationship between federal expendi-
tures per capita and incomes per capita in the states shows a more complex pattern over time than the revenue relationships.16 Charts 8-11.
In 1952 and 1960, there was a positive rela- tionship between per capita expenditures and per capita incomes, contrary to the pattern
(Text continues on page 75.)

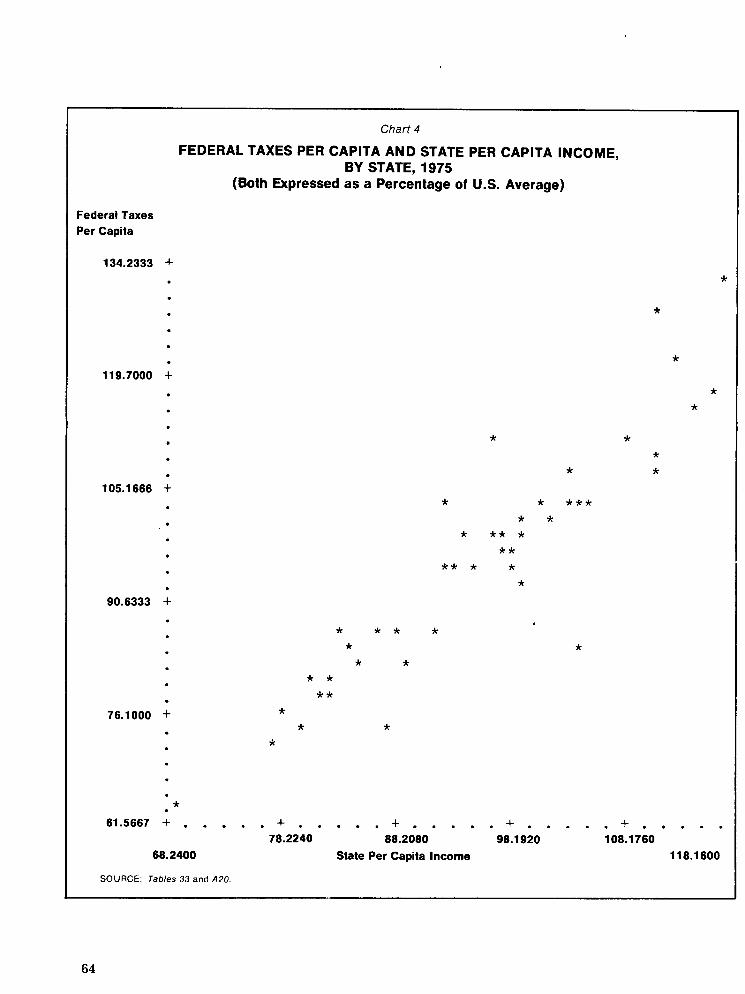
Chart 4
FEDERAL TAXES PER CAPITA AND STATE PER CAPITA INCOME, BY STATE, 1975
(Both Expressed as a Percentage of U.S. Average)
Federal Taxes Per Capita
6 1 . 5 6 6 7 + . . . . . + . . . . . + . . . . . + . . . . . + . . . . . 78.2240 88.2080 98.1 920 108.1 760
68.2400 State Per Capita Income 11 8.1 600
SOURCE: Tables 33 and A20
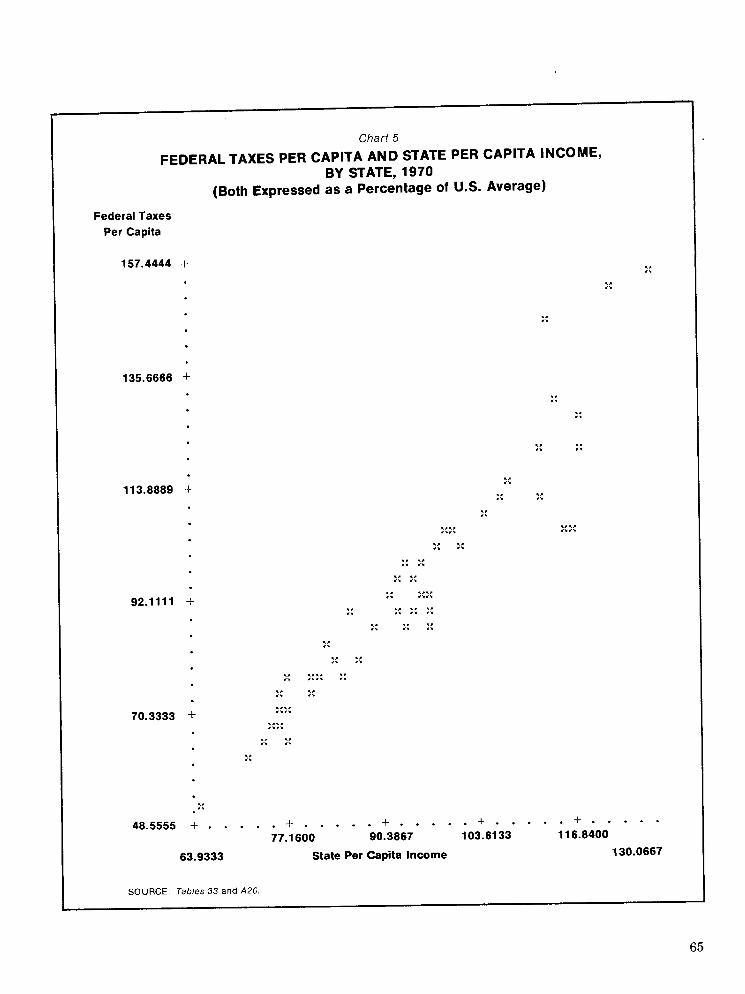
Chart 5
FEDERAL TAXES PER CAPITA AND STATE PER CAPITA INCOME, BY STATE, 1970
(Both Expressed as a Percentage of U.S. Average)
Federal Taxes Per Capita
., ,. 48.5555 + . . . . . + . . . . . + . . . . . + . . . . . + - . . . .
77.1 600 90.3867 103.6133 11 6.8400
63.9333 State Per Capita Income 130.0667
SOURCE: Tables 33 and A20.
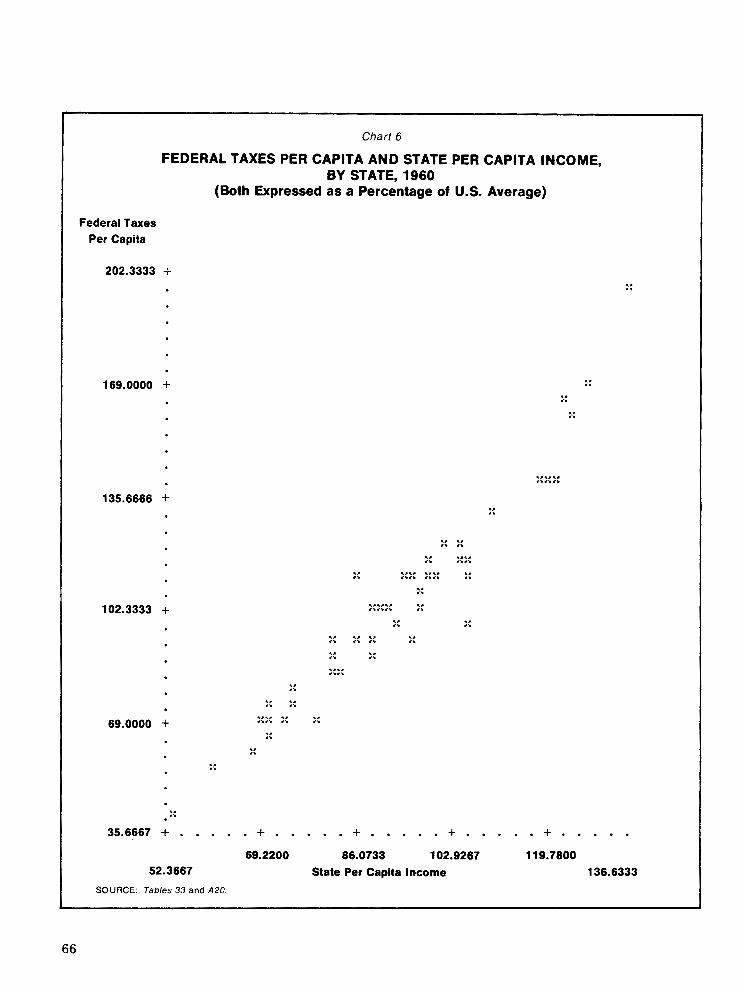
Chart 6
FEDERAL TAXES PER CAPITA AND STATE PER CAPITA INCOME, BY STATE, 1960
(Both Expressed as a Percentage of U.S. Average)
Federal Taxes Per Capita
69.2200 86.0733 102.9267 11 9.7800 52.3667 State Per Capita Income 136.6333
SOURCE. Tables 33 and A20.

Chart 7
FEDERAL TAXES PER CAPITA AND STATE PER CAPITA INCOME, BY STATE, 1952
(Both Expressed as a Percentage of U.S. Average)
Federal Taxes Per Capita
1 7 . 3 8 8 9 + . . . . . + . . . . . + . . . . . + . . . . . + . . . . . 69.0000 90.3333 11 1.6666 133.0000,
47.6667 State Per Capita Income 154.3333
SOURCE: Tables 33 and A20
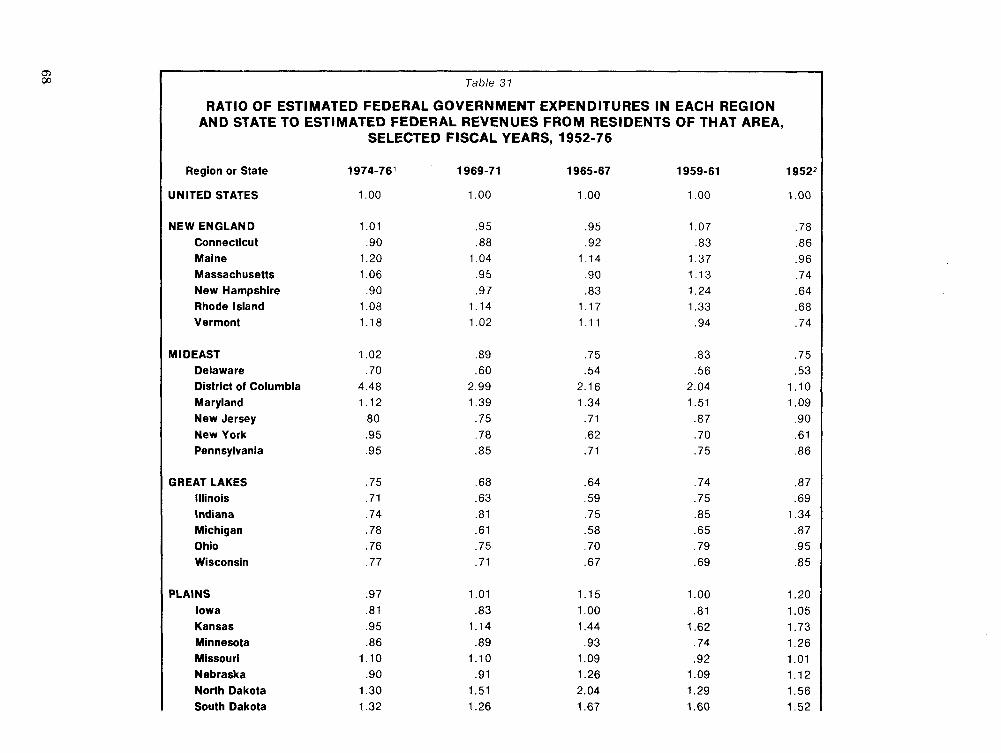
Table 37
RATIO OF ESTIMATED FEDERAL GOVERNMENT EXPENDITURES IN EACH REGION AND STATE TO ESTIMATED FEDERAL REVENUES FROM RESIDENTS OF THAT AREA,
SELECTED FISCAL YEARS, 1952-76
Region or State
UNITED STATES
NEW ENGLAND Connecticut Maine Massachusetts New Hampshire Rhode Island Vermont
M l DEAST Delaware District of Columbia Maryland New Jersey New York Pennsylvania
GREAT LAKES Illinois Indiana Michigan Ohio Wisconsin
PLAINS Iowa Kansas Minnesota Missouri Nebraska North Dakota South Dakota

SOUTHEAST Alabama Arkansas Florida Georgia Kentucky Louisiana Mississippi North Carolina South Carolina Tennessee Virginia West Virginia
SOUTH WEST Arizona New Mexico Oklahoma Texas
ROCKY MOUNTAIN Colorado Idaho Montana Utah Wyoming
FAR WEST California Nevada Oregon Washington
ALASKA HAWAII pp-~ ~- - - - -
Revised and adjusted (November 1978). 3mits Alaska and Hawaii (which were territories in 1952). lote: The ratios are der~ved by dividing for each state or region its estimated percentage of all allocated federal government expenditures by the
estimated percentage of federal government revenues contributed by its residents.
1OURCE. I. M. Labovitz for Advisory Commission on Intergovernmental Relations. July 14. 1978.

Chart 8
FEDERAL EXPENDITURES PER CAPITA AND STATE PER CAPITA INCOME, BY STATE, 1975
(Both Expressed as a Percentage of U.S. Average)
Federal Expenditures Per Capita
State Per Capita Income
SOURCE Tables 34 and A20

Chart 9
FEDERAL EXPENDITURES PER CAPITA AND STATE PER CAPITA INCOME, BY STATE, 1970
(Both Expressed as a Percentage of U.S. Average)
Federal Expenditures Per Capita
6 1 . 2 8 3 3 + . . . . . + . . . . . + . . . . . + . . . . . + . . . . . 76.6040 88.9347 101.2653 11 3.5960
64.2733 State Per Capita Income 125.9267
1 SOURCE: Tables 34 and A20.

Chart 70
FEDERAL EXPENDITURES PER CAPITA AND STATE PER CAPITA INCOME, BY STATE, 1960
(Both Expressed as a Percentage of U.S. Average)
Federal Expenditures Per Capita
* 5 6 . 0 3 3 3 + . . . . . + - . . . . + . . . . . + . . . . . + . , . . .
68.0860 83.5953 99.1047 11 4.61 40 52.5767 State Per Capita Income 130.1234
SOURCE. Tables 34 and A20

Chart 11
FEDERAL EXPENDITURES PER CAPITA AND STATE PER CAPITA INCOME, BY STATE, 1952
(Both Expressed as a Percentage of U.S. Average)
Federal Expenditures Per Capita
4 9 . 0 5 5 5 + . . . . . + . . . . . + . . . . . + a = a + * - * * -
67.0600 86.6866 106.31 33 125.9400
47.4333 State Per Capita Income 145.5667 SOURCE Tables 34 and A20

Table 32
INDEX NUMBERS OF ESTIMATED FEDERAL GOVERNMENT REVENUES PER CAPITA FROM RESIDENTS OF EACH REGION OR STATE, SELECTED FISCAL PERIODS, 1952-76
1974- 1969- 1959- 1974- 1969- 1959- Region or State 76 71 61 1952 Region or State 76 71 61 1952
UNITED STATES AVERAGE PER CAPITA INDEX NUMBER
NEW ENGLAND Connecticut Maine Massachusetts New Hampshire Rhode Island Vermont
M l DEAST Delaware District of Columbia Maryland New Jersey New York Pennsylvania
GREAT LAKES Illinois Indiana Michigan Ohio Wisconsin
PLAINS Iowa Kansas Minnesota Missouri Nebraska North Dakota South Dakota
SOUTHEAST Alabama Arkansas Florida Georgia Kentucky Louisiana Mississippi North Carolina South Carolina Tennessee Virginia West Virginia
SOUTH WEST Arizona New Mexico Oklahoma Texas
ROCKY MOUNTAIN Colorado Idaho Montana Utah Wyoming
FAR WEST California Nevada Oregon Washington
ALASKA HAWAII
'Omits Alaska and Hawaii (which were territories in 1952)
SOURCE I. M. Labovitz for Advisory Commission on Intergovernmental Relations. June 1, 1978.
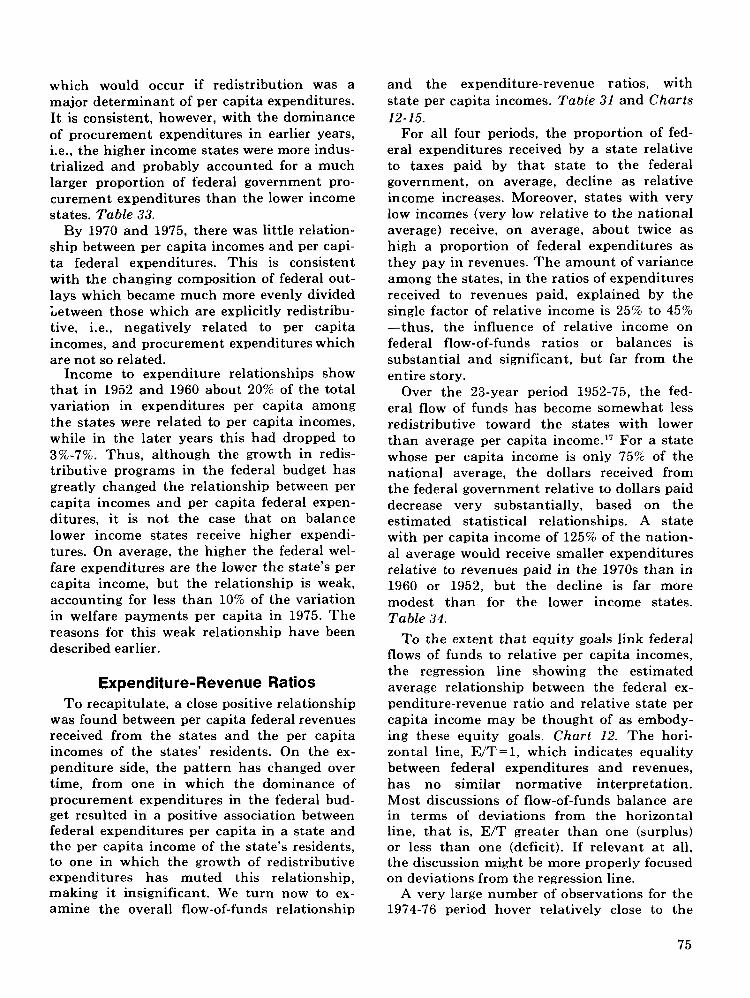
which would occur if redistribution was a major determinant of per capita expenditures. I t is consistent, however, with the dominance of procurement expenditures in earlier years, i.e., the higher income states were more indus- trialized and probably accounted for a much larger proportion of federal government pro- curement expenditures than the lower income states. Table 33.
By 1970 and 1975, there was little relation- ship between per capita incomes and per capi- ta federal expenditures. This is consistent with the changing composition of federal out- lays which became much more evenly divided Letween those which are explicitly redistribu- tive, i.e., negatively related to per capita incomes, and procurement expenditures which are not so related.
Income to expenditure relationships show that in 1952 and 1960 about 20% of the total variation in expenditures per capita among the states were related to per capita incomes, while in the later years this had dropped to 3%-7%. Thus, although the growth in redis- tributive programs in the federal budget has greatly changed the relationship between per capita incomes and per capita federal expen- ditures, it is not the case that on balance lower income states receive higher expendi- tures. On average, the higher the federal wel- fare expenditures are the lower the state's per capita income, but the relationship is weak, accounting for less than 10% of the variation in welfare payments per capita in 1975. The reasons for this weak relationship have been described earlier.
Expenditure-Revenue Ratios T o recapitulate, a close positive relationship
was found between per capita federal revenues received from the states and the per capita incomes of the states' residents. On the ex- penditure side, the pattern has changed over time, from one in which the dominance of procurement expenditures in the federal bud- get resulted in a positive association between federal expenditures per capita in a state and the per capita income of the state's residents, to one in which the growth of redistributive expenditures has muted this relationship, making it insignificant. We turn now to ex- amine the overall flow-of-funds relationship
and the expenditure-revenue ratios, with state per capita incomes. Tabie 31 and Charts 12-15.
For all four periods, the proportion of fed- eral expenditures received by a state relative to taxes paid by that state to the federal government, on average, decline as relative income increases. Moreover, states with very low incomes (very low relative to the national average) receive, on average, about twice as high a proportion of federal expenditures as they pay in revenues. The amount of variance among the states, in the ratios of expenditures received to revenues paid, explained by the single factor of relative income is 25% to 45% -thus, the influence of relative income on federal flow-of-funds ratios or balances is substantial and significant, but far from the entire story.
Over the 23-year period 1952-75, the fed- eral flow of funds has become somewhat less redistributive toward the states with lower than average per capita income.17 For a state whose per capita income is only 75% of the national average, the dollars received from the federal government relative to dollars paid decrease very substantially, based on the estimated statistical relationships. A state with per capita income of 125% of the nation- al average would receive smaller expenditures relative to revenues paid in the 1970s than in 1960 or 1952, but the decline is far more modest than for the lower income states. Table 34.
To the extent that equity goals link federal flows of funds to relative per capita incomes, the regression line showing the estimated average relationship between the federal ex- penditure-revenue ratio and relative state per capita income may be thought of as embody- ing these equity goals. Chart 12. The hori- zontal line., E / T = l , which indicates equality between federal expenditures and revenues, has no similar normative interpretation. Most discussions of flow-of-funds balance are in terms of deviations from the horizontal line, that is, E/T greater than one (surplus) or less than one (deficit). If relevant a t all, the discussion might be more properly focused on deviations from the regression line.
A very large number of observations for the 1974-76 period hover relatively close to the
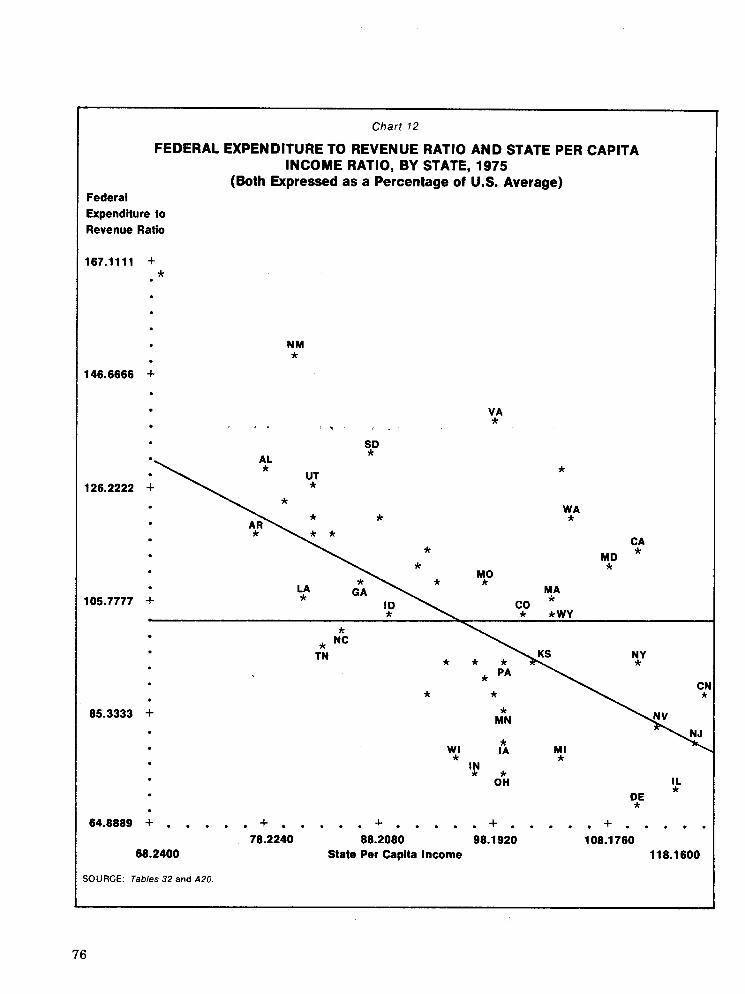
Chart 12
FEDERAL EXPENDITURE TO REVENUE RATIO AND STATE PER CAPITA INCOME RATIO, BY STATE, 1975
(Both Expressed as a Percentage of U.S. Average) Federal Expenditure to Revenue Ratio
.. '?iE
64.8889 + . . . . . + . . . . . I . . . . . + . . . . . + . . . . .
78.2240 88.2080 98.1 920 108.1760 68.2400 State Per Capita Income 118.1600
SOURCE: Tables 32 and A20
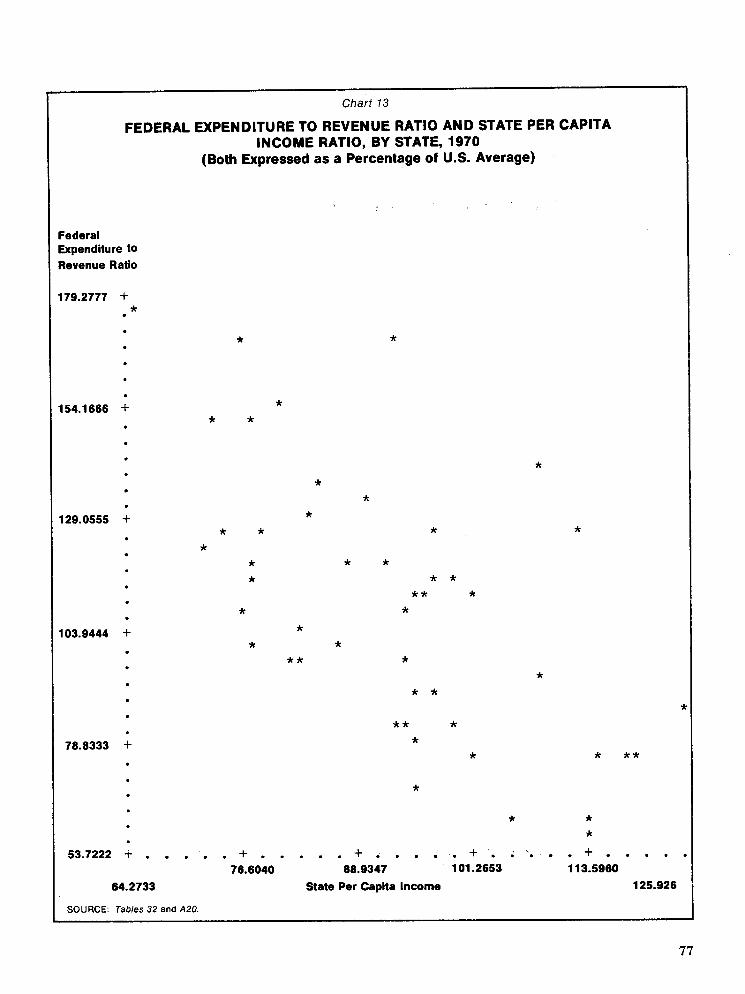
Chart 13
FEDERAL EXPENDITURE TO REVENUE RATIO AND STATE PER CAPITA INCOME RATIO, BY STATE, 1970
(Both Expressed as a Percentage of U.S. Average)
:ederal 5penditure to ?evenue Ratio
State Per Capita Income 125.926
SOURCE: Tables 32 and A20.
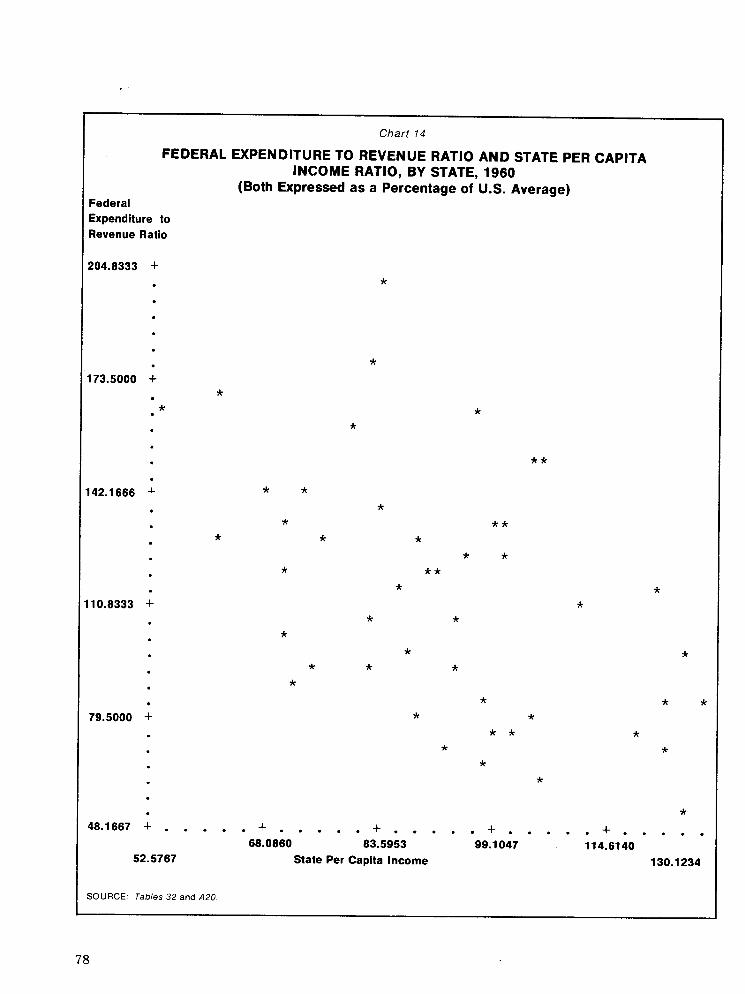
Chart 14
FEDERAL EXPENDITURE TO REVENUE RATIO AND STATE PER CAPITA INCOME RATIO, BY STATE. 1960
(Both Expressed as a percentage 0f.u.s. Average) Federal Expenditure to Revenue Ratio
52.5767 State Per Capita Income 130.1 234
SOURCE- Tables 32 and A20.

Chart 75
FEDERAL EXPENDITURE TO REVENUE RATIO AND STATE PER CAPITA INCOME RATIO, BY STATE, 1952
(Both Expressed as a Percentage of U.S. Average) Federal Expenditure to Revenue Ratio
47.4333 State Per Capita Income
SOURCE: Tables 32 and A20.
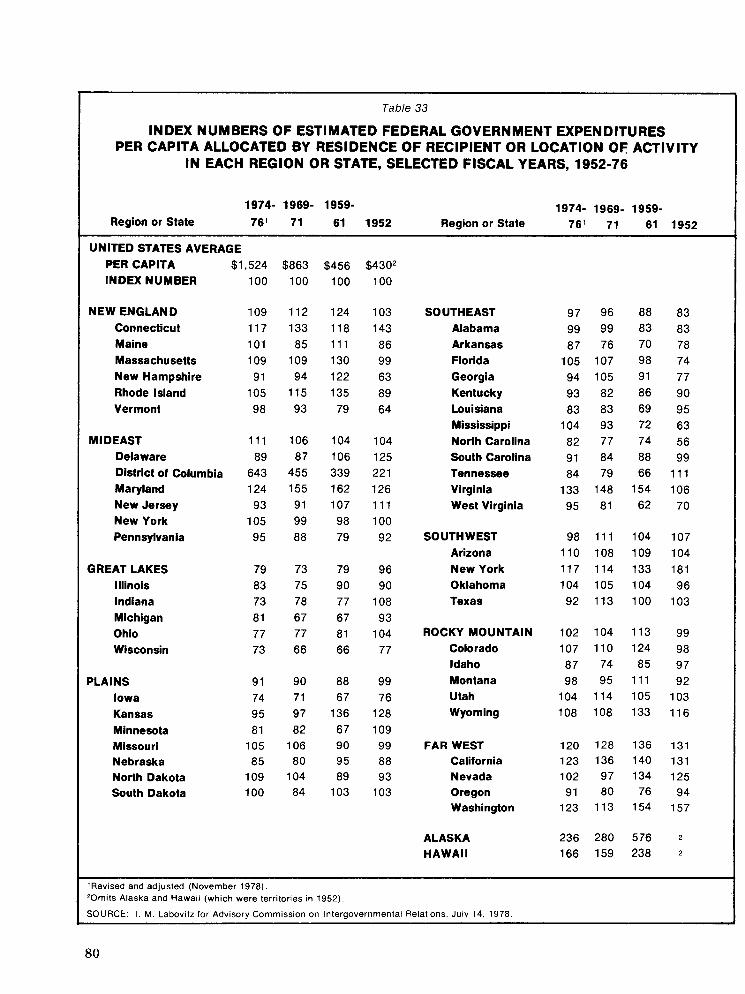
Table 33
INDEX NUMBERS OF ESTIMATED FEDERAL GOVERNMENT EXPENDITURES PER CAPITA ALLOCATED BY RESIDENCE OF RECIPIENT OR LOCATION OF: ACTIVITY
IN EACH REGION OR STATE, SELECTED FISCAL YEARS, 1952-76
1974- 1969- 1959- 1974- 1969- 1959- Region or State 76' 71 61 1952 Region or State 76' 71 61 1952
UNITED STATES AVERAGE PER CAPITA $1.524 INDEX NUMBER
NEW ENGLAND Connecticut Maine Massachusetts New Hampshire Rhode Island Vermont
M l DEAST Delaware District of Columbia Maryland New Jersey New York Pennsylvania
GREAT LAKES Illinois Indiana Michigan Ohio Wisconsin
PLAINS Iowa Kansas Minnesota Missouri Nebraska North Dakota South Dakota
SOUTHEAST Alabama Arkansas Florida Georgia Kentucky Louisiana Mississippi North Carolina South Carolina Tennessee Virginia West Virginia
SOUTH WEST Arizona New York Oklahoma Texas
ROCKY MOUNTAIN Colorado Idaho Montana Utah Wyoming
FAR WEST California Nevada Oregon Washington
ALASKA HAWAII
'Revised and adjusted (November 1978). 20mits Alaska and Hawaii (which were territories in 1952)
SOURCE: I. M. Labovitz for Advisory Commission on Intergovernmental Relations. July 14. 1978.

I Table 34
ESTIMATED FEDERAL EXPENDITURE-REVENUE RATIO FOR A STATE AT THREE ASSUMED LEVELS OF RELATIVE PER CAPITA INCOME
If Stale Income: 1952 1960 1970 1975
a) Equals National Average 1.160 1.090 1.050 .990
b) Is Only 75% of National Average 1.560 1.315 1.350 1.265
c) Is 1.25 Times National Average .760 ,865 ,750 .715
SOURCE: ACl R staff computations.
Figure 2 LARGE SURPLUSES AND DEFICITS ON FEDERAL FLOW OF FUNDS,
1960,1970,1975'
1975 Low2 Income States New Mexico
Virginia
Mississippi Arizona North Dakota
High2 Income States Hawaii Maryland California Washington
Wyoming Colorado
Low Income States Wisconsin Indiana
Ohio North Carolina
High Income States Iowa Michigan
LARGE SURPLUSES 1970
New Mexico Virginia
Mississippi Utah
Hawaii Maryland California
LARGE DEFICITS Wisconsin
Michigan
1960 New Mexico
Virginia South Dakota South Carolina
Kansas Hawaii Maryland California Washington
Wyoming
Wisconsin Minnesota West Virginia Louisiana Vermont lowa Michigan Pennsylvania Delaware
-- --
'Large surpluses and de f~c~ ts are def~ned as plus and mlnus two standard dev~at~ons or more from the regression hne 2H~gh and low Incomes are measured as above and below the natlonal lncome per caplta
SOURCE AClR staff computatlon based on Tables 32 and A20

regression line: West Virginia, Georgia, Illi- nois, and New York lie nearly on the line. Chart 12. Yet, West Virginia and Georgia are well above the horizontal line (they receive substantially more in federal government ex- penditures than they pay in taxes) whereas the reverse is the case for Illinois and New York. In terms of the analysis presented, however, these differences are fairly well "explained" by their differences in per capita income.
No similar explanation emerges for Indiana, Wisconsin, Ohio, Iowa, and Michigan, all of which lie well below the regression line. They are not only in deficit (in the flows-of-funds sense) but the deficit cannot be attributed largely to their relative incomes. North Caro- lina, which received in expenditures about what it paid in taxes, exhibits an equally anomalous position (assuming the federal budget was set with distributional aims). Given the state's relatively low income, North Carolina would be expected to show higher federal expenditures relative to taxes paid.
A substantial number of higher and lower income states appear to be receiving large surpluses (two or more standard deviations above the regression line). Figure 2 and Chart 12. Almost without exception, these are Southern and Western states (Maryland be- ing the only exception and its link to the District of Columbia is the dominant influ- ence). The states with large deficits are simi- larly regionally concentrated, largely in the Great Lakes or Plains states.
Similar patterns can be seen throughout the period covered by the analysis. Figure 2. Although not identical from year to year, the same states do generally turn up in the same positions: Michigan, Wisconsin, Iowa, with very large deficits; Maryland, Hawaii, Cali- fornia, New Mexico, Virginia, with large surpluses.
THE IMPACT OF FEDERAL FLOWS OF FUNDS ON REGIONAL GROWTH
Undoubtedly, some combination of effi- ciency, equity, and political considerations is influencing the observed pattern of federal expenditures in the states; equity considera- tions alone do not dominate. The effect of
the tax-expenditure deficits or surpluses on the state or regional economies is an impor- tant one irrespective of the explanation of the determinants of expenditures.
Over the last 25 years the most rapidly growing states of the Southeast and the Southwest have received substantially higher payments from the federal government (trans- fers, procurement, grants) than their resi- dents have paid to the federal government in taxes and other revenues. The opposite pat- tern is generally characteristic of the more slowly growing states of the New England, Mideast, and Great Lakes regions.
A classification of states by economic growth variables and the federal expenditure to revenue ratios provides additional insights on the relationship of federal government ac- tivity and state economic growth trends. Table 35. Nationally, per capita income (in current prices) in 1975 was nearly four times what it had been in 1950. For states with ex- penditure to tax ratios of .80 or less, the aver- age ratio of 1975 per capita income to that in 1950 was only 3.57. Moreover, not one of the five states in this group had a per capita in- come change over the period which exceeded the national average. For states a t the other extreme-where the ratio of federal expendi- tures to revenue collected from the state was 1.25 or more-the average per capita income in 1975 was 4.61 times what it had been in 1950. In 13 of the 16 states in this group, the growth in per capita income exceeded the national average.
Remarkably, of all the states with higher than national average increases in per capita income, half had expenditure to tax ratios of 1.25 or more; none had ratios of less than .80. The picture is very similar when the figures are computed for average total personal in- come increases in the states. Table 35. The greater the federal expenditure to tax ratio, the larger on average is the growth in total personal income over the 25 years.
From this evidence, it is clear that the argu- ment that there is a causal connection be- tween high state growth rates and positive state balances of payments with the federal government cannot be rejected out of hand. It is also true, however, that such connection has not been demonstrated.

Table 35 I I SUMMARY RELATIONSHIPS OF FEDERAL FLOW-OF-FUNDS BALANCES
AND STATE ECONOMIC GROWTH RATES, 1950-75
Federal Expenditures1
Federal Revenues <.80 .80<.90 .90<1.10 1.10<1.25 >1.25
-
Number of States* Average State Per Capita Income
Growth: 1950-75 Range Percent of States in Group with Greater
Than Average National Growth2 Percentage of All States with Greater
Than National Growth in Group Average State Total Personal Income
Growth: 1950-75 Range Percent of States in Group with Greater
Than Average National Growth3 Percentage of All States with Greater
Than National Growth in Group
'Not including Alaska and Hawaii. 'Average of state ratios for 1952, 1959-61. 1969-71. 1974-76. ZNational growth in per capita income over the period 1950 to 1975. 3.99 tlmes. 3National growth in total personal income over the period 1950 to 1975. 5.56 times
Further Examination of Flow-of-Funds Effects
We are still very far from having the kinds of models, theoretical or empirical, from which estimates of the overall effects on states of the pattern of federal expend.itures and revenue collections could be made. A simple way of evaluating the analogy to national macro-economic effects is to consider the ex ante equilibrium condition of a simple re- gional income determination model, namely,
I+G+E=S+T+M, where I is investment, G is federal govern- ment expenditure on national income ac- count, E is exports, S is private saving, T is tax payments to the federal government, and M is imports.18
If, ex ante, I, E, S, and M were in equili- brium at a given level of regional income, then T > G (tax payments to the federal govern- ment greater than expenditures made by the federal government in the region) would in- deed reduce this level. Clearly, the difficulty with this simple view is that federal activity
will affect private investment (I) and exports (E) as well. Thus, a state's high level of ex- ports (E) may be attributable to purchases from local industries which are suppliers of primary government contractors in another state. Or, private investment (I) may be greater as capacity is built to augment the production of the local suppliers. The exam- ples can be multiplied for each of the ele- ments, I, E, S, and M: each is a function of private and government activity in other regions.
Whereas for the national economy, the levels of I and E and the parameters deter- mining S and M are, to a first approximation, independent of G and T, this is not true for a state or region. Alternatively, if the United States were itself part of a larger economic entity (e.g., like the European Economic Community), the federal government's full employment surplus would provide no infor- mation about the effects of the joint fiscal activities of all member countries on the United States' national product. We would

need to know, for example, whether govern- ment expenditures in Japan and Germany lead to export of American goods and services. Substitute Texas and California for the for- mer two and New York and Ohio for the latter and the analogy is clear. The focus on the T, G relationship is a misapplication of the full employment surplus concept to a sub- component of the national economy.
A model which more correctly specifies com- plicated regional interactions and emphasizes dynamic adjustments to changes in demand has recently been constructed by Oakland and Chall.lg Not only are the indirect de- mands by one region for the products of another incorporated, but the model also considers the supply capacity of the local economy to meet changes in demands for its output, as well as the effects of capacity utilization on investment. Thus, for example, an increase in expenditures by the federal government, in a region in which no addi- tional output is possible in the short run, will result in an increase in production in some other region. If these demands continue to exceed local capacity, investment will gradually occur to augment the region's capacity and reduce the spillover of demand to other regions.
The authors use their model to estimate the implications of balanced shifts of federal expenditures from one region to another, ex., a decrease in the South matched by an identi- cal increase in the Northeast. They argue that it is not possible to estimate the overall effects of the federal budget since that would require envisioning the system with and with- out a government sector and conclude that the latter makes no sense. One alternative would be a comparison of the current regional implications of the federal budget with a locationally neutral budget, an entity they find impossible to define.20
A total of 16 different simulations are worked through-shifts of four different types of expenditures [federal expenditures (i.e., procurement), federal grants-in-aid, federal transfer payments, and total federal outlays] are combined with four sets of regional shifts (from the South or the West to the Northeast or to the Midwest). Although the magnitudes of the effects of each of these expenditure
change combinations differ, the general out- comes are:
The initial change in gross output and income in each region, in the first year, is very small. The longer term (over five or ten years) rise in income in the region when expen- ditures are increased is far less than the change in federal expenditures; the losses in income in the region when expendi- tures are transferred are far less than the expenditure transfer. Transfers from either the South or the West to the Midwest create losses in the Northeast while transfers to the North- east produce losses in the Midwest.
This pattern of adjustments results from two principal factors: initially the South and West do not have income or output declines due to expenditure shifts away from them since they were facing excess demands. Thus, as the federal expenditures in these regions decline, productive capacity can be used to meet other demands which have "spilled- over" in the past to the Northeast and the Midwest. Further, the increase in direct orders placed by the federal government in the Northeast and Midwest is largely offset by these reductions in spillovers from the South and West.
Over the longer period, however, as the excess supply conditions in the Midwest or the Northeast decline, investments in new capac- ity will be higher than they would otherwise have been. This investment increases output via the multiplier and the increase in capacity in the Northeast (Midwest) increases its share of the spillovers from the South (West) and reduces the share of spillovers captured by the Midwest (Northeast).
I t should be noted that in this model, the principal interactions among the regions occur because of these demand spillovers to regions of initial underutilization of capacity. They completely dominate the kinds of inter- relationships usually discussed, that is, the demands from one region for the outputs of other regions, either by consumers or busi- nesses.
If these assumptions about excess demands and supply are too extreme, that is, if the South and West are not suffering in fact from as severe a capacity shortage as assumed,

then the spillovers would be much smaller initially. Thus, the expenditure transfers from the South or West to the North or Mid- west would result in increases (or decreases) in income and output more similar in magni- tude to the transfer size.
Oakland and Chall have also analyzed the implications of the assumed expenditure shifts for the regions using the more traditional export base model, which assumes that the regions face no capacity constraints, i.e., they can meet any output level demanded. Not surprisingly, they find the region's output gain or loss is nearly equal to the federal transfer of expenditures and that the indirect effects on the other regions (through inter- mediate demands) are very small. Thus, a $1 billion shift in federal expenditures from the South to the Northeast would result in nearly a $1 billion loss for the South and a $1 billion gain for the Northeast. There would also be some impact on the other regions; in this case, for example, a very small $17 million increase in the gross regional product of the West and a small $16 million decrease in the Midwest.
The authors are undoubtedly correct in arguing that capacity constraints may limit the ability to respond to changes in demands and that excess supply and demand condi- tions change over time through investment which adds to capacity. I t is appropriate that these factors be incorporated into any model used to analyze the implications of demand shifts among regions. Since the validity of the key assumptions (about initial levels of ex- cess supply and demand and about the ability of the excess supply regions to meet spillover demands from the excess demand regions) has not been demonstrated, the model's re- sults are interesting but cannot be taken as definitive, in terms of either magnitude or interrelationships.
In another recent study, Holmer estimates the regional effects of federal expenditures and taxes by calculating the effects of a bal- anced budget increase of $1 billion in federal procurement and construction expenditures, matched by an increase in federal taxes. The initial expenditure increases "are assumed to have the same regional and industrial com- position as total expenditures," and the "tax increase is accomplished by a flat percentage surcharge on income tax liabilities."2l
The regional implications are derived for 1975 using a set of regional input-output tables to work through the effects of the in- creased tax payments in reducing local, inter- industry, and nonlocal demands, and the effects of the increased expenditures on in- creasing local and nonlocal demands. Con- sistent with the balanced budget multiplier model, the overall national effect is to in- crease demand and employment. The net increase in national employment is about 60,000 jobs (a reduction of 67,450 due to the tax increase and a n increase of 127,170 due to the expenditure increases). Table 36.
Despite these overall national gains, Indi- ana and Illinois show a slight decrease in their total employment. All other states or state combinations show an absolute increase, but these vary substantially in absolute and relative magnitude. T h e largest gainers in absolute terms are Louisiana, Hawaii, Ore- gon, Washington, and California. New York, New Jersey, Pennsylvania, Ohio, and Michi- gan gain employment, but just barely (they absorb a far higher proportion of the job de- creases than of the job increases).
The last column of Table 36 makes the regional distinctions most clear; it describes how the ratio of employment increases to em- ployment decreases for each state or state combination compares with the national average ratio of employment increase to de- crease. The upper half of the table covers state and state combinations in the Northeast and Midwest: in nearly every case the gains are below the national average. In the South and West (the bottom half of the table), the reverse is true, the gains are above the nation- al average.
A study by Polenske has attempted to esti- mate the percentage of total labor earnings in a region which may be attributed to federal government expenditure^.^^ The estimates are based upon final demands in 17 regions, one of the final demands being federal govern- ment purchases. The study uses the national input-output tables and local employment, by industry, to produce the estimates. These are crude calculations: they are not based upon regional input-output relationships; the data used to estimate final demands in each of the regions are not identical; the interre- gional flows are only implicit; and there is no

way of knowing how much of a region's total labor earnings may be attributable to the indirect demands of another region which re- sult from federal purchases. For all these reasons, the percentages estimated should be considered only suggestive.
The findings of this study for 1947, 1958, and 1962 support the generally perceived re- gional differences in the effect of federal expenditures. Table 37. The 1958 and 1962 figures, being more typical of the pattern after World War 11, are probably more interesting for present purposes than those for 1947. The
highest proportions of total labor earnings deriving from the federal government are in the West, regions 13-17 on the table, and the lowest proportions are in the Midwest, regions 4 and 5. New England and the Southern states are generally somewhat above the na- tional average and the Mideastern states, regions 3 and 4, are substantially below the average. The magnitudes of difference are large. In California and Nevada, about 25% of labor earnings are attributable to the fed- eral government, compared with about 10% in Minnesota, Wisconsin, and Michigan.
Table 36
EMPLOYMENT CHANGES RESULTING FROM $1 BILLION DECREASE IN TAXES, $1 BILLION INCREASE IN FEDERAL PROCUREMENT
AND CONSTRUCTION EXPENDITURES Percent Change
Over Previous Level
Tax Expenditure Employment Relative Regions, States, Induced Induced Increase Increase to U.S.
or State Combinations Decrease in Increase in Less - Average
Employment Employment Decrease Decrease Change
New England New York New Jersey, Pennsylvania Ohio, Michigan Indiana, Illinois Wisconsin, Minnesota Iowa, Missouri Kansas, Nebraska, South Dakota, North Dakota Delaware, District of Columbia, Maryland Virginia, West Virginia North Carolina South Carolina Georgia Florida Kentucky, Tennessee Alabama Mississippi Arkansas, Oklahoma Louisiana Texas Alaska, Arizona, Colorado, Idaho, Montana,
Nevada, New Mexico, Utah, Wyoming Hawaii, Oregon, Washington California United States Total
SOURCE AClR computations and reorganization of estimates made by Martin Holmer, "Preliminary Analysis of the Regional Economic Effects of Federal Procurement." paper presented at the Committee on Urban Public Economics Meeting, May 5-6, 1978, pp. 13-14.

PERCENTAGE OF TOTAL LABOR EARNINGS GENERATED BY FEDERAL GOVERNMENT PURCHASES, 1947,1958,1962
ACTUAL YEAR DATA*
Region States New England New York New Jersey, Pennsylvania Ohio, Indiana, Illinois Minnesota, Wisconsin, Michigan North and South Dakota, Kansas, Iowa,
Nebraska Georgia, North and South Carolina Maryland, Virginia, West Virginia,
Delaware, District of Columbia Florida Kentucky, Tennessee Mississippi, Alabama, Louisiana Arkansas, Oklahoma, Missouri Texas Idaho, Montana, Wyoming Utah, Colorado, New Mexico, Arizona Oregon, Washington California, Nevada Total
Actual Year Data
1947 1958 1962
Relative Change
(1 962-1 947) 60% 18 29 3 6 48
10 -14
-1 3 -3 2 -1 3 - 2
15 20 20 66 15 2
16
'Before calculating the percentages for each region, the direct labor earnings are added to the labor earnings generated directly and indirect- ly by the final purchases of goods and services.
SOURCE. Karen R. Polenske, Shifts in the Regional and industrial Impact of Federal Government Spending, Washington, DC. U.S. Depart- ment of Commerce. March 1969. mimeo. Table 3.
Thus, three separate studies addressing different aspects of the question of the region- al effect of federal spending all produce quali- tatively similar findings, albeit subject to reservations as to model and data adequacy. Many Southern states and most Western ones gain substantially more from the existing pattern of federal expenditures than do the Mideast and the Midwest states, as measured by the proportion of total labor earnings in the region attributable to federal expenditures in the Polenske study. In terms of employ- ment gains, in the Holmer study, the South and the West benefit far more than average from a balanced budget increase in federal procurement and construction expenditures (matched by an equivalent increase in taxes) while the Mideast and the Midwest benefit
far less than average. The Oakland-Chall study, which considers shifts in federal ex- penditures from one region (the South or the West) to another (the Northeast or the Mid- west) shows that over a five to ten-year in- terval the regions in which expenditures in- creased would experience a growth in gross regional output. The reverse would be true for regions in which expenditure was de- creased. In both cases, however, the magni- tude would be smaller than the expenditure shift. I t indicates further that gains in the Northeast (the Midwest) are made in part at the expense of the Midwest (the Northeast).
None of these studies tell us, on balance, how much of the recorded past divergence in regional growth patterns can be attributed to differences in overall federal flows of funds.
They do, however, appear to sustain the be- have substantially greater positive effects on lief that federal expenditure-revenue patterns the states of the South and the West than on have differential regional effects; that they those of the Northeast and the Midwest.
FOOTNOTES
'See, for example, Jeffery G. Williamson. "Inequity, Accumulation and Technological Imbalance: A Growth- Equity Conflict in American History?", Economic De- velopment and Cultural Change, Chicago, IL, Univer- sity of Chicago, Vol. 27, No. 2, January 1979.
2Robert B. Bretzfelder, "Sensitivity of State and Re- gional Income to National Business Cycles," Survey o f Current Business, Washington, DC. U.S. Department of Commerce, April 1973. T h e data cover the period from 1948-IV through 1970-IV. They do not include the 1973-75 recession.
T h i s is not true for employment. 4These data are compiled from a study by George Ver- nez, Roger Vaughan, Burke Burright, and Sinclair Coleman. Regional Cycles and Employment Effects o f Public Works Investments, Santa Monica, CA, T h e Rand Corporation, January 1977.
5Richard F. Syron, "Regional Experience During Busi- ness Cycles-Are We Becoming More Alike?", New Eng- land Economic Review, Boston, MA, Federal Reserve Bank of Boston, November/December 1978.
'jNote that when measured in employment terms, reces- sions mean absolute national declines. Therefore, in Table 29, the higher the index value the worse the re- gion's performance, that is, its employment declined faster than the national average declined.
7Note that the picture is not qualitatively changed if in fact the Rocky Mountain states are included. They increased their employment during expansions a t 2.9 times the rate of the slowest growing region and during contractions, the largest regional percentage decline in nonagricultural employment is six times that of the Rocky Mountain states.
8Estimates of the relationship between national and state rates of employment change have been made by Vernez, et al. They are discussed in the appendix to this section. 9A further consideration, quite apart from the issues raised with respect to leakages and the net effects of being part of a highly integrated national economy, is tha t the observed surpluses and deficits are ex post results and the question of whether or not the policy is stimulating or inhibiting, with respect to income and employment, cannot be directly or simply inferred from the observed surplus or deficit. Consider a n economy in which policy is highly deflationary, that is, govern-
17Despite the changes in the average relationship between expenditure-revenue ratios and per capita income. which should have resulted in greater disparities in the expenditure-revenue ratios had relative incomes among the states remained the same as they were in 1960, dis- parities narrowed somewhat as a result of the narrow- ing of the relative income gaps. In 1960, the state with
the lowest "return" on its tax dollar received 56 cents in federal expenditures per dollar of taxes and the state with the highest return received $1.97. In 1975, the figures were 65 cents and $1.93.
"Tor simplicity we omit the role of regional governments' revenues and expenditures.
lgWilliam H. Oakland and Daniel E. Chall. "Regional Impact of Federal Expenditures," Washington, DC, Academy for Contemporary Problems (draft, mimeo), no date.
201n terms of the present discussion a comparison of the implications of the current expenditure-revenue ratios with equal ratios ( that is, all equal to 1) would be of interest. I t would not necessarily be locationally neu- tral.
21Martin Holmer, "Preliminary Analysis of the Regional Economic Effects of Federal Procurement," paper pre- sented a t the Committee on Urban Public Economics Meetings, May 5-6. 1978, pp. 13-14.
22Karen R. Polenske, "Shifts in the Regional and Indus- trial Impact of Federal Government Spending" (mim- eo), March 1969. ment expenditure is well below what it would have to be to achieve full employment. T h e result of such a policy is tha t national income is below its equilibrium level; given the tax schedules, the tax collections are even lower than the relatively low level of government expenditure. As a result, we may observe a budget deficit a t the national level and local positive flow of funds, that is, government expenditures are greater than tax collections in a region; we are surely not justi- fied in inferring that these indicate a policy which in- creases the size of local income. Rather, a s described, they derive from a contractionary policy, which reduces local income.
l0For a n example of such effects in the defense sector, see A. Alchian, "Reliability of Progress Curves in Airframe Production," Econometrica, Bristol, England, Arrow- smith Ltd., Vol. 31, October 1963.
"The other objectives are efficient allocation of resources and economic stabilization. See Richard A. Musgrave, The Theory o f Public Finance, New York, NY, Mc- Graw-Hill, 1959.
12These figures are taken from I. M. Labovitz, "Federal Expenditures and Revenues and States," Advisory Commission on Intergovernmental Relations, Znter- governmental Perspective, Washington, DC. U.S. Gov- ernment Printing Office, Fall 1978, p. 22.
13These estimates are shown in the appendix to this section.
14This does not permit inference about changes in the redistributive effect of the tax system among individu- als or families.
I5The position of Delaware partly reflects less adequate state-by-state data on stockholdings and retail sales in earlier flows-of-funds analyses.
'GThe estimated statistical relationships are shown in the appendix to this section.

Chapter V
CONCLUSIONS
A s we look at the trends in regional eco- nomic development over the last 25, 50,
75 years, we conclude that the nation and its regions have moved in the right direction. T o evolve from a country of very substantial disparities in regional economic development and per capita incomes to one in which econo- mic activity has dispersed across the nation, with its benefits relatively evenly spread, is a singular accomplishment. These movements have been relatively continuous, they did not occur overnight, and indeed they mntinue.
The achievement o f relative compactness among regional per capita incomes-whether measured in nominal or real terms-is cause for satisfaction rather than despair. Clearly it would be desirable to keep future differences within reasonably narrow bounds, although perfect equality is not to be expected in a dynamic economy and the regions may shift rankings.
Despite the many indications that the re- gions of the nation are converging in their economic development in terms of both levels and rates of change (as indicated both in the trends section and in the shift-share analyses examined), there appears to be increasing
concern for the continued decline of the older industrial regions, indeed a fear of regional divergence.
In many respects, the discussion of regional disparities is, in fact, a discussion of other deep-rooted national economic problems that concern race and poverty and their growing concentration in certain older cities. In con- trast, the point must be emphasized that this study has for its central aim the investigation of the regional questions raised by the Frost- belt-Sunbelt controversy. The state has been the smallest unit of analysis. We have not been considering cities vs. suburbs or urban- rural disparities but rather broader regional aggregations. Despite the fact that there is enormous diversity within regions and within states, the broader regional patterns o f con- vergence, not divergence, have clear1 y emerged.
The growing fears of regional divergence in recent years may arise largely from the gen- eral slowing of national growth. Nearly two decades ago Perloff highlighted two out- standing phenomena of the period, 1870 to 1957. One was the remarkable growth of the Western half of the nation. The other was the maintenance of dominance in the eco- nomic position of the Eastern half of the nation. The latter was largely attributable to the very large absolute increases in popula- tion and in employment despite the East's lower growth rates.
Since Perloff's observation, the regions' economic bases have become more similar as a result of continued differential growth rates. Thus, continued differences in growth rates now imply much smaller absolute growth in the Northeast and Midwest and much larger absolute growth in the South and West than they did in earlier decades. Moreover, the national economic slowdown of the last decade has produced even smaller absolute growth.
As a result of these changes, the North- east and Midwest, the older industrial re- gions, are far more conscious of potential stagnation or decline, not simply in relative terms but in absolute terms. These regional shifts in economic activity also carry with them important shifts in economic and politi- cal power, e.g., through the reapportionment
of the votes in the House of Representatives. The economic catch-up of the South and
West has made competition among the re- gions more active and more obvious. When the South was much poorer, its need for as- sistance from the rest of the nation was clear, as was the ability of the rest of the nation to provide assistance. The reduction o f regional differences and the generally slower growth, with its disproportionate effect on the North- east and Midwest regions, brings distribu- tional questions to the fore and calls into question both the need of the South and the means of the North. Against this background, the generally larger federal role in the na- tion's economy focuses attention on the influ- ence and responsibility of the federal govern- ment for regional economic development.
Continued slow national economic growth could result in the Northeast and Midwest dropping below other regions in relative eco- nomic well-being. Predictions of slower growth rates for the 1980s and 1990s are con- tained in a recent study by the Joint Eco- nomic Committee.' A decline from the 4% of recent decades to perhaps 3% in the 1980s and even less in the 1990s is envisioned.
In 1974, the Bureau of Economic Analysis published a set of regional population, em- ployment, and income forecasts to the year 1990. They indicated that, in terms of long- term regional disparities, rates of growth would continue to differ among the regions, per capita incomes would move closer to- gether, but the differences in growth rates would be moderate. Moreover, despite the continued faster growth in per capita incomes in the Southeast and Southwest, the two re- gions would still have the lowest regional levels of per capita income in 1990, with the Mideast, New England, and the Far West still a t the top of the range.
These projections are consistent with earli- er literature on regional economic develop- ment disparities. They found the historical data showing movement toward greater equality and eventual equilibrium, rather than toward new divergences more recently anticipated by the public debate.
In evaluating their earlier forcasts, the De- partment of Commerce has found that they contain some substantial over and under-
estimate^.^ Moreover, the observed deviations between actual and projected income, popula- tion, and employment figures for the 1971-75 period are regionally biased. I t concluded that, "If recent trends [slow growth] con- tinue into the future, then the 1980 projec- tions for the Northeast-Great Lakes industrial states would be too high; those for the fast- growing southern and western states would be too low; and those for the remaining states would be approximately on trend."
Most suggestions to cope with current re- gional growth disparities are designed to help distressed areas, particularly the central cities. They concentrate on the micro-eco- nomic level, on regional development banks, or changes in federal procurement policies, or the location of military bases, or special in- vestment tax credits for distressed areas. Each proposal presumably would help prevent a reversal of the fortunes of one or more of the nation's regions.
Such suggestions are open to several objec- tions however: (1) they exacerbate political conflict and sectionalism; (2) they hamper the necessary adjustments within, and between regional economies and thus, reduce overall economic efficiency; (3) they ignore some of the important natural correctives already built into the nation's economy, ex., the progressive tax system; and (4) their potential payoff is uncertain at best.
The most important regional policy both in terms of national acceptance and regional efficiency may well be the maintenance of a rapidly growing national economy. This has immediate payoff to the older industrial re- gions in employment and income growth. Our study found that these regions have been relatively robust in the last 25 years only during periods of rapid national growth. Moreover, a strong national economy would also provide a cushion against which some
necessary restructuring of regional economies could take place.
Given the evidence on differences in re- gional response to national economic condi- tions, it may well be that macro-economic policy would in fact be implemented more effectively if it had a regional orientation. Some of the micro-economic remedies indi- cated above could serve this purpose. They may thus be more promising as supplements to an aggregate growth policy than they would be in the slowly growing national econ- omy anticipated for the next decade or two.
An important area for continuing investi- gation must be the trend toward divergence or convergence in the underlying prices of land, labor, and capital as well as other costs of doing business in the various regions. If they are becoming more similar (and there is some evidence to support this with respect to wages), then the forces pointing to relative equilibrium are reinforced. If they are becom- ing more disparate, then the future may be more worrisome.
Given their greater sensitivity to fluctua- tions in aggregate economic activity, the most apparent danger to the Frostbelt states in the near term is two-fold, namely that (1) the need to contain inflationary pressure may force the managers of the national economy to pursue policies which trade off a reduction in inflation for more rapid national growth, and (2) the relatively slow national growth currently forecast for the next decade or two will actually occur.
Thus, despite the achievement of a very substantial overall reduction in regional eco- nomic disparities over the past century, com- placency with respect to the future is not warranted. The persistence of earlier dispari- ties over nearly a century would argue for carefully monitoring regional economic devel- opments and being alert for signs of new di- vergences as contrasted with equilibrium.
FOOTNOTES Patterns," Washington, DC, U S . Government Printing Office, 1976.
2Regional Economic Analysis Division, U.S. Department of Commerce, "Tracking the BEA State Economic Proj- ects," Survey o f Current Business, Vol. 55, No. 4, Wash-
'US. Congress, Joint Economic Committee. "U.S. ington, DC, U S . Department of Commerce, April 1976. Growth from 1976 to 1986: Prospects. Problems, and pp. 22-29.

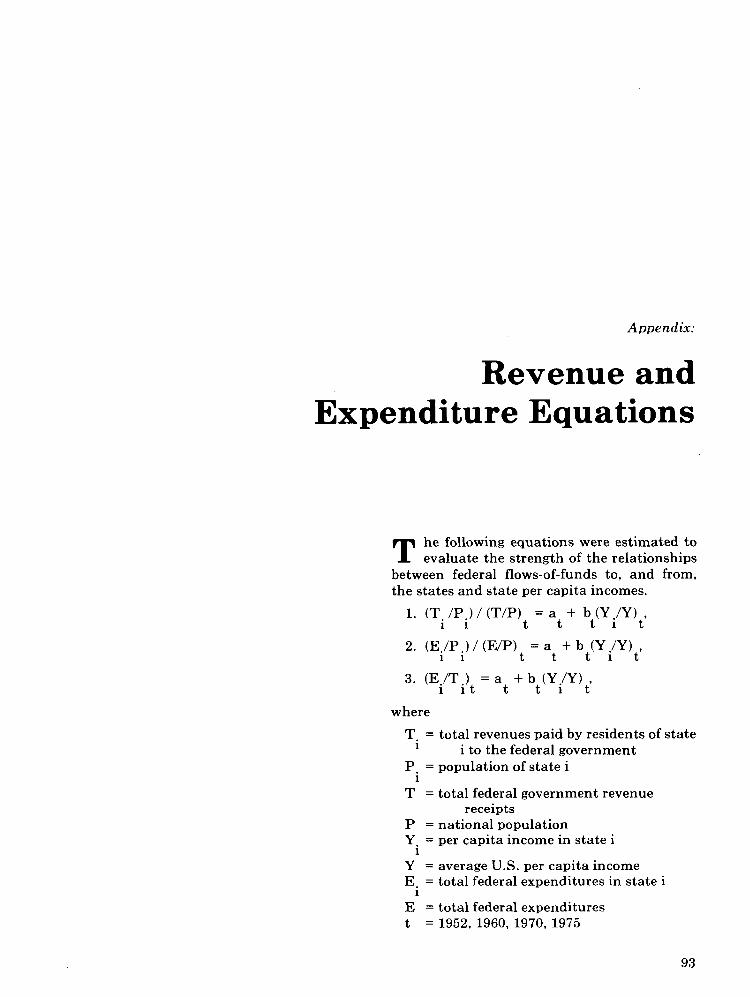
Appendix:
Revenue and Expenditure Equations
T he following equations were estimated to evaluate the strength of the relationships
between federal flows-of-funds to, and from, the states and state per capita incomes.
(T . /P . ) / (T /P) = a + b(Y /Y) 1 1 t t t i t '
(E./P .) / (E/P) = a + b (Y /Y) 1 1 t t t i t '
(EJT ) = a + bt(YiWt. 1 i t t
where
T. = total revenues paid by residents of state 1 i to the federal government
P. = population of state i L
T = total federal government revenue receipts
P = national population Y. = per capita income in state i
1
Y = average US. per capita income E. = total federal expenditures in state i
1
E = total federal expenditures t = 1952, 1960, 1970, 1975

Revenues:
The estimates of equation (1) follow.
Constant terms (a) -45.1 6 -29.94 -37.14 -16.44
Coefficient of relative per
capita income (b) 1.50" 1.38" 1.38" 1.17"
(9.718) (25.261) (20.251) (1 5.786) R2 .67 .93 .89 .88
'Slgniflcant at 1% level (t - values in parentheses). Alaska, Hawaii, and Distr~ct of Columbia excluded.
The relationship between per capita in- comes and per capita federal revenues (largely taxes) is very close. Since 1960, about 90% of the variation in per capita revenues among states is associated with the variation in their per capita incomes. In 1952, state per capita income 1% above average was associ- ated with per capita federal revenue payments 1.5% above average. In 1975, state per capita income 1% above average was associated with per capita federal revenue payments of only 1.17% above average. As the range of state per capita incomes has narrowed so has the range of per capita federal revenue payments.
Expenditures:
The estimates of equation (2) follow.
1952 1960 1970 1975
Constant (a) 52.46 39.61 60.04 77.02
Coefficient of per capita income (b) .50* .65* .39 .21
(3.45) (3.31) (1.89) (1.20) R2 .21 .19 .07 .03
'Significant at 1% level (t - values in parentheses). Alaska. Hawaii, and District of Columbia excluded.
Over the years the relationship between the federal expenditures per capita and state per capita incomes has been weak. In 1960 and 1952, about 20% of the expenditure variation was associated with income variation. By 1970, less than 10% of the expenditure varia- tion was associated with income variation.
In all the years that the relationship is posi- tive, i.e., the higher state per capita income, the higher per capita federal expenditures. The difference between the earlier and later years probably is due to the increase in re- distributive, nonprocurement, type expendi- tures. The positive relationship in the earlier periods was probably due to the importance of procurement expenditures and the domi- nance of the more industrialized states as the major sources of these goods.
Expenditure-to-Revenue Ratio:
The estimates of equation (3) follow.
Constant (a) 2.76 1.99 2.25 2.09
Coefficient of per capita income (b) -.016* -.009* -.012* -.011
(-6.136) (-3.922) (-5.246) (-5.274 R2 .45 .25 .37 .38
'Sign~ficant at 1% level (t - values in parentheses). Alaska. Hawai and Distr~ct of Columbia excluded.
A fairly high proportion of the variation in federal expenditure to revenue ratios is asso- ciated with variations in state per capita in- comes; about 40%. Given the earlier findings, this overall relationship must be due almost entirely to the close association between per capita income and per capita federal revenues. The higher the state per capita income, the lower the expenditure to revenue ratio. A state per capita income 1% above average is associated with a federal expenditure to reve- nue ratio about 1% lower than average (1.1% in 1975, 1.2% in 1970, 0.9% in 1960, and 1.6% in 1952).
In view of the estimated equations that show higher state per capita income associ- ated with higher per capita federal expendi- tures and taxes, the revenue relationship comprises the denominator of the expenditure ratio, the overall negative relationship be- tween expenditure to revenue ratios and state per capita income largely reflects the tax relationship.
Bibliography
Advisory Commission on Intergovernmental Relations, Measures o f State and Local Fiscal Capacity and Tax Effort, M-16, Washington, DC, Government Printing Office, October 1962.
Alchian, A., "Reliability of Progress Curves in Airframe Production," Econometrica, Bristol, England, Arrowsmith Ltd., Vol. 31, October 1963.
Anderson, James R., "The State and Region- al Impact of the Military Budget," reprinted in Congressional Record, Washington, DC, Government Printing Office, July 28, 1976, S12662-12665.
Begg, H. M., "Annual Expenditure on Spe- cial Regional Assistance to Industry in Great Britain, 1960/1-1972/3: A Note," Economic Journal, Cambridge, England, Royal Eco- nomic Society, 85:340, 1974.
Berry, Brian J. L., "Regional Growth Cen- ters: A Status Report," Proceedings o f Re- gional Development Research Conference, Washington, DC, Department of Commerce, 1972.
Berry, Brian J. L., Growth Centers in the American Urban System, Cambridge, MA., Ballinger, 1973.
Bezdek, Roger, "Occupational Employment Sensitivity to Shifting Patterns of Federal Expenditures," Socio-Economic Planning Sciences, Elmsford, NY, Pergamon Press, Vol. 6, 8, 1974.
Blair, R. D., "Regional Considerations of the Clean Air Act," Growth and Change, Lexing- ton, KY, University of Kentucky, College of Business and Economics, 7:4, October 1976.
Borts, George H. and Stein, Jerome L., Eco- nomic Growth in a Free Market, New York, NY, Columbia University Press, 1964.
Bretzfelder, Robert B., "Geographic Trends in Personal Income in the 1960's," Survey o f Current Business, Washington, DC, U.S. Department of Commerce, August 1970.
Bretzfelder, Robert B., "Sensitivity of State and Regional Income to National Business Cycles," Survey o f Current Business, Wash- ington, DC, U.S. Department of Commerce, April 1973.
Brown, George D., "The Relative Importance of Federal Grant-in-Aid Formulas in an Over- all 'Agenda for the Northeast,"' working draft, submitted to the Federal Domestic Out- lays Working Group, June 28, 1976, revised July 23, 1976.
Browne, Lynn E., "How Different Are Re- gional Wages?," New England Economic Re- view, Federal Reserve Bank of Boston, Bos- ton, MA, January-February 1978.
Browne, Lynn E. and Syron, Richard F., "The Deregulation of Natural Gas: Its Poten- tial Impact on New England," New England Economic Review, Federal Reserve Bank of Boston, Boston, MA, September 1976.
Browning, Clyde, "The Geography of Federal Outlays: An Introductory and Comparative Inquiry," Studies in Geography, No. 4 , Chap- el Hill, NC, University of North Carolina, Department of Geography, 1973.
Brunson, E. Evan and Bever, Thomas D., "Southern Growth Trends, 1970-1976," Re- search Triangle Park, NC, Southern Growth Policies Board (Research Report), June 1977.
Cameron, Gordon C., Regional Economic Development: The Federal Role, Washington, DC, Resources for the Future, 1970.
Carlton, Dennis W., "Why New Firms Locate Where They Do: An Econometric Model," Cambridge, MA, Joint Center for Urban Studies of the Massachusetts Institute of Technology and Harvard University, Work- ing paper No. 57, January 1979.
Chisholm, M., "Regional Policies in an Era of Slow Population Growth and Higher Un- employment," Regional Studies, Oxford, England, Pergamon Press, October 1976.
Coalition of Northeastern Governors, Welfare Reform and Grants-in-Aid: Proposals for Reform, Issues Papers, 1977.
Coelen, Stephen P., "Regional Income Con- vergence/Divergence Again," Journal o f Re- gional Science, Philadelphia, PA, Regional Science Research Institute, Vol. 18, No. 3, 1978.
Council of Planning Librarians, Regional Development and Economic Growth, A Select Bibliography, Monticello, IL, prepared by the Planning Division, Canadian Department of Regional Economic Expansion, 1970 (ex- change bibliography no. 143).
Council of Planning Librarians, Regional Development and Economic Growth, Policy, Planning, and Programs, Monticello, IL, pre- pared by the Planning Division, Canadian Department of Regional Economic Expan- sion, 1970 (exchange bibliography no. 124).
Council of Planning Librarians, Revising Regional Economic Decline: A Preliminary Annotated Bibliography, Monticello, IL, 1976 (exchange bibliography no. 1193).
Cuciti, Peggy L., Troubled Local Economies and the Distribution o f Federal Dollars, Washington, DC, U.S. Congressional Budget Office. 1977.
Cupoli, Edward M. and Liro, Joseph, "The Impact of Cost-of-Living Differences on Com- munity Development Block Grant Program Entitlements," Syracuse, Syracuse Univer-
sity Maxwell School of Citizenship and Public Affairs, Metropolitan Studies Program, paper presented at the Northeast Regional Science Association Meetings, Baltimore, MD, May 11-13, 1978.
Dahl, David S., "A Cloudy Future for Min- nesota's Businesses," Quarterly Review, Minneapolis, MN, Federal Reserve Bank of Minneapolis, Spring 1979.
Danziger, Sheldon and Haveman, Robert H., "Tax and Welfare Simplification: An Analy- sis of Distributional and Regional Impacts," National Tax Journal, Columbus, OH, Na- tional Tax Association, September 1977.
Derthick, Martha, Between Nation ar,d State, Washington, DC, The Brookings In- stitution, 1974.
de Torres, Juan, "The Decline of the East," Across the Board, New York, NY, The Na- tional Industrial Conference Board, April 1977.
de Torres, Juan, "The New South," Across the Board, New York, NY, The National In- dustrial Conference Board, March 1977.
de Torres, Juan, "The Middle West: Subtle Shifts," Across the Board, New York, NY, The National Industrial Conference Board, May 1977.
de Torres, Juan, "The West," Across the Board, New York, NY, The National Indus- trial Conference Board, June 1977.
de Torres, Juan, "The West Coast," Across the Board, New York, NY, The National In- dustrial Conference Board, July 1977.
Easterlin, Richard A., "Redistribution of Manufacturing," in Simon Kuznets, Anne Ratner Miller, and Richard A. Easterlin, Population Redistribution and Economic Growth: United States, 1870-1950, Vol. 11, Analyses of Economic Change, Philadelphia, PA, American Philosophical Society, 1960.
Economic Development Administration, Fed-
eral Activities Affecting Location of Econom- ic Development, Volume I, Washington, DC, U.S. Government Printing Office, 1970, Sum- mary and Parts I-IV.
Economic Development Administration, Pro- gram Evaluation: The Economic Development Administration Growth Center Strategy, Washington, DC, U.S. Department of Com- merce, February 1972.
The Fantus Company, Inc., The Appalachian Location Research Studies Program: Sum- mary Report and Recommendations, New York, NY, 1966.
Floyd, C. F. and Robertson, T. D., "The Impact of Military Force Reductions on the Coastal Plains Region," Growth and Change, Lexington, K Y , University of Kentucky, Col- lege of Business and Economics, 6:2, April 1975.
Frank, S. A. and Noah, J. W., "Costs of Fed- eral Assistance to Distressed Areas," Policy Analysis, Berkeley, CA, University of Cali- fornia Press, 1:4, Fall 1975.
Friedenberg, Howard L., "Regional Differ- ences in Personal Income Growth, 1929-77," Survey o f Current Business, Washington, DC, U.S. Department of Commerce, October 1978.
Friedly, Philip, National Policy Responses to Urban Growth, Lexington, MA, Lexington Books, 1974.
Friedmann, John, Urbanization, Planning and National Development, Beverly Hills, CA, Sage Publications, 1973.
Friedmann, John and Alonso, William, Re- gional Development and Planning, Cam- bridge, MA, MIT Press, 1964.
Friedmann, John and Alonso, William, eds., Regional Policy: Readings in Theory and Applications, Cambridge, MA, MIT Press, 1975 (Revised version of Regional Develop- ment and Planning, 1964).
Fuller, S. S., "Social and Economic Factors

in Federal Building Location Decisions," Growth and Change, Lexington, KY, Uni- versity of Kentucky, College of Business and Economics, 4:2, April 1973.
Garnick, Daniel H., "Reappraising the Out- look for Northern States and Cities in the Context of U.S. Economic History," Cam- bridge, MA, Joint Center for Urban Studies of the Massachusetts Institute of Technology and Harvard University, Working Paper No. 51, May 1978.
Gellner, Christopher G., "Regional Differ- ences in Employment and Unemployment, 1957-72," Monthly Labor Review, Washing- ton, DC, U.S. Department of Labor, March 1974.
Golladay, F. and Haveman, R., "Regional and Distributional Effects of a Negative In- come Tax," American Economic Review, Menasha, WI, George Banta Co., Inc., 66:4, September 1976.
Grasberger, Fredrich J., "Developing Tools to Improve Federal Grant-in-Aid Formulas," Rochester, NY, Center for Governmental Re- search, Inc., Formula Evaluation Project, Preliminary Report #3, 1978.
Grace, Barry and Mitrisin, John, "Regional Shifts in Economic Activity-A Selected An- notated Bibliography, 1970-1976," Washing- ton, DC, Congressional Research Service, Library of Congress, October 13, 1976.
Greenwood, Michael J., "Research on Inter- nal Migration in the United States: A Sur- vey," Journal o f Economic Literature, Nash- ville, TN, American Economic Association, Vol. 13, June 1975.
Halstead, D. Kent, Tax Wealth in Fifty States, Washington, DC, The National In- stitute of Education, U.S. Department of Health, Education and Welfare, 1978.
Hansen, Niles, Location Preferences, Migra- tion and Regional Growth, New York, NY, Praeger, 1973.
Hansen, Niles, ed., Public Policy and Region-
al Economic Development: the Experience o f Nine European Countries, Cambridge, MA, Lippincott, Ballinger, 1974.
Haveman, Joel and Stanfield, Rochelle, "A Year Later, the Frostbelt Strikes Back," National Journal, Washington, DC, Govern- ment Research Corporation, July 2, 1977.
Haveman, Robert H., "Evaluating the Im- pact of Public Policies on Regional Welfare, Regional Studies, Oxford, England, Perga- mon Press, Vol. 10, 1976.
Hekman, John S., "An Analysis of the Changing Location of Iron and Steel Produc- tion in the Twentieth Century," The Ameri- can Economic Review, Menasha, WI, George Banta Co., Inc., March 1978.
Hoch, Irving, "The Role of Energy in the Regional Distribution of Economic Activity," paper delivered a t "Alternatives to Confron- tation" Conference, Austin, TX, September 1977.
Holmer, Martin, "Preliminary Analysis of the Regional Economic Effects of Federal Procurement," paper presented a t the Com- mittee on Urban Public Economics Meetings, May 5-6, 1978.
Isard, Walter, Methods o f Regional Analysis: A n Introduction to Regional Analysis, New York, NY, John Wiley, 1960.
Johnson, A. B., "A Theory of Federal Aid Distribution," American Economic Review, Menasha, WI, George Banta Co., Inc., 16:2, Fall 1972.
Jusenius, C. L. and Ledebur, L. C., "A Myth in the Making: The Southern Economic Chhl- lenge and Northern Economic Decline," Washington, DC, U.S. Department of Com- merce, Economic Development Administra- tion, November 1976.
Kain, John F., ed., Essays in Regional Eco- nomics, Cambridge, MA, Harvard University Press, 1971.
Kaplan, Marshall, "Growth and The Cities
of the South: A Study in Diversity," Pre- pared by Marshall Kaplan, Gans, and Kahn, for The White House Conference on Balanced National Growth and Economic Develop- ment, 1978.
Klassen, T . A., "Regional Comparative Ad- vantage in the United States," Journal o f Regional Science, Philadelphia, PA, Regional Science Research Institute, 13:1, April 1973.
Kosters, M. and Welch, Finis, "The Effects of Minimum Wage on the Distribution of Changes in Aggregate Employment," Ameri- can Economic Review, Menasha, WI, George Banta Co., Inc., 62:3, June 1972.
Labovitz, I. M., "Federal Expenditures and Revenues in Regions and States," Intergov- ernmental Perspective, Washington, DC, Advisory Commission on Intergovernmental Relations, Fall 1978.
Leone, Robert and Martin, Curt, An Analysis o f Federal Economic Development Programs, Lexington, MA, Lexington Books, Summer 1977.
Levin, M. R., "Economic Development Dis- tricts-New Planning Regions," Urban Af- fairs Quarterly, Beverly Hills, CA, Sage Pub- lications, 3:3, 1968.
Levitan, Sar, Federal Aid to Depressed Areas, Baltimore, MD, Johns Hopkins University Press, 1964.
Levitan, Sar and Zickler, Joyce, Too Little, But Not Too Late: Federal Aid to Lagging Areas, Lexington, MA, Lexington Books, 1976.
Lichtenberg, Robert, One-tenth o f a Nation: National Forces in the Economic Growth o f the New York Region, Cambridge, MA, Har- vard University Press, 1960, for Regional Plan Association.
Liner, E. Blaine and Lynch, Lawrence K., The Economics o f Southern Growth, Re- search Triangle, NC, Southern Growth Poli- cies Board, 1977.
Long, S. C., "Coal Taxation in the Western
States: the Need for Regional Tax Policy," Natural Resources Journal, Albuquerque, NM, University of New Mexico Law School, 16:2, April 1976.
Lynch, J. E., "Regional Impact of the Viet- nam War," Quarterly Review o f Economics and Business, Urbana, IL, Bureau of Eco- nomic and Business Research, 16:2, Summer 1976.
Lynch, Lawrence, Southern Growth, 1970- 75, Research Triangle, NC, Southern Growth Policies Board. 1976.
Malizia, Emil and Reid, Diane, "Perspectives and Strategies for U.S. Regional Develop- ment," Growth and Change, Lexington, K Y , University of Kentucky, College of Business and Economics, 7:4, October 1976.
Mandelbaum, Seymour J., "Urban Pasts and Urban Policies," paper presented a t the Rus- sell Sage Conference on History and Social Policy, October 20-23, 1977.
Massell, Benton, "A Disaggregated View of Technical Change," Journal o f Political Economy, Chicago, IL, University of Chicago Press, Vol. 69, December 1961.
Masser, I., ed., Theory and Practice in Re- gional Science, New York, NY, Academic Press, Harcourt-Brace, Jovanovich, 1976.
McLaughlin, Glen and Robock, Stefan, Why Industry Moves South, Washington, DC, National Planning Association, 1949.
Meyer, John R. and Leone, Robert A., "The New England States and Their Economic Future: Some Implications of a Changing Industrial Environment," paper presented a t the Problems of Regional Economic Develop- ment Session of the American Economic As- sociation, December 29, 1977.
Mitchell, Edward J., ed., Energy: Regional Goals and the National Interest, National Energy Project, Washington, DC, American Enterprise Institute for Public Policy Re- search, 1976.

Moore, B. and Rhodes, J . , "Evaluating the Effects of British Regional Economic Policy," Economic Journal, Cambridge, England, Royal Economic Society, 83:329, March 1973.
Morrison, Peter A., "Population Movements and the Shape of Urban Growth: Implications for Public Policy," in Sara M. Mazie, ed., Population, Distribution, and Policy, Wash- ington, DC, U.S. Commission on Population Growth and the American Future, Vol. V, 1972.
Moynihan, Daniel Patrick, "New York State & The Federal Fisc: Fiscal Year 1977," State- ment, July 16, 1978.
Muller, Thomas, "Urban Growth and De- cline," Challenge, Washington, DC, U.S. De- partment of Housing and Urban Develop- ment, 19:2, May-June 1976.
Musgrave, Richard A., The Theory o f Public Finance, New York, NY, McGraw Hill, 1959.
Nolan, Martin, "The Northeast-Our New Appalachia?," The Boston Globe, July 11, 1976, reprinted in Congressional Record, Washington, DC, Government Printing Of- fice, July 22, 1976, E3997-3998.
Nourse, Hugh O., Regional Economics: A Study in the Economic Structure, Stability, and Growth o f Regions, New York, NY, McGraw-Hill. 1968.
Oakland, William H. and Stocker, Frederick D., "Fiscal Redistribution in the United States: A Proposal," Columbus, OH, Acade- my for Contemporary Problems, April 1976.
Oakland, William H. and Chall, Daniel E., "Regional Impact of Federal Expenditures," Columbus, OH, Academy for Contemporary Problems, mimeo draft, no date.
Oates, Wallace E., "The Effect of Property Taxes and Local Public Spending on Property Values: An Empirical Study of Tax Capital- ization and the Tiebout Hypothesis," Journal o f Political Economy, Chicago, IL, University of Chicago Press, Vol. 77, NovembedDecem- ber 1969.
Olson, Mancur, "The Political Economy of Comparative Growth Rates," Studies Pre- pared for Use of the Joint Economic Commit- tee, U.S. Economic Growth from 1976 to 1986: Prospects, Problems, and Patterns, Vol. 2, The Factors and Processes Shaping Long- Run Economic Growth, Washington, DC, U S . Congress, November 10, 1976.
Pack, Howard and Pack, Janet Rothenberg, "Metropolitan Fragmentation and Local Public Expenditures," National Tax Journal, Columbus, OH, National Tax Association, Vol. 31, December 1978.
Pack, Janet Rothenberg, "Determinants of Migration to Central Cities," Journal o f Re- gional Science, Philadelphia, PA, Regional Science Research Institute, Vol. 13, No. 3, August 1973.
Palmedo, P. F., "Approaches to Regional Energy Policy," Growth and Change, Lexing- ton, KY, University of Kentucky, College of Business and Economics, 7:4, October 1976.
Peirce, Neal, "Sunbelt vs. Frostbelt: A Loom- ing Problem," Washington Post, Washington, DC, Post Publishing Co., June 20, 1976.
Peirce, Neal, "Northeast Governors Map Battle Plan for Fight Over Federal Funds Flow," National Journal, Washington, DC, Government Research Corporation, Novem- ber 27, 1976.
Peirce, Neal and Hagstrom, Jerry, "Western States Join in Forming a University Energy Front," National Journal, Washington, DC, Government Research Corporation, February 5, 1977.
Pennsylvania Department of Communities Affairs, "Reversing Regional Decline," Har- risburg, PA, a preliminary bibliography pre- pared for the Federal Domestic Outlays Work- ing Group, September 16, 1976.
Perloff, Harvey S.; Dunn, Jr., Edgar S.; Lampard, Eric R. and Muth, Richard F., Regions, Resources, and Economic Growth, Lincoln, NE, University of Nebraska Press, 1960.

Perry, David C. and Watkins, Alfred J., eds., The Rise o f the Sunbelt Cities, Beverly Hills, CA, Sage Publications, 1977.
Petersen, John E., Frostbelt vs. Sunbelt, Part I: Key Trends o f the Seventies, Boston, MA, First Boston Bank Corporation, 1977.
Petersen, John E., Frostbelt us. Sunbelt, Part II: Changing Federal Policies, Boston, MA. First Boston Bank Corporation, 1977.
Peterson, George E. and Muller, Thomas, "The Regional Impact of Federal Tax and Spending Policies," Washington, DC, Urban Institute, paper prepared for conference: "Alternatives to Confrontation: A National Policy Toward Regional Change," Septem- ber 1977.
Polenske, Karen, Shifts in the Regional and Industrial Impact o f Federal Government Spending, Washington, DC, U.S. Department of Commerce, Economic Development Ad- ministration, 1969.
Polenske, Karen and Levy, Paul F., "Multi- regional Economic Impacts of Energy and Transportation Policies," Cambridge, MA, Department of Urban Studies and Planning, Massachusetts Institute of Technology, DOT Report No. 8, June 1974.
Poverty Studies Task Force, The Measure o f Poverty: A Report to Congress as Mandated by the Education Amendment o f 1974, Wash- ington, DC, U.S. Department of Health, Education, and Welfare, April 1976.
Rafuse, Robert W., "The New Sectionalism Controversy: An Overview," Washington, DC, National Governors' Conference, Center for Policy Research and Analysis, January 26, 1977.
Ray, Bruce A,, "Investigating the Myth of Congressional Influence: The Geographic Distribution of Federal Spending," paper for the 1976 annual meeting of the American Political Science Association, Chicago, IL, September 2-5, 1976.
Reading, D. C., "A Note on Distribution of
Federal Aid: An Interstate Comparison, 1933- 39 and 1961-65," American Economic Review, Menasha, WI, George Banta Co., Inc., Fall 1974.
Rees, John, "Manufacturing Change, Inter- nal Control and Government Spending in a Growth Region of the United States," Dallas, TX, Southwest Center for Economic and Community Development, University of Tex- as a t Dallas, no date.
Rees, John, "Regional Industrial Shifts in the U.S. and the Internal Generation of Man- ufacturing Growth in the Southwest," paper prepared for Committee on Urban Public Economics, May 1978.
Regional Plan Association, The Region's Money Flows, I. Government Accounts, New York, NY, July 1977.
Rethwisch, K., "Federal Tax Incentives for Regional Growth," Southern Economic Jour- nal, Chapel Hill, NC, University of North Carolina, 41:2, October 1974.
Richardson, Harry, Urban Economics, Lon- don, England, Penguin Books, 1971.
Richardson, Harry, Regional Economics: Lo- cation Theory, Urban Structure, and Region- al Change, New York, NY, Praeger, 1969.
Richardson, Harry, Regional Growth Theory, New York, NY, John Wiley & Sons, Inc., 1973.
Robinson, E. A. G., ed., Backward Areas in Advanced Countries: Proceedings o f a Confer- ence Held by the International Economic Association, NY, St. Martin's Press, 1969.
Rodwin, Lloyd, Nations and Cities: A Com- parison of Strategies for Urban Growth, Bos- ton, MA, Houghton Mifflin Co., 1970.
Roniger, George, "The Impact of Federal Expenditures on the Northeast Coast," printed in Congressional Record, Washington, DC, Government Printing Office, September 9, 1976, E4928-4929.
Sacks, Seymour; Wade, Harry; Ross, Robert

and Dinkelmeyer, Robert, "Energy Costs and Use and Patterns of Economic Activity in the Northeastern United States," Syracuse, NY, Syracuse Research Corporation, paper pre- pared for the Northeast Regional Advisory Committee, December 1976.
Sale, Kirkpatrick, Power Shift, New York, NY, Random House, 1976.
Schenker, E. and Bunamo, M., "A Study of the Corps of Engineers' Regional Pattern of Investments," Southern Economic Journal, Chapel Hill, NC, Southern Economic Asso- ciation, 39:4, April 1973.
Scheuer, James (D-NY), "Northeast Criti- cism of Closing Military Bases," Congression- al Record, Washington, DC, Government Printing Office, July 22, 1976, H7579.
Scheuer, James (D-NY), "A Step in Restor- ing the Economic Health of the Northeast- Midwest Corridors," Congressional Record, Washington, DC, Government Printing Of- fice, August 31, 1976, E4782-4785.
Schlottman, A., "A Regional Analysis of Air Quality Standards, Coal Conversion, and the Steam-Electric Coal Market," Journal o f Regional Science, Philadelphia, PA, Regional Science Research Institute, 16:3, December 1976.
Singer, N. M., "Federal Tax Incentives for Regional Growth," Southern Economic Jour- nal, Chapel Hill, NC, Southern Economic Association, 38:2, October 1971.
Smith, David M., Industrial Location: An Economic Geographic Analysis, New York, N Y , John Wiley & Sons, Inc., 1972.
Smith, P. E., "Interregional Fiscal Equity and Benefit Transfers," Public Finance Quarterly, Beverly Hills, CA, Sage Publica- tions, 2:1, January 1974.
Sternlieb, George and Hughes, James, eds., Post-Industrial America: Metropolitan De- cline and Interregional Job Shifts, New Brunswick, NJ, Rutgers University, Center
for Urban Policy Research, 1975.
Syron, Richard F., "Regional Experience During Business Cycles-Are We Becoming More Alike?," New England Economic Re- view, Boston, MA, Federal Reserve Bank of Boston, NovembedDecember 1978.
Thurmond, Strom, "Federal Funds and the Northern Economic Decline: Setting the Rec- ord Straight," Congressional Record, Wash- ington, DC, Government Printing Office, March 4, 1977, S3510-3512 (includes article by Professor A. C. Flora, "The Sunbelt: Is Suc- cess to be Thwarted?").
Todaro, Michael P., "A Model of Labor Mi- gration and Urban Unemployment," Ameri- can Economic Review, Menasha, WI, George Banta Co., Inc., Vol. 69, 1969.
U.S. Congress, Joint Economic Committee, Regional Economic Problems and National Economic Policy, hearings before the Sub- committee on Urban Affairs, Washington, DC, Government Printing Office, September 15, 1976.
U.S. Congress, Joint Economic Committee, U.S. Economic Growth from 1976 to 1986: Prospect, Problems, and Patterns, Vol. 6- Forecasts o f Long Run Economic Growth, Washington, DC, Government Printing Of- fice, 1976.
U.S. Congress, Senate Committee on Public Works, Special Committee on Economic De- velopment, The Continuing Review o f the Federal Role in Economic Revitalization, hearings, Washington, DC, Government Printing Office, 1968.
U.S. Congress, Senate Committee on Public Works, Subcommittee on Economic Develop- ment, National Economic Development Pro- gram, hearings, Washington, DC, Govern- ment Printing Office, 1971.
U.S. Congress, Senate Committee on Public Works, Subcommittee on Economic Develop- ment, Regional Economic Development Legis- lation o f 1969, hearings, Washington, DC, Government Printing Office, 2 vol., 1969.

U.S. Independent Study Board, Report. . On the Regional Effects o f Government Procure- ment and Related Policies, Washington, DC, U.S. Department of Commerce, Economic Development Administration, 1967.
Vaughan, Roger J., Public Works as a Coun- tercyclical Device: A Review o f the Issues, Santa Monica, CA, The Rand Corporation, July 1976.
Vaughan, Roger J. and Vogel, Mary E., The Urban Impacts o f Federal Policies: Vol. 4 , Population and Residential Location, Santa Monica, CA, The Rand Corporation, May 1979.
Vaughan, Roger J., The Urban Impacts o f Federal Policies: Vol. 2, Economic Develop- ment, Santa Monica, CA, T h e Rand Corpora- tion. June 1977.
Vernez, Georges; Vaughan, Roger; Burright, Burke and Coleman, Sinclair, Regional Cy- cles and Employment Effects o f Public Works Investments, Santa Monica, CA, The Rand Corporation, January 1977.
Weinstein, Bernard L., "The Demographics and Politics of Economic Decline in New York City," The Annals o f Regional Science, Bel- lingham, WA, Western Regional Science Association, July 1977.
Weinstein, Bernard L. and Firestine, Robert E., Regional Growth and Decline in the United States: The Rise o f the Sunbelt and the Decline o f the Northeast, New York, NY, Praeger. 1978.
Wheaton, William C., "Area Wages, Unem- ployment, and Interregional Factor Mobil- ity," paper prepared for the Spring Confer- ence of the Committee on Urban Public Economics, May 5-6, 1978.
Widner, Ralph, "The Future of the Industrial Midwest: A Time for Action," speech to Ohio Planning Conference, reprinted in Congres-
sional Record, Washington, DC, Government Printing Office, August 10, 1976, E4472-4473.
Widner, Ralph, "State Growth and Federal Policies: A Reassessment of Responsibilities," State Government, Lexington, KY, Council of State Governments, 47, Spring 1974.
Williamson, Jeffrey G., "Unbalanced Growth, Inequality and Regional Development: Some Lessons from American History," paper pre- sented a t the symposium, "A National Policy Toward Regional Change: Alternatives to Confrontation, Austin, TX, September 24-27, 1977.
Wingo, Lowdon, "Issues in a National Urban Development Strategy in the United States," Urban Studies, Edinburgh, Scotland, Long- mans Ltd., 9:2, 1975.
Worsham, John P., Jr., The Sunbelt Issue: The 'Decline' o f the North and the Rise o f the South, Monticello, IL, Vance Bibliographies, August 1978.
Yezer, Anthony and Shear, William, "The Variation in Consumer Goods Prices by Re- gion and City Size," preliminary version for presentation a t the Eastern Economic Asso- ciation session on North-South Regional Growth Disparities, April 27, 1978.
"Federal Spending: The North's Loss is the Sunbelt's Gain," National Journal, Washing- ton, DC, Government Research Corporation, June 26. 1976.
"The Future of the Northeast," Empire State Report, New York, NY, New York State Leg- islative Institute, Vol. 2, No. 9, October- November 1976.
"Northern Nirvana: 'New' New Hampshire Finds That Low Taxes Help to Fuel Econo- my," Wall Street Journal, New York, NY, Dow Jones & Co., Inc., May 25,1978.
"The Second War Between the States," Busi- ness Week, New York, NY, McGraw Hill, May 17, 1976.

Table A- 1
AVERAGE ANNUAL RATE OF GROWTH IN PER CAPITA INCOME, BY REGION AND STATE. SELECTED PERIODS, 1950-78
Average Annual Per Capita Income
Region and State
UNITED STATES
NEW ENGLAND Connecticut Maine Massachusetts New Hampshire Rhode Island Vermont
MIDEAST Delaware District of Columbia Maryland New Jersey New York Pennsylvania
GREAT LAKES Illinois Indiana Michigan Ohio Wisconsin
PLAINS Iowa Kansas Minnesota Missouri Nebraska North Dakota South Dakota
Growth Average Annual Per Capita Income
Growth Relative to U.S. Average
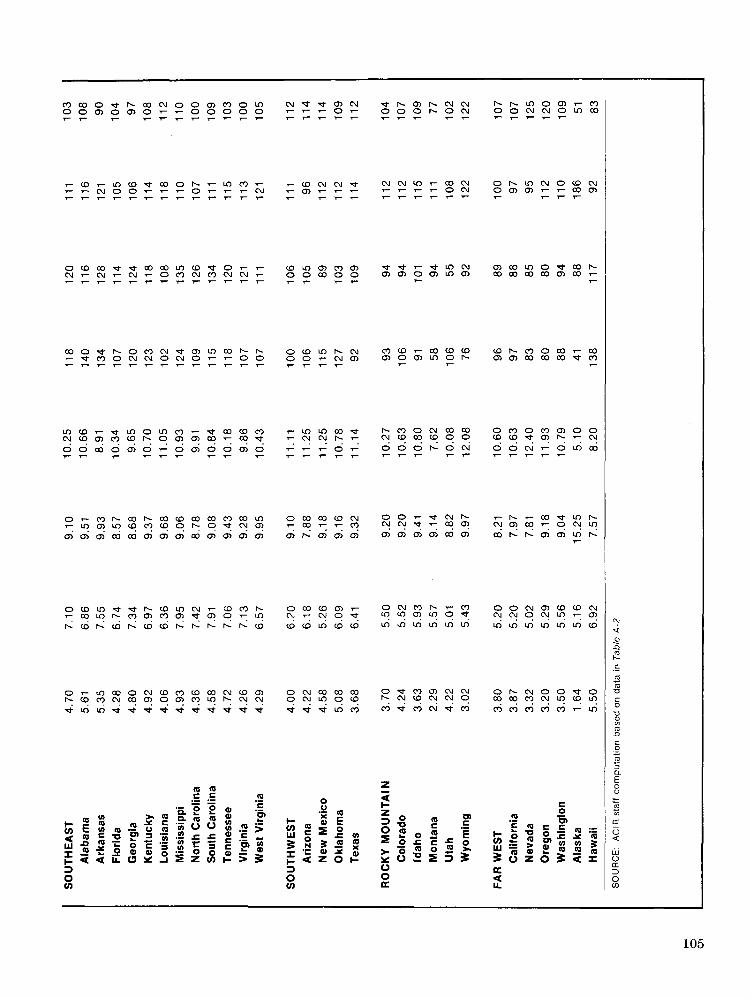
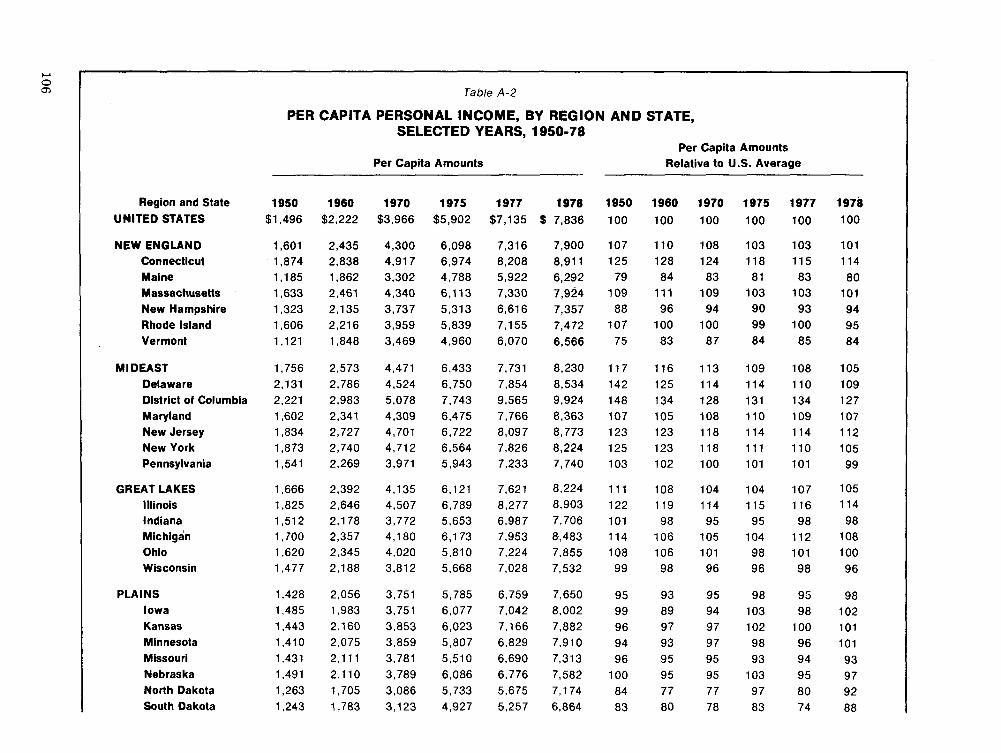
Table A-2
PER CAPITA PERSONAL INCOME. BY REGION AND STATE, SELECTED YEARS, 1950-78
Per Capita Amounts Per Capita Amounts
Relative to U.S. Average
Region and State UNITED STATES
NEW ENGLAND Connecticut Maine Massachusetts New Hampshire Rhode Island Vermont
MI DEAST Delaware District of Columbia Maryland New Jersey New York Pennsylvania
GREAT LAKES Illinois Indiana Michigan Ohio Wisconsin
PLAINS Iowa Kansas Minnesota Missouri Nebraska North Dakota South Dakota
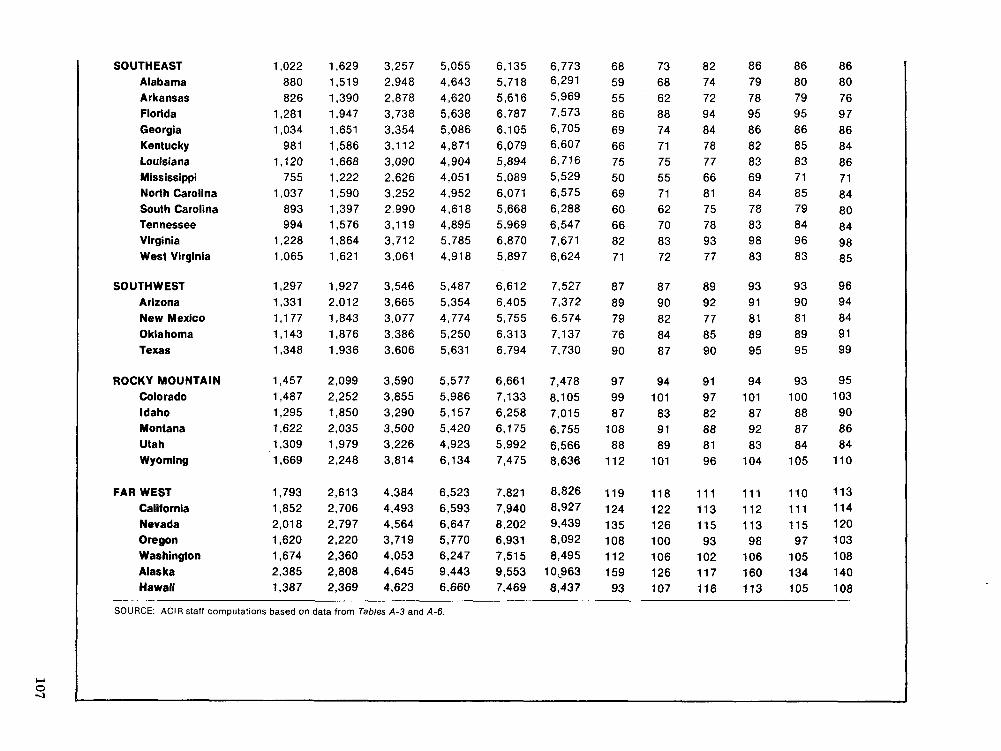
Alabama Arkansas Florida Georgia Kentucky Louisiana Mississippi North Carolina South Carolina Tennessee Virginia West Virginia
SOUTHWEST Arizona New Mexico Oklahoma Texas
ROCKY MOUNTAIN Colorado Idaho Montana Utah Wyoming
FAR WEST California Nevada Oregon Washington Alaska Hawaii
SOURCE: AClR staff computations based on data from Tables A-3 and A-6.
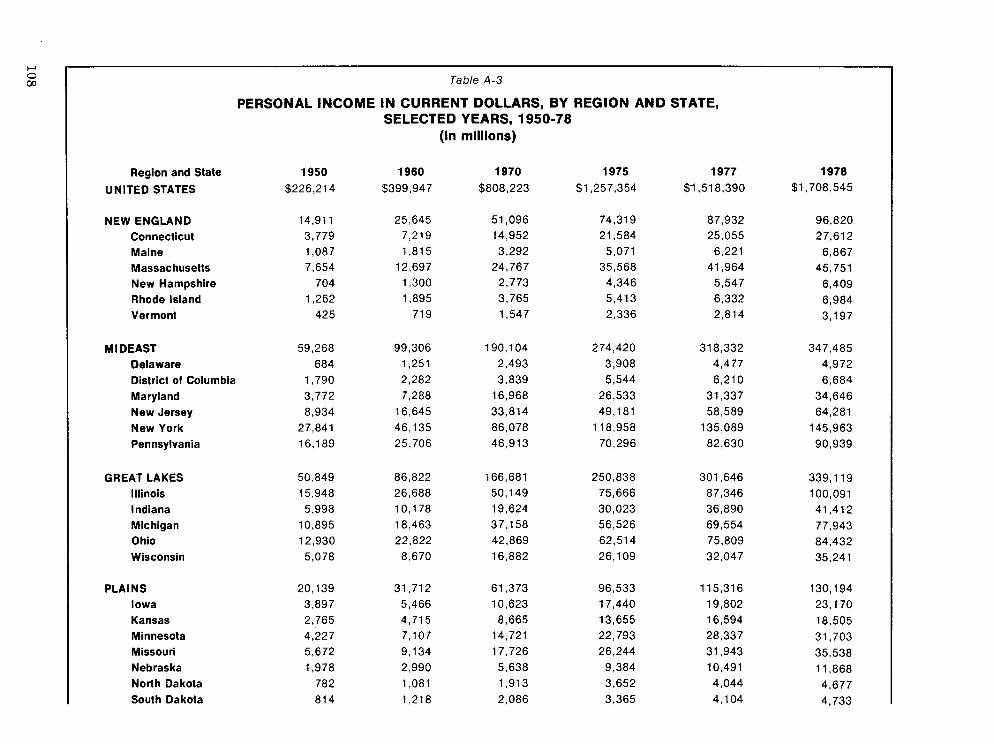
Table A - 3
PERSONAL INCOME IN CURRENT DOLLARS, BY REGION AND STATE, SELECTED YEARS, 1950-78
(in millions)
Region and State
UNITED STATES
NEW ENGLAND Connecticut Maine Massachusetts New Hampshire Rhode Island Vermont
MIDEAST Delaware District of Columbia Maryland New Jersey New York Pennsylvania
GREAT LAKES Illinois Indiana Michigan Ohio Wisconsin
PLAINS Iowa Kansas Minnesota Missouri Nebraska North Dakota South Dakota

SOUTHEAST Alabama Arkansas Florida Georgia Kentucky Louisiana Mississippi North Carolina South Carolina Tennessee Virginia West Virginia
SOUTHWEST Arizona New Mexico Oklahoma Texas
ROCKY MOUNTAIN Colorado Idaho Montana Utah Wyoming
FAR WEST California Nevada Oregon Washington Alaska Hawaii
SOURCE: 1950-75: U. S. Department of Commerce, Bureau of Economic Analysis, Regional Economic Information System, Regional Economic Division. 1978: Survey of Current Business. August 1979, Part II.
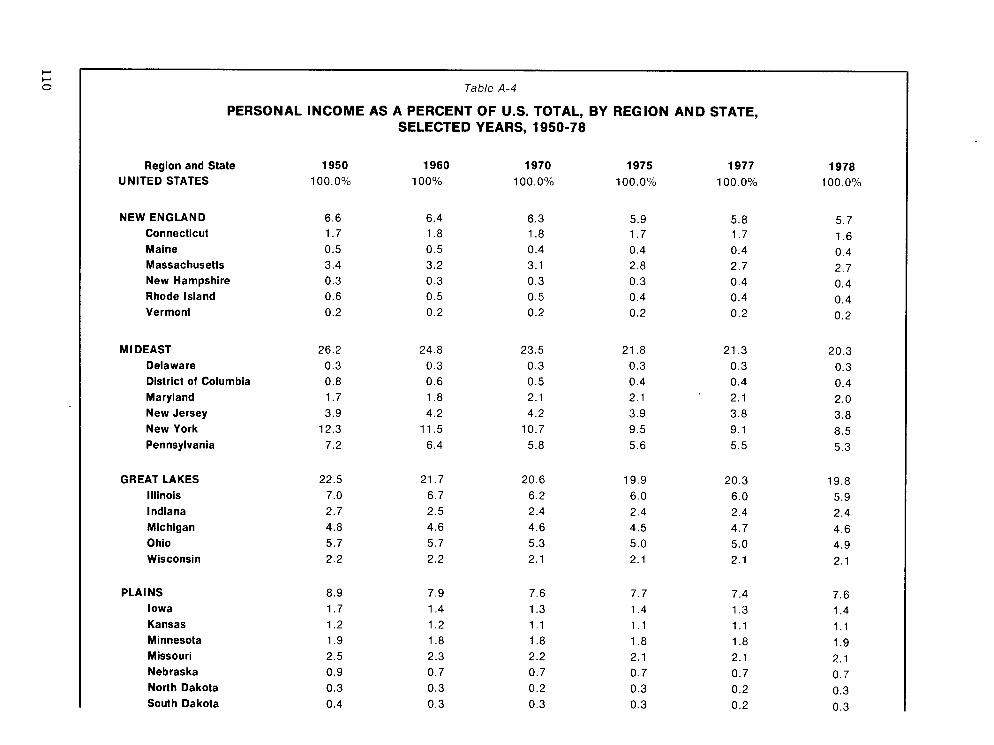
Table A-4
PERSONAL INCOME AS A PERCENT OF U.S. TOTAL, BY REGION AND STATE, SELECTED YEARS, 1950-78
Region and State UNITED STATES
NEW ENGLAND Connecticut Maine Massachusetts New Hampshire Rhode Island Vermont
MIDEAST Delaware District of Columbia Maryland New Jersey New York Pennsylvania
GREAT LAKES Illinois Indiana Michigan Ohio Wisconsin
PLAINS Iowa Kansas Minnesota Missouri Nebraska North Dakota South Dakota
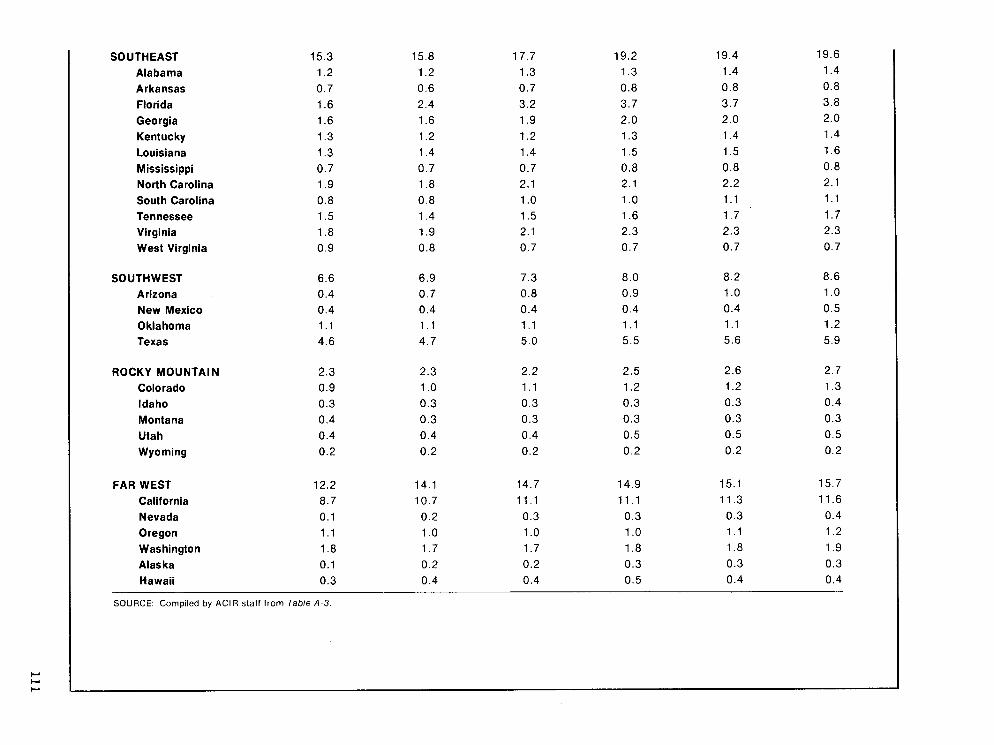
SOUTHEAST Alabama Arkansas Florida Georgia Kentucky Louisiana Mississippi North Carolina South Carolina Tennessee Virginia West Virginia
SOUTHWEST Arizona New Mexico Oklahoma Texas
ROCKY MOUNTAIN Colorado Idaho Montana Utah Wyoming
FAR WEST California Nevada Oregon Washington Alaska Hawaii
SOURCE: Compiled by AClR staff from Table A-3

Table A-5
PERSONAL INCOME, AVERAGE QUARTERLY RATES OF GROWTH, BY REGION AND STATE, 1975 FIRST QUARTER TO 1977 THIRD QUARTER
Rates of Growth Relative to U.S. Average
Region and State
UNITED STATES
NEW ENGLAND Connecticut Maine Massachusetts New Hampshire Rhode Island Vermont
MIDEAST Delaware District of Columbia Maryland New Jersey New York Pennsylvania
GREAT LAKES Illinois Indiana Michigan Ohio Wisconsin
PLAl NS
Iowa Kansas Minnesota Missouri Nebraska North Dakota South Dakota
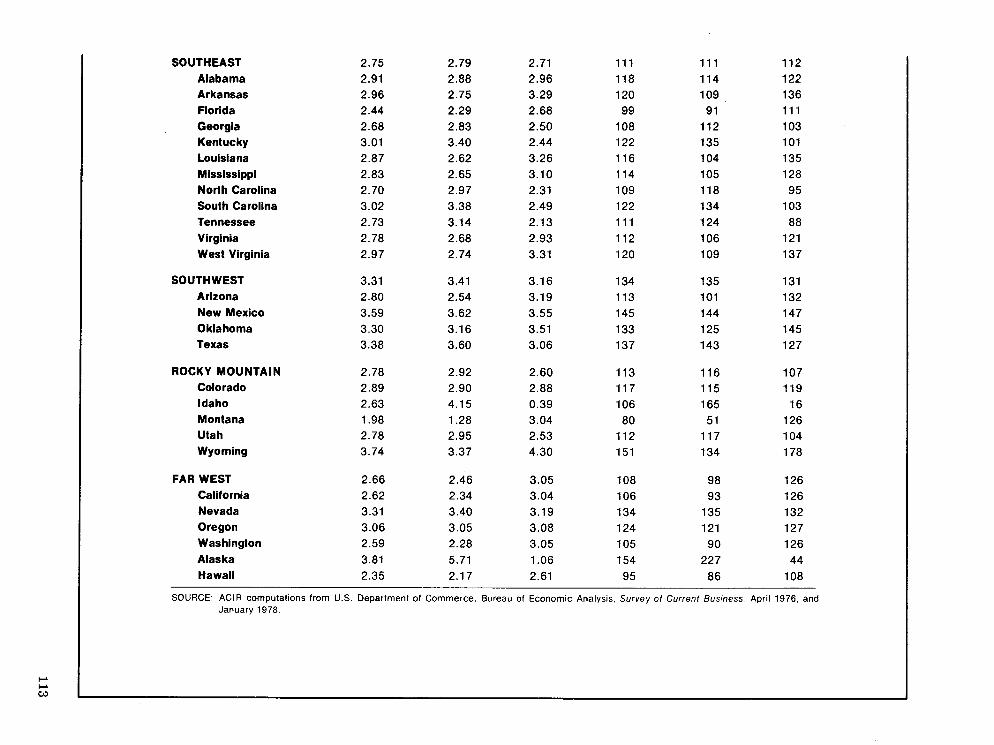
SOUTHEAST Alabama Arkansas Florida Georgia Kentucky Louisiana Mississippi North Carolina South Carolina Tennessee Virginia West Virginia
SOUTHWEST Arizona New Mexico Oklahoma Texas
ROCKY MOUNTAIN Colorado Idaho Montana Utah Wyoming
FAR WEST California Nevada Oregon Washington Alaska Hawaii
SOURCE: AClR computations from U.S. Department of Commerce. Bureau of Economic Analysis, Survey of Current Business. April 1976, and January 1978.

Table A-6
POPULATION, BY REGION AND STATE, SELECTED YEARS, 1950-78 (in thousands)
Region and State UNITED STATES
NEW ENGLAND Connecticut Maine Massachusetts New Hampshire Rhode Island Vermont
MIDEAST Delaware District of Columbia Maryland New Jersey New York Pennsylvania
GREAT LAKES Illinois l ndiana Michigan Ohio Wisconsin
PLAINS Iowa Kansas Minnesota Missouri Nebraska North Dakota South Dakota

SOUTHEAST 33,860 38,885 43,983 47,760 48,796 49,334 Alabama Arkansas Florida Georgia Kentucky Louisiana Mississippi North Carolina South Carolina Tennessee Virginia West Virginia
SOUTHWEST Arizona New Mexico 0 kla homa Texas
ROCKY MOUNTAI N Colorado Idaho Montana Utah Wyoming
FAR WEST California Nevada Oregon Washington Alaska Hawaii
"The 1978 figures are provisional from U.S. Department of Commerce, Bureau of the Census, Current Population Reports. Series P-25, #790, December 1978 SOURCE: U.S. Department of Commerce, Bureau of Economic Analysis, Regional Economic information System, Regional Economic Division: 1977.

Table A - 7
POPULATION AS A PERCENT OF US TOTAL, BY REGION AND STATE, SELECTED YEARS, 1950-78
Region and State UNITED STATES
NEW ENGLAND Connecticut Maine Massachusetts New Hampshire Rhode Island Vermont
MI DEAST Delaware District of Columbia Maryland New Jersey New York Pennsylvania
GREAT LAKES Illinois Indiana Michigan Ohio Wisconsin
PLAl NS Iowa Kansas Minnesota Missouri Nebraska North Dakota South Dakota
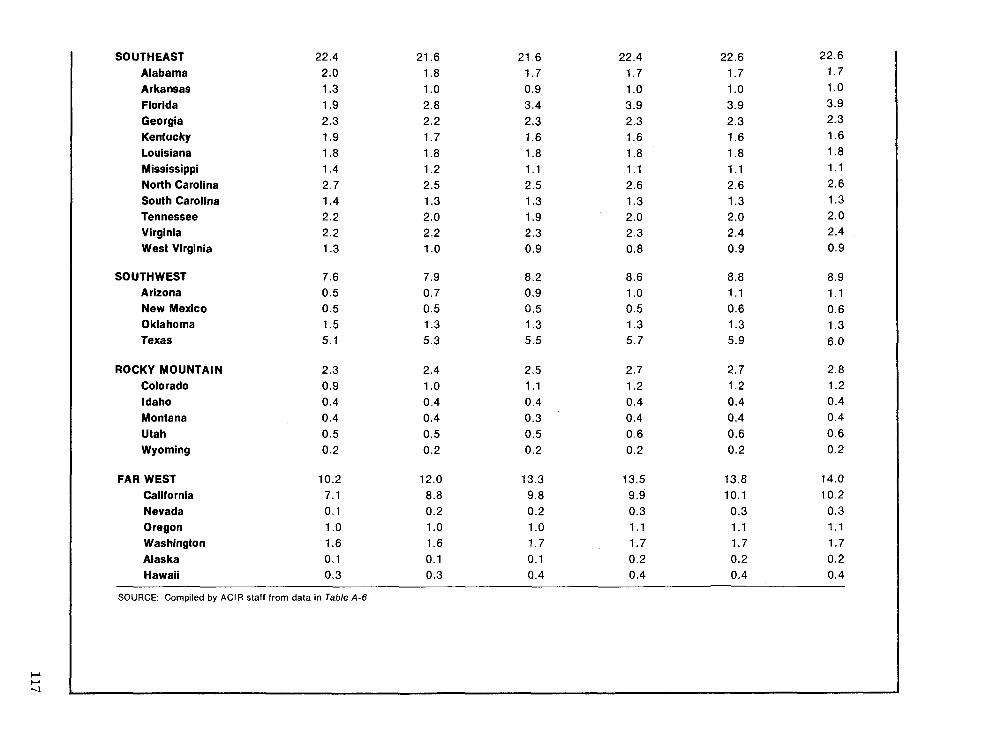
I SOUTHEAST 22.4 21.6 21.6 22.4 22.6 22.6 Alabama Arkansas Florida Georgia Kentucky Louisiana Mississippi North Carolina South Carolina Tennessee Virginia West Virginia
SOUTHWEST Arizona New Mexico Oklahoma Texas
ROCKY MOUNTAIN Colorado Idaho Montana Utah Wyoming
FAR WEST California Nevada Oregon Washington Alaska Hawaii
SOURCE: Compiled by AClR staff from data in Table A-6.
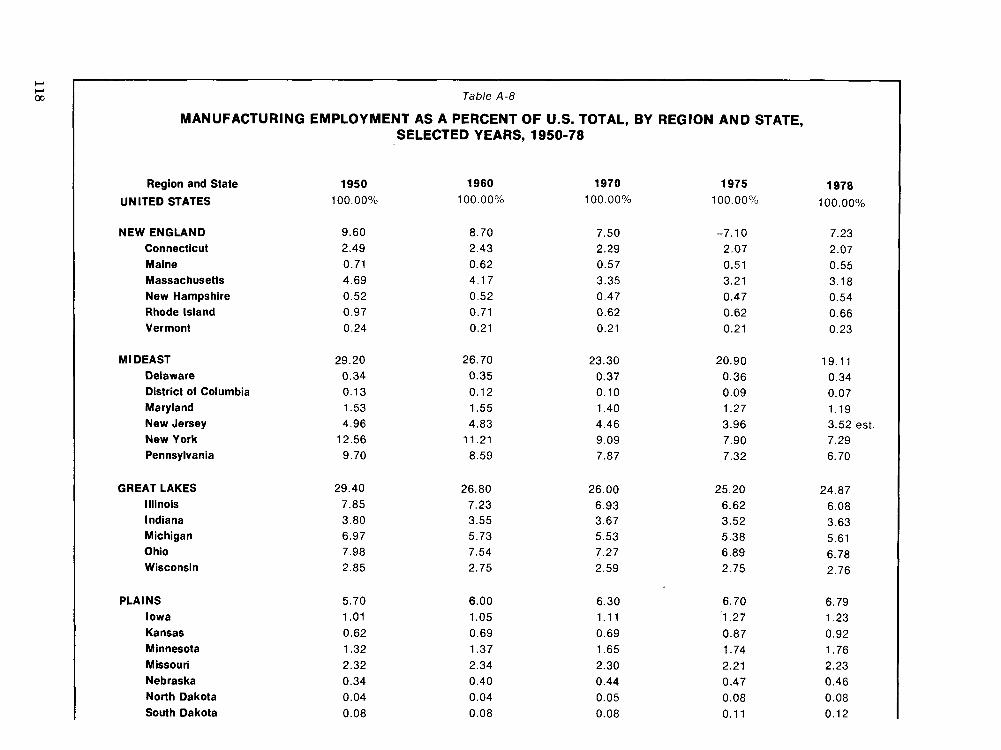
Table A-8
MANUFACTURING EMPLOYMENT AS A PERCENT OF U.S. TOTAL, BY REGION AND STATE, SELECTED YEARS, 1950-78
Region and State
UNITED STATES
NEW ENGLAND Connecticut Maine Massachusetts New Hampshire Rhode Island Vermont
MI DEAST Delaware District of Columbia Maryland New Jersey New York Pennsylvania
GREAT LAKES Illinois Indiana Michigan Ohio Wisconsin
PLAl NS Iowa Kansas Minnesota Missouri Nebraska North Dakota South Dakota
1978 100.00%
7.23 2.07
0.55 3.18 0.54
0.66 0.23
19.11 0.34
0.07 1.19 3.52 est 7.29
6.70
24.87
6.08 3.63 5.61
6.78 2.76
6.79 1.23 0.92 1.76 2.23 0.46
0.08 0.12
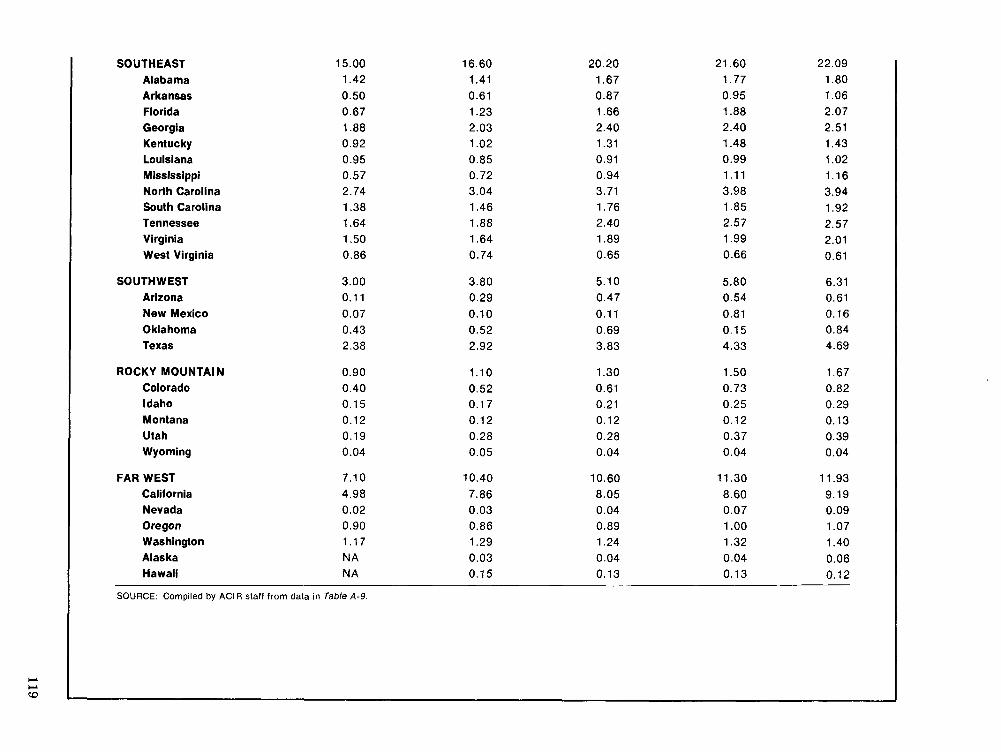
SOUTHEAST Alabama Arkansas Florida Georgia Kentucky Louisiana Mississippi North Carolina South Carolina Tennessee Virginia West Virginia
SOUTHWEST Arizona New Mexico Oklahoma Texas
ROCKY MOUNTAIN Colorado Idaho Montana Utah Wyoming
FAR WEST California Nevada Oregon Washington Alaska Hawaii
SOURCE: Compiled by AClR staff from data in Table A-9

Table A-9
MANUFACTURING EMPLOYMENT, BY REGION AND STATE, SELECTED YEARS, 1950-78 (in thousands)
Region and State UNITED STATES
NEW ENGLAND Connecticut Maine Massachusetts New Hampshire Rhode Island Vermont
MIDEAST Delaware District of Columbia Maryland New Jersey New York Pennsylvania
GREAT LAKES Illinois Indiana Michigan Ohio Wisconsin
PLAINS Iowa Kansas Minnesota Missouri Nebraska North Dakota South Dakota
3,886 69 15
242 71 5 est
1,483 1,362

SOUTHEAST 2,291.6 2,789.6 3,903.5 3,989 4,491 Alabama Arkansas Florida Georgia Kentucky Louisiana Mississippi North Carolina South Carolina Tennessee Virginia West Virginia
SOUTH WEST Arizona New Mexico Oklahoma Texas
ROCKY MOUNTAIN Colorado Idaho Montana Utah Wyoming
FAR WEST California Nevada Oregon Washington Alaska Hawaii
SOURCE: U.S. Department of Labor, Bureau of Labor Statistics, Employment and Earnings. States and Areas 1959-75. Bulletin 1370-12, 1977: and U.S. Department of Commerce, Bureau of the Census, Statistical Abstract of the United States, 1979.

Table A-10
NONAGRICULTURE EMPLOYMENT AS A PERCENT OF U.S. TOTAL, BY REGION AND STATE, SELECTED YEARS, 1 950-78
Region and State UNITED STATES
NEW ENGLAND Connecticut Maine Massachusetts New Hampshire Rhode Island Vermont
M l DEAST Delaware District of Columbia Maryland New Jersey New York Pennsylvania
GREAT LAKES Illinois Indiana Michigan Ohio Wisconsin
PLAl NS Iowa Kansas Minnesota Missouri Nebraska North Dakota South Dakota

w - w N - N *C?C?C?'SN N T O O O O
O O m m N w ? * " C ? t - : N O O O O O

Table A-1 1
NONAGRICULTURAL EMPLOYMENT, BY REGION AND STATE, SELECTED YEARS, 1950-78 (in thousands)
Region and State
U NlTED STATES
NEW ENGLAND Connecticut Maine Massachusetts New Hampshire Rhode Island Vermont
M l DEAST Delaware District of Columbia Maryland New Jersey New York Pennsylvania
GREAT LAKES Illinois Indiana Michigan Ohio Wisconsin
PLAl NS Iowa Kansas Minnesota Missouri Nebraska North Dakota South Dakota
1978
86,446
5,203 1,350
405 2,499
362 398 189
16,820 249 590'
1,586 2,700 est. 7,025 4,670
16,715 4,729 2,191 3,535 4,381 1,879
6,652 1,105
91 3 1,683 1,928
558 232 233
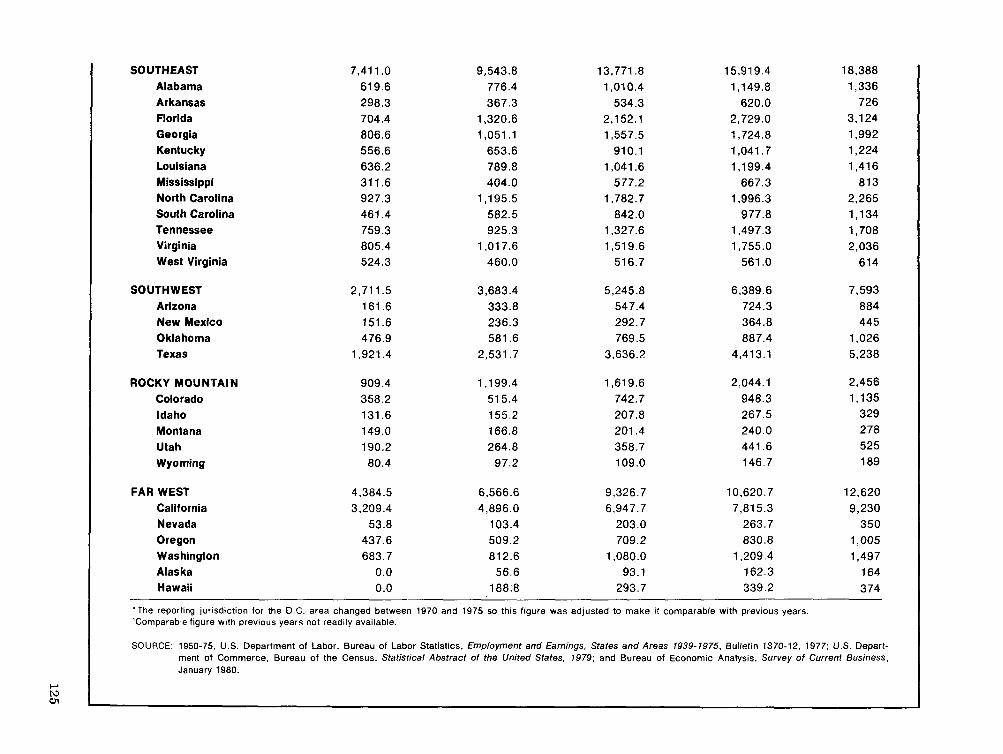
SOUTHEAST Alabama Arkansas Florida Georgia Kentucky Louisiana Mississippi North Carolina South Carolina Tennessee Virginia West Virginia
SOUTHWEST Arizona New Mexico Oklahoma Texas
ROCKY MOUNTAIN Colorado Idaho Montana Utah Wyoming
FAR WEST 4,384.5 6,566.6 9,326.7 10,620.7 12,620 California 3,209.4 4,896.0 6,947.7 7,815.3 9,230 Nevada 53.8 103.4 203.0 263.7 350 Oregon 437.6 509.2 709.2 830.8 1,005 Washington 683.7 81 2.6 1,080.0 1,209.4 1,497 Alaska 0.0 56.6 93.1 162.3 164 Hawaii 0.0 188.8 293.7 339.2 374
'The reporting jurisdiction for the D.C. area changed between 1970 and 1975 so this figure was adjusted to make it comparable with previous years. 'Comparable figure with previous years not readily available.
SOURCE. 1950-75, U.S. Department of Labor, Bureau of Labor Statistics, Employment and Earnings, States and Areas 1939-7975, Bulletin 1370-12, 1977; U.S. Depart- ment of Commerce, Bureau of the Census, Statistical Abstract of the United States, 1979: and Bureau of Economic Analysis. Survey of Current Business. January 1980.
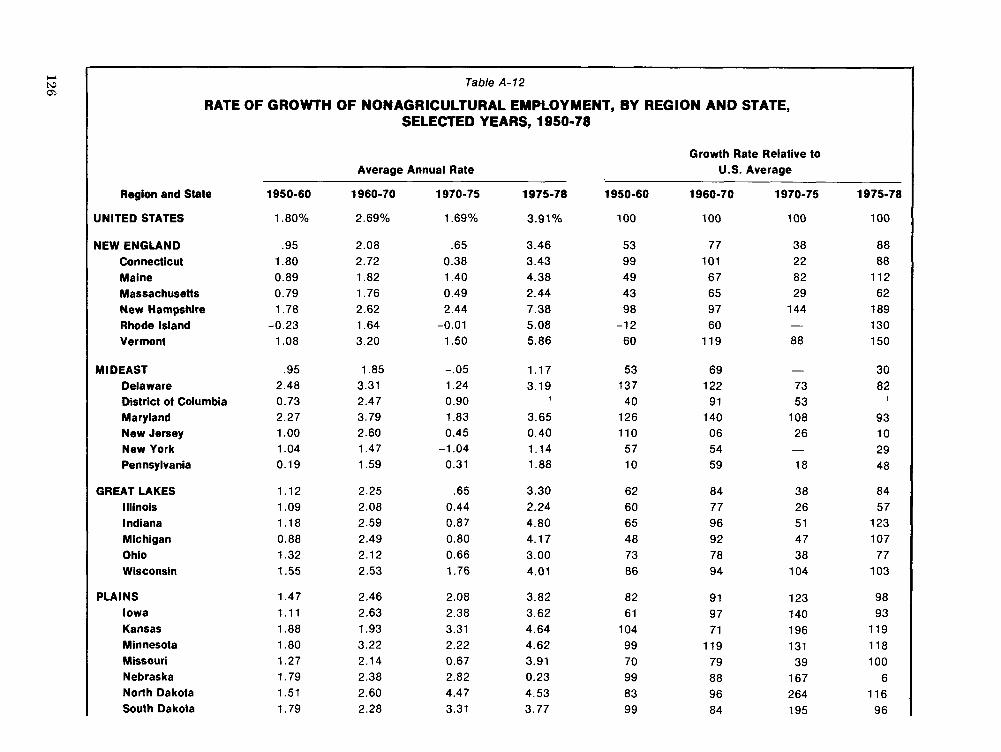
Table A-12
RATE OF GROWTH OF NONAGRICULTURAL EMPLOYMENT, BY REGION AND STATE, SELECTED YEARS, 1950-78
Average Annual Rate
Region and State
UNITED STATES
NEW ENGLAND Connecticut Maine Massachusetts New Hampshire Rhode Island Vermont
MI DEAST Delaware District of Columbia Maryland New Jersey New York Pennsylvania
GREAT LAKES Illinois Indiana Michigan Ohio Wisconsin
PLAINS Iowa Kansas Minnesota Missouri Nebraska North Dakota South Dakota
Growth Rate Relative to U.S. Average
1960-70 1970-75

SOUTHEAST 2.58 Alabama Arkansas Florida Georgia Kentucky Louisiana Mississippi North Carolina South Carolina Tennessee Virginia West Virginia
SOUTH WEST Alabama New Mexico Oklahoma Texas
ROCKY MOUNTAl N Colorado Idaho Montana Utah Wyoming
FAR WEST California Nevada Oregon Washington Alaska Hawaii
Mean Median
Standard Deviation v
'Not computed. See footnote 1, Table A-11.
SOURCE: AClR staff computations based on data from Table A-11.

Table A-13
UNEMPLOYMENT RATE, BY REGION AND STATE, 1973-78'
Region and State
UNITED STATES
NEW ENGLAND Connecticut Maine Massachusetts New Hampshire Rhode Island Vermont
MIDEAST Delaware District of Columbia Maryland New Jersey New York Pennsylvania
GREAT LAKES Illinois Indiana Michigan 0 hi0 Wisconsin
PLAINS Iowa Kansas Minnesota Missouri Nebraska North Dakota South Dakota
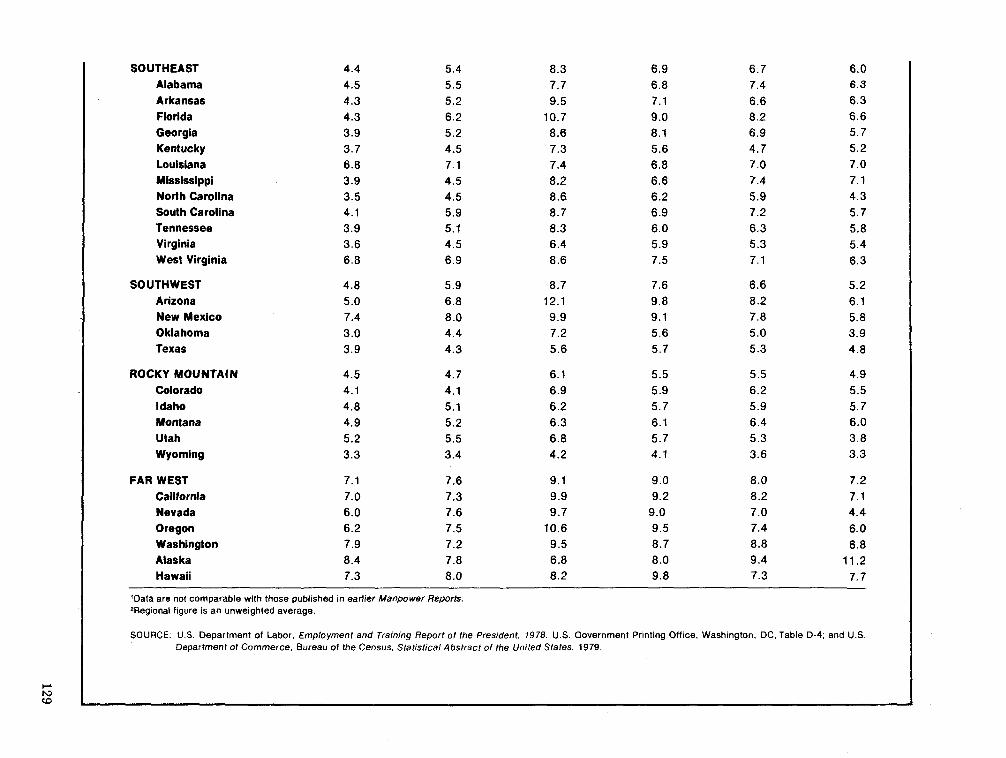
SOUTHEAST 4.4 5.4 8.3 6.9 6.7 6.0 Alabama 4.5 5.5 7.7 6.8 7.4 6.3 Arkansas 4.3 5.2 9.5 7.1 6.6 6.3 Florida 4.3 6.2 10.7 9.0 8.2 6.6 Georgia 3.9 5.2 8.6 8.1 6.9 5.7 Kentucky 3.7 4.5 7.3 5.6 4.7 5.2 Louisiana 6.8 7.1 7.4 6.8 7.0 7.0 Mississippi 3.9 4.5 8.2 6.6 7.4 7.1 North Carolina 3.5 4.5 8.6 6.2 5.9 4.3 South Carolina 4.1 5.9 8.7 6.9 7.2 5.7 Tennessee 3.9 5.1 8.3 6.0 6.3 5.8 Virginia 3.6 4.5 6.4 5.9 5.3 5.4 West Virginia 6.8 6.9 8.6 7.5 7.1 6.3
SOUTHWEST 4.8 5.9 8.7 7.6 6.6 5.2 Arizona 5.0 6.8 12.1 9.8 8.2 6.1 New Mexico 7.4 8.0 9.9 9.1 7.8 5.8 Oklahoma 3.0 4.4 7.2 5.6 5.0 3.9 Texas 3.9 4.3 5.6 5.7 5.3 4.8
ROCKY MOUNTAIN 4.5 4.7 6.1 5.5 5.5 4.9 Colorado 4.1 4.1 6.9 5.9 6.2 5.5 Idaho 4.8 5.1 6.2 5.7 5.9 5.7 Montana 4.9 5.2 6.3 6.1 6.4 6.0 Utah 5.2 5.5 6.8 5.7 5.3 3.8 Wyoming 3.3 3.4 4.2 4.1 3.6 3.3
FAR WEST 7.1 7.6 9.1 9.0 8.0 7.2 California 7.0 7.3 9.9 9.2 8.2 7.1 Nevada 6.0 7.6 9.7 9.0 7.0 4.4 Oregon 6.2 7.5 10.6 9.5 7.4 6.0 Washington 7.9 7.2 9.5 8.7 8.8 6.8 Alaska 8.4 7.8 6.8 8.0 9.4 11.2 Hawaii 7.3 8.0 8.2 9.8 7.3 7.7
'Data are not comparable with those published in earlier Manpower Reports. 2Regional figure is an unweighted average.
SOURCE: U.S. Department of Labor, Employment and Training Report of the President. 1978. US. Government Printing Office, Washington, DC. Table D-4; and US. Department of Commerce. Bureau of the Census. Statistical Abstract of the United States. 1979.

Table A-14
UNEMPLOYMENT RATE RELATIVE TO U.S. AVERAGE. BY REGION AND STATE.
Region1 and State
UNITED STATES
NEW ENGLAND Connecticut Maine Massachusetts New Hampshire Rhode Island Vermont
MIDEAST Delaware District of Columbia Maryland New Jersey New York Pennsylvania
GREAT LAKES Illinois Indiana Michigan Ohio Wisconsin
PLAINS Iowa Kansas Minnesota Missouri Nebraska North Dakota South Dakota

1 SOUTHEAST 90 96 98 90 96 100 Alabama Arkansas Florida Georgia Kentucky Louisiana Mississippi North Carolina South Carolina Tennessee Virginia West Virginia
SOUTHWEST Arizona New Mexico Oklahoma Texas
ROCKY MOUNTAIN Colorado Idaho Montana Utah Wyoming
FAR WEST California Nevada Oregon Washington Alaska Hawaii
'Regional figure is an unweighted average.
SOURCE: Computations based on data from Table A-73.
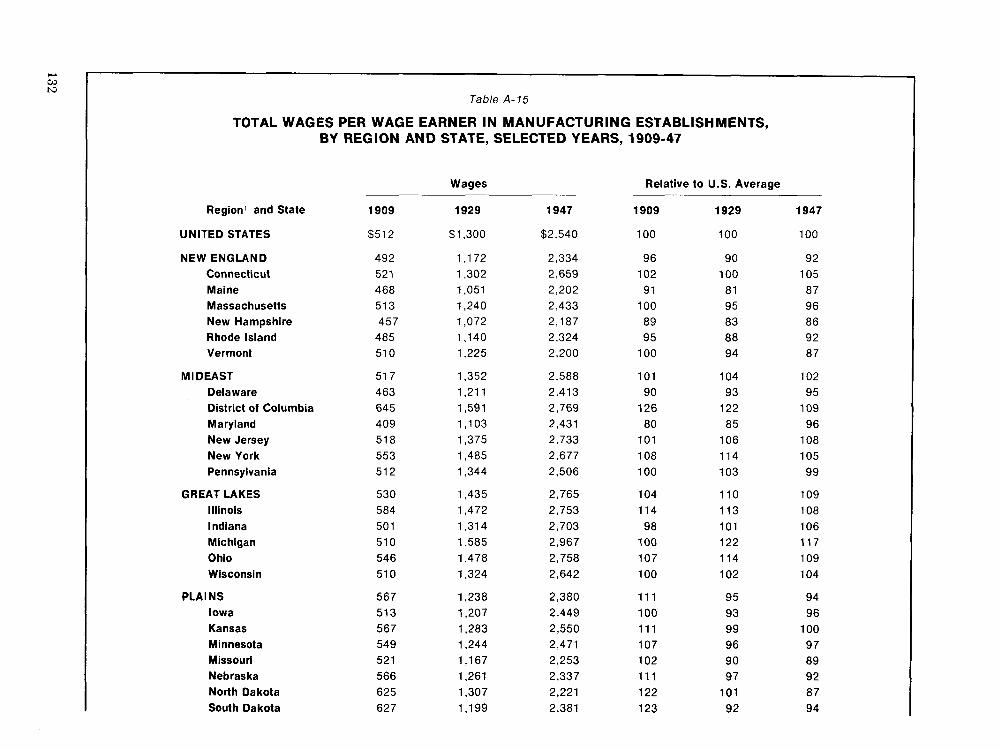
Table A-15
TOTAL WAGES PER WAGE EARNER IN MANUFACTURING ESTABLISHMENTS, BY REGION AND STATE, SELECTED YEARS, 1909-47
Region1 and State
UNITED STATES
NEW ENGLAND Connecticut Maine Massachusetts New Hampshire Rhode Island Vermont
M l DEAST Delaware District of Columbia Maryland New Jersey New York Pennsylvania
GREAT LAKES Illinois Indiana Michigan Ohio Wisconsin
PLAINS Iowa Kansas Minnesota Missouri Nebraska North Dakota South Dakota
Wages Relative to U.S. Average

SOUTHEAST Alabama Arkansas Florida Georgia Kentucky Louisiana Mississippi North Carolina South Carolina Tennessee Virginia West Virginia
SOUTHWEST 61 0 Arizona 846 New Mexico 540 Oklahoma 536 Texas 51 6
ROCKY MOUNTAl N Colorado Idaho Montana Utah Wyoming
FAR WEST 771 California 71 0 Nevada 962 Oregon 691 Washington 720
'Regional figure is an unweighted average.
SOURCE: Simon Kuznets, Ann Ratner Miller, and Richard A. Easterlin, Population Redistribution and Economic Growth. United States, 1870- 1950: Vol. II of Analyses of Economic Change. The American Philosophical Society, 1960. Table A3.5.

Region2 and State
NEW ENGLAND Connecticut Maine Massachusetts New Hampshire Rhode Island Vermont
MI DEAST Delaware Maryland New Jersey New York Pennsylvania
GREAT LAKES Illinois Indiana Michigan Ohio Wisconsin
PLAINS Iowa Kansas Minnesota Missouri Nebraska North Dakota South Dakota
Table A- 16
AVERAGE HOURLY EARNINGS OF PRODUCTION WORKERS ON MANUFACTURING PAYROLLS, BY REGION AND STATE,
SELECTED YEARS 1955-78'
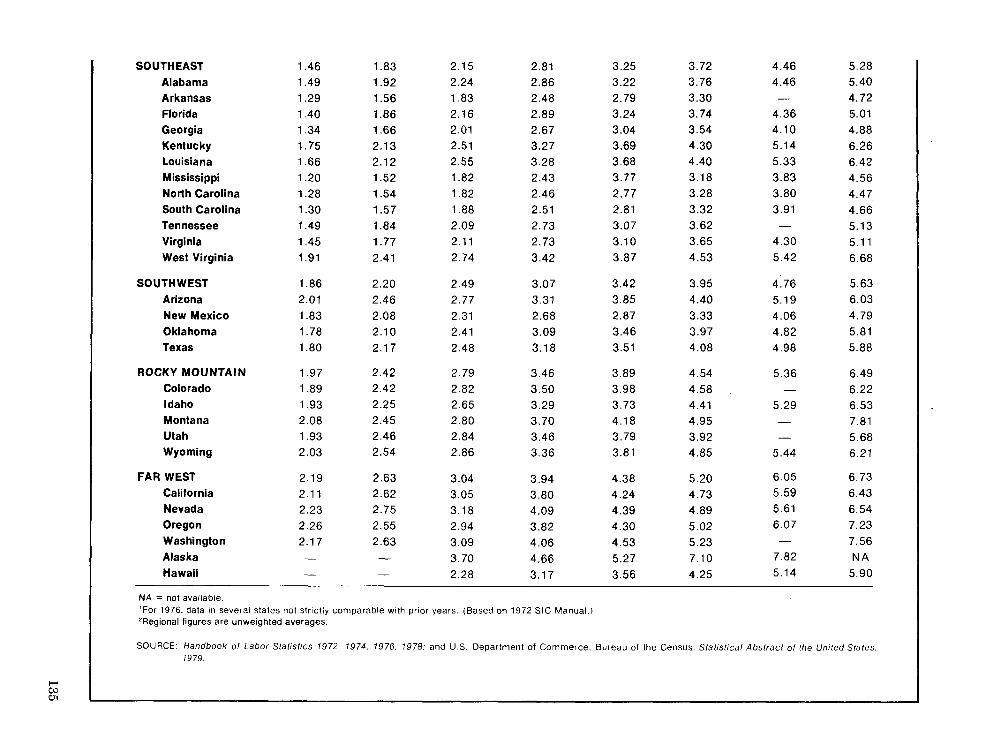
SOUTHEAST Alabama Arkansas Florida Georgia Kentucky Louisiana Mississippi North Carolina South Carolina Tennessee Virginia West Virginia
SOUTHWEST Arizona New Mexico Oklahoma Texas
ROCKY MOUNTAIN Colorado Idaho Montana Utah Wyoming
FAR WEST California Nevada Oregon Washington Alaska Hawaii
NA = not available. 'For 1976. data in several states not str~ctly comparable with prior years. (Based on 1972 SIC Manual.) ZRegional figures are unweighted averages.
SOURCE Handbook of Labor Statistfcs 1972. 7974. 1976. 1978: and U.S. Department of Commerce. Bureau of the Census, Statistical Abstract ot the United States. 1979.

Table A-1 7
STATE AVERAGE HOURLY EARNINGS FOR PRODUCTION WORKERS ON MANUFACTURING PAYROLLS RELATIVE TO U.S. AVERAGE,
SELECTED YEARS, 1965-78
State
UNITED STATES NEW ENGLAND
Connecticut Maine Massachusetts New Hampshire Rhode Island Vermont
MI DEAST Delaware Maryland New Jersey New York Pennsylvania
GREAT LAKES Illinois Indiana Michigan 0 hio Wisconsin
PLAl NS Iowa Kansas Minnesota Missouri Nebraska North Dakota South Dakota
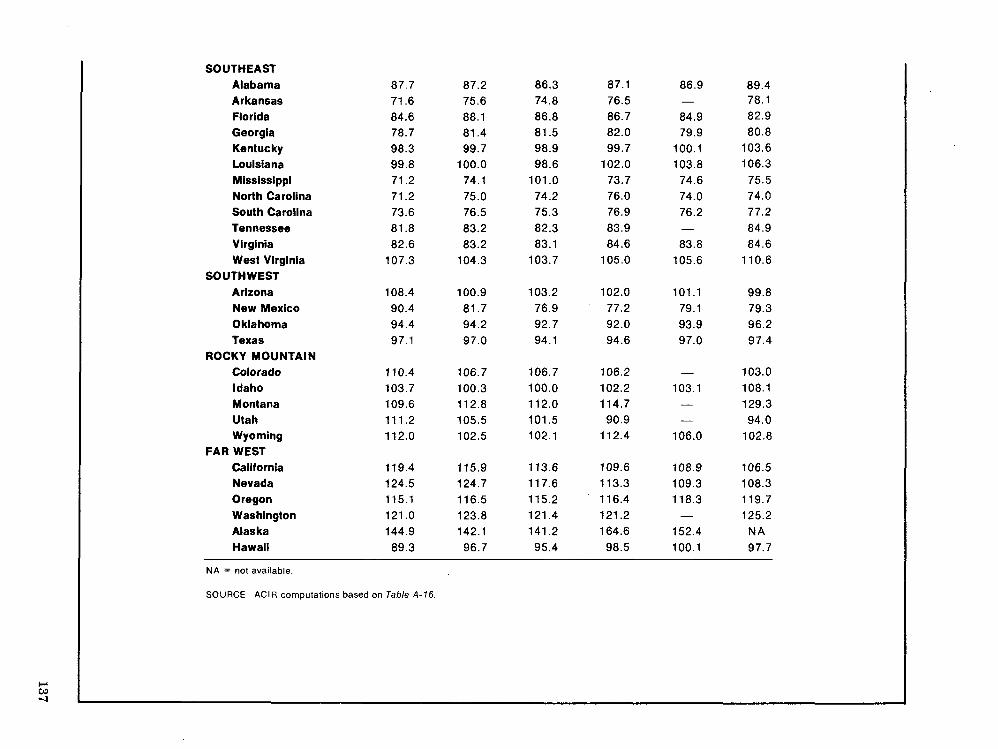
SOUTHEAST Alabama Arkansas Florida Georgia Kentucky Louisiana Mississippi North Carolina South Carolina Tennessee Virginia West Virginia
SOUTHWEST Arizona New Mexico 0 kla homa Texas
ROCKY MOUNTAIN Colorado Idaho Montana Utah Wyoming
FAR WEST California Nevada Oregon Washington Alaska Hawaii
NA = not available.
SOURCE AClR computatlons based on Table A-16
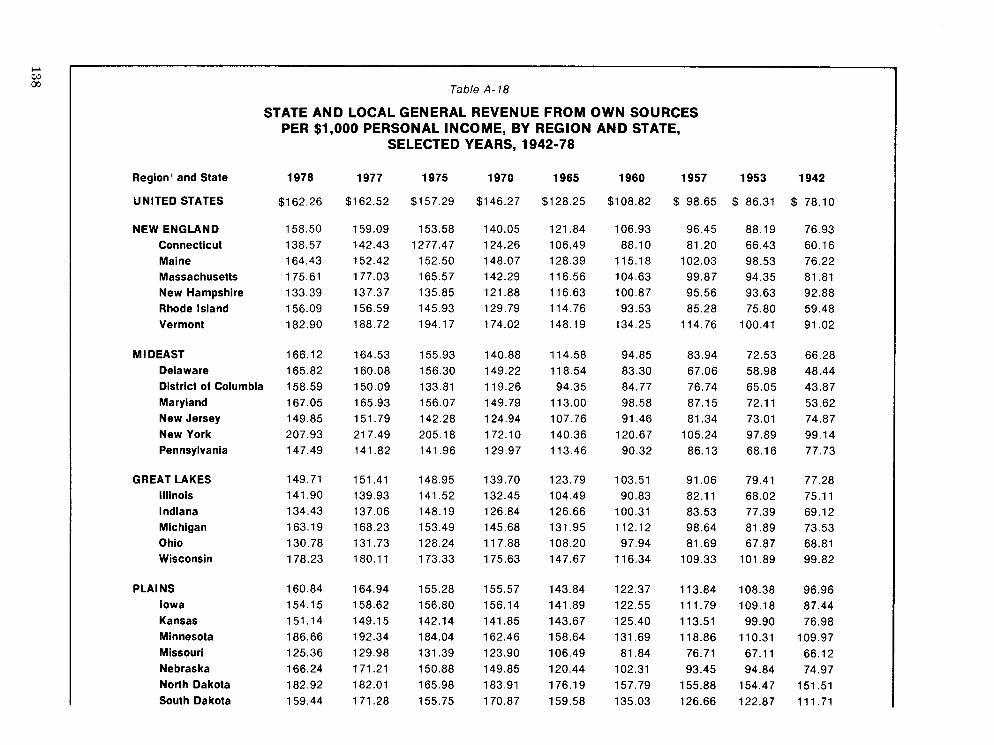
Table A- 18
STATE AND LOCAL GENERAL REVENUE FROM OWN SOURCES PER $1,000 PERSONAL INCOME, BY REGION AND STATE,
SELECTED YEARS, 1942-78
Region1 and State
UNITED STATES
NEW ENGLAND Connecticut Maine Massachusetts New Hampshire Rhode Island Vermont
M l DEAST Delaware District of Columbia Maryland New Jersey New York Pennsylvania
GREAT LAKES Illinois Indiana Michigan Ohio Wisconsin
PLAl NS Iowa Kansas Minnesota Missouri Nebraska North Dakota South Dakota

SOUTHEAST Alabama Arkansas Florida Georgia Kentucky Louisiana Mississippi North Carolina South Carolina Tennessee Virginia West Virginia
SOUTHWEST Arizona New Mexico Oklahoma Texas
ROCKY MOUNTAIN Colorado Idaho Montana Utah Wyoming
FAR WEST California Nevada Oregon Washington Alaska Hawaii
I Regional figures are unweighted averages. 'Not included in regional averages.
SOURCE: ACIR computations from U.S. Department of Commerce, Bureau of the Census, Governmental Finances. various issues
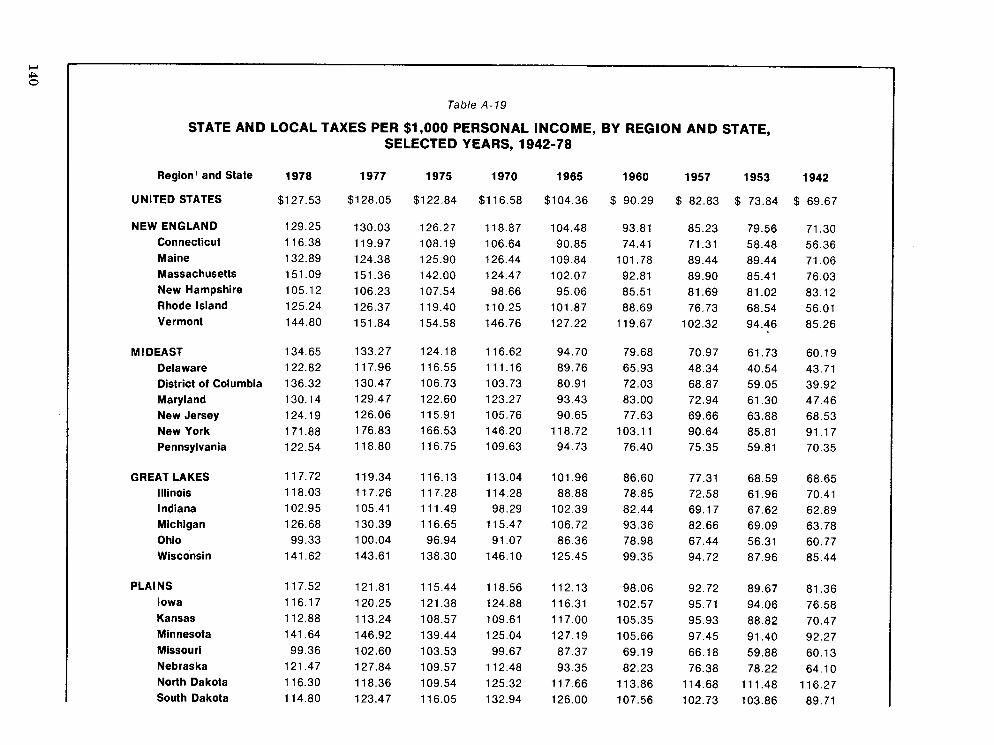
Table A-19
STATE AND LOCAL TAXES PER $1,000 PERSONAL INCOME, BY REGION AND STATE, SELECTED YEARS, 1942-78
Region1 and State
UNITED STATES
NEW ENGLAND Connecticut Maine Massachusetts New Hampshire Rhode Island Vermont
M l DEAST Delaware District of Columbia Maryland New Jersey New York Pennsylvania
GREAT LAKES Illinois Indiana Michigan Ohio Wisconsin
PLAINS Iowa Kansas Minnesota Missouri Nebraska North Dakota South Dakota

SOUTHEAST Alabama Arkansas Florida Georgia Kentucky Louisiana Mississippi North Carolina South Carolina Tennessee Virginia West Virginia
SOUTHWEST Arizona New Mexico Oklahoma Texas
ROCKY MOUNTAIN Colorado Idaho Montana Utah Wyoming
FAR WEST California Nevada Oregon Washington Alaska Hawaii
' Regional figures are unweighted averages. 'Not included in regional averages. SOURCE: AClR computations from U.S. Department of Commerce. Bureau of the Census. Governmental Finances, various issues
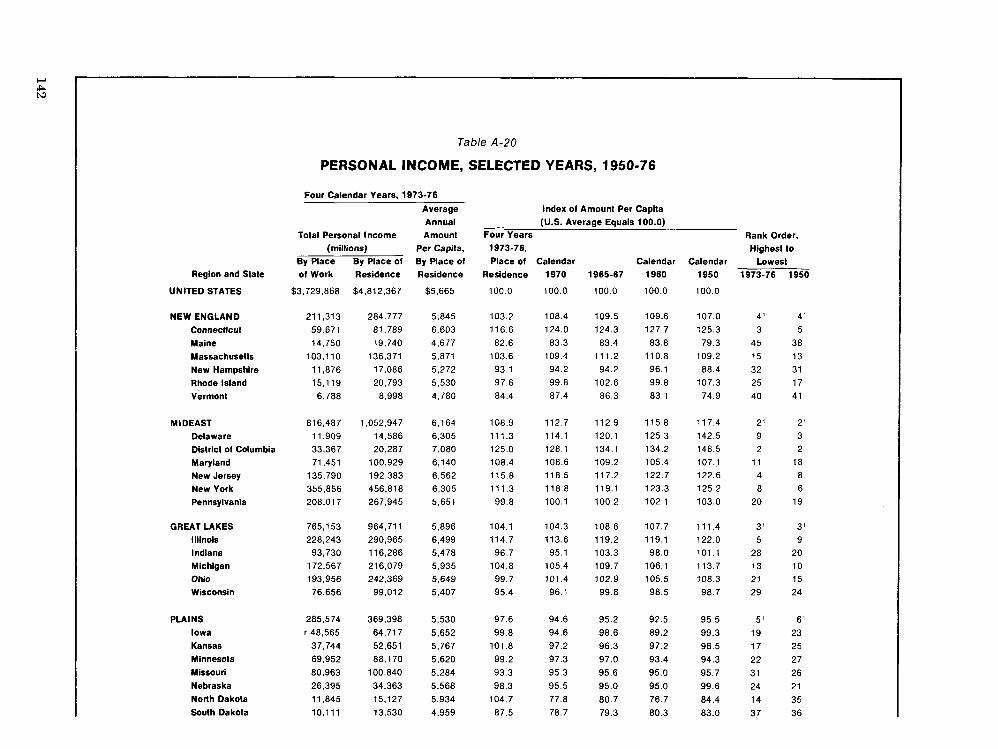
Region and State
UNITED STATES
NEW ENGLAND Connecticut Maine Massachusetts New Hampshire Rhode Island ~ermont
MIDEAST Delaware District of Columbia Maryland New Jersey New York Pennsylvania
GREAT LAKES Illinois Indiana Michigan Ohio Wisconsin
PLAINS Iowa Kansas Minnesota Missouri Nebraska North Dakota South Dakota
Table A-20
PERSONAL INCOME, SELECTED YEARS, 1950-76
Four Calendar Years, 1973-76
Average Index of Amount Per Capita
Total Personal Income (millions)
By Place By Place of of Work
$3.729.868
21 1,313
59,671 14,750
103.110 11,876
15.119
6,788
816,487
11,909
33,367 71,451
135,790 355.856 208.01 7
765,153 228,243
93,730 172.567
193.956 76,656
285,574
r 48,565 37,744
69,952
80,963
26,395 11,845
10,111
Residence
$4,812,367
284.777
81,789
19,740
136.371 17.086
20,793 8,998
1,052,947 14,586
20,287 100,929 192.383
456.818 267,945
964,711 290.965 116,286 216.079 242.369
99.012
369,398 64,717
52,651
88,170 100,840
34,363
15,127
13,530
Annual Amount
Per Capita, By Place of Residence
$5,665
5.845 6,603
4.677
5.871 5,272
5,530 4,780
6.164
6.305 7.080 6,140
6.562 6,305 5,651
5,896
6,499 5.478 5.935 5,649 5,407
5,530
5,652
5,767 5,620
5.284
5.568
5.934 4,959
- (U.S. Average Equals 100.0) Four Years 1973-76, Place of Calendar
Residence
100.0
103.2 116.6
82.6 103.6
93.1
97.6 84.4
108.9 111.3
125.0 108.4 115.8 11 1.3
99.8
104.1 114.7 96.7
104.8 99.7
95.4
97.6
99.8 101.8
99.2
93.3
98.3 104.7
87.5
Calendar 1960
100.0
109.6 127.7
83.8
110.8 96.1 99.8
83.1
11 5.8 125.3
134.2 105.4 122.7
123.3 102.1
107.7 119.1 98.0
106.1 105.5 98.5
92.5 89.2
97.2
93.4
95.0
95.0
76.7
80.3
Calendar 1950
100.0
107.0 125.3
79.3 109.2
88.4 107.3
Rank Order, Highest to
Lowest 1973-76 1950
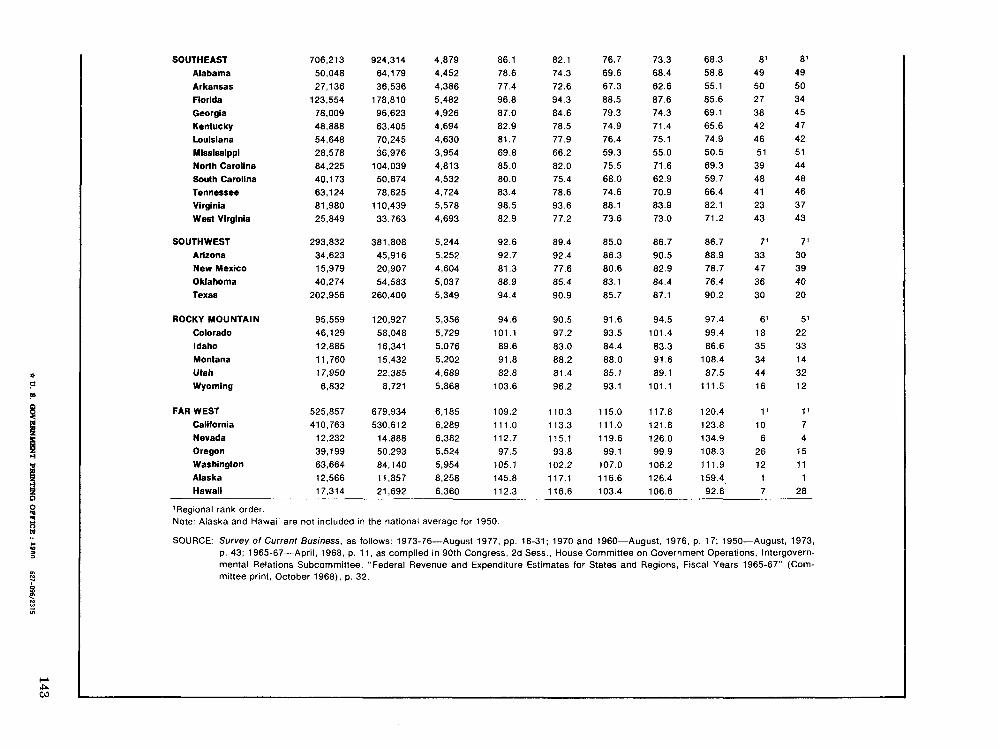
SOUTHEAST Alabama Arkansas Florida Georgia Kentucky Louisiana Mississippi Norlh Carolina South Carolina Tennessee Virginia West Virginia
SOUTHWEST Arizona New Mexico Oklahoma Texas
ROCKY MOUNTAIN Colorado Idaho Montana Utah Wyoming
FAR WEST California Nevada Oregon Washington Alaska Hawaii 21,692 . . - - 116.6 . . 106.6
'Regional rank order. Note: Alaska and Hawaii are not included in the national average for 1950.
SOURCE: Survey of Current Business, as follows: 1973-76-August 1977, pp. 18-31; 1970 and 1960-August, 1976, p. 17; 1950-August, 1973, P. 43; 1965-67-April, 1968, p. 11, as compiled in 90th Congress, 2d Sess., House Committee on Government Operations. Intergovern- mental Relations Subcommittee, "Federal Revenue and Expenditure Estimates for States and Regions, Fiscal Years 1965-67" (Com- mittee print, October 1968). p. 32.