Embed Size (px)
Citation preview

Regional geospatial workflows and potential applications to the Sustainable Development Goals of Arab countries: A case study on marine and coastal indicators in the Mediterranean Sea
Ameer Abdulla, PhD
Senior Scientist, European Topic Center, University of MalagaAssociate Professor, Global Change Institute, University Queensland
Main contributors:
• Ameer Abdulla (ETC-UMA Senior Advisor; Assoc. Prof. GCI,UQ)
• Dania Abdul Malak (ETC-UMA; Director)
• Christoph Schröder (ETC-UMA; GIS and Data Expert)

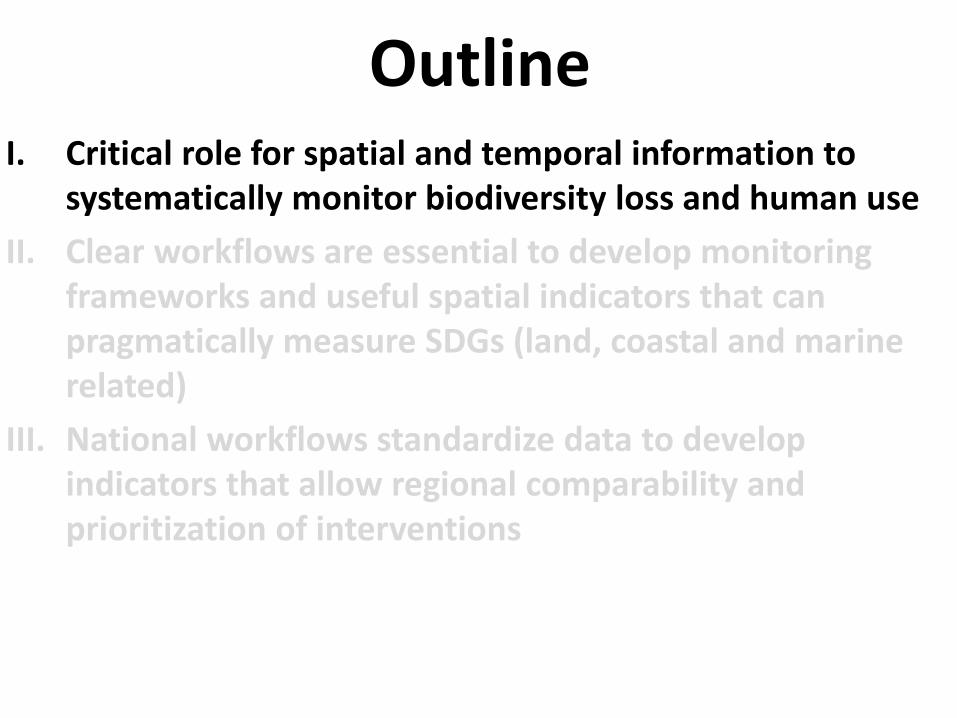
OutlineI. Critical role for spatial and temporal information to
systematically monitor biodiversity loss and human use
II. Clear workflows are essential to develop monitoring frameworks and useful spatial indicators that can pragmatically measure SDGs (land, coastal and marine related)
III. National workflows standardize data to develop indicators that allow regional comparability and prioritization of interventions

Potential of spatial information to monitor biodiversity loss and human use
• Monitoring can be done through – data coming from observation (inventories, field
sampling, field mapping, remote sensing, image interpretation) => precise and standardised
– modelled data => less precise, used for gap-filling
• Independently of the source, any type of data generated needs to be validated – Stake holders
– Ground truthing in the field

Types of spatial data used for SDG assessments
• NSDI fundamental layers
• Topographic reference layer
• Statistical data with geographic reference
• Sampling/survey data
• Modelled data
• Reporting data
• Remote sensing data

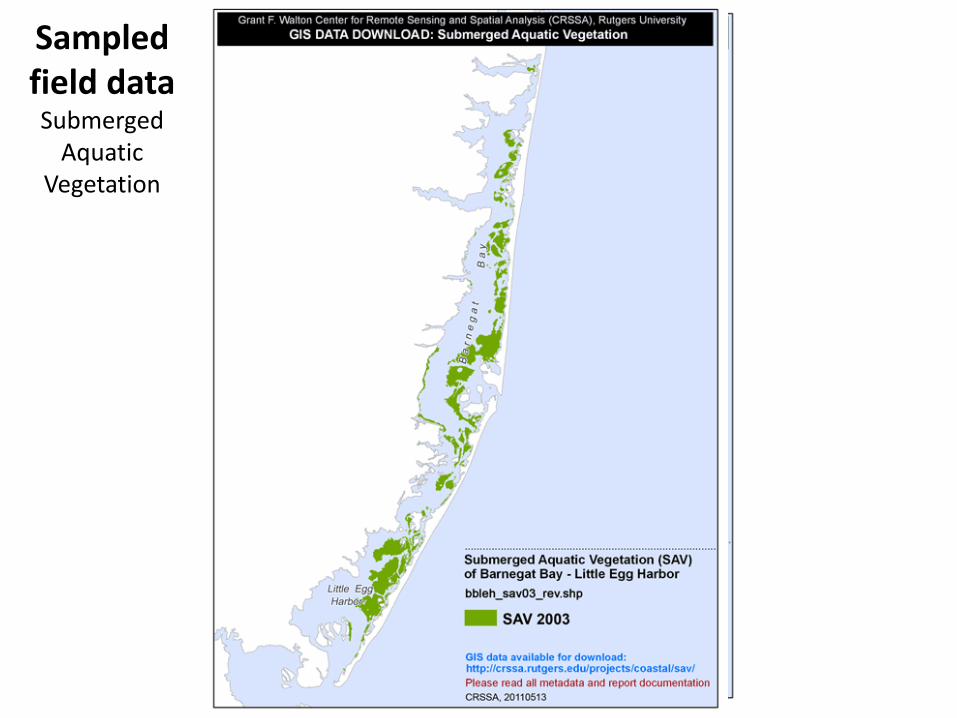
Sampled field dataSubmerged
Aquatic Vegetation

Sampled field dataSubmerged
Aquatic Vegetation

Sampled field dataSubmerged
Aquatic Vegetation

Sampled field dataSubmerged
Aquatic Vegetation
Sampled field dataSubmerged
Aquatic Vegetation

Sampled field dataSubmerged
Aquatic Vegetation
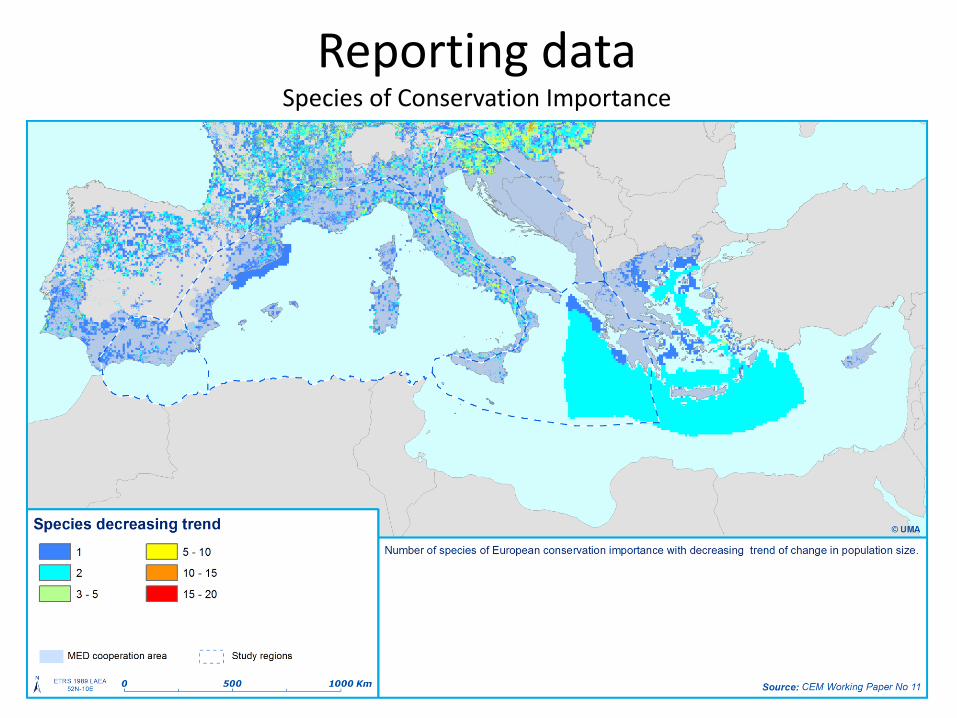
Reporting dataSpecies of Conservation Importance
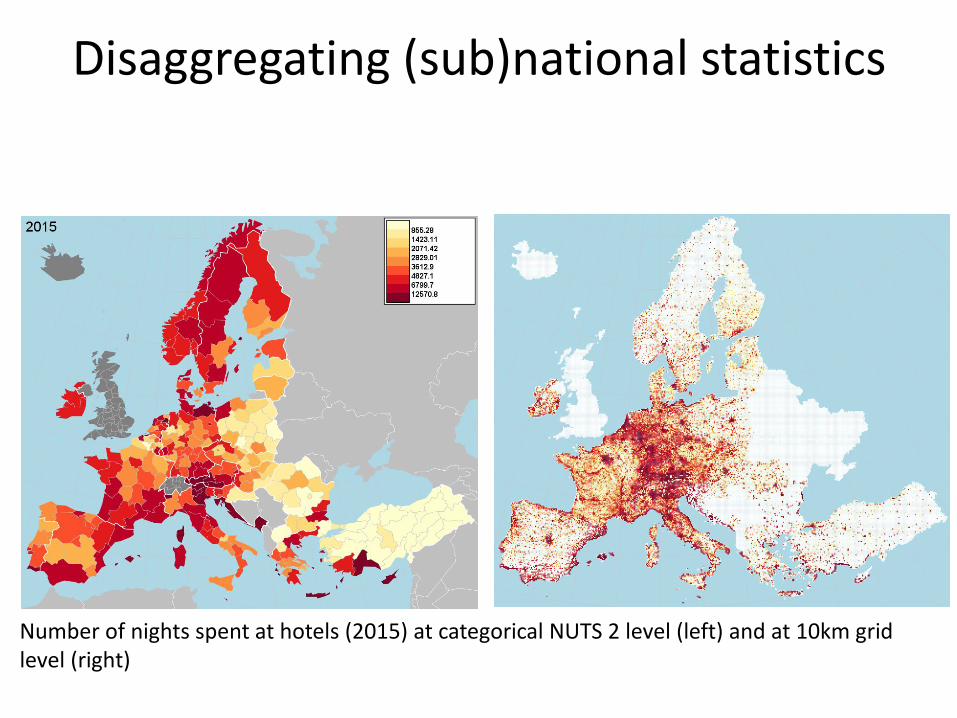
Disaggregating (sub)national statistics
Number of nights spent at hotels (2015) at categorical NUTS 2 level (left) and at 10km grid level (right)
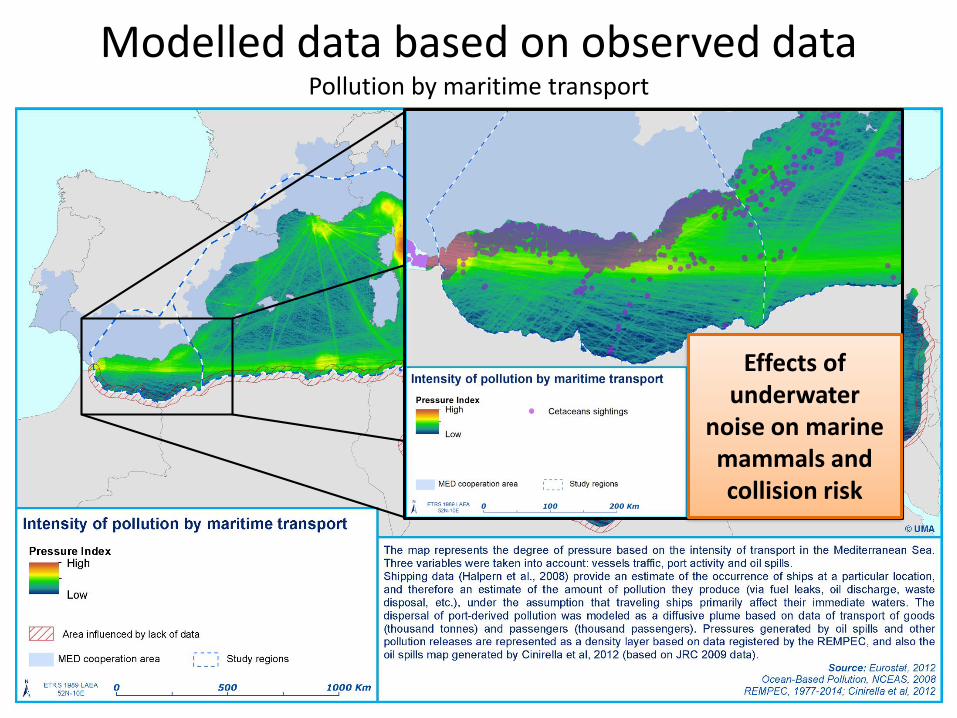
Modelled data based on observed dataPollution by maritime transport
Effects of underwater
noise on marine mammals and collision risk

Combination of observed & modelled dataInvasive Alien Species (IAS) due to maritime transport

Modelled data based on national statisticsNutrient Input

From local data to global assessment

Human Pressure Indicator

Developing a Cumulative Impacts Indicatorfrom composite data sets and models


OutlineI. Critical role for spatial and temporal information to
systematically monitor biodiversity loss and human use
II. Clear workflows are essential to develop monitoring frameworks and useful spatial indicators that can pragmatically measure SDGs (land, coastal and marine related)
III. National workflows standardize data to develop indicators that allow regional comparability and prioritization of interventions
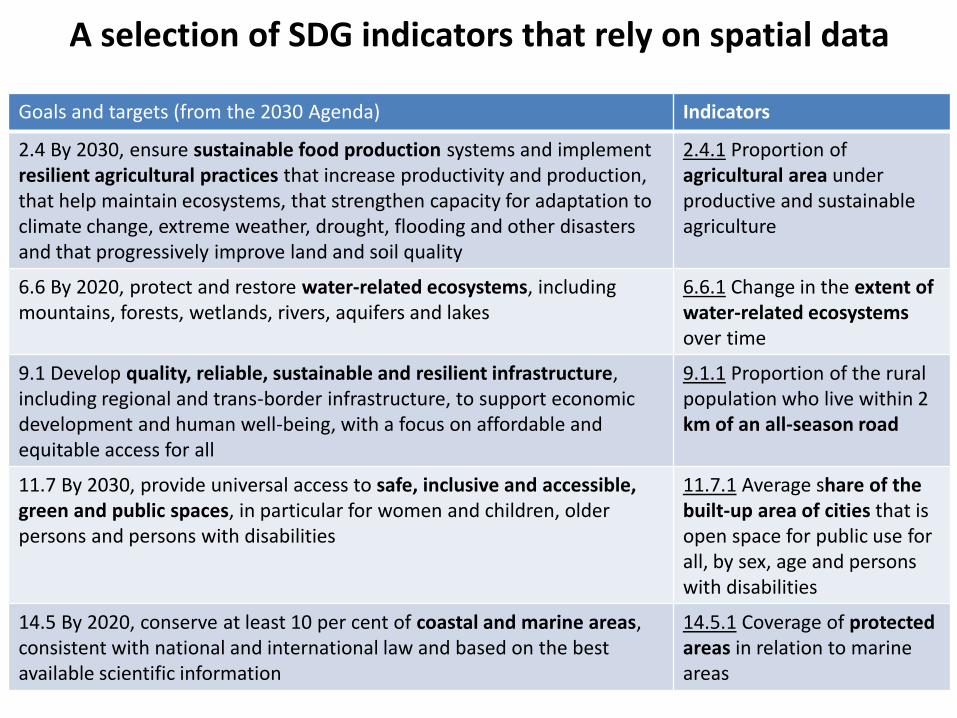
Goals and targets (from the 2030 Agenda) Indicators
2.4 By 2030, ensure sustainable food production systems and implement resilient agricultural practices that increase productivity and production, that help maintain ecosystems, that strengthen capacity for adaptation to climate change, extreme weather, drought, flooding and other disasters and that progressively improve land and soil quality
2.4.1 Proportion of agricultural area under productive and sustainable agriculture
6.6 By 2020, protect and restore water-related ecosystems, including mountains, forests, wetlands, rivers, aquifers and lakes
6.6.1 Change in the extent of water-related ecosystemsover time
9.1 Develop quality, reliable, sustainable and resilient infrastructure, including regional and trans-border infrastructure, to support economic development and human well-being, with a focus on affordable and equitable access for all
9.1.1 Proportion of the rural population who live within 2km of an all-season road
11.7 By 2030, provide universal access to safe, inclusive and accessible, green and public spaces, in particular for women and children, older persons and persons with disabilities
11.7.1 Average share of the built-up area of cities that is open space for public use for all, by sex, age and persons with disabilities
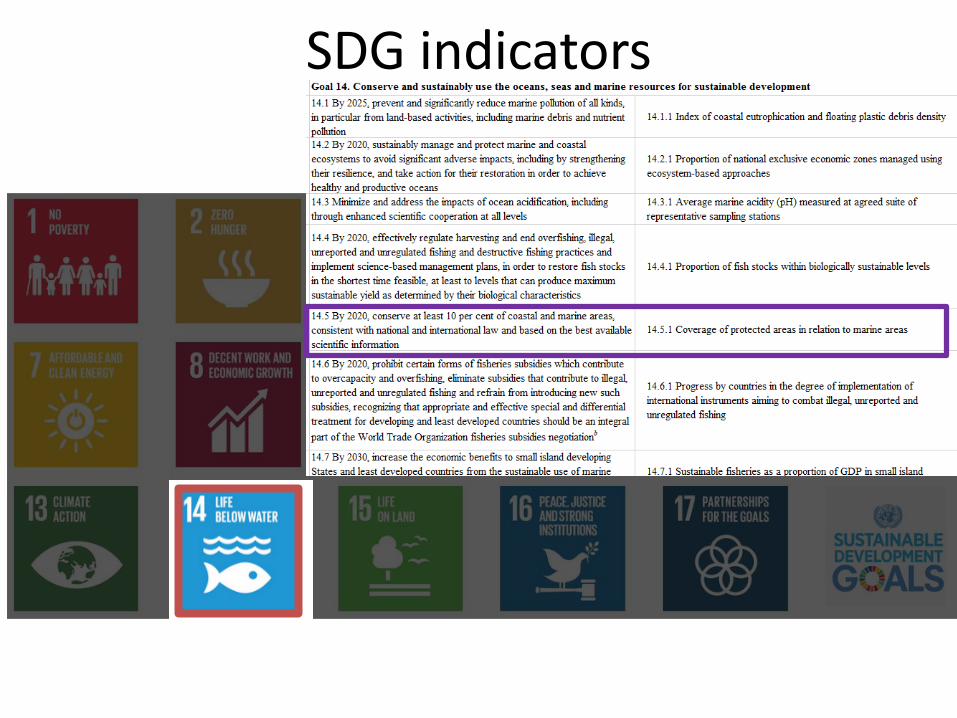
14.5 By 2020, conserve at least 10 per cent of coastal and marine areas, consistent with national and international law and based on the best available scientific information
14.5.1 Coverage of protected areas in relation to marine areas
A selection of SDG indicators that rely on spatial data

Goals and targets (from the 2030 Agenda) Indicators
2.4 By 2030, ensure sustainable food production systems and implement resilient agricultural practices that increase productivity and production, that help maintain ecosystems, that strengthen capacity for adaptation to climate change, extreme weather, drought, flooding and other disasters and that progressively improve land and soil quality
2.4.1 Proportion of agricultural area under productive and sustainable agriculture
6.6 By 2020, protect and restore water-related ecosystems, including mountains, forests, wetlands, rivers, aquifers and lakes
6.6.1 Change in the extent of water-related ecosystemsover time
9.1 Develop quality, reliable, sustainable and resilient infrastructure, including regional and trans-border infrastructure, to support economic development and human well-being, with a focus on affordable and equitable access for all
9.1.1 Proportion of the rural population who live within 2km of an all-season road
11.7 By 2030, provide universal access to safe, inclusive and accessible, green and public spaces, in particular for women and children, older persons and persons with disabilities
11.7.1 Average share of the built-up area of cities that is open space for public use for all, by sex, age and persons with disabilities
14.5 By 2020, conserve at least 10 per cent of coastal and marine areas, consistent with national and international law and based on the best available scientific information
14.5.1 Coverage of protected areas in relation to marine areas
A selection of SDG indicators that rely on spatial data

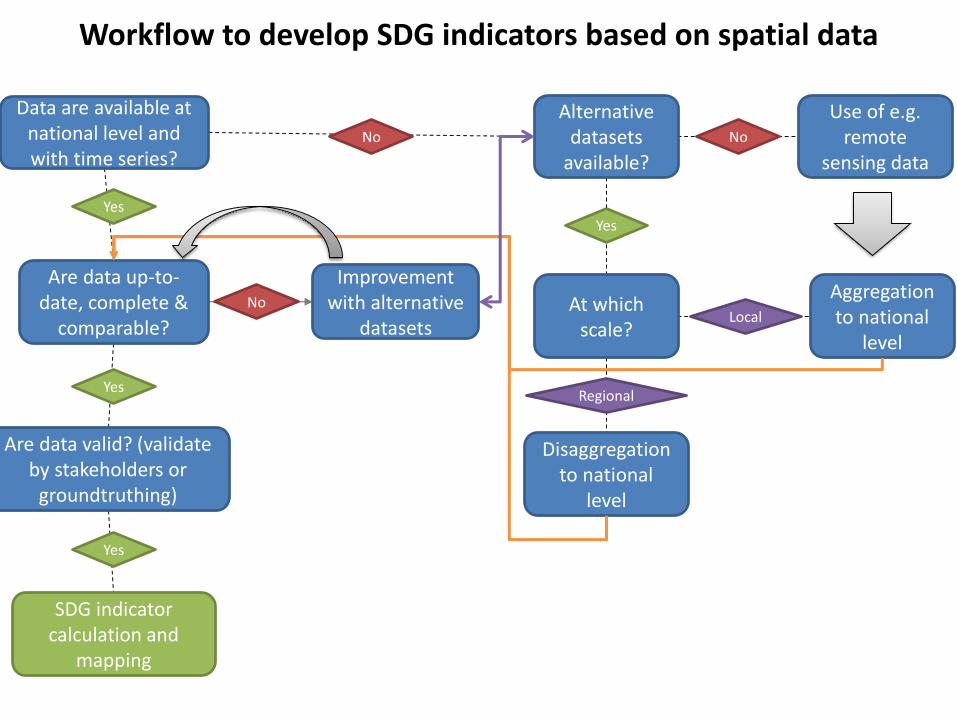
SDG indicators will require:
1. RELIABILITY of data sources (official sources, peer-reviewed methodologies, validation, ground truthing)
2. HARMONISATION of data (coming from different sources) and methods
3. REPEATABILITY of methodologies to ensure monitoring of indicators
4. AVAILIBILITY of time series

Data are available at national level and with time series?
Yes
Are data up-to-date, complete &
comparable?
Yes
Are data valid? (validate by stakeholders or
groundtruthing)
Yes
SDG indicator calculation and
mapping
Workflow to develop SDG indicators based on spatial data

Data are available at national level and with time series?
Yes
No
Are data up-to-date, complete &
comparable?
Yes
Are data valid? (validate by stakeholders or
groundtruthing)
Yes
SDG indicator calculation and
mapping
Alternative datasets
available?
Yes
No
Use of e.g. remote
sensing data
At which scale?
Local
Regional
Aggregation to national
level
Disaggregation to national
level
Workflow to develop SDG indicators based on spatial data
Data are available at national level and with time series?
Yes
No
Are data up-to-date, complete &
comparable?
Yes
No
Are data valid? (validate by stakeholders or
groundtruthing)
Yes
SDG indicator calculation and
mapping
Alternative datasets
available?
Yes
No
Improvement with alternative
datasets
Use of e.g. remote
sensing data
At which scale?
Local
Regional
Aggregation to national
level
Disaggregation to national
level
Workflow to develop SDG indicators based on spatial data

Technical Competence
Data are available at national level and with time series?
Yes
No
Are data up-to-date, complete &
comparable?
Yes
No
Are data valid? (validate by stakeholders or
groundtruthing)
Yes
No
SDG indicator calculation and
mapping
Alternative datasets
available?
Yes
No
Improvement with alternative
datasets
Use of e.g. remote
sensing data
At which scale?
Local
Regional
Aggregation to national
level
Disaggregation to national
level
Improvement with alternative
datasets
Workflow to develop SDG indicators based on spatial data
OutlineI. Critical role for spatial and temporal information to
systematically monitor biodiversity loss and human use
II. Clear workflows are essential to develop monitoring frameworks and useful spatial indicators that can pragmatically measure SDGs (land, coastal and marine related)
III. National workflows standardize data to develop indicators that allow regional comparability and prioritization of interventions

SDG indicators

Data are available at national level?
Yes
No
Are data up-to-date, complete &
comparable?
Yes
No
Are data valid (validation by stakeholders)?
Yes
No
SDG indicator calculation and
mapping
Alternative datasets
available?
Yes
No
Improvement with alternative
datasets
Use of remote sensing data
At which scale?
Local
Regional
Aggregation to national
level
Disaggregation to national
level
Improvement with alternative
datasets
Workflow to develop SDG indicator based on spatial data

Satellite-based coastal wetland monitoring
Landsat TM 29-03-2005Landsat TM 01-06-2005Landsat TM 21-09-2005

Satellite-based wetland monitoring


Aggregation of site data to national extent data
Source: MWO 2012
SDG indicators

Data are available at national level?
Yes
No
Are data up-to-date, complete &
comparable?
Yes
No
Are data valid (validation by stakeholders)?
Yes
No
SDG indicator calculation and
mapping
Alternative datasets
available?
Yes
No
Improvement with alternative
datasets
Use of remote sensing data
At which scale?
Local
Regional
Aggregation to national
level
Disaggregation to national
level
Improvement with alternative
datasets
Workflow to develop SDG indicator based on spatial data

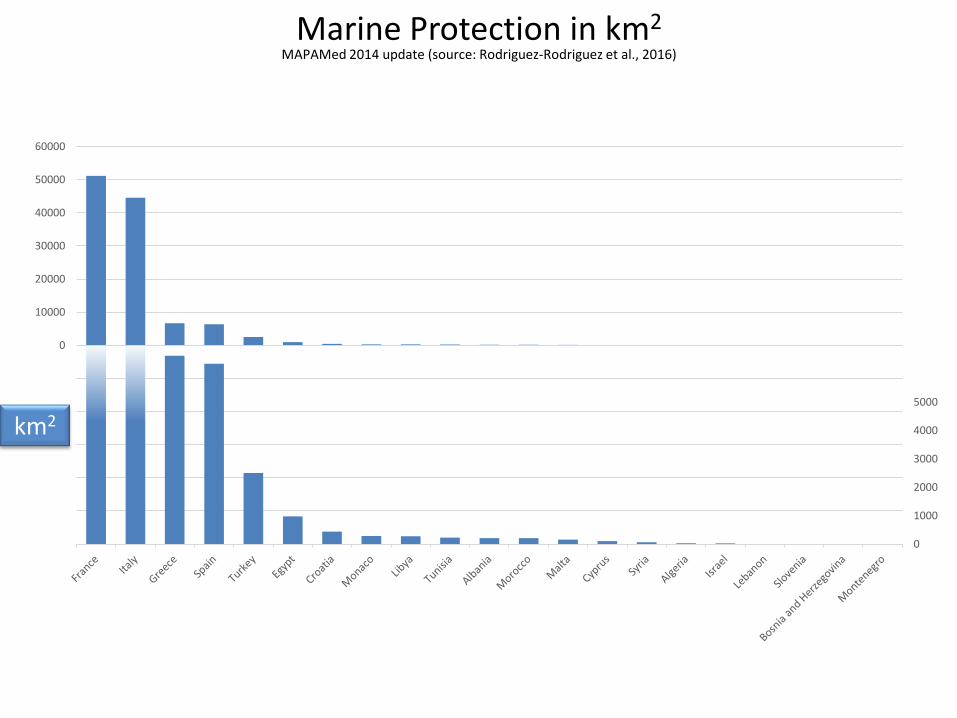
Marine Protection 2007

Marine Protection 2014MAPAMed 2014 update (source: Rodriguez-Rodriguez et al., 2016)

Rodríguez-Rodríguez et al.2016. Marine protected areas and fishing reserves in the Mediterranean: assessing “actual” marine biodiversity protection at multiple scales.
0
1000
2000
3000
4000
5000
0
10000
20000
30000
40000
50000
60000
Marine Protection in km2
MAPAMed 2014 update (source: Rodriguez-Rodriguez et al., 2016)
km2

Marine Protection in km2
MAPAMed 2014 update (source: Rodriguez-Rodriguez et al., 2016)
0
1000
2000
3000
4000
5000
0
10000
20000
30000
40000
50000
60000
km2
CBD Aichi Target 11 and SDG 14.5 of 10% EEZ Conservation
Monaco 100%France 59.19%Spain 11.82%
Turkey 10.29%Italy 8.55%Croatia 8.48%
Morocco 1.68%Tunis 0.90%Egypt 0.57%
Syria 0.61%, 0.10%Libya 0.08%Lebanon 0.02%

0
1000
2000
3000
4000
5000
0
10000
20000
30000
40000
50000
60000
Marine Protection in km2
MAPAMed 2014 update (source: Rodriguez-Rodriguez et al., 2016)
km2
Monaco 100% (100%)France 55% (59.19%)Spain 2.3% (11.82%)
Turkey 3% (10.29%)Italy 8% (8.55%)Croatia 0.8% (8.48%)
Morocco 1.28 (1.68%)Tunis 0.35% (0.90%)Egypt 0.57% (0.57%)
Syria 0.10% (0.10%)Libya 0.08% (0.08%)Lebanon 0.02% (0.02%)
Actual Management

Main MessagesI. Critical role for spatial and temporal information to
systematically monitor biodiversity loss and human use
II. Clear workflows are essential to develop monitoring frameworks and useful spatial indicators that can pragmatically measure SDGs (land, coastal and marine related)
III. National workflows standardize data to develop indicators that allow regional comparability and prioritization of interventions

For more information:www.etc.uma.es
http://www.medmaritimeprojects.eu/section/med-iamerhttp://147.84.210.211:8080/geoexplorer/composer/ (map viewer with Med-
IAMER data)
http://swos-service.eu/