Embed Size (px)
Citation preview

Ecological Economics 70 (2011) 788–797
Contents lists available at ScienceDirect
Ecological Economics
j ourna l homepage: www.e lsev ie r.com/ locate /eco lecon
Analysis
Regional development or resource preservation? A perspective from Japaneseappliance exports
Masaaki Fuse a,⁎, Eiji Yamasue b, Barbara K. Reck c, T.E. Graedel c
a Research Institute of Science for Safety and Sustainability, National Institute of Advanced Industrial Science and Technology, 16-1 Onogawa Tsukuba Ibaraki 305-8569, Japanb Graduate School of Energy Science, Kyoto University, Yoshidahonmachi Sakyouku Kyoto 606-8501, Japanc School of Forestry and Environmental Studies, Yale University, 195 Prospect Street, New Haven, CT 06511, USA
⁎ Corresponding author. Tel.: +81 29 861 8090; fax:E-mail address: [email protected] (M. Fuse).
0921-8009/$ – see front matter © 2010 Elsevier B.V. Adoi:10.1016/j.ecolecon.2010.11.017
a b s t r a c t
a r t i c l e i n f oArticle history:Received 30 November 2009Received in revised form 28 August 2010Accepted 24 November 2010Available online 10 January 2011
Keywords:RecyclingIndiumE-wasteTrade statisticsUsed products
This paper examines Japanese resource outflows in the form of exported used (and functional) products in2007 by quantifying the unintentional metal exports for a number of specialty metals typically used inelectronics and electrical equipment. We find that more than half of the indium and 20-30% of the barium,lead, antimony, strontium, zirconium, silver, gold, and tin in domestically discarded products were notrecycled in Japan, but rather were exported in products to be used elsewhere. The destinations of these metalswere mainly Asian countries with rudimentary recycling technology. These results demonstrate that althoughthese metals could have been stockpiled domestically for future recovery and recycling, they were insteadsent to countries where recycling of these scarcemetals is unlikely. From a resource perspective, therefore, thefree trade of used Japanese products compromises long-term domestic resource availability as it increases thequality of life in developing countries.
+81 29 861 8411.
ll rights reserved.
© 2010 Elsevier B.V. All rights reserved.
1. Introduction
The natural world is sustainable over long time periods because it isvery good at recycling resources. In the anthropogenicworld, in contrast,resources are often used once and then returned to the environment indispersed forms that preclude reuse. Some of the reasons for these lossesare well known—inefficient collection, poor separation and reprocessingefficiencies, etc., and their impacts on metal cycles are often studied atthe global level. An alternative focus which is also important is theassessment of resource sustainability at the national or regional level,recognizing that scarce resources contained in imported and exportedfinal products may be significant when compared to the imports andexports of the same resources in primary form.
A relatively unexplored area of import/export flows is used productsthat cross national boundaries for reuse elsewhere. The materialscontained therein are not available for reuse by domestic industry,which must therefore import a new supply of materials to continuenew product manufacture. This loss of materials may be particularlyimportant for a country such as Japan, which has few natural resourcesof any kind, or for a region such as Europewhich has few to no domesticresources of the scarce metals so vital to modern technology.
Resource sustainability can be analyzed by characterizing andquantifying the material life cycle, as shown in Fig. 1. Quantitative
material flow analyses based on this generic cycle are now available for anumber of metals, on country, regional, and global levels (Graedel et al.,2002, 2004, 2005; Dahlström et al., 2004; Johnson et al., 2005a,b;Hawkins et al., 2006; Mao et al., 2008; Saurat and Bringezu, 2008; Daigoet al., 2009; Jeong et al., 2009; Hatayama et al., 2009). The expandedview in Fig. 1 details the flows of new and used products into domesticuse and exports. (In the generic sense, resources can be either importedor exported in products (Fuse et al., 2009), so a similar perspectiveobtains for resources in imports.) The task we address in the presentwork is to quantify the export flows of new and used products in theexpanded portion of Fig. 1 for several types of electronics and electricalequipment leaving Japan.
The quickly growing electronics and electrical equipment (EEE)sector increasingly uses a large variety of specialty metals (oftenscarce and often difficult to replacewithout adverse effects on productfunction). The mining of these metals is frequently restricted to only afew countries, and end-of-life recycling is the exception (and thentypically restricted to gold, platinum, and sometimes palladium;Chancerel and Rotter, 2009). At end-of-life, the trade of Wastes ofElectronic and Electrical Equipment (WEEE) is often restricted by theBasel Convention so as to inhibit the export of hazardous materialsfrom developed to less developed countries, even for recyclingpurposes (UNEP, 1992). However, exports of WEEE from developedto less developed countries still take place when discarded productsare categorized as used products (METI, 2006a). As a result, productexports often include a combination of new, used, and end-of-lifeproducts.

789M. Fuse et al. / Ecological Economics 70 (2011) 788–797
A previous case study on used cars shows that discrepancyproblems are of particular concern for used products, often resultingfrom illegal activities by trading companies (e.g., erroneous reports tocustoms, smuggling) (Fuse et al., 2007). To solve this problem, astatistical model for the used car trade was proposed, with the modelrequiring separately reported data for new and used products by boththe exporting and the importing country (Fuse et al., 2009). It wasreported that used product exports for air conditioners, refrigerators,and washing machines estimated from Japanese trade statistics aresmaller than those estimated by questionnaire surveys held bydomestic recyclers (Terazono et al., 2009). A likely explanation forthis is that in order to comply with the Basel Convention partnercountries declare imports of electronics and electrical equipment asused rather than as end-of-life products.
The challenge we faced in quantifying exports of used products isthat data on trade flows do not generally distinguish between new andused products. The usual assumption in the absence of such data is thatmainly new products flow across national boundaries, that is, that usedproduct trade barely exists. We circumvent this data limitation bycombining newly available survey data with corrective techniques andBayesian analysis. The estimation method for used product exportsdeveloped in this work is divided into three steps: (1) step 1characterized the export data from Japanese trade statistics as eithernew products, used products, or both new and used products by usingnewly available export data; (2) step 2 separated new and usedproducts from “both new and used” products by using Bayesiananalysis; and (3) step 3 corrected systematic errors in used productresults obtained in steps 1 and 2 by using corresponding import datafrom partner country trade statistics. This approach enables us tocompute the exports from Japan of selected metals in the form of usedproducts, and to compare those export rates with the domestic end-of-life generation of these products. In a number of cases, the losses turnout to be a substantial fraction of metals in domestically discardedproducts.
2. Methods
In this paper, electronics and electrical equipment are character-ized through eight product groups: cathode ray tube television sets(CRTs), liquid-crystal display television sets (LCDs), plasma displaypanel television sets (PDPs), air conditioners, refrigerators, washing
Scrap
Mi W
S U
Mfg
Stock
F
R
concentrate EOL
refined metal
semis
Metal in final goods
Metal to other scrap markets
matte
Landfilltailings
Import/Export
oreLithosphere
Slag
Import/
Export
Import/Export
Import/Export
Sla
g
Fig. 1. A generic anthropogenic metal cycle (left), with detailed trade flows of new, used, anmanufacturing, U: use, W: waste management and recycling, M: markets. Circles indicate m
machines, microwave ovens, and vacuum cleaners. Key metals foundin electronics and electrical equipment and studied here are Au, Ag,Ba, Cr, In, Ni, Pb, Sb, Sn, Sr, Zn, and Zr in 2007. Their selection wasbased on the availability of metal composition data for electronics andelectrical equipment (Yamasue et al., 2007) (thus explaining whyplatinum group metals, for example, are not included). 2007 was thelast year for which trade data were reported cumulatively for new andused products, instead of separately, as from 2008 on. The amount ofmetal indirectly flowing out of Japan through the exports of usedelectronics and electrical equipment can be estimated by linkinginformation on exports of used products with metal compositiondata:
IMOijkt = MCDij · UPEjkt ð1Þ
where IMOijkt is the used product metal outflows for metal i andproduct j into country k in year t,MCDijt is the metal composition datathat provide the weight of metal i per unit for product j disposed of inyear t, and UPEjkt denotes the number of used product exports forproduct j into the partner country k in year t. Metal composition datafor electronics produced in 2002 were obtained from previous work(Yamasue et al., 2007) and are summarized in Table 1.
While previous estimates on the exports of used products werebased on surveys, and may be interesting for comparative purposes(Yoshida et al., 2009; METI, 2006b), this paper only uses publiclyaccessible statistics. The aim of our methodology for used productexports is to overcome two types of problems with trade statistics(Fuse et al., 2009):
(1) Limitations in data availability: Trade statistics of manycountries do not distinguish between exports and imports ofused as opposed to new products (one exception being Peru;Kahhat and Williams, 2009). For example, historic Japanesetrade statistics do not report new and used trade separately forCRTs, LCDs, PDPs, air conditioners, refrigerators, washingmachines, microwave ovens, and vacuum cleaners. Instead,all products exported before 2007 were inferred to be new. It isonly since 2008 that Japanese trade statistics distinguish forcertain products between new and used exports. The itemcodes of target products in these new trade statistics are shownin Table 2 (The Ministry of Finance, 2009). The itemclassification system in the table is standardized by the United
MMfg WU
Exports
new
used
EOLM
new
used
Imports,new&used
Imports
Exports
Product Exports
EOL
d end-of-life products (right). (Mi: mining, S: smelting, R: refining, F: fabrication, Mfg:arkets for commodity transfer).
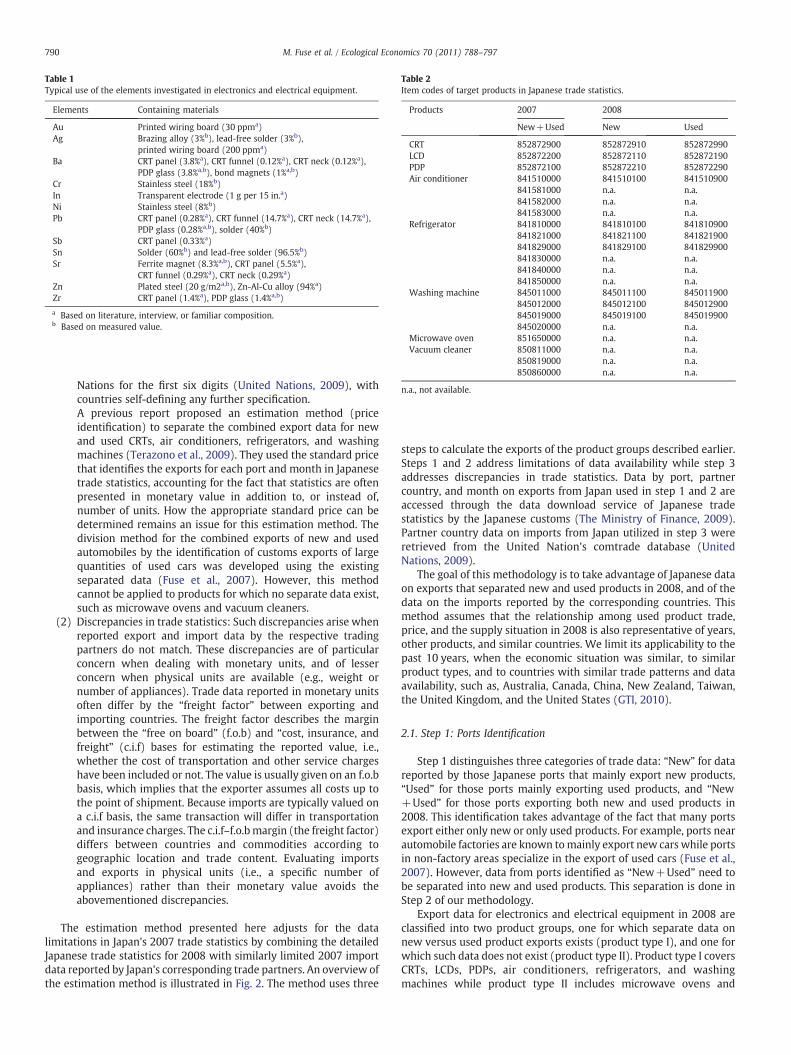
Table 2Item codes of target products in Japanese trade statistics.
Products 2007 2008
New+Used New Used
CRT 852872900 852872910 852872990LCD 852872200 852872110 852872190PDP 852872100 852872210 852872290Air conditioner 841510000 841510100 841510900
841581000 n.a. n.a.841582000 n.a. n.a.841583000 n.a. n.a.
Refrigerator 841810000 841810100 841810900841821000 841821100 841821900841829000 841829100 841829900841830000 n.a. n.a.841840000 n.a. n.a.841850000 n.a. n.a.
Washing machine 845011000 845011100 845011900845012000 845012100 845012900845019000 845019100 845019900845020000 n.a. n.a.
Microwave oven 851650000 n.a. n.a.Vacuum cleaner 850811000 n.a. n.a.
850819000 n.a. n.a.850860000 n.a. n.a.
n.a., not available.
Table 1Typical use of the elements investigated in electronics and electrical equipment.
Elements Containing materials
Au Printed wiring board (30 ppma)Ag Brazing alloy (3%b), lead-free solder (3%b),
printed wiring board (200 ppma)Ba CRT panel (3.8%a), CRT funnel (0.12%a), CRT neck (0.12%a),
PDP glass (3.8%a,b), bond magnets (1%a,b)Cr Stainless steel (18%b)In Transparent electrode (1 g per 15 in.a)Ni Stainless steel (8%b)Pb CRT panel (0.28%a), CRT funnel (14.7%a), CRT neck (14.7%a),
PDP glass (0.28%a,b), solder (40%b)Sb CRT panel (0.33%a)Sn Solder (60%b) and lead-free solder (96.5%b)Sr Ferrite magnet (8.3%a,b), CRT panel (5.5%a),
CRT funnel (0.29%a), CRT neck (0.29%a)Zn Plated steel (20 g/m2a,b), Zn-Al-Cu alloy (94%a)Zr CRT panel (1.4%a), PDP glass (1.4%a,b)
a Based on literature, interview, or familiar composition.b Based on measured value.
790 M. Fuse et al. / Ecological Economics 70 (2011) 788–797
Nations for the first six digits (United Nations, 2009), withcountries self-defining any further specification.A previous report proposed an estimation method (priceidentification) to separate the combined export data for newand used CRTs, air conditioners, refrigerators, and washingmachines (Terazono et al., 2009). They used the standard pricethat identifies the exports for each port and month in Japanesetrade statistics, accounting for the fact that statistics are oftenpresented in monetary value in addition to, or instead of,number of units. How the appropriate standard price can bedetermined remains an issue for this estimation method. Thedivision method for the combined exports of new and usedautomobiles by the identification of customs exports of largequantities of used cars was developed using the existingseparated data (Fuse et al., 2007). However, this methodcannot be applied to products for which no separate data exist,such as microwave ovens and vacuum cleaners.
(2) Discrepancies in trade statistics: Such discrepancies arise whenreported export and import data by the respective tradingpartners do not match. These discrepancies are of particularconcern when dealing with monetary units, and of lesserconcern when physical units are available (e.g., weight ornumber of appliances). Trade data reported in monetary unitsoften differ by the “freight factor” between exporting andimporting countries. The freight factor describes the marginbetween the “free on board” (f.o.b) and “cost, insurance, andfreight” (c.i.f) bases for estimating the reported value, i.e.,whether the cost of transportation and other service chargeshave been included or not. The value is usually given on an f.o.bbasis, which implies that the exporter assumes all costs up tothe point of shipment. Because imports are typically valued ona c.i.f basis, the same transaction will differ in transportationand insurance charges. The c.i.f–f.o.b margin (the freight factor)differs between countries and commodities according togeographic location and trade content. Evaluating importsand exports in physical units (i.e., a specific number ofappliances) rather than their monetary value avoids theabovementioned discrepancies.
The estimation method presented here adjusts for the datalimitations in Japan's 2007 trade statistics by combining the detailedJapanese trade statistics for 2008 with similarly limited 2007 importdata reported by Japan's corresponding trade partners. An overview ofthe estimation method is illustrated in Fig. 2. The method uses three
steps to calculate the exports of the product groups described earlier.Steps 1 and 2 address limitations of data availability while step 3addresses discrepancies in trade statistics. Data by port, partnercountry, and month on exports from Japan used in step 1 and 2 areaccessed through the data download service of Japanese tradestatistics by the Japanese customs (The Ministry of Finance, 2009).Partner country data on imports from Japan utilized in step 3 wereretrieved from the United Nation's comtrade database (UnitedNations, 2009).
The goal of this methodology is to take advantage of Japanese dataon exports that separated new and used products in 2008, and of thedata on the imports reported by the corresponding countries. Thismethod assumes that the relationship among used product trade,price, and the supply situation in 2008 is also representative of years,other products, and similar countries. We limit its applicability to thepast 10 years, when the economic situation was similar, to similarproduct types, and to countries with similar trade patterns and dataavailability, such as, Australia, Canada, China, New Zealand, Taiwan,the United Kingdom, and the United States (GTI, 2010).
2.1. Step 1: Ports Identification
Step 1 distinguishes three categories of trade data: “New” for datareported by those Japanese ports that mainly export new products,“Used” for those ports mainly exporting used products, and “New+Used” for those ports exporting both new and used products in2008. This identification takes advantage of the fact that many portsexport either only new or only used products. For example, ports nearautomobile factories are known tomainly export new cars while portsin non-factory areas specialize in the export of used cars (Fuse et al.,2007). However, data from ports identified as “New+Used” need tobe separated into new and used products. This separation is done inStep 2 of our methodology.
Export data for electronics and electrical equipment in 2008 areclassified into two product groups, one for which separate data onnew versus used product exports exists (product type I), and one forwhich such data does not exist (product type II). Product type I coversCRTs, LCDs, PDPs, air conditioners, refrigerators, and washingmachines while product type II includes microwave ovens and

Exports separated for newand used products in 2008(Japanese trade statistics)
Exports unified for newand used products in 2007(Japanese trade statistics)
New product exportsUsed product exports
(Step 1 estimates)Both product exports
New Used New + Used
Step 1: Ports identification
Bayesian model for usedproduct exports
Step 2: New and used division
Used product exports (Step 2 estimates)
Step 3: Discrepancy correction
Value for correction(Step 3 estimates)
Corresponding imports
Imports ofpartner countries
in 2007(UN comtrade)
Used product exports = Step 1 estimates + Step 2 estimates + Step 3 estimates
Fig. 2. Overview of the estimation method for used product exports.
791M. Fuse et al. / Ecological Economics 70 (2011) 788–797
vacuum cleaners (see Table 2). Ports for product type I are identifiedby using the rate of used products in the exports reported by ports(UPR: Used Products Rate) and the share of a port's exports to Japan'stotal exports (PS: Port Share). Product type II designations are madeby the results of product type I and by comparing the price of portexports with the national average price (RP: Relative Price). Table 3provides an overview of the port identification methodology usingUPR, PS, and RP.
2.2. Step 2: Distinguishing New and Used Products
In step 2 a distinction is made between new and used exportedproducts for all ports that export both new and used products (called“combined exports” hereafter). Step 2 is based on a modelingapproach that combines information on the number of traded itemsand the price of those combined exports. The reason for this choice isthat the price of the unified exports is available for every shipment,and is an appropriate variable for the separation of used productsfrom the unified exports.
As an example of such a relationship for cathode ray tubes inTVs, air conditioners, and washing machines, Fig. 3 shows alogarithmic scatter plot for 2007 (right side) and 2008 (left side)with the share of used product exports by ports, partner country,and month in the national total as a function of the relative price ofthe corresponding data unified for new and used products. In thisfigure the plots for 2007 are from the used product exports in 2007identified in step 1. The plots for 2008 are from the actual usedproduct exports in 2008. This figure represents not the absolutevalue of the number or the price of the unified exports by ports,partner country, and month, but the share or the relative pricestandardized by the national total and the national average price soas to compare the differences among products. From the figure, ahigh correlation between logarithms of the share of used productexports and the unified relative price can be found. Linear or log-linear expressions had lower correlations.
From the empirical findings of Fig. 3, the estimation model for thenumber of used product exports in the combined exports from step 1can be calculated by Eq (2). The following equation is based on the
data disaggregated to port and month level to provide highcorrelation and acceptable sample size.
ln SUPEjklmt = αjt + βjt ln RPjklmt + ejklmt ð2Þ
where
SUPEjklmt = UPEjklmt = ∑k
∑l
∑m
NPEjklmt + UPEjklmt
� �
and
RPjklmt = UDEjklmtAUDPjt
where SUPEjklmt is the share of the number of used product exports byproduct j, partner country k, port l, month m, and year t compared tothe number of the national total combined for new and used productscorresponding to indexes j, k, l and m in physical terms, NPEjklmt andUPEjklmt are the number of new and used product exports for product jfrom port l to partner country k in monthm in year t in physical terms,and UDPjklmt represents the price obtained by dividing the value of thecombined exports in monetary terms by the number of the combinedexports in physical terms corresponding to indexes j, k, l, m, and t.AUDP represents the national average price obtained by dividing thevalue of the unified national total in monetary term by the number ofthe unified national total in physical terms corresponding to indexes jand t. α and β denote the model parameters, and e signifies randomerror.
The estimation of used product exports requiresmodel parametersα and β for the target products in 2007. However, these modelparameters cannot be estimated for 2007 as there are no separate datafor new and used product exports for that year.
One approach to model parameter estimates is to use the usedproduct exports in 2007 identified in step 1, such as the data for 2007in Fig. 3. Because such exports for used products in 2007 are sampledpartly from data not separated for new and used products under thesame assumptions in step 1, the 2007 data are not always accurate andmay not be satisfactory for estimating parameters. Another approach

Table 3Ports identification through used product rate, port share, and relative price.
Category Product type I Product type II
New UPRb10% and SN0.1% New in product type 1 and RPN1Used UPRN90% and SN0.1% Used in product type 1 and RPb1New+Used Other than New and Used Other than New and Used
New, the ports procedure exporting new productsmainly; Used, the ports procedure usedproducts mainly; New+Used, other than “New” and “Used”; Product type I, CRT, LCD,PDP, air conditioner, refrigerator and washing machine units; Product type II, microwaveoven and vacuum cleaner units; UPR (Used Products Rate), the rate of used products inthe exports reported by ports; PS (Port Share), the share of ports in across-the-countryexports; RP (Relative Price), the price of port exports by the national average price.
792 M. Fuse et al. / Ecological Economics 70 (2011) 788–797
is to utilize the actual used product exports in 2008, such as the datafor 2008 in Fig. 3, because the 2008 data are more reliable than the2007 data (see Fig. 3). However, we need to assume that the tradesituation in 2007 is the same in 2008. The present approach avoidsthis assumption by utilizing both 2007 and 2008 data within theanalytical framework of Bayesian statistics (Lindley, 1971).
To explain the parameter estimates of the regression model usingBayesian statistics, Eq. (3) is simplified as follows:
ynp = αp + βpxnp + enp ð3Þ
where, ynp is the dependent variable corresponding to ln SUPEjklmt inEq. (2), xnp is an independent variable corresponding to lnRPjklmt inEq. (2), and indexes n and p corresponding to combinations (k, l, m)and (j, t) respectively. The posterior distribution of parameters α andβ can be obtained according to the Bayes' theorem;
p αp;βp jynp; xnp� �
∝l αp;βp jynp; xnp� �
· p αp;βp
� �ð4Þ
where, p(αp,βp|ynp,xnp) denotes the posterior distribution of para-meters αp and βp given ynp and xnp, l(αp,βp|ynp,xnp) demonstrates thelikelihood function which gives αp and βp by maximizing thelikelihood of given y and x, and p(αp,βp) is the prior distribution ofparameters αp and βp. The Bayesian approach takes into accountrelated information for parameters, such as the 2007 data in ourmodel through the use of prior distribution approach. We employedan exchangeable prior distribution which gives the followinghierarchical prior distribution with a normal distribution of meanμα, μβ and variance Tα, Tβ.
αp∼N μα; Tαð Þ ð5Þ
βp∼N μβ; Tβ� �
: ð6Þ
This method, using the exchangeable prior distribution, is knownas regression in m groups in Bayesian statistics (Jackson et al., 1971;Novick et al., 1972). The advantage of this method is that the set ofprior distributions is relatively easy to specify because of the generalshape of prior distributions. In the present case, in which it is difficultto estimate the parameters using only the 2007 data or only the 2008data, we can make efficient use of both data sets in the priordistribution by assuming exchangeability between the 2007 and 2008parameters. This assumption can be introduced not only betweenyears but also between products. Because for 2008 no separate dataare available for product type II, the prior distribution of CRT data isused for parameters of product type II. The reason for this substitutionis that CRTs have a scatter plot similar to that of microwave ovens andvacuum cleaners in terms of the share of exports in the national total,and for the relative price in the unified data in 2007 and 2008. Thelikelihood function in Eq. (4) used the 2007 data which can beprovided for every product category. Least-squares estimates usingonly the 2007 data and Bayesian estimates using both the 2007 and
2008 data for the model parameters are shown in Table 4. Least-squares estimates are synonymous with the parameters obtainedfrom the likelihood function which assumed random error e in Eq. (2)as the normal distribution. We find that least-squares estimates rangefrom −10.37 to −6.08 for α and from −1.54 to −0.65 for β, and thatthe variation between model parameters decreases 5% for α and 32%for β in the case of the Bayesian estimates.
2.3. Step 3: Discrepancy Correction
Step 3 corrects the used product exports estimated in Steps 1 and 2using the corresponding imports reported by the partner country. Forthis correction we assumed the validity of findings from previousresearch, namely that discrepancy problems are greater with usedproducts than with new products (Fuse et al., 2009) and that theexport data of used electronics obtained from Japanese trade statisticstend to be underestimated (Terazono et al., 2009). Therefore, wemade the following assumptions:
I. Data discrepancies occur only for used products.II. Used products are often exported under a different commodity
name from Japan.
From the above simple assumption, the difference value betweenJapanese exports and the corresponding imports in unified new andused products can be interpreted from used product evaluation.Hence, the true values of used product exports can be given by;
NUPEjkt:2007 = SUPEijkt:2007dJPEijkt:2007 + PPIjkt:2007−JPEjkt:2007� �
SUPEijkt:2007dJPEijkt:2007
;;
JPEjkt:2007 b PPIjkt:2007JPEjkt:2007 ≥ PPIjkt:2007
(
ð7Þ
where NUPEjkt:2007 is the true value of used product traded for product jfrom Japan to the partner country k in 2007, and JPEjkt:2007 and PPIjkt:2007represent exports and the corresponding imports for both newandusedproducts for product j from Japan to the partner country k in 2007 fromJapanese trade statistics and trade statistics of the partner countryrespectively. (JPEjkt:2007−PPIjkt:2007) in (7) indicates the value forcorrection to used product exports. However, when the partner countryis Hong Kong, Singapore or Belgium, well known as trans-shipmentcenters, there is thepossibility that JPEbPPIoccurs due to over-invoicingin PPI in the transit (Feenstra et al., 1999; Fung et al., 2006). In this case,we do not consider PPI. Hence the value for correction to used productexports became zero.
3. Results
Estimation results for selected used product exports of electronicsand electrical equipment from Japan in 2007 are shown in Table 5. Thedomestic end-of-life generation data indicate the number of end-of-life electronics and electrical equipment discarded in Japan, asestimated in a previous study (Yamasue et al., 2007). Our correctedand enhanced results indicate that 2.7 million units of used CRTs(cathode ray tube TVs), 130,000 units of used LCDs (liquid-crystaldisplay TVs), 46,000 units of used PDPs (plasma display panel TVs),1.4 million units of used air conditioners, 270,000 units of usedrefrigerators, 250,000 units of used washing machines, 140,000 unitsof used microwave ovens, and 1.2 million units of used vacuumcleaners were exported overseas destined for potential reuse. In total,6.2 million used units were exported, amounting to 18% of the35 million units generated as end-of-life products in Japan. Particu-larly high export rates, more than 20%, are found for CRTs, LCDs, PDPs,air conditioners, and vacuum cleaners (the export rate of PDPs wascalculated to be greater than 160%, indicating that there were moreexports than domestic generation for the year under study. Wequestion this result based on the low sample size and high statisticaluncertainty).

Table 4Least-squares estimates using just 2007 data and Bayesian estimates using both 2007and 2008 data for the model parameters.
Products Least-squares estimates Bayesian estimates
α β α β
CRT −7.20 −0.90 −7.16 −1.06LCD −10.37 −0.95 −10.35 −0.90PDP −10.15 −1.49 −10.23 −1.26Air conditioner −8.10 −1.17 −8.09 −1.14Refrigerator −7.49 −0.65 −7.59 −0.78Washing machine −8.66 −1.05 −8.66 −1.01Microwave oven −6.08 −1.54 −6.29 −1.38Vacuum cleaner −6.39 −1.34 −6.43 −1.28
Cathode ray tube TV, 2008
-16
-14
-12
-10
-8
-6
-4
-2
-2 0 2 4 6 8The logarithm of relative price of the corresponding data
unified for new and used productsThe logarithm of relative price of the corresponding data
unified for new and used products
The logarithm of relative price of the corresponding dataunified for new and used products
The logarithm of relative price of the corresponding dataunified for new and used products
The
loga
rithm
of s
hare
of u
sed
prod
uct e
xpor
ts b
y po
rt, p
artn
erco
untr
y an
d m
onth
in n
atio
n to
tals
The
loga
rithm
of s
hare
of u
sed
prod
uct e
xpor
ts b
y po
rt, p
artn
erco
untr
y an
d m
onth
in n
atio
n to
tals
-16
-14
-12
-10
-8
-6
-4
-2
The
loga
rithm
of s
hare
of u
sed
prod
uct e
xpor
ts b
y po
rt, p
artn
erco
untr
y an
d m
onth
in n
atio
n to
tals
Cathode ray tube TV, 2007
-2 3 8
Air conditioner, 2008
-14
-12
-10
-8
-6
-4
-2
The
loga
rithm
of s
hare
of u
sed
prod
uct e
xpor
ts b
y po
rt, p
artn
erco
untr
y an
d m
onth
in n
atio
n to
tals
-14
-12
-10
-8
-6
-4
-2
The
loga
rithm
of s
hare
of u
sed
prod
uct e
xpor
ts b
y po
rt, p
artn
erco
untr
y an
d m
onth
in n
atio
n to
tals
-14
-12
-10
-8
-6
-4
-2
The
loga
rithm
of s
hare
of u
sed
prod
uct e
xpor
ts b
y po
rt, p
artn
erco
untr
y an
d m
onth
in n
atio
n to
tals
-14
-12
-10
-8
-6
-4
-2
-4 -2 0 2 4 6 -4 -2 0 2 4 6
The logarithm of relative price of the corresponding dataunified for new and used products
The logarithm of relative price of the corresponding dataunified for new and used products
-4 -2 0 2 4 6
Air conditioner, 2007
Washing machine, 2008
-4 -2 0 2 4
Washing machine, 2007
y = -1.17x - 8.10R2 = 0.53
y = -0.65x - 7.49R2 = 0.62R2 = 0.74
y = -0.90x - 8.14
y = -1.12x - 8.73R2 = 0.66
y = -1.22x - 6.92R2 = 0.75
y = -0.90x - 7.20R2 = 0.59
Fig. 3. Logarithmic scatter plot showing the share of used product exports from Japan by port, partner country, andmonth as a function of the relative price in the corresponding dataunified for new and used products in 2007 and 2008. The examples are for cathode ray tubes TVs, air conditioners, and washing machines.
793M. Fuse et al. / Ecological Economics 70 (2011) 788–797
To test the reliability of our results, we compared our estimationresults with those by a previous report on CRTs, air conditioners,refrigerators, and washing machines (Terazono et al., 2009). Theprevious report provides two estimation results for four products,respectively. In Table 5, estimation 1 is based on Japanese tradestatistics, and obtained using the price identification mentioned in step2. In the same report, estimation 2 is based on a questionnaire survey todomestic recyclers by the Japanese Ministry of Economy, Trade, andIndustry (METI). This comparison indicates that while step 1 in ourmethodology gives results similar to Estimation 1 (with under-evaluation due to the limitation in Japanese trade statistics), oursubsequent steps 2 and 3 bring our results close to those of Estimation 2,especially for air conditioners. In general, it is clear that larger samplesizes produce more reliable estimations, as would be expected.
Japanese trade statistics began to provide both new and used datafor CRTs, LCDs, PDPs, air conditioners, refrigerators, and washing

Table 5Estimation results for used electronics and electrical equipment from Japan in 2007.
Products Previous reporta Exports of used productsa Domestic EOL Export ratea:
Estimation 1 Estimation 2 Step 1 Step 2 Step 3 Total: a generationa: b a×100/b
(103 units) (103 units) (103 units) (103 units) (103 units) (103 units) (103 units) (%)
CRT 2200 2000 2200 22 560 2700 9400 29LCD 74 30 27 130 310 42PDP 33 3.0 9.3 46 29 160Air conditioner 240 1400 200 5.5 1200 1400 7000 20Refrigerator 150 740 110 44 120 270 4800 5.6Washing machine 260 650 22 7.6 220 250 4600 5.4Microwave oven 8.0 0 130 140 3400 4.1Vacuum cleaner 270 0 950 1200 5700 21Total 2900 110 3200 6200 35,000 18
Previous report, Terazono et al. (2009); Estimation 1, based on Japanese trade statistics and obtained using the price identification; Estimation 2, based on a questionnaire survey byMETI (2006b).
a Two significant figures only; EOL, end-of-life.
794 M. Fuse et al. / Ecological Economics 70 (2011) 788–797
machines in 2008. Therefore, we applied steps 1 and 2 of our methodto the unified exports in 2008. We then compared the estimationresults with the data reported by each partner country for theirimports of CRTs, LCDs, PDPs, air conditioners, refrigerators, andwashing machines from Japan with the separately reported data fromthe Japanese trade statistics. The comparison results are illustrated inFig. 4. They indicate that applying steps 1 and 2 to six key productsleads to correlation coefficients of over 0.99 explaining the relation-ship between estimated and reported values.
Fig. 5 provides an overview of the countries to which Japanexported most of its used electronics and electrical equipment in2007, distinguished by product type. Used CRTs weremostly exportedto Vietnam, the Philippines, and Hong Kong, the three countriesreceiving 61% of all exports. Almost half of Japan's used LCD exportswent to Taiwan and Hong Kong. 72% of used PDPs were exported tothe Czech Republic (this may be a result of the small sample size).While South Korea and Hong Kong imported about a third of all usedair conditioners exported from Japan, the majority went to othercountries. Hong Kong and Saudi Arabia imported about a third ofJapan's used refrigerators. 77% of used washingmachine exports went
Cathode ray tube TV
0.0
0.2
0.4
0.6
0.8
1.0
0.0 0.2 0.4 0.6 0.8 1.0
Reported exports
Est
imat
ed e
xpor
ts
Est
imat
ed e
xpor
ts
Liquid-cryst
0
3
6
9
12
15
0 3 6
Reporte
Air conditioner
0
7
14
21
28
35
0 7 14 21 28 35
Reported exports
Est
imat
ed e
xpor
ts
Refrig
0
10
20
30
40
50
60
0 10 20
Reporte
Est
imat
ed e
xpor
ts
Fig. 4. Exports of used electronics and electrical equipment from Japan, by part
to Thailand alone. Almost half of the used microwave ovens that wereexported were imported by just two countries, Russia and Thailand.Three quarters of exports of used vacuum cleaners went to Thailandand Saudi Arabia. This overview demonstrates that used Japaneseelectronics and electrical equipment were widely distributed geo-graphically, and mainly exported to developing Asian countries.
Table 6 shows the exports of selected metals contained in usedelectronics and electrical equipment in 2007. For comparison, thetable also shows the total generated end-of-life (EOL) flow of EEE foreach metal, only part of which is exported in used products. The EEEEOL flow is estimated by multiplying domestic EOL productsgeneration in Table 5 by metal composition data in Eq. (1) (weadjusted data for PDPs by setting the exports equal to the end-of-lifeelectronics and electrical equipment generated, instead of usingTable 5 results in which exports exceeded the domestic end-of-lifegeneration). Finally, the table shows for each metal the share of its“exports in used products” to its “EEE EOL generation” (outflowrate). In 2007, substantial amounts of the twelve different metalsevaluated herein flowed overseas in the form of used products. Themetal outflow rate was highest for indium (In; only used in LCDs and
Est
imat
ed e
xpor
ts
al display TV
9 12 15
d exports Reported exports
Plasma display panel TV
0
2
4
6
8
0 2 4 6 8
erator
30 40 50 60
d exports
Washing machine
0
2
4
6
8
10
12
0 2 4 6 8 10 12
Reported exports
Est
imat
ed e
xpor
ts
ner country, in 2008: estimated exports as a function of reported exports.

0% 20% 40% 60% 80% 100%
Vacuum cleaner
Microwave oven
Washing machine
Refrigerator
Air conditioner
PDP
LCD
CRT Czech Rep.
Hong Kong
Philippines
South Korea
Saudi Arabia
Russia
Taiwan
Thailand
Vietnam
Others
Fig. 5. Estimation results for the exports of used electronics and electrical equipment from Japan into main importing countries in 2007.
795M. Fuse et al. / Ecological Economics 70 (2011) 788–797
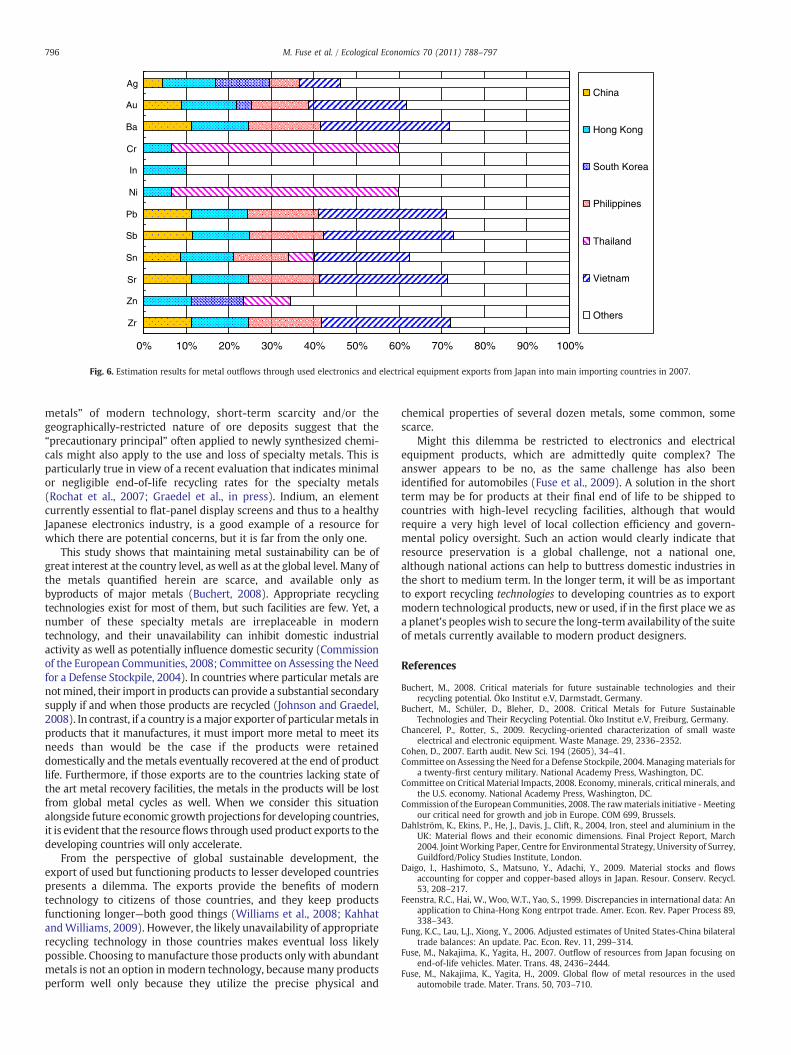
PDPs) with 58%. The outflow rates of barium (Ba), lead (Pb),antimony (Sb), strontium (Sr), and zirconium (Zr; found mainly inCRT components) were about 29%. For silver (Ag), gold (Au), and tin(Sn; used often in CRTs and air conditioners) the rate ranges from19% to 23%. The outflow rate of zinc (Zn; utilized widely in everyproduct) comes to 11%. About 6% of chromium (Cr) and nickel (Ni;both often used in stainless steel-containing washing machines)flowed overseas.
The data in Table 6 can be re-aggregated to show the countriesreceiving the largest inflows of the specialty metals from usedJapanese products in 2007 (Fig. 6). Ba, Pb, Sb, Sr, and Zr share similardestinations, reflecting their predominant use in CRTs. Most of thesemetals (71 to 73%) flowed into only four countries: Vietnam, thePhilippines, Hong Kong, and China. (However, metal exports in CRTsare likely to cease in the near future due to a recently announced planby Japan to ban CRT exports (The Ministry of Economy, Trade, andIndustry, Japan, 2009)). 53% of discarded Japanese Cr and Ni was sentto Thailand. 58 % of In from Japan was used in the Czech Republic,Taiwan, and Hong Kong. Nearly half of Ag and Zn was sent to only fivecountries: South Korea, Hong Kong, Thailand, China and Philippines.Au went largely to Vietnam, Hong Kong, and the Philippines. For themost part, these receiving countries do not yet have adequaterecycling technologies for these specialty metals.
Table 6Estimation results for metal outflows from Japan through exported used products of electro
Elements Exportsa
CRT LCD PDP Air conditioner Refrigerator Washing machi(Mg) (Mg) (Mg) (Mg) (Mg) (Mg)
Ag 1.8 0.034 0.021 3.7 0.11 0.065Au 0.21 0.0030 0.0024 0.045 0.0049 0.0062Ba 1700 0 15 5.8 6.5 0Cr 1.5 3.0 1.9 27 47 200In 0 0.65 0.40 0 0 0Ni 0.7 1.3 0.9 12 21 91Pb 3100 2.3 57 11 1.1 7.0Sb 140 0 0 0 0 0Sn 180 8.3 2.5 35 4.2 16Sr 2500 0 1.3 47 2.0 11Zn 3.4 0.54 0 32 8.9 5.9Zr 610 0 5.4 0 0 0
a Two significant figures only; EOL, end-of-life.
4. Discussion
In various discussions of the potential sustainability of metals(Meadows et al., 1972; Trainer, 1982; Gordon et al., 2006; USCommittee on CriticalMaterial Impacts, 2008), relatively little attentionhas been paid to the reuse of products and their related imports andexports. Exports of metal-rich used electronics can be significant inmature or emerging economies, although the quantities have beendifficult to quantify. This study presents a new estimation method forthe exports of used products, using the example of electronics andelectrical equipment in Japan in 2007. The results show that for manymetals the exports of used electronics and electrical equipmentamounted to 20 to 30% of their respective EEE end-of-life flow, and inthe case of indium more than 50 %. From a resource perspective, theseexports can be considered as unintentional metal outflows, as theysubstantially reduce the amount of secondary raw materials in Japan.And, if the contained metals are not eventually recovered and recycled,the amount of secondary rawmaterials is also reduced on a global basis.
The loss of secondary raw materials is not of concern so long asprimary supplies are ample. There are, however, increasing concernsabout many of these supplies (Cohen, 2007; Buchert et al., 2008;Ritter, 2009; Waida et al., 2009). Although no truly satisfactoryassessments exist regarding long-term availability of the “specialty
nics and electrical equipment in 2007.
DomesticEOLgenerationsa: b
Outflow ratea:a×100/b
ne Microwave oven Vacuum cleaner Total:a(Mg) (Mg) (Mg) (Mg) (%)
0.026 0.032 5.8 29 200.0035 0.0037 0.28 1.2 230 0 1700 5900 29
13 2.6 300 5100 5.90 0 1.1 1.9 585.8 1.2 130 2200 5.90.7 0.9 3200 11,000 290 0 140 490 292.1 3.9 250 1300 193.6 0 2600 9300 282.6 1.3 55 510 110 0 620 2100 30
0% 10% 20% 30% 40% 50% 60% 70% 80% 90% 100%
Zr
Zn
Sr
Sn
Sb
Pb
Ni
In
Cr
Ba
Au
AgChina
Hong Kong
South Korea
Philippines
Thailand
Vietnam
Others
Fig. 6. Estimation results for metal outflows through used electronics and electrical equipment exports from Japan into main importing countries in 2007.
796 M. Fuse et al. / Ecological Economics 70 (2011) 788–797
metals” of modern technology, short-term scarcity and/or thegeographically-restricted nature of ore deposits suggest that the“precautionary principal” often applied to newly synthesized chemi-cals might also apply to the use and loss of specialty metals. This isparticularly true in view of a recent evaluation that indicates minimalor negligible end-of-life recycling rates for the specialty metals(Rochat et al., 2007; Graedel et al., in press). Indium, an elementcurrently essential to flat-panel display screens and thus to a healthyJapanese electronics industry, is a good example of a resource forwhich there are potential concerns, but it is far from the only one.
This study shows that maintaining metal sustainability can be ofgreat interest at the country level, as well as at the global level. Many ofthe metals quantified herein are scarce, and available only asbyproducts of major metals (Buchert, 2008). Appropriate recyclingtechnologies exist for most of them, but such facilities are few. Yet, anumber of these specialty metals are irreplaceable in moderntechnology, and their unavailability can inhibit domestic industrialactivity as well as potentially influence domestic security (Commissionof the European Communities, 2008; Committee on Assessing the Needfor a Defense Stockpile, 2004). In countries where particular metals arenotmined, their import in products can provide a substantial secondarysupply if and when those products are recycled (Johnson and Graedel,2008). In contrast, if a country is amajor exporter of particularmetals inproducts that it manufactures, it must import more metal to meet itsneeds than would be the case if the products were retaineddomestically and the metals eventually recovered at the end of productlife. Furthermore, if those exports are to the countries lacking state ofthe art metal recovery facilities, the metals in the products will be lostfrom global metal cycles as well. When we consider this situationalongside future economic growth projections for developing countries,it is evident that the resourceflows through used product exports to thedeveloping countries will only accelerate.
From the perspective of global sustainable development, theexport of used but functioning products to lesser developed countriespresents a dilemma. The exports provide the benefits of moderntechnology to citizens of those countries, and they keep productsfunctioning longer—both good things (Williams et al., 2008; KahhatandWilliams, 2009). However, the likely unavailability of appropriaterecycling technology in those countries makes eventual loss likelypossible. Choosing to manufacture those products only with abundantmetals is not an option in modern technology, becausemany productsperform well only because they utilize the precise physical and
chemical properties of several dozen metals, some common, somescarce.
Might this dilemma be restricted to electronics and electricalequipment products, which are admittedly quite complex? Theanswer appears to be no, as the same challenge has also beenidentified for automobiles (Fuse et al., 2009). A solution in the shortterm may be for products at their final end of life to be shipped tocountries with high-level recycling facilities, although that wouldrequire a very high level of local collection efficiency and govern-mental policy oversight. Such an action would clearly indicate thatresource preservation is a global challenge, not a national one,although national actions can help to buttress domestic industries inthe short to medium term. In the longer term, it will be as importantto export recycling technologies to developing countries as to exportmodern technological products, new or used, if in the first place we asa planet's peoples wish to secure the long-term availability of the suiteof metals currently available to modern product designers.
References
Buchert, M., 2008. Critical materials for future sustainable technologies and theirrecycling potential. Öko Institut e.V, Darmstadt, Germany.
Buchert, M., Schüler, D., Bleher, D., 2008. Critical Metals for Future SustainableTechnologies and Their Recycling Potential. Öko Institut e.V, Freiburg, Germany.
Chancerel, P., Rotter, S., 2009. Recycling-oriented characterization of small wasteelectrical and electronic equipment. Waste Manage. 29, 2336–2352.
Cohen, D., 2007. Earth audit. New Sci. 194 (2605), 34–41.Committee on Assessing the Need for a Defense Stockpile, 2004. Managingmaterials for
a twenty-first century military. National Academy Press, Washington, DC.Committee on Critical Material Impacts, 2008. Economy, minerals, critical minerals, and
the U.S. economy. National Academy Press, Washington, DC.Commission of the European Communities, 2008. The rawmaterials initiative - Meeting
our critical need for growth and job in Europe. COM 699, Brussels.Dahlström, K., Ekins, P., He, J., Davis, J., Clift, R., 2004, Iron, steel and aluminium in the
UK: Material flows and their economic dimensions. Final Project Report, March2004. JointWorking Paper, Centre for Environmental Strategy, University of Surrey,Guildford/Policy Studies Institute, London.
Daigo, I., Hashimoto, S., Matsuno, Y., Adachi, Y., 2009. Material stocks and flowsaccounting for copper and copper-based alloys in Japan. Resour. Conserv. Recycl.53, 208–217.
Feenstra, R.C., Hai, W., Woo, W.T., Yao, S., 1999. Discrepancies in international data: Anapplication to China-Hong Kong entrpot trade. Amer. Econ. Rev. Paper Process 89,338–343.
Fung, K.C., Lau, L.J., Xiong, Y., 2006. Adjusted estimates of United States-China bilateraltrade balances: An update. Pac. Econ. Rev. 11, 299–314.
Fuse, M., Nakajima, K., Yagita, H., 2007. Outflow of resources from Japan focusing onend-of-life vehicles. Mater. Trans. 48, 2436–2444.
Fuse, M., Nakajima, K., Yagita, H., 2009. Global flow of metal resources in the usedautomobile trade. Mater. Trans. 50, 703–710.

797M. Fuse et al. / Ecological Economics 70 (2011) 788–797
Global Trade Information Services(GTI), 2010. Global Trade Atlas. http://www.gtis.com/english/GTIS_GTA.html 2010accessed 6-29-10.
Gordon, R.B., Bertram, M., Graedel, T.E., 2006. Metal stocks and sustainability. Proc. Natl.Acad. Sci. U.S.A. 103, 1209–1214.
Graedel, T.E., Bertram, M., Fuse, K., Gordon, R.B., Lifset, R., Rechberger, H., Spatari, S.,2002. The Characterization of technological copper cycles. Ecol. Econ. 42, 9–26.
Graedel, T.E., Van Beers, D., Bertram, M., Fuse, K., Gordon, R.B., Kapur, A., Klee, R., Lifset,R., Memon, L., Rechberger, H., Spatari, S., Vexler, D., 2004. Exploratory data analysisof the multilevel anthropogenic copper cycle. Environ. Sci. Technol. 38, 1253–1261.
Graedel, T.E., Van Beers, D., Bertram, M., Fuse, K., Gordon, R.B., Gritsinin, A., Harper, E.,Kapur, A., Klee, R., Lifset, R., Spatari, S., 2005. The multilevel cycle of anthropogeniczinc. J. Ind. Ecol. 9, 67–90.
Graedel, T.E., Allwood, J., Birat, J.P., Buchert, M., Hagelüken, C., Meskers, C.E.M., Reck, B.K., Sibley, S.F., Sonnemann, G., in press. The recycling of metals: A status report. J.Ind. Ecol.
Hatayama, H., Daigo, I., Matsuno, Y., Adachi, Y., 2009. Assessment of the recycling potentialof aluminum in Japan, theUnited States, Europe and China.Mater. Trans. 50, 650–656.
Hawkins, T., Matthews, H.S., Hendrickson, C.T., 2006. Closing the loop on cadmium: Anassessment of thematerial cycle of cadmium in theU.S. Int. J. Life Cycle Assess. 11, 38–48.
Jackson, P.H., Novick, M.R., Thayer, D.T., 1971. Estimating regression in m groups. Br. J.Math. Stat. Psychol. 24, 129–153.
Jeong, Y.S., Matsubae, K., Kubo, H., Pak, J.J., Nagasaka, T., 2009. Substance flow analysis ofphosphorus and manganese correlated with South Korean steel industry. Resour.Conserv. Recycl. 53, 479–489.
Johnson, J., Bertram, M., Henderson, K., Jirikowic, J., Graedel, T.E., 2005a. Thecontemporary Asian silver cycle: 1-year stocks and flows. J. Mater. Cycles WasteManage 7, 93–103.
Johnson, J., Jirikowic, J., Bertram, M., Van Beers, D., Gordon, R.B., Henderson, K., Klee, R.,Lanzano, T., Lifset, R., Oetjen, L., Graedel, T.E., 2005b. Contemporary anthropogenicsilver cycle: A multilevel analysis. Environ. Sci. Technol. 39, 4655–4665.
Johnson, J., Graedel, T.E., 2008. The "hidden" trade of metals in the United States. J. Ind.Ecol. 12, 739–753.
Kahhat, R., Williams, E., 2009. Product or Waste? Importation and End-of-LifeProcessing of Computers in Peru. Environ. Sci. Technol. 43, 6010–6016.
Lindley, D.V., 1971. Bayesian Statistics: A Review. SIAM, Philadelphia.Mao, J.S., Dong, J., Graedel, T.E., 2008. The multilevel cycle of anthropogenic lead: I.
Methodology. Resour. Conserv. Recycl. 52, 1058–1064.Meadows, D.H., Meadows, D.L., Randers, J., Behrens III, W.W., 1972. The Limits to
Growth. Universe Books, New York.Novick, M.R., Jackson, P.H., Thayer, D.T., Cole, N.S., 1972. Estimating regression in m
groups: a cross-validation study. Br. J. Math. Stat. Psychol. 25, 33–50.
Ritter, S.K., 2009. Future of metals. Chem. Eng. News 87 (23), 53–57.Rochat, D., Hagelüken, C., Keller, M., Widmer, R., 2007. Optimal Recycling for PrintedWiring
Boards (PWBs) in India. http://www.preciousmetals.umicore.com/publications/articles_by_umicore/electronic_scrap/OptimalRecyclingForPWBinIndia.pdf 2007accessed 2-15-10.
Saurat, M., Bringezu, S., 2008. Platinum group metal flows of Europe, part 1: Globalsupply, use in industry, and shifting of environmental impacts. J. Ind. Ecol. 12,754–767.
Terazono, A., Yoshida, A., Suzuki, R., Murakami, S., Shinkuma, T., 2009. Analysis ofmaterial cycle systems for E-waste and waste plastics in Asia. Waste ManagementResearch Grant report, The Ministry of the Environment, Japan, Tokyo. K2064.
The Ministry of Economy, Trade, and Industry, Japan, 2006a. Inappropriate exports ofwaste electronics and electrical equipment from Japan. http://www.env.go.jp/council/03haiki/y0311-05/mat02_4.pdf 2006accessed 5-7-09.
The Ministry of Economy, Trade, and Industry, Japan, 2006b. Investigation of actualconditions for material flows on waste electronics and electrical equipment. http://www.env.go.jp/council/03haiki/y0311-05/mat02_1-1.pdf 2006accessed 5-2-09.
TheMinistry of Economy, Trade, and Industry, Japan, 2009. Criterion of used products inexports for end of life cathode ray tube televisions. http://www.env.go.jp/recycle/yugai/law/crt_h210601.pdf 2009accessed 6-15-09.
The Ministry of Finance, 2009. Japan, Trade Statistics of Japan. http://www.customs.go.jp/toukei/info/index_e.ht 2009accessed 4-14-09.
Trainer, F.E., 1982. Potentially recoverable resources: How recoverable? Resour. Policy8, 41–52.
United Nations Environment, Programme, 1992. Basel Convention on the Control ofTransboundary Movements of Hazardous Wastes and Their Disposal. http://www.basel.int/text/con-e-rev.pdf 1992accessed 6-23-09.
United Nations, 2009. UN comtrade. http://comtrade.un.org/ 2009accessed 4-20-09.Waida, C., Alivasatos, A.P., Kammen, D.M., 2009. Materials availability expands the
opportunity for large-scale photovoltaics deployment. Environ. Sci. Technol. 43,2072–2077.
Williams, E., Kahhat, R., Allenby, B., Kavazanjian, E., Kim, J., Xu, M., 2008. Environmental,Social, and Economic Implications of Global Reuse and Recycling of PersonalComputers. Environ. Sci. Technol. 42, 6446–6454.
Yamasue, E., Nakajima, K., Daigo, I., Hashimoto, S., Okumura, H., Ishihara, K.N., 2007.Evaluation of the potential amounts of dissipated rare metals from WEEE in Japan.Mater. Trans. 48, 2353–2357.
Yoshida, A., Tasaki, T., Terazono, A., 2009. Material flow analysis of used personalcomputers in Japan. Waste Manage. 29, 1602–1614.