Embed Size (px)
Citation preview

REGIONAL COPPER-NICKEL STUDY..
STREAM PERIPHYTON
t1innesota Envit'onmental Quality Board
Nark D. Johnson
August 7, 1978
PR LI lNAfiY DF< FT SU J CT T J fi FiEVI N 0 T U
This document is made available electronically by the Minnesota Legislative Reference Library as part of an ongoing digital archiving project. http://www.leg.state.mn.us/lrl/lrl.asp

Page i
INTRODUCTION TO 11IE REGIONAL COPPER-NICKEL ST1,
The Regional Copper-Nickel Environmental Impact Study is a comprehensiveexamination of the potential cumulative environmental, social, and economicimpacts of copper-nickel mineral development in northeastern Mlnnesota.This study is being conducted for the Minnesota Legislature and stateExecutive Branch agencies, under the direction of the Minnesota Environmental Quality Board (N:EQB) and with the funding, review, and concurrenceof the Legislative Commission. on Minnesota Resources.
A region along the surface contact of the Duluth Complex in St. Louis andLake counties in northeastern Minnesota contains a major domestic resourceof copper-nickel sulfide mineralization. This region has been explored byseveral mineral resource development companies for more than twenty years,and recently two firms, Al~X and International Nickel Company, haveconsidered. commercial operations. 1bese exploration and mine planningactivities indicate the potential establishment of a new mining and processing industry in Minnesota. In addition, these activities indicate theneed for a ~omprehensive environmental, social, and economic analysis bythe state in order to consider the cumulative regional implications of thisnew industry and to provide adequate information for future state policyreview and development. In January, 1976, the }ffiQB organized and initiatedthe Regional Copper-Nickel Study.
The major objectives of the Regional Copper-Nickel Study are: 1) tocharacterize the region in its pre-copper-nickel development state; 2) toidentify and describe the probable technologies which may be used to exploitthe mineral resource and to convert it into salable commodities; 3) toidentify and assess the impacts of primary copper-nickel development andsecondary regional growth; 4) to conceptualize alternative degrees ofregional copper-nickel development; and 5) to assess the cumulativeenvironmental, social, and economic impacts of such hypothetical developments. The Regional Study is a scientific information gathering andanalysis effort and will not present subjective social judgements onwhether, where, when, or how copper-nickel development should or shouldnot proceed. In addition, the Study will not make or propose state policypertaining to copper-nickel development.
The Minnesota Environmental Quality Board is a state agency responsible forthe implementation of the }linnesota Environmental Policy Act and promotescooperation between state agencies on environmental 'matters. The RegionalCopper-Nickel Study is an ad hoc effort of the MEQB and future regulatoryand site specific environmental impact studies "Jill most likely be theresponsibility of the Minnesota Department of Natural Resources and theMinnesota Pollution Control Agency.
PR Llf'JlINARY DRp\FT SU JEeT T M J R REVISION D N T U T

Page ii
c'.' !
ABSTRACT
Periphyton communities were sampled in the Regional Copper-Nickel Study
Area (Study Area) during 1976 and 1977. Diatoms were the most abundant
algal component and Achnanthes minutissima was the most abundant diatom
taxa. Periphyton prod~ction was highest in spring and fall.
Periphyton communities in the Study Area are related to stream order. As
stream order increases, production increases and the relative abundance of
acidophilous diatoms decreases.
Current taconite mining operations have caused some shifts in the dominant
species but not in periphyton diversity or production. In genera~ streams
affected by mining have higher relative abundances of A. minutissima and
lower relative abundances· of acidophilous species.
PREL!MINARY DRAFT SUBJECT T MAJOR REVISIC)N DO I'\l T au T

P~ge iii
TABLE OF CONTENTS
ii
iii
i
v
iv
45
52-77
78-94
1.
4.4
4
5
6
8
10
111112
13
14
17
Periphyton Communities1820
21
22
23
24
25
27
31
General Introduction to Regional Copper-Nickel Study
ABSTRACTTABLE OF CONTENTSLIST OF TABLESLIST OF FIGURESINTRODUCTIONMETHODS
Study Area.Sampling Area and StationsField and Laboratory ProceduresData AnalysisCluster Analysis
RESULTS AND DISCUSSIONDistribution of Diatoms in the Study AreaDominant Diatom TaxaSeasonal Patterns of Dominant DiatomsDiatom DiversitySimilarity of Periphyton CommunitiesPatterns of ProductionRelationship Between Stream Order andCurrently' Illlpact~d Streams
Mine DewateringUnnamed CreekFilson CreekINCO Seeps
SUMMARYLITERATURE CITEDAPPENDIX 1
APPENDIX 2TABLESFIGURES
JEeT TO rv1AJOR REVISION DO N T U T

Page iv.
LIST OF TABLES
1. Periphyton sampling intensity.
2. Mean number of blue-green, green and diatom cells per m2 of glassslide artificial substrate and percent diatom cells observed in1976.
3. Number of taxa identified ahd the number of samples collected withineach vJatershed.
4. Dominance values (D) and frequency of occurrence (F) for diatom speciescollected qua1itat1ve1y. 2 pp.
5. Dominance values arid frequency of occurrence for diatoms species collectedquantitatively.
6. Mean relative abundance of dominant diatom taxa. Means are calculated forMay, August, and Late September, 1976, and May, late-July and August, 1977.
7. Annual mean percent relative abundance of dominant taxa collectedquantitatively.
8. Number of stations where dominant taxa reach their peak abundance duringeach sampling period.
, -."
9. Species diVersitlEP\'-!Of diatom communitles colonizing glass slides atprimary and J~ i j secondary stations.
10. Species diversit~l~ of qualitative d-iatom samples collected in 1977.IP. 2
1
11. Mean annual ~h1orophyl1 a and cells/mm2 determined from samples collectedon glass slide artificiaT substrates.
12. Median water quality data averaged by stream order.
13. Acidophilous diatom taxa found in the Study Area.
14. Correlation coefficients for comparisons between stream order and meanpercent relative abundance of acidophilous diatoms.
15. Mean annual percent relative abundance of dominant diatom taxa averagedby stream order. Samples collected from glass slide artificial substratesin 1976.
16. Percent frequency of occurrence of diatoms by stream order in April, 1977.Taxa included have a 50% frequency of occurrence in any stream order.
17. Frequency of occurrence of diatoms by stream order in August, 1977.Taxa included have 50% frequency of occurrence in any stream order.
PRELlflv11N RY DRAFT SUBJECT T fv1AJ R REVI'SI I\l D N T au T

Page iv. cont1d
18. Mean number of.acid-tolerant taxa, mean number of species and species.diversity found in qualitative samples.
19. Diatom taxa which have a frequency of occurrence greater than 50%within groups from qualitative cluster.
20. Comparison of productivity and diversity at impacted and unimpacted sitesi~ the Study Area. Data from 1976 sampling season
21. Comparison of productivity and diversity at F-1, KC-l, and 88-1. Datafrom 1976 sampling season.
22. Comparison of diatoms collected from a small creek above Station C andbelow Stations AR and BR, a seep from the INCO exploration site. Samplescollected July 5, 1.977 from glass slides. 3 pp.
PH LIMINARY DRAFT SUBJECT T t\~AJ R REVISI N DO NO U T

Page v
LIST OF FIGURES
1. Aquatic biology stream stations.
2. Relative abundance by sampling period of Achnanthesminutissima and~. linearis (including ~ linearis var pusilla) at Station SL-l.
3. Relative seasonal abundance of Cocconeis placentula var. lineata atP-l and SL-l.
4. Relative seasonal abundance of Synedra spp. at P-l 'and SL-l.
5. Spee i es di ve rsity /'; 1 \ at f i ve pr i rna ry sitesin 1976 and 1977 .
~6. Species diversity 0/ 1 \ and relative abundance of Achnanthes minutissima
at stations D-l ~ and SL-l. ," /
7. Percent of 'time stations occurred in clusters at the .5 level ofsimilarity.
8. Mean relative abundance of the Achnanthes minutissima, A. linearis (including ~ linearis var pusilla), Cocconeis placentula Tlncluding C.placentula var. lineata), Tabellaria flocculosa, and Synedra spp. ctprimary and secondary stations in 1976. Stations are ordered accordingto abundance of A. minutissima.
9. Mean relative abundance of the taxa Achnanthes minutissima, A. linearis(including A. linearis var. pusilla), Cocconeis placentula (Tncluding C.p1acentul a var. 1i neata) and Synedra spp. at pr'i mary and seconda ry statronsin 1977. Stations have been ordered according to the abundance of A.minutissima,
10. Mean chlorophyll a in 1976 and 1977 averaged over all stations sampledin each sampling period.
11. Seasonal changes in chlorophyll~ and total cell counts averaged overprimary sites.
12. Mean chlorophyll a averaged over all sites within each streamorder in 1976 and-1977.
13. Average percent relative abundance 6y stream order of acidophilousdiatoms collected on glass slide artificial substrates in 1976 andaverage pH by stream order.
14. Average percent relative abundance by stream order of acidophilous diatomscollected qualitatively in 1976 and average pH by stream order.
PRELiMI(,\JAHY OnAFT SUBJECT T fVlAJ R REVISI N 0 NOT U TE

Page v
List of figures cont'd
15. Scatter plot and regression lines of the percent relative abundanceof acidophilous diatoms collected qualitatively and pH in May andSeptember, 1976.
16. Dendrogram for diatom species collected qualitatively during August 1977.
17. Shift in dominant species between unimpacted sites (SR-l and KC-l) and":_~Himpacted sites (SC-l and P-5) within 4th order and 2nd order streams.
PRELIMINARY DRAFT SUBJECT TO MAJOR REVISION 0 N T U T

Page 1
INTRODUCTION
Stream periphyton communities are composed of bacteria, fungi, protozoa,
and a-I gae which grow attached to substrates. The primary producers,
composed of various algal groups, are the most studied component of the
periphyton community and have been referred to as the phyco-periphyton
(Collins and Weber 1978). Under most conditions, diatoms dominate the
phyco-periphyton comprising about 90% of the algae cells (Hynes 1970,
Potter et ale 1975). Diatom species are widespread and occur under a wide
variety of conditions. A large number of species is normally present;
as environmental conditions change ,different species flourish. The
factors considered most important in determining the distribution and
dominance of diatoms include: temperature, light, current velocity,
substrate, pH, nutrients, and the concentration of various anions and
cations. Their importance to diatoms has been reviewed by Patrick (1977)
and Blum (1956).
- Seasonal changes in stream periphyton communities are not well understood.
Most diatom species are present throughout the year and attain dominance
when conditions become optimal. Whitton (1976) described a spring and
fall diatom bloom in streams while the green algae become more important
during midsumner. The spring diatom maximum occurs as water temperatures
and light intensity increase and before leaves develop on overhanging vege
tation. The fall maximum occurs as leaves begin falling and streams begin
to cool (Hynes 1970). Species such as Cocconeis placentula and Navicula
~yptoce~ have mi dsummer max ima whi 1e other speci es occur as wi nter,
spring, or fall dominants (Peters et ale 1968). Primary. pr'oductivity
PRELIMINARY DF1AFT SUBJECT TO rv1t\JOR F{ VIS; N DO N T U

Pa.ge 2
generally increases with warmer temperatures and greater light intensity,
although Waters (1961) and Peters et al. (1968) reported spring and fall
maximums in chlorophyll a production, a measure of algal standing crops.
Douglas (1958) related seasonal changes in diatom population size to the
populations of grazing invertebrates. This aspect of seasonality has not
been extensively studied.
Patrick (1958) .reported that similar diatom communities developed under
similar eco16gical conditions and stated that most diatom species are
ubiquitous. Patrick (1967) also discussed the relation of the species pool,
invasion rate and size of habitat to diatom communities. As anyone of
these factors increase, the number of rare taxa in the population also
increases.
Studies of community succession along a stream have been made but no defini
tive data have been presented. Longitudinal changes in stream periphyton
comnunities can be expected as chemical and physical parameters change
along the length of a stream (Regional Copper-Nickel Study 1978b). Butcher
(1946) stated that there is a decrease in planktonic diatoms and an increase
in planktonic green and blue-gt~een algae as one moves downstream from the
source of a stream. Increased primar'y production by periphyton occurs
between the headwaters (1st through 3rd order streams) a~d the midreaches
(4th to 6th order streams) followed by a decrease further downstream
(Wetzel 1975, Cummins 1976).
Periphyton communities have been extensively studied because they provide
most of the instream primary production in first through sixth order
streams. In recent years interest has grown in petiphyton communities as
PRELlf\~INARY Df-1AFT SUBJECT T f\~AJ R REVISION 0 N T U T

Page 3
indicators of water ,quality (Cairns et al. 1972 , Patrick 1973; 1975). The
use of periphyton to monitor environmental changes has been suggested because
periphyton respond rapidly to changes in \vater qual-ity, they are sessile
organisms subjected to all water quality changes, and sampling is relatively_.
easy in comparison to other stream organisms. Lowe (1973) compiled the
available autecological data for diatoms to facilitate the assessment of
water quality through biological sampling.
Several parameters are used to analyze periphyton communities: chlorophyll
~, ash-free dry weight, cell counts and species proportional countes (Weber
1973). Measures of diversity and/or the number of species in the community
are also important parameters (Patrick 1973). With this information, an
estimate of the productivity and diversity of the diatom community can be
made and the water quality assessed.
Because of the importance of periphyton to stream ecosystems and their
usefulness in assessing water quality, a study of stream periphyton in
the Regional Copper-Nickel Study Area (Study Area) was initiated in May,
1976. This study was designed to characterize: 1) the relative produc
tivity of periphyton communities in various Study Area streams; 2) diatom
species distributions and dominant species within the Study Area; 3) the
relation of diatom communities to stream order; 4) the effect of current
mining practices on periphyton communities; and 5) some of the factors
responsible for the observed diatom distributions and dominance. With this
characterization, prediction of the potential impact of copper-nickel
development on periphyton communities should be possible for streams which
\vere intensively sampled and to a -lesser' degree in streams which were not
fc:lRELlfVliNARY DF~AFT SUBJECT T I\~AJ R REVISI N 0 u 'T',

::Page 4
sampled during this study. This characterization is not meant to be a
baseline which could be used to quantitatively assess the impact of copper
nickel development in future years. A statistical analysis of the peri
phyton data will be made available in another report.
METHODS
Study Area
The Study Area encompasses 5516 km2 in Lake and St. Louis counties in northeast
ern Minnesota"(Figure 1). The area is divided into two major watersheds by
the Laurential Divide; water south of the divide flows to Lake Superior while
water north of the divide flows to Hudson ~ay. Within the Study Area there
are 2623 km (1630 miles) of streams.
Streams in the Study Area are generally bog stained, soft water streams.
Alkalinity ranges from 1 to 190 ppm CaC03 but is generally less than 50.
Because the source of many of the streams is in bogs, low pH is found in
headwater streams; median pH ranges from 66 in headwater streams to 7.5 in
'downstream reaches. The streams consist of long flat reaches connected by
short riffles. Average gradients range from 4.7 m/km to .8 m/km. Sub
strates in Study Area streams range from silt, sand, and/or detritus in
pools to gravel, rubble, or bedrock in riffles.
Samp~ Area and Stations
Periphyton sampling was concentrated in the area east of Biwabik and south
of Ely in the area of greatest potential for copper-nickel development.
This area is unshaded in Figure 1. In 1976 sampling stations were located
in riffle areas within those watersheds which had the greatest potential for
PFlELItv1INARY Di~AFT SUBJECT T MAJ Fi REVISION DO N T U T

Page 5
impact from copper-nickel mining. Stations were designated "primaryl',
"secondary", or "tertiary" depending on the sampling intensity scheduled
for the station (Table 1). Primary stations were located in downstream
portions of the watershed and were sampled quantitatively and qualitatively.
These stations were selected to reflect the culmination of conditions
within the watershed. Secondary stations were also sampled quantitatively
and qualitatively but less frequently than primary stations and were located
in upstream portions of watersheds or in areas already impacted by taconite
mining or copper-nickel exploration. Tertia'ry stations were sampled only
qualitatively and were located throughout the Study Area so that overall
distributions of periphyton species in the Study Area could be examined.
Additional stations were sampled in 1977 and were located over a larger
portion of the Study Area. Emphasis was placed'on sampling stations more
evenly distributed over the various stream orders found in the Study Area.
These stations, designated stream classification stations (SCS) were sampled
in an attempt to determine the relationship between stream order and peri
phyton communities.
Field and Laboratory Procedures,
Quantitative periphyton samples were collected from glass slide artificial
substrates. These slides were suspend~d between 5 and 15 cm below the
water for three week colonization periods in an area of moderate current.
Individual slides were analyzed for chlorophyll, total cell counts, and
diatom species proportional counts. In 1976, three replicate slides
were analyzed for each of these parameters. Cell counts were not made in
1977 because of time limitations. At primary stations in 1977 three sl'ides
PRELHvHNARY DRAFT SU8~J T TO ~Jit'tJ R REVISI N DO N T U

Page 6
were analyzed for chlorophyll while four replicate diatom species propor~
tiona1 counts were made. During 1977 two diatom species proportional
counts and three chlorophyll analyses were made at secondary stations and
at SCS stations. Chlorophyll sBmp1es were analyzed by the methods described
by UNESCO (1966) and Lorenzen (1967). Cell counts were made by sedimenting
an aliquot of sample for 24 hours. These samples had been preserved in
Lugol's solution. Subsamp1e size was estimated by scanning a wet mount
of the slide.· Cells 'were counted on an inverted microscope and separated
into general groups (e.g. filamentous Cyanophyta). Permanent diatom slides
were prepared by clearing the frustules by the lI po tassium persulfate oxidation ll
method in 1976 (Weber 1973) and the lIpermanganatell method (Hendley 1974)
in 1977. Diatoms were then mounted in Hyrax according to procedures
described by Weber (1973). Species proportional counts consisted of
counting and identifying 500 half cells (Weber 1973).
Qualitative samples were collected by scraping wood, aquatic vegetation
and rocks, and by pipetting samples from soft substrates at each station
sampled. Species proportional counts of diatoms were carried out on a
composite sample from the quali·tative collection. Complete field and
laboratory methods are described in Operations Manual - Aquatic Biology
(Regional Copper-Nickel Study 1977).
Data Analysis
In the following results section "samplell is defined as the mean of the
available replicates from a station on one date for the parameter discussed
(i.e. chlorophyll ~, cell counts, and species proportional counts). For
qualitative collections and quantitative collections where only one
PF{ELIMINARY Dr-~AFT SUBJECT T tV1AJ R REVIS I NON T U

Page 7r'.' ).
replicate was analyzed, a sample represents a single value rather than
a mean but is used synonymously with the sample described above. There
fore, quantitative and qualitative data were treated similarly in the
analyses but were always analyzed separately.
Annual means discussed are the average of the samples from three selected
sampl ing dates in each, of the sampl ing years: 1976 and 1977. These
dates were selected betause they had samples available from the greatest
number of stations. These dates were the following: late May, mid-
August, and late September, 1976 and late May, late July, and mid-August,
1977. Where samples were lacking for a station on any date, the annual
mean was calculated on the available samples.
The calculation of means for groups of sites (e.g. grouped by stream
order) used samples from the six dates listed above. When statistical
comparisons were made between groups of ~tations, annual means from
individual stations were treated as individual measurements within the
groups. Frequency of occurrence data was calculated individually on
,samples of each date. lIFrequently collected taxa ll were taxa that had a
frequency of occurrence greater than or equal to 50% for all stations
sampled in any sampling date.
Domi nant taxa compri sed at 1e.as t 5ib of any sample on. any da te. Domi nance
values were c~lculated' by assigning dominant taxa the following values:
most abundant taxa = 4; second most abundant taxa = 3, third most abundant
taxa = 2; fourth most abundant taxa = 1; and other taxa greater than 5% = o.
These numbers were then sun~ed across sites for each taxon on each date.
The ratio of each sum to the maximum for that date was converted to a
pF-~ELlrV1INARY DFiAFT SUBJECT TO MAJ R REVISI N D f"'-J T U

Page 8
percentage to obtain the dominance value for a taxon on a date. The
maximum number used in each ratio was four times the number of sites
sampled on that date.
Species diversity (1/IPi 2) was calculated using sample values. The
index was calculated on the data from species proportional counts. Species
and varieties were treated as individual taxa in the calculation of
diversity. Genus level identifications were used in diversity calculations
for six genera: Cymberla, Melosira, Navienla, Nitzschia, Pinnularia and
Synedr'a. The species in these genera were pooled to genus level as a
result of the quality control program in 1976 (Regional Copper-Nickel Study
1977). This program indicated that taxonomic errors were present in the
identification of species within these genera.
Cluster Analysis
Analysis of patterns of similarity between periphyton communities using
quantitative data was based on calculating of the Bray-Curtis similarity
coefficient using relative abundance percentages (Boesch 1977). This
coefficient is also called "percentage similarity" when used in percentage
data, or the Czekanowski coefficient. This coefficient of similar'ity was
selected from many possible coefficients because it gives most weight to
large differences in percent relative abundance rather ,than small
differences (Boesch 1977, Clifford and Stephenson 1975). Because of the
variability present in the data it was thought that small differences
mi9ht not be significant and therefore should not determine the similarity
or dissim-jlarity of stat-ions.
JEeT T rV1j\JOH F: VISI N 0 N T I!\,) T

Page 9
The percent similarity coefficient is as follows:
x' .Sjk = L min (Pij, Pik) where Pij = L~~j is the relative abundance of the
ith taxon at site j. This coefficient ranges from 0 to 1 where 1 =
identical sites.
Calculations of similarity betv-Jeen sites in one sampling period were based
on an edited data matrix including only those taxa conprising at least 5%
of the "mean' sample 'l .for at least one of the stations sampled. Relative
abundance of a taxon was still calculated relative to the total abundance
of all diatom taxa. Exclusion of the rare species has very little effect
on the analyses and saves considerable amounts of computer time. The matrix
of sinlilarity coefficients between pairs of sites was analyzed by cluster
analysis to determine whether sites could be ~lassified into groups
according to the patterns of relative abundance of dominant species.
The method of clustering used has been called group average (Bresch, 1977)
and unweighted pair-group method using arithmetic averages (UPGMA) (Sneath
and Sokul, 1973). This is a hierarchical, agglomerative method in which
sites are grouped so as to minimize the distance between two groups of
entities, defined as the mean of all distances between members of one
group to members of the other.
This method has been widely Jsed in aquatic ecology (Boesch, 1977) and
tends to ·preserve the original expressed in the matrix of similarity
coefficients.
Cluster analysis of qualitative data employed the Jacard coefficient of
similarity, and the group average method of clustering descr-ibed above.
FT S JEC T AJ R R VI N 0 N T u TI

Page 10
::
RESULTS AND DISCUSSION
Distribution of Diatoms in the Study Area
Diatoms were the major component of the phycoperiphyton in the Study Area
comprising an average of 87% of the algal cells enumerated in 1976 (Table
2). This is similar to results reported by Potter et al. (1975). Within
the Study Area, 433 diatom taxa were identified. Appendix 1, Table 1
indicates the distribution between watersheds of diatom taxa collected.
Species in the genera Cymbella, Navicula, Nitzschia, Melosira, Pinnularia,
and ~'ynedra are not indicated but the species are listed in Appendix 1, Table
2.
The number of taxa collected within any watershed was correlated with
sampling effort in those watersheds (correlation coefficient = .90). The
number of taxa found and the number of qualitative and quantitative samples
collected is listed in Table 3. Because water quality is similar in all
Study Area watersheds (Regional Copper-Nickel Study 1978c), no difference in
- the species lists for individual watersheds of equal size in the Study Area
'would be expected since diatom species lists are similar under similar
ecological conditions as discussed by Patrick (1968). Small differences
in stream conditions in the Study Area should be indicated by shifts
in dominant taxa.
Dominant Diatom Taxa
Tables 4 and 5 present the dominance values for species which occurred as
a dominant in qualitative and quantitative periphyton samples. According
to the dominance index, Achnanthes minutissima was the most dominant taxon
PHELIMINAHY Dr:~AFT SU ~JECT TO IV1AJ R FiEVISI N DO N T U

Page 11
during all qualitative and quantitative sampling periods. This species.
comprised from .45% to 16.07% of the mean relative diatom abundance for
sal~lples collected at stations sampled quantitatively (Table 6)
and overal"1 it comprised 40.96% and 27.99% of the diatoms enumerated in 1976
and 1977, respectively (Table 7). As these data indi~ate, ~ minutissima
was less abundant in 1977 than in 1976. In 1977 taxa such as Synedra
spp. and Cocconeis placentula increased in abundance.
Dominance of per'iphyton communities by A. minutissima has been reported in
lakes (Stockner and Armstrong 1971, Johnson unpublished) and streams
(Douglas 1958, Dillard 1968, Sherman and Phinney 1971, Archibald 1972, Moore
1972). This species is characteristic of clean well aerated water (Lowe 1974)
and has been described as one of the most ubiquitous diatoms known
(Peterson 1943 cited, in Lowe 1974). The reason for increases in Synedra and
.~ placentula is unclear.
Other taxa which were among the three most dominant taxa during any sampling'
period in quantitative samples were Achnanthes linearis, A. linearis var.
~illa., h placentula', Synedra spp., Diatoma tenue var. elongatum,
Navicula spp. and Nitzschia spp. (Table 4). In qualitative samples, the
same taxa occurred among the three most dominant taxa as in quantitative
samples. In addition Tabellaria flocc~llosa, Fragilaria pinnata and L
crotonensis occurred in the t6p three taxa only in qua~itative samples,'
Tables 4 and 5 also list the most frequently collected taxa which are
taxa with a frequency of occurrence equal to or greater than 50%, in at
least one sampling period. Dominant taxa always belong to the most
frequently collected group.
F)I=iELHJlINARY DFi FT S ~I C T' MAJ R fiEVI ION 0 N T U

Page 12
The taxa listed in Tables 4 and 5 are those which are likely to occur in
any Study Area stream.
Seasonal Patterns of Dominant Diatoms
'oTable 8 lists the sampling periods during v/hich dominant di·atom taxa
reached their maximum relative abundance in quantitative samples. Figures
2 through 4 graphically display the seasonal changes in four of the
dominant species at stations where the most continuous sampling was done
and the species was abundant. A. minutissima is the most dominant taxa
at all times of the year and exhibits a spring and fall maximum with a
m-id-summer lm\l (Figure 2). A. linearis (including ~l:- var. pusilla)
tends to be inversely related to !l:-. minutissima; it exhibits a midsummer
maximum, at least in the presence of ~ minutissirna (Figure 2). As
indicated on Table 8, ~ linearis can peak in the spring and A. linearis
var. pusilla can peak in the fall.
h placentula had a midsummer bloom (Table 8 and Figure 3). Most other
dominant diatoms had spring maximums. Species such as Tabellaria spp.
and Diatoma tenue_ var. elongatum probably have fall maximums but sampling
was discontinued too early to observe this peak if it occurred. ~yned}~
spp. exhibited spring and fall maxima (Table 8 and Figure 4).
The seasonal patterns for diatom speci€s are poorly understood. Lowe (1974)
presents limited data on seasonality and much of the seasonal data are
conflicting. For example, Lmve (1974) reports a fall maximum for C.
placentula but in the present study and in data reported by Peters et al.
(1968) ~_ J2las:.entL!J~ had a midsummer maxima. Summer maxima have been
reported for ~ rninutissima (Stockner and Armstrong 1971, Moore 1972) which
PRELlfvllNARY DF( FT SUBJ CT T r\/IAI..J Fi REVISI NON T U T

Page 13
(,. . .~
;s contrary to the current study. These differences probably reflect the
complex set of factors governing the time when a ,diatom obtains its peak
abundance. Factors such as current velocity and temperature which are
important to diatom development will fluctuate differently in relation to
season in different st~eams.
Diatom Diversity
Tab1e 9 presents the 1976 and 1977 divers i ty C:p~2 ) for quant-i tat i ve
samp1es co11 es::ted at prima ry and seconda r'y sta t ions averaged over' three
sampling periods per year. Great~st mean annual diversity was observed at
KC-l and F-1 with values of 8.0 and 7.5 respectively; SL-1 and P-1 had
the lowest diversity, with values of 1.8 and 2.2.
No clear seasonal trends are evident in the data from primary sites
(Figure 5). Major changes in diversity app~ar to be related to changes in
the relative abundance of the dominant taxa such as ~ minutissima, ~
linearis, and ~ placentula.
presented in Figure 6.
1
Two examples of this relationship are
Diversity (IPi 2) was calculated for qualitative samples collected in 1977
(Table 10). Diversity in qualitative samples ranged fr'om 2.4 to 28.4 in
April, ,1977, and from 2.8 to 63.0 in August, 1977. No clear" patterns in
cI i versity \'Je re evi cI ent, a1though di ver sitY was gene ra11 y greater i n qua 1i -
tative than in quantitative samples.
Diatom species diversity in the Study Area is misleading because of the
corninance of A__ mint~_tissillla at many stat'ions. Arch'ibald (1972) reported
that the dominance of !l:-. minu~issima, a clean water species, in some South
Afri can streams cau sed divers'j ty. in lie 1ean II streams to be 10"-Ier than divers i ty 1n
PFiELi~'i1!r\JAFiY DF~ F UBJE T rv1AJ HH VISI ND NT U

Page 14
II po ll uted ll streams. Therefore diatom diversity in Study Area streams does
not adequately reflect water quality differences.
Similarity of Periphyton Communities
The cluster ana.lysis of qua.ntitative diatom data from primary and
secondary stations (Appendix 2, Figures 1-6) provided a method of
determining patterns of similarity in periphytic diatom communities. To
determine groups of similar stations the percentage of times that stations
occurred in the same cluster at the .5 level in 1976 was calculated
(Figure 7). !\fter examining the clusters,. this level \vas chosen as a leve'l
at which clusters could be interpreted. Values from .4 to .75 have been
used to define significance in other aquati~ biological studies (Herricks
and Stanhope 1976, Burlington 1962, Cairns et al. 1970). This analysis was
not performed on the 1977 data as fewer stations were sampled and there was
poor success in retrieving samplers.
Two sets of stations always clustered together: 1) BB-1 and 0-1; and
2) P-l and SL-1. The sites BB-1, 0-1, P-l, SL-l, P-2, and P-5 clustered
together in greater than 66 percent of the analyses. Other groups formed
were less frequent. Station K-2 in the Shagawa River was unique as it
clustered only once with site E-1. It appears that the most important
factor detenllining these groups is the' abundance of A. 1111nutissima.
Because of the overall dominance of a few diatom species in Study Area
streanls, a comparison of stations was made based on mean abundanc~ of
five dominant taxa in 1976 (Figure 8) and four dominant taxa in 1977
(Figure 9). In each year, the annual mean was calculated from data for three
p LI it\! r~Y DFiAF JEC T r\~t\J R F{EVISI N D NOT U T

Page 15
sampling dates. Three general groups were defined based on the relative
abundance of A. minutissima. The cutoff points for each group were chosen
to reflect the groupings evident from the data in Figures 8 and 9. The
groups \'Jere defined as follows: 1) group 1 stat-ions \~here !l:-lwinutissima
. 'is' greater than 49 percent; 2) group 2 stations where the r'elative abundance
of ~ minutissim~ is between 15 and 49 percent; and 3) group 3 stations
where the abundance of 'A. minutissima is less than 15 percent.
In 1976 several other observations could be made concerning the similarity
of stations. ·Group 1. includes those stations which cluster analysis
grouped together with one exception, SR-l. SR-l is included in the cluster group
because it occurred in only one data set which was clustered in 1976.
In group 2, a subgroup of F-1 and KC-l is evident based on the high abun
dance of T. flocculosa (> 10 percent). Also, K-8, a member of group 2,
is different because Gomphonema pa rvu 1um compri sed 27.5 per'cent of the
diatoms at this station, higher than at any other station sampled quanti
tatively (Table 4).
The sites K-2 and K-5 comprise group 3 but are different from one another
because of the dominance of L placentula at K-2 and A. linear-is at K-5
(Fig ur'e 8).
In 1977 the three groups were'composedof a slightly different set of
stations. One of the reasons for this appears to be the increased abundance
of ~ynedra spp. at seve)~al stations. Group 1. consisted of stations SL-l,
0-1 and SL~2. P-l could also be included in this group although the
abundance of Il'-. minutissima v~as 45.9 percent. A subgroup within group 2 and
3 consisted of SR-3, K-8 and E-1, all of which had high populations of
BELIMIN RY DF~ F SU J CT T A,J F~ FiEV NON T U

Page 16
Synedra spp. Also within group 3, K-2 and B1-1 formed a subgroup domina~ed
by ~ placentula. K-l was different from other stations because of the
dominance of L angustatum (35.8 percent) at this station in 1977 (Table 4).
The groups of stations defined by dominant diatoms are similar to the
station groups defined by the Water Quality Section (Regional Copper-
Nickel Study 1978c). Group 3 stations which were characterized by high
relative abundance of A. minutissima were also characterized by high conduc
tivity. Lower conductivity resulted in less abundant A. minutissima and
higher abundance of other diatoms (groups 2 and 3). A. linearis is one
of the species which replaces !1.-- minutissima. A. linear'is and A. linearis
var.. pusilla are closely related to ~ minutissima ecologically although
~ minutissima appears slightly less sensitive to the addition of any
material into the environment (Reimer personal communication). This
sensitivity is reflected in the increased relative abundance of these two
taxa vvith decreasing conductivity. The high relative abundance of T.
flocculosa defined the subgroup of F-1 and KC-1, which were stations with
lOVJ pH. The presence of h 21 acentul a probably i nd i cates
inorganic nutrients, particularly at station K-2 since it prefers elevated
levels of inorganic nutrients. The Water Quality Section did not report
levels of inorganic nutrients significantly higher at K-2 than elsewhere in
the Stu'dy Area (Regional ~~ater Quality Study 1978c) although it seems
possible because of hi~h nitrogen and phosphorus concentrations in Shagawa
Lake upstream. Another explanation for the dominance of h placentula
could be selective grazing by invertebrates at K-2 (Reimer, personal
commun'ication, Patrick 1975; 1978). The dominance of ~ angustatum and
Ii:_ par'.Y_LD~~ at K-1 and K-8 is difficult to explain since' these prefer
F~ Ll IN F~Y DB T SU JECT T J R B VI N D N T U

Page 17
alkaline conditions and pH at these sites is neutral to slightly acid.
Patterns of Production
Average values of production as measured by chlorophyll ~ showed similar
seasonal patterns for all sites and for primary sites only in 1976 and
1977 (Figures 10 and 11). Peak production was recorded in late June and
early July; a second peak occurred in September. During late July and
August chlorophyll production was low.
High mean cel) numbers were recorded in May, 1976, at primary stations when
chlorophyll ~ was low (Figure 11). During the remainder of 1976 there was
a better relationship between cell numbers and chlorophyll a.
The seasonal patterns of periphyton production in Study Area periphyton
are similar to those reported in the literature (Waters 1961, Peters et al.
1968) and generally reflect a spring and fall diatom bloom. The use of
glass slide artificial substrates introduces a sampling bias in cell counts
and probably does not reflect the midsummer increase in g~een and blue-green
algae. These samplers are more efficient in sampling diatoms than other
groups (Reimer, personal communication).
Stations P-l, P-2, K-l, and K-2 were the most productive sites based on 1976
mean annual chlorophyll ~ values while'lrighest average cell densities were
at 81-1 and K-l (Table 11). Lowest cell densities were recorded at KC-l
and F-l. KC-l also had low mean annual chlorophyll ~ as did SR-3 and F-l.
Primary production, therefore, is generally higher in the larger streams in
the Study Area and can be related to stream order.
R LI INARY DFiAFT JeT l\!lAJ R R VI81 N D N T U

Page 18
Relationship Between Stream Order
and Periphyton Communities
Average primary production as measured by chlorophyll ~ generally increased
with increasing stream order (Figure 12), although in L977 a decrease was
noted in fifth order streams. These patterns are similar to those discussed
by Cumm ins (197 5; 197 6) . Tab1e 12 presen t s wa t er qua1i tY val ues averaged
by stream order. Because pH increases with increasing stream order the
relationship .be~ween·the realtive abundance of acidophilous diatoms to
stream order was examined. The acidophilous taxa defined by Lowe (1974)
found in the Study Area are listed in Table 13.
Figures 13 and 14 present the mean relativ~ abundance of acidophilous diatoms
found in qualitative and quantitative samples and average pH in relation to
stream ordei. The abundance of acidophilous diatoms decreases with increasing
stream order with the exception of fifth order streams where a slight
decrease in pH occurs.
Figure 15 presents a scatter plot of pH versus percent relative abundance
of acidophilous diatoms in May, 1976 and September, 1976 qualitative
samples. Linear regressions were calculated for each data set after excluding
the circled points. These points were impacted sites which, it was thought,
would not fit the model. The shift in regression lines is a result of
higher pH in September than in May. The correlation coefficients (r valu2s)
for these data sets were -.69 (May, 1976) and -.85 (September, 1976).
Correlation coefficients (Spearman's Rank Correlation) between stream order
and percent relative abundance acidophilous diatoms are listed in Table 14.
These coefficients ranged from -.5 to -1.0, which indicated a strong
PB NARY DHA su CT T 1\",1 R FiEV1SI N D N T U

Page 19
relationship between stream order and the relative abundance of acidophi-
lous diatoms.
In 1976 quantitative data, decreases in the relative abundance of Eunotia
spp., 1. fenestrata, and 1. flocculosa, the most abundant acidophilous taxa,
can be noted with increasing stream order (Table 15). An exception is the
"'~"'increase of T. fenestrata in fifth order streams. Generally.G- placentula,
~ linearis (including L linearis var. pusilla), and species of Gomphonema
increase in abundanc~ with increasing stream order.
Diatom taxa that occurred at greater than 50 percent of the stations within
any stream order during 1977 qualitative collections are listed in Tables
16 and 17. Acidophilous diatoms such as Eunotia spp. and Frustulia
rhomboides decrease in frequency within increasing stream order. In the
April/f·1ay 1977 sampling period ..!2..:- tenue var. elongatum and L capucina
increased with increasing stream order. T. "fenestrata and T. flocculosa
generally became less frequent with increasing stream order although
T. fenestrata increased in fifth order during April/May 1977 and T. flocculosa
was constant across stream orders during this period.
There was no observable difference in the mean number of acidophilous
diatoms occurring at sites within each stream order in August, 1977
(Table 18). A one-way analysis of variance of qualitative data showed no
significant differences (p > .05) between the mean number of species or
between mean spee i es di versity ( l:P i1 ) among stream orders from both the
April/May and August, 1977 sampling periods. This is in contrast to the
results of Mack (1953, cited in Hynes 1970) who noted an increase in algal
diversity in a downstream direction.
PH LIMINAfi'y' DR T U J CT T J Fl H VISI NON U TE

Page 20
.'A cluster analysis' of stations was performed on the qualitative data from
August, 1977 using the Jacand coefficient of similarity (Figure 16).
This data set was chosen because the greatest array of stations was available.
In general, at the .58 level sites clustered by stream order, with sites in
an adjacent stream order or with closely situated sites in the same
watershed. Table 19 lists those taxa which were present at more than 50%
of the stations within a cluster and therefore are responsible for the
formation of the cluster. A large number of taxa were characteristic of
all sites with small' groups of species in each cluster. Group one (first
and second order streams) has a large number of acidophilous taxa and
Meridion circulare which is characteristic of bog drainages. In the other
groups of sites there is a mixture of taxa which Lowe (1974) has classified
as alkaphilous, indifferent and acidophilous.
These data indicate that there is a relationship between stream order and
diatom communities in the Study Area. As stream order increases there is
an increase in periphyton production and a decrease in the relative abun
dance of acidophilous diat6ms. Although not studied it is probable that
there is a corresponding increase in the relative abundance of alkaphilous
diatoms. It also appears that most diatom species occur within all stream
orders but that changing ecological conditions such as pH allow different
species and/or groups to flourish in different stream orders.
Currently Itnl2.9cted Streams
Several streams in the Study Area are currently impacted by taconite mining,
contact with the copper-nickel resource, or copper-nickel exploration.
PR LI IN RY DRAFT SUBJECT T MA,"oJ R FiEVISI N D N u

Page 21
Mine Dewaterin[--Currently operating taconite mines are pumping mine water
into the Partridge River, Dunka River and Unnamed Creek. The effect of ihis
pumping has been to raise the conductivity, alkalinity, and pH of the
receiving waters (Regional Copper-Nickel Study 1978c). The average conduc
tivity at sites with mine dewatering is 270 lJ mho/l compared to 54 p mho/1
at other sites. Stations 88-1, P-5, P-1 and SL-l are' all impacted by
taconite mine dewatering, and form a group of stations which in 1976 were
characterized by high abundance of f1- minutissima. At unimpacted stations
with physical conditions similar to impacted sites, A. minutissima is still
dominant but A. 1inearis became more abundant and A. minutissima less
abundant (Table 6). Another species change occurs in first and second order
impacted stations. T. f1occulosa and other acidophilous diatoms which are
abundant at un impacted first and second order sites were rare at impacted
stations. Figure 19 illustrates these two shifts in diatom species.
Table 20 pr'esents comparisons of productivity, diversity and number of
taxa at sites impacted by mine dewatering and unimpacted sites. There
appear to be no major differences in the product-ivity of impacted and
unimpacted sites. Although mean diversity for 1976 at impacted sites
appears lower than at unimpacted sites, a t-test indicated no significant
difference (p < .05). A larger number of diatom taxa were found at
impacted sites than at unimpacted sites.
The effect of taconite operations has been to favor the development of A.
minlLt:.:Lssima in affected stY'ea.ms. In first and second order streams acido
philoliS species are less abundant because of increased pH and in third and
fourth order streams with elevated conductivity the abundance of species
such as A. linearis is reduced. The overall species list found at impacted
PB LI INAn\{ DRAFT U J T l\Ji/\J R FlEVISI N D N T U T

Page 22
and unimpacted sites are probably similar since water quality differences
are not large enough to produce dramatic shifts in the biological
communities.
Unnamed Creek--In Unnamed Cree~ elevated levels of heavy metals are present
···rn' addition to high conductivity. A further impact in this' first order
stream is fluctuating flow as a result of erratic pumping of mine water.
Table 21 presents a comparison of several biological parameters from
Unnamed Creel, Filson Creek, and Keeley Creek. Primary production in
Unnamed Creek is similar to that in other first and second order streams.
Diatom species diversity was lower in Unnamed Creek at 88-1 than in other
first and second order streams, although at upstream sites on Unnamed Creek
diversity was higher than in Filson Ol~ Keeley creeks (Regional Copper-Nickel
Study 1978a). These apparent inconsistencies are probably caused by the
fluctuating flows in Unnamed Creek although insufficient data is availab10
to prove this hJPothesis.
Dominant diatoms are also different (Regional Copper-Nickel Study 1978a).
A. minutissima is the most abundant diatom species in Unnamed Creek as in
the rest of the Study Area. In. addition IL:- ten~ var. elongatum,
Denticula tenuis and F. construens were abundant. These taxa, while present
on the list of dominant taxa for the Study Area (Table 4), were not found
in the rest of the Study Area. during the same time periods as they Vlere
found in Unnamed Creek in 1976. These taxa were also more abundant in
Unnamed Creek than in the rest of the Study Area. The diatom percentage
in Unnamed Creek ranged from 90 to 99 percent which is higher than that
found in the Study Area in general.
PR LI~Ji N BY DFiAFT SU JEeT TO rVlA,J H R VISI NON T U

Page 23
As in the impacted; sites discussed earlier, no significant impact seems to
have occurred in Unnamed Creek. No radical shifts in the dominance of
algal groups such as mentioned by Patrick (1978) '-in relation to. heavy metals
has occurred. A copper effect would not be expected as levels are below
the toxic level of 70 ~g Cull discussed by Patrick (1977). On the other
hand, nickel concentration in Unnamed Creek is at a level (123 ~g/l)
where some effect may occur. Patrick (1977) reported nickel levels as low
as 2 ~10 ~g/l would cauSe shifts in the major periphyton groups while
Hutchinson (1973) reported that 100 ~g/l was toxic to algae. Because
diatoms are still dominant in Unnamed Creek it does not appear that such
an effect has occurred. The dominance of D. tenue var. elongatum has
probably resulted from the high dissolved solids and cold temperatures.
Q:- tenue var. elongatum is very tolerant of high dissolved solids or
conductivity (Lowe 1974) and normally blooms in the spring v1hen tempera
tures are low (see Seasonal Patterns of Dominant Diatoms). No data are
available on Denticula tenuis while F. construens has ecological
requirements similar to Diatoma.
-Filson Creek-- Filson Creek flows across the mineralized Gabbro contact
and contains elevated levels of heavy metals (median values of 8.0 ~g Cull
and 5.95 pg Ni/l). Comparisons can be made w-ith Keeley C}~e'ek which is a
similar headwater stream with lower heavy metal levels (median values of
1.95 ~g Cull and 3.3 ~g Ni/l}. No effect in the dominant taxa, produc
tivity or' diversity is evident betvJeen Filson and Keeley creeks (Table 21
and Figure 8). Copper levels in Filson Creek are lower than levels where
effects have been reported by Patrick (1977).
PRELl IN Y DFiAFT SU ~J CT T fVlAJ H F<EVI N D N u

Page 24
INca Seeps--In the vicinity of Filson Creek copper-nickel exploration by
INCa has caused elevated concentrations of copper (20-59 ~g/l) and nickel
(14-37 ~g/l) to be present in seeps draining the exploration site. A.
minutissima was the dominant species at station C above the input of
copper and nickel while below this input species of Eunotia and Tabellaria
were more dominant (Table 22). Colonization of glass slides appeared
normal at the time of collection.
No effects were' observed nor would be expected from copper and nickel in
the seeps whi9h were sampled because copper and nickel levels were below
the level of potential effects reported by Patrick (1977).
Besch et ale (1972) found that groups of di~toms were good indicators of
heavy metal pollution during field surveys in eastern Canada. Species
groups which include ~ minutissima, Tabellaria spp. and Eunotia spp. were
reported as sensitive to copper and zinc pollution. These taxa were all
present in Filson Creek, Unnamed Creek and the INCa seeps. Therefore the
results reported by Besch et ale would seem to indicate that there has
been no effect from heavy met.als in Filson Creek, the INCa seeps, or
Unnamed Creek since sensitive species are still abundant.
p Lf IN DR T U ,J T T ~Ill-\J F' R VISI N 0 f\l U T

Page 25
SU~1t'1ARY
Diatoms are the primary component of the periphyton communities in Study
Area streams comprising an average of 87% of the algal cells. The most
:-important diatom species is Achnanthes minutissima which was dominant
throughout the year and the Study Area. Other important taxa included A.
linearis, Cocconeis Qlacentula, Synedra spp., Diatoma tenue var. elongatum
and Ta bella f'i a flo ccu1os a .
The diatom communities demonstrated a spring and fall maximum in production.
Also most of the dominant species were most abundant in the spring and fall.
No clear seasonal patterns in species diversity were evident although
diversity appeared related to changes in the relative abundance of the
most dominant taxa.
T\'10 aspects of the periphyton community are related to stream order.
First primal~ production increases with increasing stream order and
secondly the abundance of acidophilous species decreases. The species
present is similar in all stream orders.
Several groups of similar stations are eV'jdent based on relative abundance
of diatom taxa. In general, stations impacted by taconite mining were more
similar to one another than to unimpacted stations. Also, stations in
first and second order streams tend to be similar to one another while
stations in third and fourth order streams tend to be similar to each other.
The effect of current taconite mining seems to be a shift in species
which favors the dominance of A. minutissima in all streams and the reduc-
tion in the abundance of acidophilous species in first and second order streams.
PRE!...I INABY Df~ T U J AJ R FiEVISi NON u

Page 26
In third and fourth order streams the species shift is not dramatic as
impacted sites are similar to unimpacted sites in these stream orders.
In first and second order streams the shift is more dramatic as' the
impacted sites resemble third and fourth order sites more closely than
they resemble unimpacted first and second order streams.
R Li CT VISI N D N T U T

Page 27
LITERATURE CITED
Archibald, R.E.M. 1972. Diversity in some South African diatom associationsand its relation to water quality. Water Res. 6:1228-1238.
Besch, W.K., M. Ricard and R. Cantin. 1972. Benthic diatoms as indicatorsof mining pollution in the Northwest Miramichi River System, NewBrunswick, Canada. Int. Revl _ges. H,.-rdrob'iol .. 5.7: 39-74.
Blum, J.L. 1956. The ecology of river algae. Bot. Rev. 22:291-341.
Boesch, D.F. 1977. Application of numerical classification in ecologicalinvestigations of water pollution. United States EnvironmentalProtection Agency. EPA-600/3-77-033. Office of Research andDevelopment, Corvallis, Oregon.
Burlington, R.F. 1962. Quantitative biological assessment of pollution.J. Water Pollute Control Fed. 34: 179-183.
Butcher, R.W. 1946. Studies on the algae of rivers VI. The algal growthincer ta i n high1y ca -I car'eous s t reams. " J. Ecol. 33: 268-283 .
Cairns, J. Jr., G.R. Lanza, and B.C. Parker. 1972. Pollution relatedstructural and functional changes in aquatic communities withemphasis on freshwater algae and protozoa. Proc. Acad. Natur. Sci.Phila. 124: 79-127.
Cairns, J., R.L. Kaesler and R. Patrick. 1970. Occurrence and distribution of diatoms and other algae in the upper Potomac River.Notulae Naturae n. 436.
Clifford, H.T. and W. Stephenson. 1975. An introduction to numericalclassification. Academic Press, New York.
Collins, G.B. and C.J. Weber. 1978. Phycoperiphyton (algae) as indicatorsof water qua'iity. Trans. Amer. Micros. Soc. 97: 36-43.
Cummins, K.tv. 1975. The ecology of running vJaters; theory and practice.pp. 277-;293 ,in O.B. Baker, \~.B. Jackson, B.L. Prater eds. SanduskyRiver Basin Symp'os-ium. Internationa'l Joint Comnriss,'ion.
Cu~nins, K.W. 1976. The use of macroinvertebrate benthos in evaluatingenvironmental damage. Pages 139-149 in Rajendza K. Sharma, JohnD. Buffington and l]allles T. ~1cFadden edS. The biologica.l significanceof environmental impa.cts. University of Michigan, Ann Arbor, Mich.
Dillard, G.E. 1970.Piedmont stream.
The benthic algal communities of a North CarolinaNova. Hedwigig 17: 9-29.
T ~11 .1 fv' .lor~ R \lISI N D N T U

Page 28
Douglas, B. 1958. The ecology of the attached diatoms and other algae'in a small stony stream. J. Ecol. 46: 295-322.
Hend 1ey, N. 1. 1974.gathered diatoms.
The permanganate method for cleaning freshlyMicroscopy 32: 423-426.
Herricks, E.E. and V.O. Stanh6ltz. 1976. Predicting the environmentalimpact of mine drainage on stream biology. Trans A.S:A.E. 1976:271-274.
Hutchinson, T.C. 1973. Comparative studies of the toxicity of heavymetals to phytoplankton and their synergistic interactions.Water Poll. Res .. Canada 8: 68-90
Hynes H.B.N. 1970. The ecology of running \\faters. University ofToronto Press, Toronto. 555 pp.
Johnson, M.J.Superior.
Unpublished. Periphyton of the north shore area of LakeMinnesota Pollution Control Agency. St. Paul, Minn.
Lorenzen, C.J. 1967. Determination of chlorophyll and pheopigments:spectrophotometric equations. Limnol .. Oceanogr. 12:343··346.
Lowe, R.L. 1974. Environmental requirements and pollution toleranceof freshwater diatoms. United States Environmental ProtectionAgency. EPA-670/4-74-005. Office of Research and Development,
. Cincinnati, Ohio.
Mack, B. 1953. Zur algen and Pilzflora des Liesingsbaches. Wett. LebenSonderh. 2: 139-149.
l~oore, J.W. 1-972. Composition and structure of alga-' communities in atributary stream of Lake Ontario. Can. J. Bot. 50: 1663-1674.
Patrick, R. 1967. The effect of invasion rate, species pool, and size ofan area on the structu \"e of the di atorn communi ty. Proc. na tl. Acad.
Sci. 58: 1335-1342.
Patrick, R. 1968. The structure of diatom communities in similarecological conditions. Amer. Natur. 102: 173-183.
Patrick, R. 1973. Use of algae, especially diatoms, in the assessment ofv~ater quality. Pages 76-·95 in J. Cairns, Jr. a"nd fe.L. Dickson, eds.Biological methods for the assessment of \"Iater quality.
Patrick, R. 1975. O"iatoms as bioassay organisms. Pages 139-151 in G.E.Glass, ed. Bioassay techniques and environmental chemistry. AnnArbor Science Publ., Ann Arbor, Mich.

Page 29
Patrick, R. 1977. Ecology of freshwater diatoms and diatom communities.Pages 2840332 in D. Werner, ed. The biology of diatoms. Univ. of .Calif. Press, Berkeley, Calif.
Patrick, R. 1978. Effects of trace metals in the aquatic eco~ystem.
Amer. Scientist 66: 185-191.
Peters, J.C., R.C. Ball and H.R. Kevern. 1968. An evaluation of artificial substrates for measuring periphyton production. MichiganState Univ. Red Cedar River Series, Tech. Report #1. Instituteof Water Research, East Lansing, Mich.
Peterson, J.B. 1943.' Some halobion spectra (diatoms). D. Kgl. Dansk.Vidensk Selsk., Biol. Medd. 17: 1-95.
Potter, I.C., D. Cannon and J.W. Moore. 1975. The ecology of algae inthe Moruga River, Australia. Hydrobiologia 47 (3-4): 415-430.
Regional Copper-Nickel Study. 1977. Aquatic Biology Operations Manual.Minnesota Environmental Quality Board, St. Paul, Minn.
Regional Copper-Nickel Study. 1978a. Erie Mining Study. MinnesotaEnvironmental Quality Board. St. Paul, Minn.
Regional Copper-Nickel Study. 1978b. Stream order. Minnesota Environmental Qu'ality Board. St. Paul, Minn.
Regional Copper-Nickel Study. 1978c. Water quality. Minnesota Environmental Quality Board~ St. Paul, Minn.'
Shennan, B.J. and H.J. Phinney. 1971. Benthic algal communities of the~.'letol ius River. J. . Phycol. 7(4): 269-273.
Sneath, P.H.A. and R.R. Sokal. 1973. Numerical taxonomy. The principlesand practice of numerical classification. Freeman, San Francisco.
Stockner, J.G. and F.A.J. Annstrong. 1971.mental Lakes Area, northwestern Ontario.28: 215-229.
Periphyton of the ExperiJ. Fish. Res. Bd. Can.
UNESCO. 1966. Monographs on oceanographic methodology. 1. Determinationof photosynthetic pigments in sea water. UNESCO, Paris.
\~ate}~s, T.F., 1961. Notes on the chlorophyll method of estimating thephotosynthetic capacity of stream periphyton. Limnol. Oceanogr.486-488.
Weber, C.I. 1973. Biological field and laboratory methods for measuringthe quality of surface waters and effluents. United States Environmental Protection I\gency. EPA--670/4-73-001. Office of Researchand Development, Cincinnati, Ohio.

Page 30
~~et ze1, R. G. 197 5. Pr i rna ry produc t ion. Pages 230 - 247 i n t~. A.~vhitton, ed . Ri ve r Ecology . Un i v. 0 f Cal if. Pres s ,Ber ke1ey, Cal if.
Whitton, B.A. 1975 Algae. Pages 81-105 in B. A. Whitton, ed. RiverEcology. University of Calif. Press-:--Berkeley, Calif.
n N D N T LJ

Page 31
Appendix 1. Diatom species found in the Study Area.
Table 1. Distribution of diatOTIl taxa in Study Area watersheds.
Table 2. Species of the pooled genera: .Q.)rrnbella) Helosira,Navicula, Nitzschia, Pinnularia, and·Syn~dra.

1]JJ
r
-z»-<oJJ
0)r-'ii_
c....
-'I
-~
~
»L
JJ
:0
<co
zo
z
~i
..

Tilhl .. I. tllfltrlhlJtlon nf rlilltnm tnxrI in Study Arl'!1
(conte
L
-0OJ
(,Q
CD
WW
o
o.
·0
Whitelac.e_ -Cloquet.~~
II'
o
Emba_r.o
St. Louis Partr.
o
1
II .
I
..
WATERSHED
~IJ
,
o.
1.
. 1
I)'
.(1
I T~ Bea<TA.Y.A _~~HBER Range Fall Shagawa Kawish Island Isabel. Filson Birch D\!!l.ka----S.-tPny..
1IC~~'~TW~5 SUBLIEY!5 V. CRISSA 2q
A\.Ip~rPlE'IJQA sp. Jij
IWPH!PltUPI p(LLUCIDA Ji
A"'P"'r.Pa. 50'"'", 32
I~PHOAA cr"E'EFCA~JS 3:3
.~PHO"1 I)v"'LIS 34
I~PH0AA OYILIS V. APFINIS 3s
I~PHOAA PERPuslLLI 37
.1l .... n'lll!"lE:n'l~ i~ SP III 38
'~CYD[r~'IS SE~l.NS 39
I~OHOEn~E1S SERliN! v. ACUT1 4 0
INo~nEn4E1S SEAI.~5 v. IPICULA iii
I~OWOEo~EIS SER!.~S V. B~ICHYS "'2
l~owoEn~ElS vITRE' 4]
'~O-OEO~E1S IELLEN~IS .....
.5TEAln~ELLI FORMOSA 46
ITTHE11 ZIC HARIISl Ie
CIL'H,E!'; SPa 119
CILONErS IWPHIS~IENI 50
C'LONErS P'CIllU~ 5i
CAVJ'.EI·<; lE"IS!! S2
CAlO'ElS VENTRICnSI 5:;
CALO\EIS VENTRICOSI v. TAUNC,T 54
CILONEIS VENr~!COSI v. SU~UNDU 55
CILa~EIS V[NT~ICnsa ~. MINUT4 51',
CApPiOGPA~A CPUCICULA 5q
COCCO""IS SP. 60
COCCO'I":IS DI"XNUiA 61
COCCO~EIS PL"CENiUL- 6<,
COCCO~"I5 PLACENTULA V. EUGLYP 6)
COCCO'lf'!S PLICENTULA v. LHH:n 64
COCCONEIS PEDICULUS 6 5
('((LOTELlA SP. ~ 6e
JJ
zo
,~
-0
JJ
JJ
c
-1
<
oJJ
z»JJ
-1
mr
>
z-1
c

'T~hlp 1. Di"trlhlltlon of diatom LIXil in St\ldy Area IJ.1tersheds (l~prC8ent,
(contc. )
ITAXAT~~ J~!BER----
Range Fal,l Shagawa KawishBearIsland Isabel.
WATERSHED
Filson Bircht.'hi te
~Jnka Stony St. Louis Parer. Ember. face_---Cloquet ___
L
:0mr
L»JJ-<
:0).">
-I
C/)COJC-
1""'\.)....1
-4-4
>
JJ
:0
<(n
o
z-1
If"-'"-
CYCLOT~lLA c.~. bNrlGUA
CfCLOTrll l 800·~lc·
CTClOTtLll CO~PTi
CYCL0TElli GLO~E~.T.
CYCLOTELLI GLO~£PAT. v. A~GUST
C7 Cl0TElLI ~UTZINGI.~A Vo RAo!
C'CLOTELlA ME~EGH!~I.NI
CYCLOT~LLA STElliGERA
CY"~ElL' SPa
CE,',TlCI)ll Sp.
OUIT IC"L~ I:LEGAN'>
N.'liICllla fE-,vIs
OI.aTOUA SP.
cl,To"", ,l"CEPS
DI.TO~. ELONG'TU~
01~TO"A HlELI/'LE
OTITO~. ~iE~.lE v. HESOOO~
orAio""" TE~UE
OI.I.TC1"1 TE'WE V. ELONGATV'"
01110"11 IIVlG,~,QE:
"11T0 N I VULGIRE v. BREvE C.F.
DIPLONF:1~ <;p.
D!PLO~El<; ELLIPrtCk
DIPLO~~IS FIN~ICI
DIPLO~EIS OCULlr.
DIPlONETS OVAL!S
DlPLO'iE1S puELUI Col".
DIPLO~~TS S~!THII
EI,TO"(J"E 15 sp.
ENTO"U'iE I S ORNA T"
E:PITHE"'U 5P.
EPITkE",rl snQEli
EU'lOT U SP.
!l-;
10
i'j
72
7)
14
15
11
BO
110
HI
112
113
114
115
11t
111
118
119
12n
121
122
123
124
125
1 2 5
'127
12A
130
13i
132
13)
135 1.
l'
'\
.1
o
'0
. 1
. 0
ii
,1
~
o
!II
~
c
o
-0OJtoCD
W.+::=0

1"I,J,. I. Dfn.rrlf>llrlnn
(conte. )
dl.1tnrn t,"H1 ill :;r'ldy ArC';J wrH
TAXA
fI TAXAj r,r'fBER--------_......
::tange Fall
WATERSHED
Bear
Shagawa Kawish Island Isabel. Filson Birch ~~~ka~tonvWhite
St. Louis Part~J?~.face__Cloquet~
Xl
z
fI..I~·T I A Ar:JC\!$
(lJ',.Jq~ C'uovATA
EU~OTI CUPvATA v. CAPITATA
Ev,·ona 01'100'<
EU',OT!! EL~GA"S
EU,,0T!A l:.JlGUA
EV'.OT!A rA8A
EV~0TIA FLEIU0S.
EU""T!A Fno"lCA
13",
13,~
13'1
14ii
1 ~ 1
142
H3
14 4;
1'''5
'r!
o
1
e t
-0OJ
t.OroW<J1
::tJ-<o:0
-l
'4-I
:0
JJ
zo
z
c
Ev',:); Ii r,.,CI SA
EV';OTlA P:::cTlruUS V. V[NTRIoS
EU~OTI LAPPONICA
(UNOT!A Mn,r.10~
EU~JTIA NlFGELlII
EV~OTII PECTINALlS
EL~OTtl PECTl~IL15 V. MINn~
Ev·{lT!. PPA["'l'IOC1 C.F.
EV~OTI& PRAEPUPTA
(VNIiTIA PPAEPuPTa V. Bl0E~5
EVt.I)T!A PJ:t.E"'vPT~ 'I. M!t~OP
(U\OTIA PAAEoVPTA ~. INFLITA
fVNnTl1 SrPTE~TRIO~ILIS
EU~I)TI& RoSTELLATA
El",OTIA SUEC!A
(VNOTl. SEq"'j V. DIADEM.
Eu~OT!1 TIUTO~ENsIS
E'.IIJOTlA TE~.ELLA
EIj,.C TI A V u,HEvRO(J!
EV,<OTIA \lAtl~EUHCKIT v. b,TE"'.. e:rPaG!La O !£ SP.
FoaGllAP!a ~!CAPiTATA
FpaG1lAO!A 8qEVl~TqIArA
FoaG!LAO!a 8R~YIS;P!ATA v. CAP
1"6
1"1
H13
156
1 5 1
15 2
15)
IS"
1 5 5
156
IS,
15F)
1Sq
161
162
11:>3
164
IE,s
f 6 7
16/3
16<;;
170
171
11'2
,
0,
<l .0
0'
0,
I)
l;

1.,1,1<'· 1. Iil,itrflJ1lt!or1 of dlntlJm t:IYi1 1n Stllrly
(conte.\ -1 TAL'··
J NUl-lEER------------'
l'
. 1
WATERSHED
0'
\ 1
.~ 0
Bear WhiteShagawa Kawish Island Isabel. Filson Birch DuQka Stony St. Louis Partr. Embar. fac~loquet 'V
OJ<.0CD
WOJ
Fall
o .
Range
17J
174
leI
182
175
17",
171
1711
119
186
TX':A
rPlGIl!OI~ P~EV!~T~;ATA V. IN~
I''''IGIUP!A !fJrLATA
Fo~SILiPI CAPU(!N&
fPiG!lAOIA CONSTQJCTA
F~AG!llqIA Pl~~ITI V. STAICTi
FP~GILaoIA CCNSTouENS
rPG!LAoTIA CONSTouENS v. HIR"D
FRASIL~QrA CO~3ToUENS v. PU~lL
FRI~lllol. CONSTPUENS v. VE~TE
FRIGItAO!' CROTO~E~51S»_.~
~j
z
::0
r
--< rp~GILAP!A LEPTOST&UQO~ 18:!1
o rRaGllAPll LEPTO~TAUkON v. DUB 1B4 1 .
JJ
/"'-,~
OJf_
r~AGll!OII PINNAT.
FRIGILAq!1 pIN~ITl V. LANCETTU
FR~GIL&Rl~ Pl~~ITI V. !NTERCFO
,PIGllholl VAUCHEoll
FRiGlllo!l v'uCH~oll v. CIPITE
rRAr.Il~~I~ VIRESENS
r~IGll~RII Vl PESEN$ v. CAPtTAT
18S
18(,
16 ')'
1813
18'1
190
I'll
.0
o
o
-4
--!
-;::z":::::,.,
»,-:a
rp~GILIOI. PARAS!TICI
F~IJSTULlA C;p.
FNUSTULll PHOP~OIOES
I'PUSTULIA PHo~80IOES v. CAPITA
rpuSTUlIA PHO~B?tDES v. SAlONI
r-PuSTULIA PHOM80tDES V. VIP.toU
FPuSTVLIA ~EINHOLDII
00"'P,.0"'<:". SO.
GO~oHO~'''ft AoIC.TU~
192
19 3
19 4
19'5
196
197
198
199
200
-0
o
,0
O'
:0 GOpPHO~EMA ilCUH!NATUM 201 1 .
GOMPHON~Wl 'CU"IN.TU~ v. cnpnN 202
< COMPHONE"! ACUMINATUM V. CLIVU 20::; I)
GOt·,OHO'JfMA ACU"'lr.ITUIJ Y. PIJStL 204
GO~PHON(~I AFfINE 205 i I)
",/
o '\
a:~:"
-~
c

1;,1,1,· 1. nl'1trlhtlt!of\ of dIatom !il)(i] In r;!IIr!y ArPA wllternltPdH (l"'prefH·nt.
(conte
WATERSHED
Bear White.. I Range Fa~l Shagawa Kawish Island Isabel. Filson Birch Dunka Stony St. Louis Partr. Embar. face Cloquet '
o
'\.
1.
'0
';"
1
.0
1 .
,0
.0
1 .
~
i .
l
o
II
',Ol
..(1
(l
o
-0OJtoroW-......J

T;lh1,. 1. Dldrfhqtinn of ,(int(Jm "aXil in ~';t\lrly Arpfl. wnternhpoa
(conte ..
fI
TAXANl..r~tBER
._-----------". -
1J:0
T/\.XA
l.dvlCUl! 5".
?<-EIOIV~ SP.
~;E 1')!J"" l.ICit'INt:
hEIOlv w lalnlS v. I~PLIAT~~
l";E!D!Ut.~ '=!!SULCA70~
~(IO!u"" Gaaclll V. IE~vALE
2~;>
331
33;:>
333
334
336
Range Fall
\?ATERSHED
BearShagawa Kawish Island Isabel. Filson Birch ~a Stonv
T>i'hi teSt. Louis Partr. EmbaL.-J.ac.~--Cloquet--.
vOJ
<..QCD
WCO
_....,.~
>-;i"~
"')'...Ji
-<o,JJ:r>-i
L
()-1
~
»(-
JJ
:JJ
<
zo
z--1
c
~EIOIU"" ~EacrNYCUM C.F.
~£rOluw &Frl~E V. lONG1CEPS
~·EiOlu'" II'll)lS
p.l T"5C1-I1 ASp.
OPEP",l)a~ I'A>lTy!
Pl""'JLlaIA SP.,
PlEU D'J5IG,,1 Sp.
PHIlOsnL£NIA SP.
~HICI)5p\olEhll CU~v~TA
1::l:'HOOAl,..,r,lA SP.
P~1P~L1nll GIBBA
sTH:aS,,:::IS SP.
S'lIUHI)'.EIS ICUH.
51,uaONEIS INCEPS
5TIUHO~ElS INCEP! v. GRACILIS
STAugO~f!S INCEPS v. LINEARIS
STIUP0~EIS K"IEGEal
STt,UPO'iEIS IG'JORATA
Si.QlH:;O'lEIS PI-'OOi[C":NTEqOM
ST.vaO~~IS PHOENICENTEROM V. G
STAUPOIJE:lS SH!TH!I
STAI!P!)',>! 5 'SMY jK11 v. INCtSA
STE"nPT£gOI'lIA So.
STENnPTEuORII INTE~MEutA
STEPHANnDl$CUS SP.
STE?"A~OnyscuS .~TPE.
SiEPHAN0DZSCUS ASTREA V. MIN-VT,
331
3 4 0
34)
;:J4:!
J8(l
3 9 0
426
42~
43 2
433
434
435
.. 36
437 •
4313
439
440
442
1,43
444
·HS
446
447
448
41,<;
~SO Jj
- - . . . 0
. 1
'0
1 1
'1
1 1 1 1 1 1 1 1
€I
"0
~ C \)
0
o
II
I)
\
...

Table 1. DJ.
(con.tc. .. )
~bution of diatom taxa in Study Area watersheds (l=present, O=absent)
-r TAXATAX.A ..f~J:1BER
u
r
~~
>JJ-<'0:0»
5T[O~I~~Dr~cUS INY1SrTITU!
Si:?Ht~~)tscus N!GAPAE
5TfP~I~~Dl~CUS TENUIS
sur..;lOELLA 5-1".
5u~lPELL~ A~GUSTA!TUMI
SUO!PEllA ELE~ANS
SUC!QELl~ rELICaTlSS!MA
SUqTptllA n!O'1>o1A
~uwIPEllA llNEARIS
SUP]PElL£ nVAL1s
5U Q IQELL'\ nVATIl
liSt!
453
4S4
~55
.. 56
"Sr458
459
460
I,/;>1
46 2
Range Fall
WATERSHED
BearShagaw8 Kawish Island Isabel. Filson Birch Du~
1 .
Stonv St. Louis Partr. Embar.White(ac.e Cloquet._-.
,
vOJ
LOroW1..0
~-1
"..
~--
c.......
-f
»c...
JJ
JJ
<
zo
z
-l
c
SUPIPELlA OVATA v. PINNAlA
SUP!PELlA ULNA
sn.f'Of!A SPa
TA8fLlIQlll SPa
TA?ElLAQIA FENESTRATA
TI8~LlAq!A FlOCCVL~SA
J; 6 :l
464
46 5
~93
4, 9 4
_49!!j
'-
L1
1 -1
o. 1
..

Page 40
"
Table 2. Specles ;of the pooled genera: ~ymbella, Melosira, Navicula,
Nitzschi~, Pinnularia, and Synedra.
CY~8ELLA ~~JTIUSCULA
:; '1l3 EL ~ L\ ~ F F I,~ I .)CVMclLLLA A~~USTATA
CY>h3[LLA ~\SJ[>U\
~; y ',1 ~ l::- L LA' C:: SAT I 1 C F.f;Cr :1] [L L {\ ' CIS TUL :j
Cy ,·\3 t: L LAC I STU L ~.\ \f... l~.~ :E~ 1',:Y~J[LLA CJS~lJATA
Cy ,'1' t1 ELL ,:i. ~~ '( ,'iLl 1 F 0;\ i"1 I SC'{ ;"1 dEl. L I~ L, '( :--1 J l F ~-J-<. i1 I S \/ 6 i ~ J \j P J \j
CYHt3 ~ L LA CJ I LUVI .~~ r~ A.C. Yrv1 J E. LL A tl ::: 3 .<-.l- J I C ,i',. C. F "CY 1'·1 J ELL A r1:: T E "< J F' L t.. U::: A V" S J L3 ~ JCY~8ELLA l~AEOUOL1S
:.: Y'/\ ~H:, LLA L fI:.. E. Ij 1 S::;YM2;i.lLA LJ'JATA:Y~b~LLA ~IC~OCEPHALA
CYJE3 t LLA iH i'llJ J A:::; y ,'11) ELL A ,i I \j U1 A~YrlB£LLA MINJTA \/" rSlUDOS~ACl
:;V',1DElLrl j'vlINUTA V SlLESIA·C{~
CYMbELLA NA~ICJLIFORMlS
C'l'i18ELL[\ F'=<'JS1~L\TH V L\\iE~SHJ,LJI
CYHBtL L r~ F ~ IJ :)( .L 1'1 t\ C F
:~ y :,1 3 ELL i\ SI i\l J AT:\
CY~JtLL~ SJaA QUALlSCY1 ] ELL J,\ f;;:' 1 A 1-1 :.; UL U !'1:; Y 1"1 Qi.::. L L A 1 J "1 I DACY t) [L LA 1J :,.ll. UU'- A C" t:
CY.'1 d l L l fI:.. 1 J ~:~ .:; .L UUL A
Vi t-=: L (,1 S 1 h: .4 j...·l '3 I GJ J\
1'1 f LSI '<, i\ ~\ ~:; rIC .:.\IV) [-. L US 1 ~ A u I ::; T ~l, ,~ s~ I[ L ,J S ~. <2\ l) 1 :..; T I~ ,\j.~ V.ll L P 1 C; r: ~ 1\
"1 c.l U ~ J. ~,~ ~ . L,,", \~ ~, L 1\ T r\r'j~·. JS1:~[1. G<J\t~UL.;4TA ~/1iJ /\iHjUSTIS
• l'vl-~ L J :) 1 <i\ 1:; _. A 1\1::; .L iJ A\1 L 0 ~ 1. A .: r I\' L J .• C ,:\>~ _LJ S 1. -~ L\ 1. r t2I L. I :; f\ V T:-\1 UISS I ...141"\ ::. L ] S ~ f\ V[~ -< 1/\ N ~~
PRELl IN BY DAFT N D N u

Page 41
Table 2 (contd~)
~~L\VICULA A3S0LUTA~AJILULA A~~8MJOA
NL\VJCUl_l\ t\\'E:~.LCI-\dt\
~AVICLLA A1Prl:aULA\J Lj V1[, UL A ~,~ Ii E(,I SISN,\ II leuL 1\ ,L\ T J ~1 USNA vIC UL A lJ, ~ :; 1 L L. U i"10l AVj, C LJ L ~\ '3 ICE r) ~'l ~\L. ANAVICUL~ 0~YO?rlILA
\):'.\V.lCULA CL\i~ALIS
t\j:'.\vICUL.A Ll\PII ATt\Nl\VICULA'(n~ITATA
N~\ v1. CJ LA' ,l..; i-h1 I TMTA V ~ J :\~ LL\ .~ I CL~
~;y \j leU L ~~ 0 ) :; :; u 1\1 i~ ~ F ~:..~' ; I S,\jell) I CUL. '/\
N,~ II I c; UL I~
N-~\VICULL\
.'-U~IJICUL~\
\jL\JICUL ..'\NL\\llCULA~JA'JICU~_A
N~\/ICUL.A
\j~V1CLJLt.\
NAJICULAt,1 AVleu L 1-\
NAJICULA'~L~VICULJ4
\l4JICULi\hl;\'JICGLA\jAvICULA.\lI-\JiCLJLL\'H\vICULI~
\JI~JILUL ..\~~[.\VICULA
:\~AVI CUt.:\~\l F\ J I CLJ L A\li~JlCL'LA
N(. J 1 CUL I~
;\j,J.VI ULi"\\J ... 'J .L l. UL. iJ,
'J i~ Ii 1 CGL ~\
1\1;'\ \jl =:ULi\
."JI~JLCULi~
(" t-\ V .L Cl; L. 4
\l!\'JJl~v' I~
G]'JT-NT~\
CJ~T~\llA J lCfPSC<Y ;; Toe t. P H t\ L ;\CJ:)i):LO~TA
GJ :) .J 1. J .'~ T A v" .L\ >1 U1 ~ U£\L~~J.)SIS
uI;;NI-\L l... :; i I') E r·~ SISt::. _ v l.~ E \~ SIS V J L I~ TCi,
t_~INE~SlS v. NlG~ECJ
L _ ~ I 1'1 ~~ ;1 '':; 1 S V. t'. GS T R ~\, TLX I ~ UA~(IGU~ v~ CA IT~TA
() ~ S T -< J'1'~~I\CILF
l.;'~t.Gr.l,=(IA C .. F"L. '( S I :; ,~::. I\~ SIShL\SSIACAt U >.j ::; -< Jet,HJ:) Tc_ Ji I~i.. '~ J r: F Lr:" i=- iJ SL ~ t. VJ. S '3 I ;~
L !J. .\~ ~: ~. J L P. T L\l L\ TEO PUt· Il.~ T L\ T [\
h c .~ I :::; C~JL. us \/. Ut ::; ~\ LIt...
1.\1 l' 0,
1':.1. .~ U :::; lJ L f\t1JTIC~~\
:. J T I A V" '~ 0 H~! 1 1i< J 1 ,I ~P L\ f,l J ',I~, I~ ~~
\J:\JiCU i\ f\~L_L.==;U OS,fJ,\i 'J 1 CU ~_ A !;1 i\ C ~.J T~
~~V1CULA ~~jl ArTA\i L VI L.. U L. :\ :; L \J LJ ],.) C U -I J FJ ,lIS
PF~ F~ J\ F T T rVI/-\. R Fi IS NO NT U

ct\~)ITATA
ELLI~'TI::A
iiUTATAR[LTAN~JLl\~
Page 42
Table 2 (contd.)
\j A 1/ I CLJ L' L\ PJ FJ U:.. ANI~v~CULA PJPULANAvICULA ~JPJLA V~
~4V~CUL4 ~J~U~~ VNAVICULA ~J?ULA \I.NAJICULA PJPULA J\l~ \/ i CUL f\ I'" ll. J lOS i~\
1\1 AVIC UL i~ ,~L~ JIG S r-\ V" P /\ ? VA\jAVIGuLA r<~JI':JS~ \/" 1[\lf:-.LL4N~JICULA ~YNCHOCEPH~LA
f\! i~ V1. CUL:4 . f--: -~ YNlJ d (j L,; E P HAL A V<l G:::: ~;\J (, \/ : C ~J L ~. AL I >1 i~ .' U '~l
\10 I) 1. l L: L I-~ ~ ~ L 1 l1, ,U 1 V.. I, j 1 E:("1 JN~~lLU_A S~1~JEJE~1 J~ ~S~~M3i
i\::'.VICULI\ S:::~:~t:T:\ V" 1~:)ICUbAT/.l.
,\!'f\VICUL.1J. ~,:::C:"FA
\j L, Ii 1=L; L L\ ~' :=: \: E'\1
;\) 2t, v leuL 1\ S:. ,>1 I !\J.U L U (-1~AVICULA S:::MINULUM v. HUST~OTI
NAVICUL_A SIiiIl..ISI~ ~\ VleUL A J~)"
\j l1, VI CLI L:\ :) J 3 F A-3 CI ATAr: "f III
~AVICUll\ SJJrlAMULATANAVICULA SJ]TILlSSIM~
NAVleUL A TA~J r UL I~
\jAVICULl\ T:::~EL_OIJES
NAvICULA T~I?~NCTATA
NAVICULA VI~IOULA
~AVICULA VI~IGULA
rl AVleU A \j I - I GUL r~ V !~ ~ GU:~ E:;~ S I0J I~ V'l CUL J~ VI -', I UUL ), V ill l- I i, C. ~\ ~ I SN4J~LU_A vI~IJJLA J. OST~LL~T
1< i\ 'J ICU:..,r\ vJ il, L L tI C C. i
N.C TZ 50 C~J I ~\ Li. ~; C0 :'\ :'10 DAT J~
NITL~CHIH ~"::ICJL.A:'\IS
~lTZSCHIA l\SICULA?IS v. AF~ICA
\J 1 TL S !..: H1 ~\ ~:: J::JNlTLSCYIA l\~PrlIJIA
f'lITZ3C'{It~ L\f\I~US'l/~\TJ-\
\J I r z S( HI t\ 3 I~ G;'\ r ;\~lrZSLHIA ~ ~IT LL~TA
1,IITZSL,lLLA ::;l-I~LJSll
\J I TZ SL -I I ,L: ::; 0,'1. ,I J r'l I S1';1 TZSl,Hlh ::;u,'1 JT11\\nrZ~CH A :::;J'J-l:,I~
\lJ.1 Z SCH 1\ ::; <Y 1 GC i) H AL~ I~
~lTZSC~IA : F (PALAES~A)
~jIT!..SCHI/~ J.L=; I i~TA
t'd TZS CHI /\ P I t J HYrIC A
PR lIVllN FiY DR U JeT f\~A R R V N D i\~ u

Page 43
Table 2 (contd.)
'J.i T2::>C HI I~
NITZSCHlf4NI TLSCrllf-,\j~TZSLHIA
'.J TZSLHLt\~,jI TLSCHIAtJITZSC-Ilt:.'H TZSCHIA\jITL~CHli4
I'.dTiSGHlf:Ni TZ SC ...lI f\~ J.L T1. S I~ H I ~\.
til: TZ~C-lI~\
;>.j 'T l ~ Crl L A\i':- TLSC-iI~\\t l' TZ S CHI I~
;'1 1. l L :) LHI II'JITZ~0HII'\
Nl TZSCHli.\NI TZSC>iIANITZSCHIA\1112 SC:-U A'JITZSCrlIAN-I 1Z SCHIA.\1 I T l S LHI f:\\!lTZSCHIA~I TZSC~ilA
\!lTZSCHIA
~ XJl. A \1 A T A C F G
=ASCICULAT~\
r .L L. 1 F 0"( 11 I SrUNTIGULAF .< Us T LJ L U :1
=~USTULU~ Ii. PE~MI~J
=~JSTULU~ ~. SUJSALI:; I~ ACI L 1 S-1 (, .~; Z :.) C HI J\ \'i!-i
I:;NG,~/\Tp> C"F"<J TZ I '! S I t\ NA_J:\ltA IS'1I"~LJSJULh
JJ TUS,;\JI·\_FA
:;Zt_ C I A~J:1ANI\
S 1':; H\3IGI"~OlJr:!'\
3INUATA v. TA8~LLA~1~
S PIC J LU1'·1311\b\JOF\Ui\1S~J JL I UE AKISSJdTILIST -<.Jt·) I CAT" Y6L TO ;~t:LL iJ,r ~. y.~~ L ION EII A .V.~ .J 1 GTIi I. VAX
J1 t:--:::TI~·I/.\L1S
:3 [) E. ~ LISJ. .~~ AJ \1 I'\ I'~ f'i U! i Iv I~ '1 P r: J. G:::. f-) Ii
J::-( VICUST6.TA:; .~ LI J ;~ 1 (~
1..)1\ '> l'y USDIllE. GtNSFO H1Cl\C;c.\lT J:LI~')
I\Jrt.·~h 0 H
PI:H·I UL ~ ~ 1 API .\J;,jUL A <1;~
::> .I. N ~, l) L i-\ ~~ 1 f.:.
F) I ,\I rj J L L\ ,~1 i·1
P1 ;\~ iJ UL A ~~ 1 ~
f~j 1 ~\H;UL ~~l /\;:.~ I \! i'~ UL [\ ":. I ~.
[J.L t.j i~U :J.~:L 1\
t"J ]. I\HHJ L i~ .< I Al>HHJLC\I/\
r) 1. :~ I', U L /\ 1. (',
:... 1 ~. l LJ l. Cl .~ I 1-'
::J.~i~i' ULA:<lP .L ~l >·1 UL r... ~ 1. ;.,
} I~IHJL. ('! (I i l
f-' 1\1,; UL l\ ~~ I·,
P I ;'d'; Ll L l\Z 1 t,lllijUl/:\ lr~
Pll~i,;u [\<.If,;:l J I'~ : ~ U L [;,), fI
A:3 t\ J J ENS I ~::;
:J, 8 AJ j 1\ S 1:; V ..~\ J j J J E \1 S I.) IiL\ 3 ~\ U j (.:. i~ S1~) 1/"D, c.( 0 ') P r'{ {\ t: .-< 3. Af.I.J E \1 \) leu l J', T ~\,
:~ 1~; t:: ," S
I.. I ;.j LA'~J ~ T......,SUOU\l
LI IN FiY DF~ T u F': ~r 'r Fi Fi VIS! N N T

Page 44
Table 2 (contd.)
,:--;Ii~NLJL.A~lrl, LATEvITtYAT/\ V. JO>11;:l 1 !HHJ L A '<, 1 A 1'\ A1 J ~
PINNULA~IA ~cSOLEPTA
::> I :'J N 0 L_ A~, I A ,'1 ESOL t, PTA J" r, ~ -; US T:' I ,J, I U L L\~'~ 1. t'l I .; r< 'J Sl AJ :.: J '1 C" F ,.P.!:f4i~ULA -~l /\ :10:<MOi~O:,(U>I'
:J ,'J ~.! UL. A~.i H >~ J ;) 0 .~~ AF1 q i\l Uc. iL<' I I~ ,( J TT t'l E k I:;111.1·~)Li4~11-i ~T,E-:TJ::~~\~HF
F) I ;~:l UL A~~ 1 A S J J. C ~ PIT AT~P 11'.1f'! UL ~;U ~'~ :.; U~! ~ i~ PIT .~ T D, V Fl AU ::? :~ l'j U L A .~ I:' ;; ~J ~ S (~t·; t~ T CP ,-I 'J :< A
P':'I~I,;ULt\-:;,J. t: 1 C:(~,Yi.i T 1: h:J =.: ~ .~ U L I r-. VI \, I ',',II ~
:> IN;, UL, t.\ ~ li~j I ' . I 1 S J" "11 r·; J ~
S'y :~ L_ 0 r=, ~\ ACT 1 NAST ;< I 0 DESSY!J=,~) A I~CJS
S Y,\H:: ;:h.k ~"::A -j 1= E;; d ~\ L P ~ <l F "Sy r4[ [j i;, A A !", ~ rl I C; EPHAL 1-\ Ii" AUS T -.? i ACL\SYHEDF~A CAJITt\TASy t' U::. Ui'~ A C Y=L.. 0 PJ "1SY~£ORA U~_IC~TISSIM~
S y ;"j ~ [J I':, A 0 t _ 1. CJ\ TIS S I I ~ AJ I) A..~ GU-SSY~~U~A OL~~~A{AE C.F.S YNl Ur')~ f L_ I F 0 ~ i'H S V., EXI LISSY I'~ C. 0 re A i ~l ~ i S~
S y :~ E lJ 1', ~\ M1. \j J SCUL ASy .~ [ Dt'< A N i\ \j I~
SY··jELrd\ Fl\·(I~SlT1CI'J.
SY iL::-: C/- ~ A F 1-\ ~ A S1 T J. C f\ \1 SUUC0 I'rS T -< leT A~. y I'~ L u=< A t.J U ~ ::: :1 c_l. L }.:,S 'l' ~h, D('-' ~\ . FJ U_' ri L L ~ t\ 1/ I) L ~\ CL f\:, T ~
S y \~ t. U £~ ~ (, J I ~\f'-1 SS y ,'.~ C 0 ~•. r~ ~ U \J P E:,1 SS)' ,\j U;- ,A r. I,) :1 p r:: \J S IJ F.f~ I L ~; !~ -< 1 ~~
S )' I~ C, U[. C\ U vI F c j'i S v F i ~ ,.; ,; 1 L :'F~ 0 i Cl~; Y>E LJ [\ 1,;-\ P t: ;\: 3 V S 'J: TIC 1\ C F~Y\I U"A ~)C=JA
:- y "I' LJ ,('., T L\J " ~ (\~) Y' ..1 LJ I, A U L ~ '-\S y r'~~' UI • A U L \I,~ v C (J 1\1 T I-~ [, CT ;\S y "J (~ l) r, I~ J L \J (.\ Ii ,< (~ ,\t:. ~;
F( '\{ D c:- r'- C' T .J R VI N 0 N"--' r: "J

Page 45
Appendix 2. Cluster analysis of quantitative diatom data.
Figure 1. Dendrogram of diatoms collected quantitativelyin May, 1976. Original data matrix was editedat the 5%.level of relative abundance beforeclustering.
Figure 2. Dendrogram of diatoms collected quantitativelyin August, 1976. Original data matrix wasedited at the 5% level of relative abundancebefore clustering.
Figure 3. .Dend rogram of diatoms collec ted quanti ta tivelyin late-September, 1976. Original data matrixwas edited at the 5% level of relative abundancebefore clustering.
Figure 4. Dendrogram of diatoms collected quantitativelyin May, 1977. Original data matrix was editedat the 5% level of relative abundance beforeclustering.
Figure 5. Dendrogram of diatoms collected quantitativelyin late-July, 1977. Original data matrix wasedited at the 5% level of relative abundancebefore clustering.
Figure 6. Dendrogram of diatoms collected quantitativelyin August, 1977. Original data matrix wasedited at the 5% level of relative abundancebefore clustering.
NARY Dr=~ u ~j CT T R V(Si I\J D N T lJ

-0,JJ
Figure 1. Dendrogram of diatoms co~lected quantitatively in May, 1976. Original datamatrix was edited at the 5% level of relative abundance before clustering
VOJtoCD
~(J')
~...;.\
L
5i1I,Ll-------------,1
pS I j
SR3 ~ I Il.--.J IBll ~l ,-K8
H3 -L------rl------,j"
FlRei I IK2
PI !~Ll ~--l 1 I
~~l I I I IE1J:
- i :.-.:
','")
..j:.~:}
~~<-x-
:i~
~tl.:::~
'~~$~:~
8:;
.25.5.75Station
(J
:0-<
L-
eel
-1
$:»(..AO
JJ
<
z
z
c

1]
.JJ
Figure 2. Dendrogram of diatoms collected quantitatively in mid-August, 1976. Original datamatrix was edited at the 5% level of relative abundance before clustering.
-0OJlOro+:::0""'-.l
"
s.
l--
.25.5.75
r---!- ----------'-I PI J;I !IC;L 1 -L-I 1---------- ---., /i
IBBl jf=t.1---LJ' :;,:..':. *~,I~i -E--:J-
1 =. j iIif1 1 I }] I \1
II ~~3 _L-
1
I ::: I I~].P2 I I - itI K2 ' "x I. Bll JL-------------r---------------~---.J! KS -! j :'
I~P'~i '
Station
-1
JJ
JJ
ifl'i!!
".............,.
-j
::'lJ-<o
<(j)
7'
o
zl~

Figure 3. Dendrogram of diatoms collected quantitatively in late-September, 1976. Original datamatrix was edited at the 5% level of relative abundance before clustering.
-0p;
lOCD
+::>co
r
z""';~";:J-~
JJ-<
•
'~ ;,
>:'
Ir
J= .. i -l·------ . 75
i D1 _I ojISL1D.; ..;; 33
Ip 2 - :-1 1,' :: . ,
nUl I ;::::; IDLl .,...J I .,', r--------I~i -1 I }, t: IIFl _l -ISL3 J~-__--------_.L_--'KCl ] -- ~--~--r,.".", I=========~=====~- ----T--
J£\.1 :,I~~ .r============:============1 IIsiG ..j_ IIBll
iK8 ~C~===------..:...--=JJ
c:
11
!-~~
L
:1>
JJ
<
zo
z

vOJ
LOCD
+:>1..0
r-Figure 4. Dendrogram' of diatoms collected quantitatively in May, 1977.
Original data matrix was edited at the 5% level of relative abundance before clustering.
z<.")
»--I
r-·L........
.6 .5 .4
P28L1K1Pl8L2
-;'::
~ ! I,,; I I I I
~= 1 ~ I I ~ I
hi..... ~1 . I Ii f"--1__! 1= ;~:
JJ
JJ
C-_
.-'". ~;".\"""",
0)
zo
z
-1

T1
z
::J
~:p
Figure 5. Dendrogram of diatoms collected quantitatively in late-July, 1977.Original data matrix was edited at the 5% level of relative abundance before clustering.
vOJtoCD
<.J1o
.. 75 .5 .'25
.:-;
l::~
rt
~
~
JJ
JJ
<co
z
c:
;.-:
':i

:0
I
?
"TI_v
Figure 6. Dendrogram of diatoms collected quantitatively in August, 1977.Original data matrix was edited at the 5% level of relative ab~ndance before clustering.
v0>
LO(1)
u-,--'
-4
-1
-1
c_
JJ
zo
z
.75 .5
ISL2h ~ IIHi =t--g: $; ] I~J_----,Il.~ ~ -: I I 1' ' ~.
K~ J I; IPI I ;.:::: I
~l ]. I ;;;::; !
~ R.3 -! :.::i~K2!·····
-~i'------------------_;--------_ i ~
.25
x:~" ,,;..)
~)
:j:f

]J
~
'-?<::....
"'*"'4""U
:JJJ
5:
JJ
IJ
~ #' .....
;2:
o
""",,'.c:_
-I
c
Table 1. leriphyton sampling intensity.
CHLOROPHYLL CELL COUNTS ~PECIES PROp·. COUNTS QUALITATIVESTATION DESIGNATION YEAR
A B r> A B C A B C A B Cv
Primary 1976 6 3 6 6 3 5 6 3 5,., 6 3..)
1977 6 3 6 0 0 0 6 3. 3 2 14 2
Secondary 1976 6 3 6 6 3 3 6 3 3 3 18 2
1977 6 3 6 0 0 0 3 3 3 2 14 2
Tertiary 1976 0 0 0 0 0 0 0 0 0 2 18 2
1977 0 0 0 0 0 0 0 0 0 2 14 2
Primary (SCS) 1976 0 0 0 0 0 0 b 0 0 0 0 0
1977 3 3 3 0 0 0 3 3 2 2 14 2
Secondary (SCS) 1976 0 0 0 .0 0 .0 0 0 0 0 0 0
1977 0 0 0 0 0 0 0 0 0 2 14 2
A. Number of scheduled sample periods.
B. Colonization period (weeks).
C. Number sample sets analyzed.
".:
VOJ~
CD
U'1N

Page 53
Table 2. Mean number of blue-green, green and diatomcells per mm2 of glass slide artificial substrateand percent diatom cells observed in 1976.
Site Blue-green Green Diatoms % Diatom
BB-5 25 32 1068 95
KC-1 24 48 638 90
F-l 42 38 Lf58 85
P-5 34 35 1875 96
BI-l 188 162 3471 91
D--1 55 35 1115 93
E-l 17 Ll3 153 72
SL-3 78 331 667 62
K-1 139 150 860 75
P-1 21 12 1891 98
P-2 106 312 1764 81
SL-1 20 17 2255 98
SR-3 281 53 1761 84
K-1 96 650 2924 80
K-5 119 20 1990 93
K-3 65 13 1385 95
x 73 131 1339 87
"i\'1'1ean for sampling periods Hay, August and late September, 1976
j\ T 1\11 f\. I \! nT

Page 54
Table 3. Number of taxa identified and the numberof samples collected within each watershed.
Watershed It Specie.s Found It Samples Taken
Range 24 1
Fall 78 12
Shagawa 65 10
Km.Jishhvi 93 24
Isabella 87 23
Filson 67 8
Birch 130 48
Dunka 80 18
Stony 97 38
St. Louis 79 27
Partridge 104 45
Embarrass 84 19
Hhiteface 64 4
Cloquet 30 2
FT T R r~E N D N

TABLE 4. Dominance values CD) and frequency of occurrence (F) for diatom speciescollected qualitatively. -- '.. ':"
"'0eutoCD
JJ }I'l/ In 76 L Sept 76 Fb/Mr 77 Ap/Hy 77 Aug 77(J1(J1
V"'::'CA D F D F D F D F D FC:s: Achnanthes lanceolata v. dubia 0 17 0 3 0 I 1.5 9 0 33-- --- IZ i.\..... lirh2aris 13.8 90 1.8 65 0 I 11. 8 85 19.8 93
I> A. linearis v. curta 1.7 31 0 6 0 , 0 32 0 44JJ I
A. linc1.ris 'I:. pusilla 0 69 a 13 a I 2.2 74 15.1 88-< Ia 0 0 a I a 47 a 510 I
67.2 100 53.2 100 83.3 I 62.5 100 95.3 Ina.),J
,> a 17 3.7 71 a , a 9 0 23,
tU vitcea a 66 3.7 58 a I a 65 2.3 47I
-\ fornosa 1.7 31 1. 2· 23 a I a 6 a 9,en Cocconcis placentula v. lineata 0 38 a 35 0 I 0 63 5.2 63
I
~'~C~:~:~~~n~~~:eLuta 0 31 a 16 0 I a 11 a 14I1.7 21 a 32 '0 , 0 37 2.3 37
'"- ,0 34 8.1 34 0 , 0 44 0 74,
() 0 0 1.2 97 0 I 0 0 0 0I-I , 4.3 100 3.7 97 0 , 5.2 0 0 0I-I 0 100 0 97 0 (::1 0 88 2.3 100r-., W........J 1.7 0 0 0 0 Z 0 0 0 0H
~ 10.3 52 1.2 13 25 ~ 13.2 41 0 16)::- 0 62 0 42 0 w 0 50 0 63'::.- H
Cunoti~ "pcctinalis v. minor 0 0 0 16 0 w 1.7 24 0 370 (::1
JJ E:unotia spp. 2.6 66 8.1 69 0H
8.8 50 10.5 98Fragilaria ~pucina 0 10 5.0 13 8.3 0 0 29 0 23
JJ construens 0 76 5.0 61 0 l' 0 32I
< construens v. pumilia 0 24 0 3 0 , 2.2 68 7.0 91I- F .. construens v. venter 0 79 8.1 48 0 I 7.4 68 6.4 91GO I- F. crotonensis 0 0 12.4 52 0 I 0 18 0 14a - I
F. 10.3 79 3.2 42 0 , 16.9 65 26.2 95Z ,
1:' • 10.3 79 4.0 39 16.7 I 2.2 56 0 56,0 F. virescens 0 3 0 0 0 I .7 32 0 160 I
Fragilaria spp. 0 0 21.1 52 0 I 0 59 0 40I,c,:, GO~D t-i2nema an'2;usta t u..rn 0 76 0 42 50 , 7.4 76 a 700 I
Q..:.- cl~-v'ei_ 0 0 0 0 0 I 0 27 0 51-l I
Q..:.- 91i·t.",1r('oides 0 a 0 0 0 I 0 a 0 00
,G ~ LJ::i~\~t.11lL..~ 0 52 0 84 0 , 0 68 0 77
C,
f.0rllDb,:nl2I:.2 spp, 0 0 0 0 I 0 41 0 37~:::~ I
>1 e 10 S-.iJ:.a. ZY" 3 n11 1 aJ:...a I 1.5 88 0 0-\ . 7.8 83 5.6 84 0 I

TABLE 4. continued
vOJ
(,Q
CD
U10'1
Ny In 76 L Sept 76 Fb lvir 77 Ap My 77 Aug 77n f n Ii' D F D F D F
0 82 2.5 84 0 I 0 88 5.2 98I
a 34 0 13 0 I 9.6 41 0 28I
2.6 97 5.0 100 a I 0 0 0 0I
a 0 1.2 100 0 I a 0 0 0I
0 a 0 0 0 I 1.5 a 0 aI
0 100 a 100 0 I .7 91 11. 1 97.7I
a 0 a 10 0 I a 15 .6 17I
1.7 100 0 0 0 I 2.2 91.2 a 0I
0 0 2.5 100 0 I~ 0 a 0 0I
0 0 5.0 100 a 0 0 0 a 0>L1
a 100 0 97 0 z 0 91 3 5 1H
0 62 0 58 0 ~ 0 50 0 610 0 0 0 0 >L1 7.4 N.C. a aE-<a 100 a a 0 >L1 2.9 100 0 a00 0 2.5 100 25 E-< 13.2 0 0 00 0 0 0 0 0 9.6 N.C. 0 0:z;
11.2 100 2.4 100 a I 2.2 0 0 0I
a 100 1.2 100 a I a a a aI
1.7 100 a a a I .7 100 0 0I
17.2 100 2.4 100 16.7 I n.8 a a 0I
a 100 a 100 a I a 100 22.7 98I
9.5 79 1.6 65 24 I 5.2 79 2.9 72I
31 90 3.2 58 a I 34.6 91 18.6 95I
~'~ .. kutzingiana
s. Ininuscula
~. s~crcta v. apiculata
~l. palea
~[€l 3i::2 spp.~er dio~ circulare~dV cula cryptocephala
S. r2ci~E1S-----~ ~2pens
~ rump ens v. familiarisS. tenura-----
~13.\· i cula spp.;J e i J hm s pp •~itzschia acicularis
______ spp.spp.
~~~phicephala
S .delicatissima
-=--e.::-c:..:::.:::....::... ;3 PP •Tabellaria fenestratah floccu 1osa
-!oSo>c-oJJ
JJm<
_1
-l
~,~ ~~
(0
CCDc.._m
-(
z~ ~. r~Jl3Sa
:IJ,).'>
o
r
-c:0
(J)
oz
N.C. not calculated
oozo-j
oIC
oI~

TABLE 5. Dominance values (D) and frequency of occurrence (F) for diatoms species collectedquantitatively
--;JPJ
<.0(D
tTl'-J
-0 Ny Jun 76 L Jly 76 Ma Aug 76 E Sept 76 L Sept 76 L Hay 77 L Jly 77 Aug 77JJ Tc'L'\A D F D F D F D F D F D F D F D F
r- 6:chns'Ll:thes 12nceolata 0 41.2 0 42.9 0 60. 0 66.7 0 40 0 9. l' 0 8.3 0 0~- .l<-. lir:c:lr i...o-':.. 4.4 29.4 17.9 100 13.3 80 33 100 15.0 73.3 0 63.6 a 75 a 72.7Z At J-i:1g~ri_~ ~v. pusilla 30.9 82.4 35.7 71.4 36.7 93.3 a 33.3 a 60 0 36.4 39.6 83.3 45.5 90.9"'"t-,.,.;;..-
6-,,- Llj_'}ut--,-~~~im2 91.2 100 53.5 100 66.7 100 95.8 100 91. 6 100 56.8 100 58.3 100 70.5 90.9-r"""l..A./
-< pellucida a 35.3 0 42.9 0 53.3 a 83.3 1.7 60 a a 0 8.3 a 36.4
0::ol2rions a 5.9 0 57.1 0 20.0 0 66.7 0 0 0 0 0 16.7 0 0
JJ A.""itre:L. 4.4 82.4 0 71.4 0 86.7 0 66.7 0 86.7 0 54.5 0 41.7 0 45.5GQc::...c-'.:me:LB... 121acentula ·V. lineata 13.2 58.8 50.0 100 46.7 80 42 83.3 10 80 0 9.1 27 66.7 45.5 81.8
"T1 C>cl.Q.t.::::] 1.?-... spp. 4.4 35.3 0 71.4 0 40.0 0 66.7 1.7 80 a 27.3 a 16.7 0 27.3-:1
CY'::...'J c·lla... spp. 5.9 94.1 a 85.7 0 9~.3 a 100 5.0 86.7 a 100 2.1 91.7 0 81.8(j)
Di'2c'Y~'3_ ti'rru~ v.. elongatum 0 29.4 a 28.6 a 13.3 0 16.7 a 6.7 47.7 100 0 66.7 0 36.4C
~';':ioti~:L sp 4.4 100 10.7 71.4 11. 7 93.3 0 50 0 66.7 a 0 0 41.6 a 63.6tf" E.:LJ~::-,LlJ r -i a £..QJ1..5-...tJ:.11 e 11 S 1.5 47 10.7 57.1 1.7 80 0 33.3 3.3 80 0 18.2 0 0 0 a
L r:..c..D..SJ:J:.l.l2.Dii. v. p..J..lcin"L 0 a 0 14.3 a a 0 16.7 0 0 0 63.6 2.1 58.3 4.5 63.6
-1L LQlJ.s...t 111 F' f1 C; v. :LeJ1.t.f'J:... 0 41.2 3.6 28.6 0 60 0 16.7 6.7 60 0 36.4 '0 33.3 0 36.4L .e..:t::..QJ:J.JJ..0n.::-;c; 0 70.6 0 28.6 0 40 0 50 0 40 0 36.4 0 16.7 0 18.2
-'I E...~ ]]" nn'J l2... 0 47.1 0 28.6 0 46.7 0 50 0 46.7 0 9.1 0 25 0 27.30
F .. :L:1~lcr.G"ria 0 Ld .2 0 14.3 0 66.7 0 83.3 3.3 26.7 6.8 100 0 83.3 0 63.6~ .E.L2.:::il2.r:....i....a... s pp . 0 17.6 0 71.4 0 26.7 0 50 8.3 53.3 0 ~5.5 0 50 0 36.4»
G..QL-:'pl:~'2..k.f Gila...c....1..1.T1 ina t..1Jill.. 0 41.2 0 57.1 0 60 0 100 0 73.3 0 81.8 0 50 0 36.4::....·0 G-L .at.F i n e.. 1.5 11.8 0 0 0 0 0 16.7 0 0 0 0 0 50 0 9.1:0 S_ BLt~:l,LS-t.JJ:Jd."'R 8.8 64.7 0 71. 4 3.3 73.3 0 83.3 0 66.7 18.2 81.8 20.8 83.3 15.9 63.6
JJ G...... .c.le~Le..i. 0 0 0 14.3 0 6.7 0 33.3 0 0 6.8 18.2 6.3 50 0 36.4m G-..- :.- ,- 3 C i 1 ,,, 0 23.5 0 0 0 6.7 0 0 0 6.7 0 63.6 0 58.3 0 36.4< ~ :2 r Ll.l.1Dldi 0 0 0 0 0 0 0 0 0 6.7 0 54.5 0 25 0 27.3-
.G- -IL:L.1:u.l.u.rrL. 2.9 100 14.3 71.4 0 93.3 8.3 100 11.7 93.3 0 54.6 14.6 83.3 4.5 90.9- G('I0',~hi-l-nOTTl~ spp. 5.9 41.2 0 57.1 0 60 0 100 0 73.3 o· 81.8 0 50 0 36.40Z '\ i '" 1 r~ "'.i:r:..a. s PP• 4.4 88.2 10.7 71.4 6.7 73.3 16.7 66.7 10 73.3 0 54.5 0 42 0 45.5
0 F'1-"''-'''1.''l. spp. 0 88.2 0 85.7 0 33.3 8.3 100 8.3 100 0 72.7 0 75 0 63.6
0 'Ij t~:3,...hia spp. 7.4 82.4 7.1 85.7 10.0 93.3 8.3 100 48.3 100 0 90.9 0 75 0 90.9
Z.s~-"l;or1-.., spp. 16.2 9ff.l 0 85.7 0 100 4.2 100 16.7 100 56.8 100 31.3 91.6 25.0 90.9
0I~hojl)Li2 Fcno~trar~ 'J 70.6 0 71.4 0 46.7 0 50 0 53.3 0 63.6 2.1 41.7 0 45.5
"""';1 .I.- [1 0,..... ,--r11 n..:::~ 10.3 70.6 0 71.4 5.0 60 0 33.3 0 66.7 9.1 81.8 6.3 58.3 2.3 63.6"0
c0-

-aJJ
:-
zTaole 6. Hean relative abundance of dominant diatom taxa. lvleans are caJculated for ~,lay, August, and late-Se~tember, 1976,
and May, late-July, and August. IS77.
-0OJtoro
U1co
"'--:-...,..;.--
S TAT ION _~~~_ ~ .~ ~ _Id order 3rd ord-.e.'-'--r_-.- -,--___:__
KC-l P-!:i 81-1 0-1 [-1 SL-2 \ SL-3
137 -- 0.03 0 0 U 0.13 0 0.27 U -- 0 I U.~7 --Y7 -- 0.97 0.47 0.2 0 0.13 0.03 4.1 0.13 -- 2.25 I 4.G7 --43 -- 4.3 5.33 27.1~ 12.6 1.~ 4.~J 9.17 18.73 -- 2S.US 1'd.33 -37 -- 54,13 27.63 26.27 0.2 63.83 67.4 36.5 10.63 -- 6U.Y 32.U~ --U3 -- U.<:! 0.U7 \ 0.73 U U.23 U.03 3.1 U -- U U.'d3--73 -- 1.67 0.2 0.37 0 2.u3 1.'d3 0.53 0 -- 0.2 1.4 --03 -- 0.03 16.9 I 4.43133.4 0.13 U 5.97 4.13 -- 1.3 0.07--47 -- 0.1 0 1.2 0 4.07 0.U3 0.37 U -- 0 U.23--57 -- 2.7 2.7 U.53 0.2 ,1.b7 1.9 1.17 O.~3 -- O.!:i 2.37--
-- 1.13 13.77 0 0 U.57 5.S3 0 4.93 -- 0.1 0 --43 -- U.b7 1.17 1.37 0.13 1.43 0.07 1.U 1.47 -- 0 2.23--3 -- 1.43 0.4 U.23 0 0.1 0.43 U.47 0.2 -- 0.4 3.e3--97 -- 1.1 U I 4.33 0 G.67 0.07 U.a 0 -- 0 U.07--
-- 0 U.4 0 0 0 U.3 U U.43 -- 0.2 0 --63 -- 1.U7 0.13 5.53 U 1.4 0.47 U.2 U -- 0 0 --23 -- U.16 0.47 U.U3 0.2 1.33 U.U7 u.33 1.~3 -- U.1 0.03--47 -- U.3 0.13 U.37 0 I U 0.17 2.4 U.4 -- 0.4 U.2 --
-- 0 u 0 0 i U U u U -- 0 U --17 -- 1.73 U.9 13.93 0 II U.43 0.47 0.13 23.b -- 0.3 5.1 --
-- 0 U U 0 U U.13 U U -- 0 U ---- 0.1 0.u7 U U.2 U U U U -- U.4 U --
4- -- 2.1 U.43 \ 0.e7 0 i 1.33 !J.l7 1.. 33 U.67 -- 0.9 L.b7--~ -- U.67 U.13 1.27 U : 1,77 U.13 U.SJ U -- 0.1 2.47--6 -- 3.63 0.47 I ~.Y3 U I ~.Y U.~7 'd.7~ u.t.! 1-- U.3 2.77--43 -- 5.~7 1.27 3.67 0 I 7.Y U.27 Ib.Y, 1.13 -- u.6 S.'d3--~r -- 7.~7 21.i)3 4.U~ 0.2 L.~ 1U.. 7? 3.;3 2Y.43 -- t..? 3.17--/3 -- 0.2 U U.43 U U.3 U.43 U.2 U -- U.L U.97--4 -- 1.137 1.87 2.u7 U I U.37 ~.77 U.17 0.U3 -- 3.U 1.2 --
I
lo:;t order r 2n88-1 I F-l
. .mi s::' ima
TA.':<P-Ach nthe lanceolataA. near sA. near s v. pusilla
0.27 -- 2.4 -- U.1.'07 -- 4.'d -- U.3.U3 -- 2.4 -- 5.
4Y.b3 -- 31.77 -- 26.0.43 -- U -- U.1.17 -- 1.'03 -- 1.2.2 -- U.U3 -- U.u.t.7 -- 1.13 -- 2.3.Y -- 1.73 -- 1.2.23 -- U -- 01.77 -- 5.3 -- 6.U.U3 -- 0 -- 2.2.2 -- 4.17 -- 4.U -- U -- U
G.Y -- 1.Y3 -- 1.U.17 -- 3.U6 -- O.U.4 -- 0.3 -- O.
U -- U -- 01.U7 -- 1.3 -- 1.u -- U -- UU -- U -- 0
2.3 -- 1.U -- 1.1'\el:Jsira sp • U.C57 -- !::J.Y7 -- 9.
icul so. 4.2 -- 2.3 -- 2.itzschi s p. b.4 -- 4.3 -- 3.
00. ~.27 -- 2.Y7 -- 3.lar ii' fenestrata U.47 -- 2.2, ::1 1~'
T. flocculosa 1.'d7 -- j.U~.
eura pel1ucidaAnomaecneis vitreaCocccneis placentula
lotc::lla spp.1a spp.
ato~a tenue v. elongatumEunotia spp.
ilaria spp.F. construen sF. co~struens v. pumilaF. construens v. venterF. auch f2riae'':'omphonema spp.G. <3.ffi neG. angustatumG. cleveili. qrurlmdi'..J. oatvul um
o-;7
"'-
<m
o
z.,....,l ..i-j
-4
!l-4
o
-j
JJo
oc
(/)
c
O'j
o-,.,.4·1..)
~J
o
:0
~»'--
L

STATION, --- 4th order' . I 1 5th order I
K-2 \ P-1 I P-2 I SL-l [ SR-1 ! SR-2 I SR-3 K-1 K-5 ! K-~ I
_!J
rs;:-pL..
-<o.../•..J)~
':")
Crr'1
C-ill
~
--2o~
>C-
OJJ
:0m<cr.)
oL.
oozo--!
o,-\_-
o-1
Table 6. Continued
1" r\ '/ (\l/-'l.)\t\
Achn nthe lanceolataA. 1 near sp\. 1 near s v~ pusilla
nutissimdipi2ura pellucida
Anonoeoneis vitreaCocconeis placentula
atell a spp.1a spp
Di ato!na tenue v. e10ngatumEunotia s;JP.,Fragilaria spp.F. co::struensF. construens v. pumilaF. const~uens v. venterF. v2.ucheriaeliomphonema spp.G. affineG. angustatumb. cleveiG. gruno\f/iiI~. parvul urn1'\ e los ira s pi\la icula s p
tzschia pp.spp
1arl a fenestrataT. f1occulosa
i 3.03 U U.3 0.07 U 0 0.03 0 0 -- 1-- 0 0.3 U 0.U3 U I U.b~ u.1 U.2\ 4.~ 0 0.3 0.4 1.43 1.25 0.63' 0.u7 U -- ,-- 0.2. 26.7 U.37 U.4 O.L 0.1 U.b5 1.7I U.U3' U U.U7 0.1 11.3 3U.65 4.6 26.2 15.6 -- -- 3.7S 1.77 1.4 19.77 U.b5 ~5.4 26.7 1.~5
9.97 U.4::; '07.3 4S,'.93 54.U3 34.U5 176'0,7 51.6 'I 72.U -- -- 36<2 22.47 15.2 31.::17 3.45 111.35 23.~5 2Y.~U 0 U.3 0.U7 U.L 0 0.03 0 0 -- -- 0 1.77 U U 0 10.05 0 Uo 0 0.33 0.47 U.13 0.2 0.67 0.23 1.9 -- -- 0.05 3.B7 0.7 U.13 0 i O.uS 0.2 0.65
14~.43 9B.b5 .23 16.~~ 12U.37 4.0 3.e3 7.U7 0 -- --0 _ G.?3 0 19.1~ 2.b 124.~5 2U.~S O.~S1.7 U 0 U.U3 0 '0.1 0.17 0 0 -- -- 0.U5 U.37 0 I U.13 O.US I 0 U.2 U.2l.b U 4.77 2.~ 0.27 U.7 0.5 0.7 0.7 -- -- 1.1 2.27 0.77 I 0.7 0.15 0.4 U.S 0.55o U.2 U.13 1.43 0 b.l 0 0.5 0.3 -- -- 14.1 U 3.27 0 1.45 0 0.1 2.25
U.23 U 0.07 0.03 0.4 0.1 0.47 0.07 0.4 -- -- 0 b.1 U.13 U.13 0 U.95 U.1 0.U5U.7 0 U.27 U 0.63 0 0 U 0 -- -- 0.55 3.S3 U.4 0.03 0.55 0.2 U.l 0u.7 U 1.U U 0.2 0 0.37 0.03 0 -- -- U U.4 U 0.2 0 G.U5 U U.5o U 0 0.27 U 0 0 0.53 0 -- -- 0.15 U 3.77 U O.US U u.s U
1.b3 0.1 0 0.1 U 0.2 U.13 U.U3 0 -- -- 0 u.03 U.B7 U.1 0 0 U U0.33 u.l U.U3 1.43 0.03 O.B 0.67 0.4 U -- -- 5.L 1.13 U.b 1.S 6.15 0.U5 2.35 U.b2.57 U 0.37 U.27 0.2 0 1.S7 0.u3 1.7 -- -- 0.9 2.0 U.07 0.47 U.35 0.2 U UU 0 0 0 U 0 U 0.1 0 -- -- U 0.27 U U 0.U5 0 0 2.05
2.Ll U U.13 1~.37 0.1 U 0.57 U.4 U -- -- U.B 1.57 U.57 1.5 35.75 U.j 3.U 1U.3u U U 0.~7 0 0 0.33 5.7 0 -- -- 3.1 U U 0 Y.L 0 2.4 UU U U U U U U U.U3 0 -- -- 0.2 U 0.9 U 0.35 0 3.45 U
2.3 0 1.2 U.~ 3.U 0.75 3.U3 4.U 4.4 -- -- 9.0 U.17 1.43 5.77 9.b5 1.35 5.7 27.451.U3 U.2 U.u3 U.2 U U 0.U3 0 0.3 -- -- U 1:~ U.27 5.57 2.95 U.YS 0.75 5.U54.d U.1 2.73 2.9 U.77 U.2 0.33 U.U7 0.7 -- -- U.2 3.d3 0.2 1.4 0.4 U.l 0.2 U.25b.~3 0.1 4.43 2.73 2.73 0.7 2.S3 U.l U.3 -- -- 0.~5 5.67 U.57 2.67 U.b u.3 U.S 1.25L.b U 2.76 3.9 3.57 15.9 2.67 1.23 0.9 -- -- 17.6 3.~ 5b.73 1.9 15.15 U.75 5.1 1U.1U.l U U 0.07 U U.4 0 0 U -- D.bb O.S? 0.7 2.7 5.1 1.2 1.45 1.150.03 U 0.b3 U.2 U 1.25 0 0.03 U -- -- 3.55 1.23 10.d U U U.2 U.5 l U.25
o0.17U.37
14.c.7
~:~3 iU.lLJ.U31. c.37.2U.U3
Uu
0.530.132.53U.17
U11. 971.2U.034.U31.77U.17 iu. cU
49.73U.77O.Y
""1:Jp;
<.!:lroC'1\.0

Page 60
r'
Table 7. Annual mean percent relative abundance ofdominant t~xi collected quantitatively.
--IAL<J.jXAc.t.-' ]_,9_7_6 1_9_7_7 _
Achnanthes lanceolataA. linearisA. linearis var. EusillaA. minutissima
A"0phipleura pellucidaAnomoeoneis vitreaC~C'~ 0 n e-:rs-pl acen t ulaCyclot_e)la sp p.C~~lla spp.Diatoma ten~ val'. elongatumEunotia, sPp.Fragilaria, sPp.F. construensF. construens var. pumilIaF. construe~s var. ventenF. vancheriaeGornphonena spp.G. affine- ----Q. allgustaturr~
G. cleveiG. .grunm"iiG. ,paryulumMelosira spp~
Navicula spp.Nitzschia spp.SY~1eQr a sPp.Tabellaris fenestrata------T. flocculosa
0.523.1310.6940.960.511.098.2Lf0.731. 610.391.70.771.27a0.860,,580.800.172.150.020.013.622.220.394.663.630.781.73
o. 01.0.4411.1827.990.010.3118.250.04] .a14.330.280.220.010.510.151.590.210.016.651.620.402.740.460.410.7316.430.691.86
Fi L IN u T VISI N 0 N u

Page 61
Table 8. Number of stations Vlhere dominant taxa reachtheir peak abundance during each sampling period.Taxa must also comprise at least 2 percent ofsample to be considered at peak abundance.
~Month1976 ksl 1977
Taxa l'fY JY A E-S l-J -JY A
Achnantpes l' - . 1 2 4 3 5 1 0 1_lne,q r].s1L. linearis v. 12usi lla 9 3 Lf 0 0 0 5 5~ -L1nceolrrt.a 0 0 3 0 1 0 0 0A.. ~1liDJ1 ..ti.~i.D:lE. 8 0 2 2 6 4 5 3Amp..b_ip_Leru:.a p..ell1-lCida 0 0 0 0 3 0 0 0Anomoeoneis vitrea 1 1 3 1 3 2 0 0GQ.ccQQ..~iE J!.la_Cf'Il 1'111 a 0 3 5 1 1 0 2 8Cyclotella spp. 1 0 0 0 4 0 0 0c;.;~lla spp. 6 2 1 1 2 3 1 1IlJ-at.oma_ ~~nue v. elongatum 2 0 0 0 0 9 0 0Eunotia spp, 3 3 4 0 0 0 0 2Frag i1...a1'ia ~0Il:..s t ruens_ 3 1 2 0 2 0 0 0F. construens v. pumila 0 1 0 0 0 0 1 0f.... construens v. venter 1 1 2 0 2 0 0 0F. vaucheriae 2 0 2 1 2 2 3 1Fragilaria spp. 1 0 0 0 4 0 0 0G0l11Bll 0 nema spp. 2 1 1 2 1 0 0 0G. angl1statum 5 1 1 0 1 1 3 2G. clevei 0 0 0 1 0 0 4 2-----G. gUl1O\vii 0 0 0 0 0 0 1 1G. par\~ulum 6 1 1 0 6 0 3 3G. affine 1 0 0 0 0 0 0 0Helosira spp. 0 3 2 1 4 0 1 1Navicula spp. 3 0 1 3 8 0 1 0Ni t z schiel spp. 0 0 2 3 12 0 1 1.§..ynedra spp. 6 0 3 1 6 9 2 0TaheLlari.~_ fene:=;tra~~~ 4 0 0 1 1 1 -2 0I... tJ.o~~ulosa 5 1 1 1 0 3 2 0
D U ,J Iv'j A J lSI N D hI

Page 62
Table 9. Species diversity (Ip1i 2 ) of diatomcommunities colonizing glass slides at primaryand secondary stations.
Site M A L-S x M L-JY A x
P-1 1.4 2.2 3.0 2.2 1.9 3.3 5.0 3.4
BB-·1 Lf • 6 2.9 4.1 3.9
BI-1 2.7 2.2 10.2 5.0 1.4 1.4
SR-3 4.0 1.9 12.9 6.3 2.0 2.5 3.5 2.7
S1,-3/2 3.3 '9.0 5.8 6.0 1.5 2.4 2.0
P-5 3.2 2.7 3.5 3.1 2.5 2.8 3.4 2.9
K-5 1.8 2.7 2.3 6.4 3.4 Lf • 9
K-2 5.5 1.4 7.5 4.8 1.04 1.01 1.0
F-1 10.1 7.4 5.0 705
KC-1 9.98 8.0 6.1 8.0
SL-1 1.27 2 0[~3 1.62 1.8 1.45 3.31 3.29 2.7
E-1 2.19 7.4 1.76 3.8 2.0 2. [1 5.8 3.4
D-1 3.59 2.43 1.60 2.5 3.88 1,,5 1.65 2.4
SR-1/2 1. 83 2.07 3.00 2.3 4.8 3.2 4.0
P-2 1.74 2.97 2.71 2.5 3. [,- 2.2 2.8
K-1 2.50 4.79 5.3 4.2 2.,97 7.52 5.3
K-8 4. LJ,9 6.04 2.92 4.5 2.86 1.51 5.08 3.2
----------=.<,
L IN U JeT NON T

Page 63
Table 10.- SpeCi:s'diversity (l:~i2) of qualita tive diatomsamples col~e~ted in 1977.
Site Ap/Hy A
BC-l 2.32 5.73BI-1 6.97 8.12C4-1 8.-49 6.30D-l 11.62 9.35D-2 16.37 15.12D-3 8.1 Lf
DC-I 4.36E-l 11.04 4.41E-2 28.36 8.72F-1 10.06 11.44I-I 19.98 6.31K--] 9.83 2.80K-2 22.19 14.41K-5 6.86 11.08K-6 3.25 3.63K-7 3'.63 8.54K-8 5.43 6.03KC-l 3.29 9.24KC-2 2.40 5.31LJ--1 19.7LI-2 5.97LI-3 6.84N-1 3.38t-TR-l 8.75NH-1 5.40 20.42P--l 4.01 6.07P-2 9.58 4.25P-3 2.46 12.75P·-4 11./f 3 2.71P~,5 10.7 13.79SC-l 6.42 16.12SE-l 11.25SE-2 12.67 14.42SG-~ I 5.99SH--l 5.37 12.34SL-1 5.03 7.82SL--2 19.21 5',59SP-l 7.17SR-l 5.78SR--2 10.81 4.56SR-3 16.49 7.10SIZ--4 9 31 50SR-S 9.67 5.861'--1 6.96 13.23
LI Id VI N T U

Tab Ie 11. Hean anI~uaIi, chlorophyll ~ and cells /mm2
determined from samples collected on glassslide artificial substrates.
x xSites Chlorophyll a cells/mm2
BB-l 3.97 1109
KC-l 2.70 385
F-l 4.21 388
P-5 5.59 1819
BI-l 6.03 3784
D-l 4.34 1225
SL-~3 6.27 1104
K-2 8.13 1148
P-l 8.93 1923
P-2 12.66 2179
SL-l 5.29 2290
SR·· 3 3.09 2095
K-1 7.15 3669
K--5 4.86 2128
K-8 6.69 1496------------
*mean of samples collec ted in 1'1ay" mid-Augis t, andlate September, 1976.
I I T .IFf~ 1\/1 \fISl N D T U

Page 65
Table 12. Median water quality dataaveraged by stream order.
Stream Specific Total TotalOrder Conduct ( mhol/l) p ( g / Hl) N (mg/l)pH Alk. (mg/l) Ca(mg/l) Turb (NTU)
1* 18.5 90 2215 6.7 55 1L~.8 2.5
.. 2 55.5 25.7 1158.3 6.4 18 4.6 2.0
3 86.9 29.3 1109.2 6.7 36.3 8.2 2.7
4 89.3 21..7 716.2 7.0 33.2 8.6 2.7
5 50.8 18.8 612/5 6.9 18.8 6.2 1.9
II () \11 n

Page 66
"Table 13. Acidophtlous diatom taxa
found in the Study Area. 1
Achnanthes flexellaCyclotella bodanica.f. glomera taEun~i~ spp.Frustulia rhomboides-----Gomphonem~ subtileMelosira distansNavicula seminula val'. hustedtiiStauroneis .9ncep~_
Sten terobia intermediaSyneclra nanaS. tenero.- _.~-----
Tabellaria fenestrataT. flocculosa
1 Based on Lowe (1974)
T ~r' N

Page 67
Table 14. Correlation coefficientslfor comparisonsbetween strea~ order and mean percent relativeabundance of acidophilous diatoms.
Stream order vs. acidophilous diatoms.
Period 1 (Quant.) -.8
Period 1 (Qual.) -1.0
Period 4 (Quante) -.8
Period 6 (Quant.) -.8
Period 8 (Qual. ) -.5
Period 13 (Qual.) -.8
lSpearmans rank correlation test.
I ! 1111 , j I!

Page 68
Table 15. Hean annual ;', percent relative abundanceof dominant diatom taxa averaged by streamorder. Samples collected from glass slideartificial substrates in 1976.
2ndSTREAJ:vl GlIDER
3rd 4th 5th
Achnanthes lanceolata--------,."A. linearis
A. ~inearis v. pusillaA. minutissimaAmphipleur~ pellucideAnomoeoneis vitrea----------Cocconeis lacentula'----Cyclotella. spp.~clla spp.Diatoma tenue v. elongatumEunotia spp.Fragi1aria sp p.F. construensF. construens v. pumilIaF. construens v. ventaF. vaucheriaeGomphonema spp.G. affineG. angus tatumG. c1eveiG. gruno\\1ii.Q.. parvulumMelosir~ spp.Navicula sp p.Nitzschia spp.Synedra sp p.Tabellaria fenestrata------T. f1occulosa
1.12.254.0437.650.311.740.031.232.00.384.11.24·3.41o1.541.150.36o1.4o0.031.55.382.844.3313. 7 l+
1.717.11
0.172.1314 "II39.761.221.082.561.471.440.141.511.011. Lf2o1 .. 780.430.74o3.65oo1.531.514.098.343.38o,Ll-8
0.95---
0.615 .. 665.5650.310.381.1513.850.371.690.071.280.8550.45o0.300 .. 371.400.050.77oo2.350.532. 193 .. 702.730.110.32
0.290.7325.6724,,410.020.2814 .710.110.550.750.380.080.25o0.030.780.220.854.03oo11.523.860.581.414.251.680.15
* Mean of sampling periods May, August and late September, 1976.

Page 69Table 16. Percent frequency of occurrence of diatoms by stream order in April, 1977.
Taxa included have a 50% frequency of occurrence in any stream order.
STREAM ORDER
J
Achn~nthes linearis
A. linearis var. pusilla
A. linearis var. curta
A. marginu1ata
A. minutissima
Anomoeoneis serians var.brachysira
A. vitrea
Cocconeis placentula
Cyclotella spp.
Cymbella spp.
Diatoma tenue var.elonga.tUm
Eunotia spp.
E. curvata
E. diodon
E. elegans
E. incisa
E. pectinclis var. minor
E. praerupta var. inflata
Fragilaria spp.
Fragilaria capucina
F. constricta
F. construens
~. construens var.pumilIa
F. construens var.venteJ:
F. pinnata
F. vancheria
F. viresens
Frustula rhomboides
Gomphonema spp.
G. angus tatum
G. clevei
G. gruno,vii
G. parvulum
Nelosira spp.
Meridian circulare
Navicula spp.----Nitzschia spp.
Pinnularia spp.
Synedra spp.
Tabellaria fenestrata
T. flocculosa
1st
50
50
50
a100
25
25
100
25
75
25
75
50
50
50
50
50
50
25
a50.
50
50
50
oa
25
50
75
50
aa
75
75
75
75
75
75
100
100
100
2nd
83
83
17
83
100
50
67
33
83
83
17
83
83
aa
17
17
50
50
17
33
50
83
50
17
a50
100
17
17
67
100
67
83
83
33
100
83
100
3rd
100
75
42
58
100
33
75
42
42
83
25
50
58
aa
25
33
25
75
33
a42
83
67
58
42
33
42
58
75
25
8
50
100
25
100
92
75
100
75
92
4th
71
71
14
43
100
28
71
57
28
100
57
14
28
aa
14
14
28
57
28
a28
86
71
43
86
28
14
14
71
57
14
86
57
43
86
100
28
100
57
86
5th
100
80
40
20
100
20
60
20
60
100
100
20
aaa
20
aa
80
80
aa
20
40
40
100
60
aa
80
a80
80
100
a100
100
a100
100
80
PF<ELlM1NAF\Y DRAFT SUB.JECT TO MAJOR REVISION DO NOT OUOTE:

Page 70Table 17. Frequency of occurrence of diatolns by stream order in August, 1977.
Taxa in~luded have 50% frequency of occurrence in any stream order.
Achnanthes flexella
Achnanthes lanceolata var.dubia
Aclmanthes linearis
A. linearis var. pusilla
A. linearis var. curta
A. m;uginulata
A. minutissima
Amphora ovalis
Anomoeoneis vitrea
~1omoeoneis serians var.---b~sira
Asterionelia formosa
Cocconeis piacentuia
Cyciotelia meneghiniana
CycIote11a spp.
Cymbe1Ia spp.
Eunotia spp.
E. curvata
E. pectinalis
E. pectinalis var. minor
Fragilaria construens
F. construens var. pUJniIla
F. construens var. venter
F. pinnata
F. vancheria
Frustulia rhomboides
Gomphonema angus tatum
G. clevei
~ parvulum
~lelosira spp.
Meridian circulare---------
Na~icula spp.
Nitzschia spp.
Pinnularia spp.
Synedra spp.
TaheJlaria fenestrata-----
T. f locculosa
1st
a
a100
100
50
100
100
17
50
35
a50
33
83
100
100
67
50
67
17
83
83
100
17
67
67
50
67
100
67
100
100
83
100
83
100
2nd
22
22
77
89
33
56
100
11
56
33
o56
33
78
100
78
44
33
44
44
89
100
100
56
33
78
67
78
89
67
89
100
47
89
67
100
STREAN ORDER3rd
33
60
93
87
60
53
100
20
73
47
o73
40
87
100
93
80
27
33
53
93
93
100
39
20
67
47
80
100
7
100
100
87
100
80
100
4th
25
o100
88
13
25
100
63
50
63
13
50
50
38
100
87
38
a13
25
87
87
100
97
a60
50
87
100
13
100
100
38
100
38
75
5th
60
60
100
80
50
20
100
40
80
60
60
80
20
80
100
60
80
20
o20
100
80
60
100
40
80
60
80
100
o100
100
20
100
100
100
Pf-IELlMlf\l/\RY DFU\FT SUBJECT '1'0 MA,IOR REVISION DO NOT QUOTE

Page 71
Table 18. Mean number of acid-tolerant taxa, mean numberof species and species diversity found in qualitativesamples.
PR LlI'vi N/\FiY DF1AF"T U J T T

Page 72
Table -19. Diatom taxa which have a frequency of occurrencegreater than 50% within groups from qualitativecluster (Figure 16).
SITEC~O\'}l'
(Sec STHi-:gt~~_r_e_l_6_)_OC<_'O_I:_R Il..'.ll\~~"' _
COl\¥Qon
3
4
5
6
7
8
All
1 &. 2
2 <'I. 3
3,4,5
4
1,2,3
44.5
Achn,1nthes 1inenr1s7:... ll·~-;;rl s-~ar. Pt; 5 i 118
~. U1inus-!cs_~~n1.:1
Anomacnc i 5 vi treaCymb~Q.~---;pp: -fra~ilari~ construens var. ~illaF. con5t~cn5 v;~~nterI . .2InrLl !;.'!.. ---
G01:l.phon~<:!. parvulurn~~spp.
Navicula spp.Helosira spp.~.1!,edr~ spp.Tilbell~riB floceulosai~~t-;ata
Ach~ marginulata~~ pectinJlisfrustllll~ rhc~~oides
Gomph~n,c-nCl ..i1...m;ustat;~~feridion eit-culare
A. linearis val'. curtaCoceone~ J2.laecntula var. lincataEunotia pecti~alis var. minorGomphon~~ a~~tur:l --Q.. gracile
Amphora ovaHsFragilarT;-vauc heriaGompho-~~;~~~
A. laneeolata val'. dubiaAch~-;:;:the"s m:Irgil1~lat;.~f.pcco...~~ .pl_!!cen!;'y~ var. l.!..tleataF. cc.l1strUCI1Sr. ~tost~uron var. dubiaFragl.l~;-vall~he.ria-Gompi~o-;;';'~~~um
~.~~~A. flexella!;;,Jpho;;- ov~lis£ul10tl~ £u_r~;ta
Ac.:.b.n<lth..£.fc l1nC';)ili v~r• .c1c:,'el( ~~oq~e~~i~ ~trc~)
fo~c.2.np.~ £~3s:~_~~uTa val' • .li.~~£y£lot-'U_1..~ l:1.£'l..J;hi!..'....i.3!0..FI::il..& i} .1r 1.1 can ~ tru(~ns
Ira...EJJ...~u:"i; l~~c~t-:~l:on var. du~g_~hon..£..~ Z"l L.,7{';.-t---
1; Absent from thill group
p LI I\F~Y DH F u T 'I' R Fi v N 0 T T

Page 73
Table 20. Compari~on of productivity and diversityat impacted and unimpacted sites in the StudyArea. Data from 1976 sampling season.
ImpactedI
(range) Unimpacted 2 (range)Sites Sites
Mean total cells Ut/mm 2 ) 1673 (1109-2290) 1909 (385-3669)
Mean chlorophyll ~ Cmg/mm2) 5.62 (3.9-12.9) 6.18 (2.7-12.7)
.t>lean diversity 2.74 (1.8-3.9) 5.02 (2.3-6.3)
Hean number of species 59.8 (34-68) 49.4 (35-68)
I p _ 1 , SL~I, D-I, P-5, BE-I.
2K-I, K-2, K-5, K-8, SR-I, SR-3, BI-I KC-I, F-I, SL-3, P-2.
If\/1 N !=<V n T tIR.!F: 1" ·rC) r~~ .Ion F~EVI~:~! N D I''-J T U

Page 74
Table 21. Comparison of productivity and diversityat F-1, KC-I, and BB-1Data from 1976 sampling season.
F-1 KC-1 BB-1
Mean cells/mm2 380 385 11.09
.. ....)'fean chlorophyll a (mg/mm2) 4.21 2.70 3.97-
Hean diversity ~[ii2) 7.5 8.0 3.9
Number of species 49 57 4.9
DFL4 T SU .1 CT J n nEVi N D N

Page 75
Table· 22. Comparison of diatoms collected from a small creek above(Station C) and below (Stations AR and BR) a seep from
,... the INca eArploration site. Samples col~ected July 5, 1977from glass slides.
=~TIONTAXA -___
Achnanthes cleve!
A. linearis
A. linearis v. curta
A. marginulata
A. roinutissima
A. sp.
Arnphipleura pellucida
Anomoneis vitrea
Cocconeis placentula v. lineata
Cymbella minuta
Diatoma tenue v. elongatum
Eunotia arcus
E. curvata
E. curvata v. capitata
E. diodon
E. elegans
E. fallax
E. flexuosa
E naegelii
E. parallela
E pectinalis
E pectinalis v. minor
E praeminor
E praerupta
E praerupta v. bidens
E praerupta v. inflata
E rostellata
E septentrionalis
Esp.
E tenella
E vanheurckii
Fragilaria.construens v. pumila
F pinnata
F sp.
F. vaucheria
c
<1
2
<1
<1
30
<1
o<1
< 1
1
2
<1
3
o2
-0
1
<1
5
o<1
<1
o<1
<1
<1
<1
<1
7
<1
o<1
<1
<1
<1
AR
o<1
oo4
o<1
oo
<1
oo9
3
o<4
<4
7
9
<1
<1
8
<1
<1
o<1
oo6
6
, < 1
oooo
BR
o2
oo3
ooooooo
13
<1
ooo7
23
oo3
ooo
<1
<1
o14
2
oooo
<1
r=, 1.. 1 li\l ny DR T U .J A.J Fi n V I SIN D T

Page 76
Table 22. continued
-==== STATIONTAXA C AR BR-Frustulia rhornboides 1 2 2
Gornphonema angustatum 1 <1 0
G. clevei <1 0 <1
G. gracile t+ 0 0
G. grunouii 2 0 <1
G. parvulum 2 <1 <1
G. SPA <1 0 <1
Meridion circulare 1 <1 0
Navicula arvensis 0 <1 0
N. cocconeiformis <1 0 0
N. gysingensis <1 0 0
N. pupula v. rectangularis 0 <1 0
N. salinarum v. intermedia <1 0 0
N. secreta v. apiculata <1 0 0
N. seminulum 0 <1 0
N. seminululll v. hustedti <1 <1 0
N. SPA <1 0 0
N. td.punctata <1 0 0
Neidium bisulcatum <1 <1 0
Nitzschia bacata <1 0 0
N. frustulum v. subsalina <1 <1 <1
N. ignorata 0 <1 0
N. kutzingiana <1 0 0
N. linearis <1 0 0
N. paleacea 0 1 0
N. parvula <1 0 0
N. sp. 0 <1 <1
N. sublinearis <1 <1 0
Pinnularia abaujensis 0 <1 0
P. subcapitata v. paucistriata <1 0 0
P. sp. 0 <1 0
11• substornatophora 0 0 <1
Surirella sp. 0 '< 1 0
1\
v n II J \11 i () 1\1 L!

Page- 77
Table 22. continued
STATIONTAXA C AR BR
Synedra amphicephala <1 <1 0
S. minuscula 2 0 0
S. radians <1 0 0
S. rumpens <1 0 <1
S. sp. <1 0 <1
S. tenera <1 0 0
S. ulna 0 <1 0
Tabellaria fenestrata <1 8 5
T. flocculosa 20 30 23
L"I I /lltd!\D\f in 0 I::) r:: \f I (~ In f\l n (l f\! n.,,, nil

..
- I
-0OJlCro'-.ico
PS-8!OI.1P.SS
PC-CHLOROPHYL,,,
Fu-r: ,'.TO~,i (}'JANT.
SC-Sf.:DII,1:::NT COUN
LP-LE-;.r PA.CK
N NIP CREEK
NR NIRA CREEK
NW NORTH BRAt,CH
WHITEF.\,CE RIVE
P PA,RTRIDGE RIVER
SC SNAKE CREEK
SE SNAKE R:VER
SG SPRiNG CREE:<:
SH SHIVER CREEK
SL ST. LOUIS R.
SP SPHAGNUM CR.
SR STONEY RIVER
T TOIM! CREI::K
88 UNNAIJ.ED CREEK
Be BEAR CREEK
BI BEAR !SLMm CR.
ey COYOTE CREEK
D DUNKA RIVER
DC DENLEY CREEK
E EMBARRASS R.
EM U~JNAMED CREEK
(ER!E \1ININGl
F FILSON Ci'lEEK
j ISABELLA fllVER
K KAW1SHlvVj R.
KC KEELEY CREEK
LI LITTLE 1~5ELLA R.
1:422.400
STATiON CLASSIFiCATiON
BIOLOGY STREAM STATiONSS,T, STRFA' I NA' 1" I '''.~ <:; nrnE'" N' I ,-CCI..'C I.~ r... IV\- .~~~
2 KC- j/! ~)0 so ~l.~cl-..._~/ -'-, .~------"IlrE~JA"lE ~o\~, lV:re.~1~r~II-;11$"'ATI0
AND hUl,.1B(~ O;:,2LP r:: ... A 1::"rICA11';:-'~~ ':,.ASSIFICA'TIJJN
SAMPLlt'-lG T'fF'ES BY CLASS YEARit '''' d '""D-DRIFT
H-HC:STEF: - DC-.JDY
Ol-OUALIT,ATiVE
INVERTEBRATES
QP-QUALITATIVE DIATOMS
PR...,fJRIMARy
SD""SECONDAR'r
TR""TERTIARY
PC""PR1".'ARY STF1EAM Clf,SSIFIC!lTII)~~ SITE
SC""SECONDARY S1REAM CLASSIFICATION S!Y
NS.. "NOT S,"'~,1PL'::J
,A,O\ IATI~ Rlnl()~Y STRJ= At-J STP.,T!()t,JSF\GURE 1.

Page 79 Figure 2. Relative abundance by sampling periodof Achnanthes ndnutissima and 1\.. linearis(including /2.. lint'dris var pusTlla) ats ta ti on SL-l,
88807'2
64
564840
322Lf
16
80
8Q)
16uc::("j .)/
"Cl_"I
l: 32:J,..0
40tU
Q) 48:>'r!
56'-'(1j
rl 6LfQ)
l-< 7280
88
96
iAchn
7t':::.
~.::;::
8~.:-:-:;'
t1~
£±
P' 0' '~~~ ill
anthes minutissima
56
48
4032
2416
8()
Q) 3uc:: IG('J
"Cl 24c:::J
,..0 32("j
Q) 40:>
'M 48'-'(1j 56rl(l!
(1!j~
sampling period
p1
:\
ill7 r
:J>.~ \
:}
\
,
Achnanthes linear is
72~
80
38
9f,
sampling period
P Fi EL 11'j)! NAn D n 1', F T IJ ,J E T TOM /\ .J 0 F{ r-1 E V lSi 0 N 0 0 l\j 0 T Q t\ 0 T

Page 80 Figure 3. Relative seasonal abundance ofCocconeis placentula var. lineataat P-1 and SL-1
40P-1
36 ;,:
322824
20
16128
..Q)
u 4~ 0('j
:;;:::~'0~ 8;:l
.g 12Q) 16>
"'-' 20 7:.weurl 24Q)
~ 28
3236
40
:>... .w .w :>... :>.....-l p.. p.. ..-l ..-l::J Q) Q) Q) ::J ;:l .w
:>... to; OJJ U) U) :>... ~ to; to; tJJ p..til ,j ::J
~ ~ ~::J
~::J <l.J;;;:; <t: 'J H <t: U)
sampling period
SL-1
:>. .w p :>, ~>'"rl p.. p.. rl rl;:l Q) Q) Q) ::J ::l JJ
~'.>--) 'J M U) U) >... ~ 'J 'J bC 0..et; ,j ::l W ,j ...<.:! ::J
~;:J Q)
>-:: <: "'-' 'J ~ <r: U)
sampling period
pnELIMINP".RY DFl,I\FT SUE3,JECT TO MA,JOR HEVISION DO r\JOT OUOT

P-1
Page 81
Figure 4. Relative seasonal abundance of Synedra spp
at P-1 and SL-1
20:.:0"164
124
l.~~~~8:::t:
12 ))164
20 ~~}:~~~}!~~~~~~~~~~~~~~~~~~~~~i:~~~~~~~~~~~~~~~~~~~~l~~~~~~~~~~~~~~~~~~~~~t:~~~~~~~~~~~~~~~~~~~~~~~~~~~~~~~~~~~~~~~~t~~~~~~~~~~~~~~~~~~~~~~~~~~~~~~~~~~~~~~~~~~:t:~~~~~~~~~~~~~~~~~~~~l~~~~~~~~~~~~~~~~~~~~~t~~~~~:~:~~~;~;~:~:~:~I
H LJ
1976
A ES LS 'M
MONTH
J EJ LJ
1977
A S
SL-120 IT16 Z12 ~;~~
..:.: ..>:
~tb'~~G~12 ~;,.:.
::::::::16 :12
0~~?ii:~:~:~;~:~:~;~:~;~:~~I~.~~~~~~~~{:~tJ~~~~~~~~~~~~:~~~~~~~~t~~~~~~~~:~~~~~~~~~~~l~:~:~:~~~:~:~:~:~:~:l~:~:~:~:~:~:~~~:~~~l~~~~~~~~~~~~~~~:~~~:I:~~~:~:~~~~~~~t~~~:~i:~:~~~~~:~~~;~~~~~~~~~l~~~~~~~~~~~~~~~~~~;~~l
LJ
1976
A . ES LS H
MONTH
J EJ LJ
1977
A s
PFi LI INAR lJ \.JECT'T MAJ H Fi VISI N D N T U
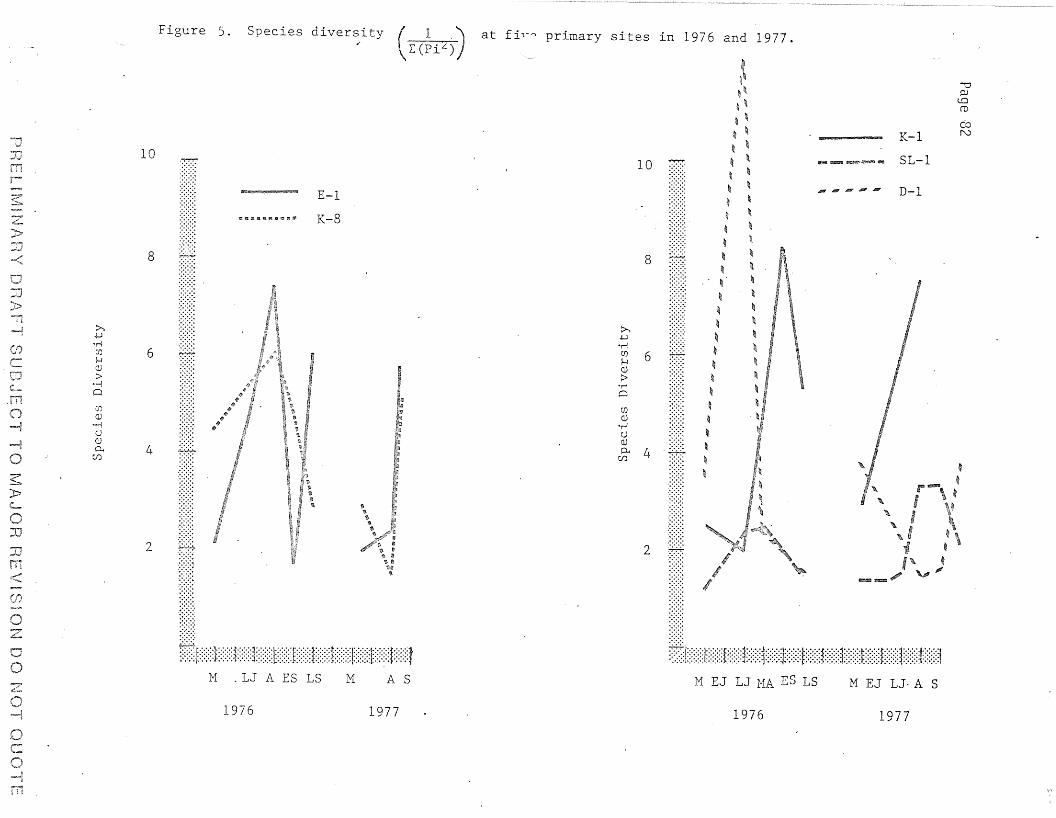
vOJlOCD
CoN
S1-1
K-l
D-l
M EJ 1J·A 8
"" .., AlIT JfI!F .is'
..~~-
~
~
-
,~\
-'~~ ,- ~~
- ~ \
- -- \
- -,\
\,,~
-,~
,~f,~
----~
----
M EJ 1J HA ES L8
6
8
2
10 ~
:t:8;
:::::::
Ilt:~::::::F:::t/l{:r:::t:/J/:l:tt:::l:IltJIJ
:>....wOM
er.J~Q)
>'MQ
er.JOJ
'M()(l)
~ 4
at fir" primary sites in 1976 and 1977.( L(~iL))
E-l
K-8
Species diversity
~m51m..R1.ro:nmJl
.8jijl!!~,~
!iiil!i .
~w
::~;>~:~
lilli,
wSv:::r::l:/J::::H::F:J::t::::n:::f:tr:ifM .LJ A ES LS M A 8
Figure 5.
8
6
4
2
10
ZPI:11
:0
:0
r-
:>...+-J
'OMer.J~rQ)
>0"'"'=- Q
er.JQ)
I .,...,.....,()
CJ-i 0.,U)
»C-_
JJ
JJ
-'"'"0""",--'7
0
/'<:.-
1976 1977 1976 1977
c

Page 831
Figure 6. Species diversity LPi2 and relative abundance
of Achnanth{;s minutissima at stations D-'J. and SL-1.
D-J.
19761'1onth
SL-l
1977
, q:::::::::::::::::::::~:::::::::::::::::::::~:::::::::::::::::::::t::::::::::::::::::::::::::::::::::::::::::::r::::::::::::::::::::i;:::;::::::::::::::::f::;:::::::::::::::::t:::::::::::::::::::::,,::::::::::::::::::::~* 100
r JA r10 . ~~t;.JKmll~~af~··
j\ ~~;~;' Ii\ /~ A~\ I / ~ 50 Q)
5::::. I I' :::: :>~:,~ \ I / :j:i 'j
f::.·,:l .\l..................... . : '" ..:.:.:.'~,: ~~_~ @=Q&.QQSw.u«w~~es~.~ H
o ~J':::::::::::::::;:::':f':':':':':':::::':::'l:::::::::::'::::;;:::~:::::::::::::::::::::f::::;:::::::::;::::::l:::::::::::::::::::::$::::::::;::::::::::::t::::::::::::::;;:::::f::::::::::;::::::::::l::::::::::::::::::::& 0
M L-J 1'1-A E-S L-S J E-J L-J A S
1976Honth
1977
PH L.I INP\f-iY DI::AF'r SU .JEeT T rvl/J·\ Fi H ViSl N 0

I-r
I
I- r -
Figure 7. Percent of time statioITs occurred inclusters at the .5 level of similarity

Figure 8. Hean rela tive abundance of the Achna.fithes minutissima, !!:.. lineuris (including.6.. linearisvar pusilla), Cocconeis placentula (including~. placentula var. lineata), Tabellaria flocculosa,and Synedra spp. at primary and secondary stations in 1976. Stations are ordered accordingto the abundance of A. minutissima.
UPJtoCD
co<.J1
....
.;....;.,
.......~
:1~!:<u!!!< !!:::!:l!:!:::t!!:!!j::lc~t[~~i~@~~n\'~',~~b~? K{~~L~~:d,.
::: -i~~-~ r" . G ~ ~ /~l:(
~ -:~~~~:-: _ ''-J ~~0;. I.... t::::::<.J IIJ~I
100 ,1I:II{::I':~~~~~";t"':'{";"'I{':"'?:dt"tIII,,:?t?'l"':';""itt'I,;':,;,'n~~'~!~:~J':':;:';l\;,;t?::r!.~:~~~~:kL 0. ~
illoz«oz:Jco«w>I<C-Jill-rr?f<
-1
<
~~
:0
:0
zo
z
\.-
SL-1 SR-1 P-1 .0-1 P-5 P-2 88-1 E-1 SL-3 K-1 F-1 K-8 KC-1 81-1 SR-3 K-5 K-2
B<?txf_. ,/xX SYNEDRA SPP.
T/\8ELLARIA FLOCCULOSA
OJJIJ COCCONEIS PLACENTULA
[[-=--~ ACHNANTHES UNEARtS
k::::::::::j ACHNANTHES MINUTISSIMA
1'\

Figure 9. Mean relative abundance of the taxa Achnanthes minutissima, A. linearis (including A. linearis'var. pusilla) , Cocconeis placentula (including f. placentula-var. lineata), and Syn;dra spp.at primary and secondary stations in 1977. Stations have been ordcqed according to theabundance of A. minutissima. -
VOJ
t.OCD
OJOJ
GROUP, 1 i ' GROUP '2, I"· GROUP 3[}}}}~;J~}tf)ft~rftrJ~:)rr~{f)??I~lt!!tf/l!!?t~r!;
--
~ I I ! I I I
mIT, :iiiil!I!IIII:llillllllllllllil~:::::::::::::::: ::::::::;::::::: <::::::
llmmmm, milmmmmY~11111mmm~ millllllllllllL
!1~!I!11111'::::::~"::::::::::::l':':':-:-:-:':I::::::::::::::l:::::::::::::~:::::::::::::l:::::::::::::j::::::::::::::1::::::::::::::
U-lml"'~(
\rh~~~~.1~ liliUI' .oO:O"C'U~Q" I0° , 0 t~ucc>o. . I
D- (" "Qo.... , , , , . Q0 C' f:::::::J OrL W. I .,
nnnnn.~ O?" 0 tL' . .O:CJ·6~
·,·'<+·············1·:-:·:·:-:·:·1·:-:·:·:·:-::: ::::::-:·:·:-l:·:-:::::-:::>:::-:·:·:·:-:~4:o"·<!'3 °ll
;1:::::::i:::t1:1:::::~I:t: ::::1::::P::::I:·~::I::::: ::1::·1F::U:h:::m>::f:?~(~S '
50
JJ
z
zo
~.-C::- 0-1 SL-2 SL-1 P-1 SR-2 P-2 P-5 K-5 SR-3 K-8 E-1 K-1 K-2 81-1
[0]]] SYNEDRA SPP.
~~ COCCONE!S PLACENTULA
k::·;·····c'·! ACHNANTHES Ll NEARIS
~:::::::::::::l ACHN HES MINUTISSIMA

10
.Page 87
Figure 10. Mean chlorophyll ~ in 1976 and 1977
averaged over all stations sampl~d
in each sampling period.
17j1
~.-..'.:1
~ 5~or.r;o:::u
76
N RY DF{ T u TT ,J REVISI u


Page 89
Figure 12. Mean chlorophyll ~ averaged over all sites
within each stream order in 1976 and 1977.
10
rdlHH
~ 5p...,o0:::.oH~U
54
R ER197"6
1977
- __. __~, --J-I__~__-,-I__
1 2 3
STnEA
C} fv'lA,j H R VISl N 0 N T

Page 90
Figure 13.
:: of
Average percent relative abundance by stream order
of acidophilous diatoms collected on glass slide
artificial substrates in 1976 and average pH by stream order
0'70
25
r-r.-----------.--------------:ii.'2!jy~-~~-------..__17
PH
6
1 . 2 3
fvi ER
4. 5
DF1 F~r U ,J T R j:1EVJSI NO u

%
Page 91
Figure 14. Average percent relative abundance by stream order
of acidophilolis diatoms collected qualitatively in
1976 and average pH by stream ord"_e_r -..7
PH
5
~...
6
_.-'__.>..L.... -!"
1
STRE
3
RDER
4 5
! !

40
30-
20
10
92
Figure 15. Scatter plot and regression lines
of the percent relative abundance
of acidophilous diatoms collected
qualitatively and pH in May and
September, 1976.
6.5 7'PH
\1

Figur~ IG . Dendrogram for diatom species collecLed qlwlLt<lLlvl'ly during August 1977.
VPJtoro1..0w
STATION
CY-1](::;-1
I-IK--:-~
D-JP-::i!i-I
F-l
rr,J-l2'-1
Bl-l~F-5
r -3P *J~
.90onDER
2
21
2
~3
'3
1
,70
",:~r--7"-';'
.60
8r-l!!
.50 AO
'.j
V-1
1(-7D-2(, -5
SR-4s~ -2Ir.: -15~-i
V-8
r-2'iL-1SR-1!' -1y~ -2
<;P -1,
:'£-1LT -JS:::-2LI-lS~-l
1-1SR-,;r-~
Sli-lUP,-l
LI-2
i,
3433
5
4{~
44-4
2J1J33
I
L
~ ..~..~:...«::'c
, :,,~.:;,""'_'r:=~'~'"
"1
~
"",.u
""" --t"-----I
I
£-2 J
K-l 5IJC-1 2

Figure 17. Shift in dominant species bet\veen unimpacted sites
(SR-l and KC-l) and impacted sites (SC-l and P-S)
"7i thin q th order and 2nd order s trearns.
90
80
·,0
60z
50(j)
o0_ 40
()
30
20
10