Embed Size (px)
Citation preview

page 1/19
Final Report
Consultative Committee on Mass and Related Quantities (CCM) Working Group on Gravimetry (WGG)
Regional Comparison of Absolute Gravimeters
SIM.M.G-K1 Key Comparison
Table Mountain Geophysical Observatory (TMGO)
Boulder, Colorado
Pilot laboratory: NIST-Gaithersburg

page 2/19
1. Introduction
The Regional Key Comparison of Absolute Gravimeters, SIM.M.G-K1, and a Pilot Study took
place at the Table Mountain Geophysical Observatory (TMGO) near Boulder, Colorado between
October 4 and October 16, 2016.
The procedures and schedule for the measurements were spelled out in the Technical Protocol,
approved by all participants and the CCM-WGG. However, due to logistical constraints, a few
teams were not able to attend, and the schedule was optimized accordingly.
Dr. David Newell of NIST, Gaithersburg, Maryland served as the Pilot Laboratory
representative, while Dr. Derek van Westrum of NOAA-NGS, Boulder, Colorado served as the
site host and coordinator. The comparison, SIM.M.G-K1, was organized in accordance with CIPM
MRA-D-05 of the Consultative Committee on Mass and Related Quantities (CCM), and linked to
the CCM.G-K2 [1] through EURAMET.M.G-K2 [2] via FG5X-216.
The list of participants and a description of the site (including vertical gravity gradients,
observed tidal parameters, and superconducting gravimeter signal observed during the
comparison) are presented, followed by a discussion of the analysis. The results of the data
analysis, the degrees of equivalence (DoE) of the gravimeters, and the key comparison reference
values (KCRVs) are also presented. For the final and official solution of the KCRVs, the
contributions of absolute gravity data inconsistent at the 95% confidence level are investigated.
Overall, the results and uncertainties indicate an excellent agreement among the gravimeters, with
a standard deviation of the gravimeters’ DoEs better than 1.3 µGal.
The Pilot Study is a complete solution where all participating gravimeters were treated as
equivalent in terms of their contribution to the definition of the reference values (RVs). The results
of the Pilot Study are given in Appendix A.
Table 1. Participants in the comparison.
#
Country Institution
Gravimeter NMI or
DI Operator(s) 1 USA NIST-Gaithersburg FG5-204 YES David Newell
2 USA NOAA-NGS FG5X-102 NO
Derek van Westrum
Jeff Kanney
3 Canada
National Research Council,
Canada FG5-105 YES Jacques Liard
4 Luxembourg University of Luxembourg FG5X-216 YES Olivier Francis
5 USA Micro-g LaCoste FG5X-302 NO
Brice Lucero
Brian Ellis
6 Italy INGV FG5-238 NO
Filippo Greco
Antonio Pistorio
7 Netherlands TU Delft FG5-234 NO Rene Reudink
8 Mexico
CENAM & National University
of Mexico FG5X-252 YES
Alfredo Esparza
Ramirez
9 Italy Agenzia Spaziale Italiana FG5-218 NO
Domenico Iacovone
Francesco Baccaro
10 Canada Natural Resources Canada FG5-236 NO Jason Silliker
11 USA
National Geospatial Intelligence
Agency FG5-107 NO Robert D Wheeler
12 Germany
Federal Agency for
Cartography and Geodesy FG5-301 NO
Reinhard Falk
Axel Ruelke

page 3/19
2. List of participants
Table 1 lists the participants in the comparison. All gravimeters were of the FG5(X) type with
two bulk interferometer systems (FG5-107 and FG5-301). Four institutions were a National
Metrology Institute (NMI) or a Designated Institute (DI). These are shaded in pink.
3. Site description and relative gravity measurements
A schematic of the TMGO facility, renovated in 2010, is shown in Figure 1. Six of the 10
available piers (AK is permanently reserved for the SG) were employed during SGIM.M.G-K1:
AG, AH, AJ, AQ, AS, and AT. Each pier is constructed of approximately 1m3 of concrete, isolated
from the building’s foundation. The building itself is located on top of a remote mesa, far from
any cultural noise sources.
In the summer of 2014, LaCoste & Romberg gMeters D43 and G6 were used to measure
relative gravity values on a fixed tripod at three heights above each pier at TMGO. Three heights
allow the determination of any nonlinearity in the gradient. A given measurement consists of six
or more “laps” of each gravimeter up the three-tiered tripod. Each tier occupation consists of
approximately twenty 10 second gravity samples. After first rejecting any sample outliers (>3σ,
k=1), the instrument drift and any significant tares are removed. A weighted least-squares analysis
provides a quadratic fit to all measured gravity differences (both instruments) simultaneously,
resulting in the following function of gravity with height:
g(z) = az2 + bz + c. (1)
Note that when determining the difference in gravity value at two different heights, the constant
term, c, cancels. Uncertainties of the parameters a and b are derived from the variance-covariance
matrix. Because the two instruments are analyzed simultaneously, any systematic difference
between them appears as an increase in a and b. Uncertainties in the height measurements (tier
locations) are considered negligible. The parameters are listed (for all piers for completeness) in
Table 2.
Finally, note that the gradient value is not expected to change at TMGO over the time-frame
discussed. TMGO is located on a broad, flat, undisturbed expanse of land, and even unmodeled
environmental factors like water table fluctuations will not cause a change in the value of the
gradient.
Figure 1. A schematic of the TMGO gravity piers. AK is permanently occupied by the SG, and only piers AG, AH,
AJ, AQ, AS, and AT were used in the comparison.

page 4/19
Table 2. Vertical gravity gradients at the TMGO piers (only AG, AH, AJ, AQ, AS, and AT were used for the comparison).
Site
a
/μGal m-2
a
/μGal m-2
b
/μGal m-1
b
/μGal m-1
ab
/μGal2 m-3
AG 4.6 1.3 -322.3 1.7 2.2
AH 4.9 1.0 -318.4 1.3 1.3
AI 3.6 1.7 -310.4 2.1 3.6
AJ 1.1 1.1 -316.1 1.5 1.7
AN 3.6 1.3 -316.0 1.7 2.2
AO 3.3 1.2 -319.4 1.6 1.9
AP 0.6 1.8 -317.0 1.5 2.7
AQ 9.2 1.1 -332.5 1.4 1.8
AS 8.5 3.0 -330.0 4.0 12.0
AT 6.8 1.4 -329.2 1.9 2.7
The gravity difference between height z1 and z2 is given by:
(2)
and the associated uncertainty
(3)
The participants reported gravity results at the “effective measurement height”, heff, of their
respective gravimeters where the gravity value is least sensitive to the effect of the gradient [3]
[4]. The gradient formula for that respective pier was then used to transfer the value to a final,
common height of 125 cm (an approximate average of the effective measurement height for FG5
and FG5-X gravimeters).
The observed tidal parameters – used by all participants to correct for earth tides and ocean
loading simultaneously – were provided by Olivier Francis, based on an analysis of SG CT-024.
They are listed in Table 3 [5].
4. Superconducting gravity meter measurements
A GWR superconducting gravity meter, CT-024, was operated continuously throughout the
comparison on pier AK, situated near the center of the absolute piers. Figure 2 displays the results
after the earth tide, ocean loading, and atmospheric pressure effects have been removed. The
resulting change in gravity, ~1 µGal peak-to-peak, throughout the comparison was presumably
observed by all gravity meters. This small, slow change in gravity is well within the systematic
uncertainty of the absolute gravimeters, and its presence is thus neglected in the analysis. The
mean times of absolute measurements are indicated by red circles.
)()()()()( 12
2
1
2
21221 zzbzzazgzgzzg
abbag zzzzzzzz )()(2)()( 12
2
1
2
2
22
12
222
1
2
2
2
page 5/19
Table 3. Observed tidal parameters for TMGO from SG CT-024 via Olivier Francis.
Wave Start Frequency (cpd)
Stop Frequency (cpd)
Amplitude Factor
Phase Lag (degrees)
DC 0.000000 0.000001 1.00000 0.0000
long 0.000002 0.249951 1.16000 0.0000
Q1 0.721500 0.906315 1.16052 1.1570 O1 0.921941 0.940487 1.16468 1.1775
NO1 0.958085 0.974188 1.15951 1.0326
P1 0.989049 0.998028 1.16539 1.1041
S1 0.999853 1.000147 1.49457 15.9599
K1 1.001825 1.003651 1.15452 1.1761 PSI1 1.005329 1.005623 1.30377 1.3908
PHI1 1.007595 1.011099 1.20411 0.6319
J1 1.013689 1.044800 1.18028 1.1094
OO1 1.064841 1.216397 1.18279 0.3491
2N2 1.719381 1.872142 1.16806 -0.4567
N2 1.888387 1.906462 1.15681 -0.2398 M2 1.923766 1.942754 1.15945 0.1973
L2 1.958233 1.976926 1.16297 0.3812
S2 1.991787 2.002885 1.17172 -0.5305
K2 2.003032 2.182843 1.17348 -0.4844
M3 2.753244 3.081253 1.07285 -0.2409
M4 3.381379 4.347615 1.03900 0.0000
Figure 2. The output of the superconducting gravity meter, CT-024 with earth tides and barometric pressure effects removed (blue line). A maximum peak-to-peak signal of about 1.0 µGal is observed during the entire duration of the comparison. The red circles indicate the average times of each absolute gravity measurement.
page 6/19
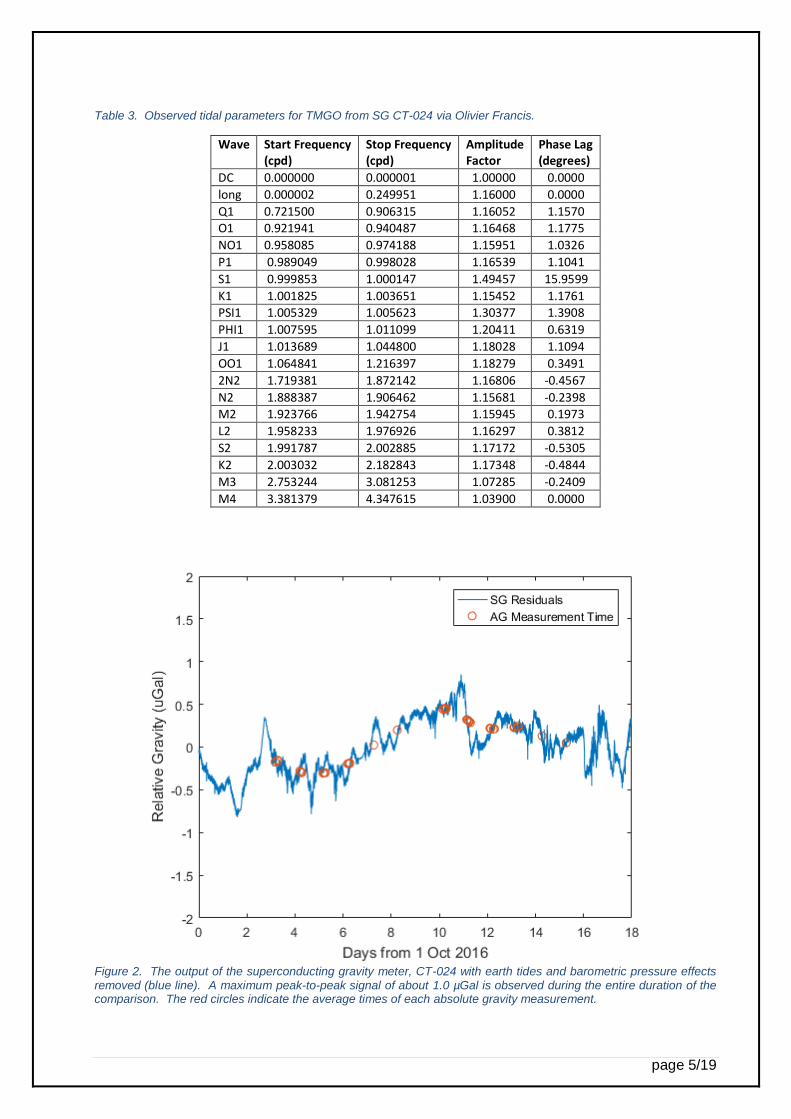
5. Absolute gravity measurements
Each participant was free to measure gravity over a duration of their choosing within a window
of approximately 24 hours (before being required to move to the next scheduled pier). Table 4
lists the measurement schedule (NMI/DI gravimeters are shaded in pink). The schedule was
designed to maximize the overlap of gravimeters, minimize the number of occupied piers, and
prohibit reoccupations of the same pier by a single gravimeter [6]. Every gravimeter overlapped
with every other gravimeter at least two times and no more than three times.
Table 4. Nominal pier occupation schedule for the comparison. Days 1-4 were Monday through Thursday nights (3-6 October, 2016), and days 5-8 were Monday through Thursday nights the following week (10-13, October, 2016). Due to real-time logistical constraints, not all instruments could observe on their scheduled date. The actual occupation times are listed in Table 5. (All instruments did observe at their scheduled location.)
Pier\Day 1 2 3 4 5 6 7 8
AG FG5X-252 FG5-301 FG5-218 FG5-234 FG5-107 FG5-204 FG5X-102 FG5-236
AH FG5X-216 FG5X-252 FG5-301 FG5-218 FG5-105 FG5-107 FG5-204 FG5X-302
AJ FG5-238 FG5X-216 FG5X-252 FG5-301 FG5-236 FG5-105 FG5-107 FG5X-102
AQ FG5-234 FG5-238 FG5X-216 FG5X-252 FG5X-302 FG5-236 FG5-105 FG5-204
AS FG5-218 FG5-234 FG5-238 FG5X-216 FG5X-102 FG5X-302 FG5-236 FG5-107
AT FG5-301 FG5-218 FG5-234 FG5-238 FG5-204 FG5X-102 FG5X-302 FG5-105
Gravity was determined above each pier benchmark at heff unique to each gravimeter (and in
principle, each gravimeter set up). Each raw gravity value is corrected for:
• Earth tides and ocean loading via a common set of observed tidal parameters [5]
• Barometric pressure changes from the nominal value of 826.74 mBar using a common
admittance factor of -0.3 µGal/mbar [7]
• Polar Motion using common values obtained from the Earth Rotation and Reference
Systems Service (IERS) [8]
• Self attraction of the gravimeter itself [9] [10]
• Diffraction correction due to the finite width of the laser beam [11]
These raw gravity values were then transferred to a common height of 125 cm using the quadratic
gradient parameters for each pier listed in Table 2. The gravimeter results are listed in Table 5.

page 7/19
Table 5. Absolute gravity observations gij. uij is the standard measurement uncertainty (k=1). See text for discussion. NMI/DI gravimeters are shaded in pink, and a common value of 979 622 000 µGal has been subtracted from each value. The days are UTC dates in October 2016.
Gravimeter Pier Gravity @
heff (µGal)
heff
(m)
diffC
(µGal)
SAC
(µGal)
Start
Date
Start
Time
Stop
Date
Stop
Time
Gravity
gij (µGal)
Uncert
uij (µGal)
FG5X-252 AG 737.8 1.311 1 -1.2 8 21:35 9 14:35 756.7 2.2
FG5X-252 AH 739.3 1.311 1 -1.2 4 21:26 5 15:26 758 2.2
FG5X-252 AJ 746.7 1.313 1 -1.2 5 20:40 6 15:40 766.4 2.2 FG5X-252 AQ 741.5 1.309 1 -1.2 6 19:03 7 15:03 759.7 2.2
FG5X-216 AH 749.1 1.27 1.2 -1.4 3 17:00 4 15:15 755.2 2.38
FG5X-216 AJ 759.2 1.27 1.2 -1.4 4 18:00 5 15:30 765.5 2.38
FG5X-216 AQ 750.9 1.27 1.2 -1.4 5 17:00 6 16:15 757.1 2.38 FG5X-216 AS 745.8 1.27 1.2 -1.4 6 18:00 7 15:10 752 2.38
FG5-238 AJ 777.8 1.217 1.05 -1.2 3 22:26 4 15:26 767.4 1.85
FG5-238 AQ 771.3 1.218 1.05 -1.2 4 21:42 5 13:41 761.3 1.87 FG5-238 AS 766.6 1.216 1.05 -1.2 5 20:22 6 13:22 755.9 2.06
FG5-238 AT 766.7 1.214 1.05 -1.2 6 21:36 7 15:37 755.5 1.9
FG5-234 AG 768.9 1.215 1 -1.5 7 0:06 7 12:19 758 1.99
FG5-234 AQ 769.7 1.214 1 -1.5 4 1:06 4 12:19 758.6 1.97
FG5-234 AS 766.6 1.213 1 -1.5 5 0:06 5 12:19 755.2 2.4
FG5-234 AT 768.3 1.211 1 -1.5 6 0:06 6 12:19 756.2 2.01
FG5-218 AG 773.6 1.205 1.20 -1.36 6 1:05 5 12:05 759.6 1.87
FG5-218 AH 769.8 1.21 1.20 -1.36 7 1:05 6 7:05 757.3 1.84
FG5-218 AS 772.2 1.205 1.20 -1.36 8 1:05 7 12:05 758.2 2.14
FG5-218 AT 776.9 1.201 1.20 -1.36 5 1:05 4 12:05 761.5 2.03 FG5-301 AG 764.4 1.22 2 -1.43 4 21:23 5 15:39 755.1 2.33
FG5-301 AH 767.1 1.22 2 -1.43 5 20:33 6 15:49 758 2.32
FG5-301 AJ 776.3 1.22 2 -1.43 6 21:16 7 15:33 766.9 2.33
FG5-301 AT 765.1 1.22 2 -1.43 7 21:57 8 15:14 755.8 2.34 FG5X-102 AG 748.1 1.286 1.05 -1.2 12 15:01 13 14:01 759.2 1.84
FG5X-102 AJ 754.9 1.285 1.05 -1.2 13 14:23 14 14:23 765.8 1.85
FG5X-102 AS 743.8 1.282 1.05 -1.2 10 20:41 11 14:41 753.7 1.87

page 8/19
FG5X-102 AT 745 1.281 1.05 -1.2 11 20:50 12 13:50 754.7 1.85
FG5-204 AG 764.1 1.231 1.98 -1.23 12 0:01 12 11:46 758.2 1.83
FG5-204 AH 763 1.232 1.98 -1.23 13 0:01 13 11:46 757.5 1.82 FG5-204 AQ 763.1 1.23 1.98 -1.23 14 0:06 14 11:51 756.9 1.83
FG5-204 AT 765.5 1.227 1.98 -1.23 11 0:11 11 11:56 758.3 2.13
FG5-107 AG 764.3 1.225 1.05 -1.2 10 21:01 11 14:01 756.5 1.88
FG5-107 AH 763 1.228 1.05 -1.2 11 16:23 12 14:23 756.2 1.85 FG5-107 AJ 775.8 1.227 1.05 -1.2 12 16:23 13 14:23 768.5 1.87
FG5-107 AS 763.8 1.226 1.05 -1.2 13 14:23 14 14:23 756.3 2.04
FG5-105 AH 756.6 1.242 0.9 -1.1 10 18:32 11 12:33 754.2 1.71
FG5-105 AJ 770 1.237 0.9 -1.1 11 17:48 12 13:48 765.9 1.72
FG5-105 AQ 758 1.237 0.9 -1.1 12 17:00 13 13:00 754 2.51
FG5-105 AT 758.8 1.235 0.9 -1.1 13 17:00 14 13:00 754.1 1.74
FG5-236 AG 761.4 1.226 0.82 -1.2 14 1:04 14 12:49 754 1.99
FG5-236 AJ 773.3 1.221 0.82 -1.2 11 1:08 11 12:53 764.2 2.02
FG5-236 AQ 764.4 1.223 0.82 -1.2 12 1:07 12 12:52 756.1 1.98
FG5-236 AS 762.4 1.217 0.82 -1.2 13 1:08 13 12:53 752.3 2.17 FG5X-302 AH 744.9 1.288 1.05 -1.2 14 21:16 15 15:47 756.4 1.81
FG5X-302 AQ 746 1.293 1.05 -1.2 10 18:37 11 13:37 759.1 1.81
FG5X-302 AS 742.2 1.285 1.05 -1.2 11 18:14 12 14:13 753 1.82
FG5X-302 AT 742.5 1.285 1.05 -1.2 15 19:04 16 18:04 753.4 1.81

page 9/19
6. Comparison Analysis Methods
Following Koo and Clare [12], the gravity values for each gravimeter on each pier are expressed
as
gij = gj + δi +ij (4)
where gij is the gravity value measured on pier j by gravimeter i as given in Table 5, gj is the true
(unknown) gravity value at pier j, δi is the true (unknown) bias of gravimeter i, and ij is the
measurement error. A variance weighted least squares analysis (LSA) is performed to give the best
estimates of the pier gravity Reference Values gj and the gravimeter biases δi. Since we do not
consider correlations among the gravity measurements, the input (or measurement) covariance
matrix V is diagonal with diagonal elements uij2 where uij is given in Table 5. Thus the
corresponding weight matrix W = V-1 is also diagonal with diagonal elements wij = 1/uij2. The set
of equations is ill defined with an infinite number of solutions, so an additional constraint on the
weighted sum of the biases is imposed:
∑ �̅�𝑖 𝛿𝑖
𝑛
𝑖=1
= 𝑑
(5)
where d is the linking converter for the KCRVs. The normalized variance weights �̅�𝑖 have the
condition that
∑ �̅�𝑖
𝑛
𝑖=1
= 1
(6)
and are defined as
�̅�𝑖 =𝑤𝑖
∑ 𝑤𝑖𝑛𝑖=1
, (7)
where wi = 1/ui2 and ui is the root mean square of uij given in Table 5 for gravimeter i. Initially d
is taken to be zero. By definition, only NMI and DI gravimeters can contribute to the KCRVs.
Therefore the only nonzero weights are 0.224 for FG5X-252, 0.192 for FG5X-216, 0.299 for FG5-
204, and 0.286 for FG5-105. The link of the KCRVs to CCM.G-K2 is then provided by the DoE
of FG5X-216 from CCM.G-K2 [1] through EURAMET.M.G-K2 [2].
Results for the Pilot Study where all participating gravimeters are treated as equivalent with
nonzero normalized weights are given in Appendix A.
7. Results
7.1 Initial results
For the initial solution, all measurements presented by the operators as given in Table 5 were
included in the LSA. For 31 degrees of freedom (49 input data, 18 unknowns), the chi square
statistic is 2 = 16.3 with probability p(16.3|31) = 0.99 and a Birge ratio of RB = √16.3 31⁄ = 0.73,
indicating a high level of consistency for the input data. The gravimeter biases () and pier
Reference Values (g) are presented in Table 6 and Figure 3.

page 10/19
Table 6. Initial biases () of NMI/DIs (pink) and non-NMI/DIs and pier Reference Values (g) at a height of 125 cm of the comparison using all the reported absolute measurements. The constant value 979 622 000.0 µGal is subtracted from the Reference Values, U is the expanded standard uncertainty at 95% confidence (k=2).
Gravimeter /µGal U/µGal Pier g/µGal U/µGal
FG5X-252 1.10 1.95 AG 756.29 1.75
FG5X-216 -1.10 2.18 AH 755.86 1.57
FG5-238 1.63 2.24 AJ 766.36 1.70
FG5-234 1.12 2.39 AQ 757.90 1.66
FG5-218 3.64 2.28 AS 754.08 1.90
FG5-301 0.52 2.58 AT 755.23 1.73
FG5X-102 0.37 2.22
FG5-204 1.29 1.62
FG5-107 1.18 2.23
FG5-105 -1.47 1.63
FG5-236 -0.69 2.34
FG5X-302 -0.29 2.14
Figure 3. Initial biases of the gravimeters from the initial weighted LSA. Gravimeters of NMI/DIs are highlighted in pink. The error bars are the expanded standard uncertainties (k=2) from the weighted LSA and are listed in Table 6.
-8
-6
-4
-2
0
2
4
6
8
/µ
Gal
GRAVIMETER

page 11/19
7.2 Consistency of input data
The consistency of the input data is investigated by calculating the normalized residuals Rij
from the LSA,
𝑅𝑖𝑗 = (g𝑖𝑗 − g𝑗)
𝑈𝑖𝑗 , (8)
where Uij is the expanded uncertainty (k=2) of the measured value in Table 5. A less stringent test
is to calculate the ratio of the difference between measured values of gravity and the reference
value to the uncertainty of the difference, called the compatibility index Eij,
𝐸𝑖𝑗 = (g𝑖𝑗 − g𝑗)
√𝑈𝑖𝑗2 + 𝑈𝑗
2
, (9)
where Uj is the expanded standard uncertainty (k=2) of the reference value gj from the weighted
LSA in Table 6. An absolute value of Rij or Eij larger than 1 indicates inconsistency at the 95%
confidence level for the given test. Values of Rij and Eij are given in Table 7. Only one of the input
data has an Rij or Eij value larger than 1, with FG5-218 on pier AT at Rij = 1.54 and Eij = 1.42.
Since FG5-218 does not represent an NMI or DI, this value was omitted in the final analysis
without further consideration.
Table 7. Consistency of input data: Comparison of measured gravity values gij (along with expanded standard uncertainties Uij) with reference values gj (along with expanded standard uncertainties Uj) by means of Rij and Eij. NMI/DI gravimeters are in pink. The constant value 979 622 000.0 µGal has been subtracted from the gravity measurements. Rij and Eij values larger than 1 are in yellow.
Gravimeter Pier gij Uij gj U j gij-gj Rij Eij
/µGal /µGal /µGal /µGal /µGal
FG5X-252 AG 756.70 4.40 756.29 1.75 0.41 0.09 0.09
FG5X-252 AH 758.00 4.40 755.86 1.57 2.14 0.49 0.46
FG5X-252 AJ 766.40 4.40 766.36 1.70 0.04 0.01 0.01
FG5X-252 AQ 759.70 4.40 757.90 1.66 1.80 0.41 0.38
FG5X-216 AH 755.20 4.76 755.86 1.57 -0.66 -0.14 -0.13
FG5X-216 AJ 765.50 4.76 766.36 1.70 -0.86 -0.18 -0.17
FG5X-216 AQ 757.10 4.76 757.90 1.66 -0.80 -0.17 -0.16
FG5X-216 AS 752.00 4.76 754.08 1.90 -2.08 -0.44 -0.41
FG5-238 AJ 767.40 3.70 766.36 1.70 1.04 0.28 0.25
FG5-238 AQ 761.30 3.74 757.90 1.66 3.40 0.91 0.83
FG5-238 AS 755.90 4.12 754.08 1.90 1.82 0.44 0.40
FG5-238 AT 755.50 3.80 755.23 1.73 0.27 0.07 0.06
FG5-234 AG 758.00 3.98 756.29 1.75 1.71 0.43 0.39
FG5-234 AQ 758.60 3.94 757.90 1.66 0.70 0.18 0.16
FG5-234 AS 755.20 4.80 754.08 1.90 1.12 0.23 0.22
FG5-234 AT 756.20 4.02 755.23 1.73 0.97 0.24 0.22
FG5-218 AG 759.60 3.74 756.29 1.75 3.31 0.88 0.80
FG5-218 AH 757.30 3.68 755.86 1.57 1.44 0.39 0.36

page 12/19
FG5-218 AS 758.20 4.28 754.08 1.90 4.12 0.96 0.88
FG5-218 AT 761.50 4.06 755.23 1.73 6.27 1.54 1.42
FG5-301 AG 755.10 4.66 756.29 1.75 -1.19 -0.26 -0.24
FG5-301 AH 758.00 4.64 755.86 1.57 2.14 0.46 0.44
FG5-301 AJ 766.90 4.66 766.36 1.70 0.54 0.12 0.11
FG5-301 AT 755.80 4.68 755.23 1.73 0.57 0.12 0.11
FG5X-102 AG 759.20 3.68 756.29 1.75 2.91 0.79 0.71
FG5X-102 AJ 765.80 3.70 766.36 1.70 -0.56 -0.15 -0.14
FG5X-102 AS 753.70 3.74 754.08 1.90 -0.38 -0.10 -0.09
FG5X-102 AT 754.70 3.70 755.23 1.73 -0.53 -0.14 -0.13
FG5-204 AG 758.20 3.66 756.29 1.75 1.91 0.52 0.47
FG5-204 AH 757.50 3.64 755.86 1.57 1.64 0.45 0.41
FG5-204 AQ 756.90 3.66 757.90 1.66 -1.00 -0.27 -0.25
FG5-204 AT 758.30 4.26 755.23 1.73 3.07 0.72 0.67
FG5-107 AG 756.50 3.76 756.29 1.75 0.21 0.05 0.05
FG5-107 AH 756.20 3.70 755.86 1.57 0.34 0.09 0.09
FG5-107 AJ 768.50 3.74 766.36 1.70 2.14 0.57 0.52
FG5-107 AS 756.30 4.08 754.08 1.90 2.22 0.54 0.49
FG5-105 AH 754.20 3.42 755.86 1.57 -1.66 -0.48 -0.44
FG5-105 AJ 765.90 3.44 766.36 1.70 -0.46 -0.13 -0.12
FG5-105 AQ 754.00 5.02 757.90 1.66 -3.90 -0.78 -0.74
FG5-105 AT 754.10 3.48 755.23 1.73 -1.13 -0.33 -0.29
FG5-236 AG 754.60 3.98 756.29 1.75 -1.69 -0.43 -0.39
FG5-236 AJ 765.70 4.02 766.36 1.70 -0.66 -0.17 -0.15
FG5-236 AQ 757.30 3.96 757.90 1.66 -0.60 -0.15 -0.14
FG5-236 AS 754.40 4.28 754.08 1.90 0.32 0.08 0.07
FG5X-302 AH 756.40 3.62 755.86 1.57 0.54 0.15 0.14
FG5X-302 AQ 759.10 3.62 757.90 1.66 1.20 0.33 0.30
FG5X-302 AS 753.00 3.64 754.08 1.90 -1.08 -0.30 -0.26
FG5X-302 AT 753.40 3.62 755.23 1.73 -1.83 -0.51 -0.46
7.3 Linking converter
The linking converter of SIM.M.G-K1 to CCM.G-K2 is through the DoE of -0.4 µGal ± 2.65
µGal (k=1) determined for the DI gravimeter FG5X-216 during CCM.G-K2 [1] through
EURAMET.M.G-K2 [2]. The final result of FG5X-216 for SIM.M.G.K1 with d set to zero and
the datum of FG5-218 on pier AT removed is -1.15 µGal ± 1.09 µGal. Therefore the linking
converter is d = 0.75 µGal ± 2.86 µGal (k=1) (±5.73 µGal k=2).
Since the linking converter of SIM.M.G-K1 to CCM.G-K2 relies on a single DI, a subsequent
verification is performed by calculating a linking converter of SIM.M.G-K1 to CCM.G-K1
through the DoE of NMI gravimeter FG5-105 of -1.0 µGal ± 2.7 µGal (k=1) for CCM.G-K1. The
final result of FG5-105 for SIM.M.G-K1 with d set to zero and the datum of FG5-218 on pier AT
removed is -1.39 µGal ± 0.81 µGal. Therefore the linking converter for SIM.M.G-K1 to CCM.G-
K1 would be d = 0.39 µGal ± 2.82 µGal (k=1) (±5.64 µGal k=2). The difference of 0.36 µGal
between the two links are well within the uncertainties of the links, adding confidence in the
stability of the link.
page 13/19
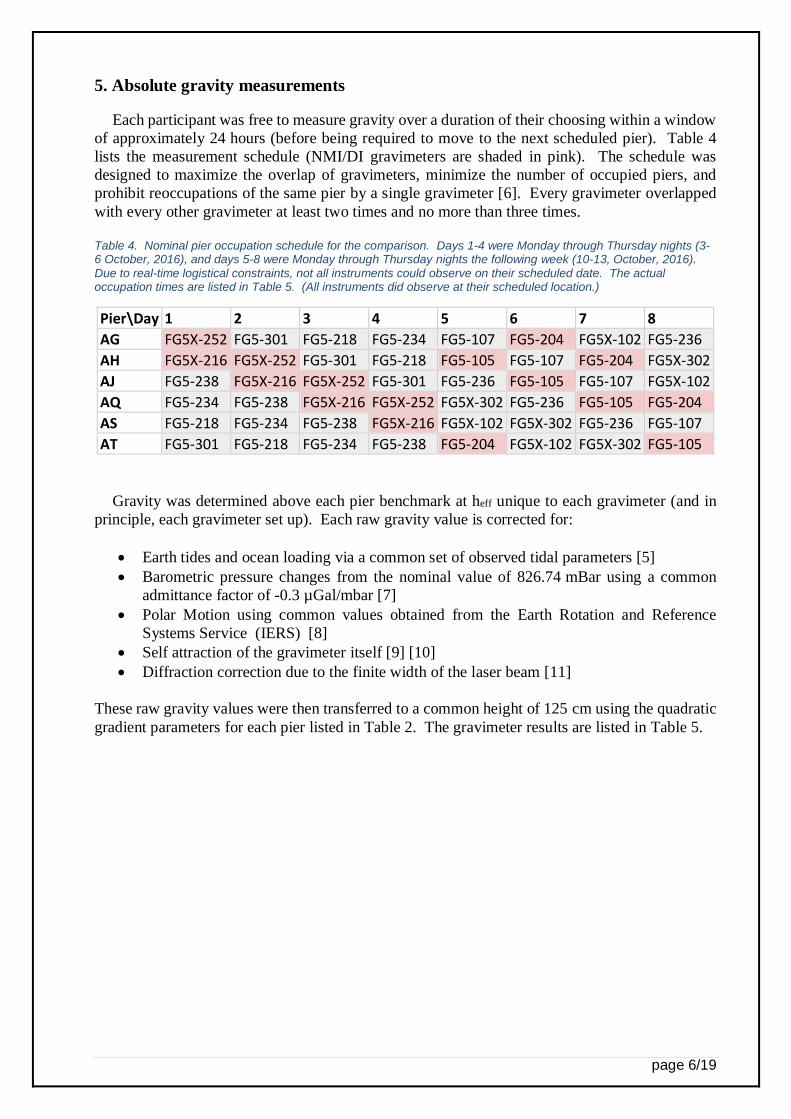
7.4 Final results
A final LSA was performed excluding the measurement of the FG5-218 at pier AT and with
d = 0.75 µGal to obtain the best estimates for the KCRVs, given in Table 8. The expanded standard
uncertainty Uj includes the expanded standard uncertainty of 5.73 µGal from the linking converter.
For 30 degrees of freedom (48 input data, 18 unknowns), the chi square statistic is 2 = 13.8 with
probability p(13.8|30) = 0.99 and a Birge ratio of RB = √13.8 30⁄ = 0.68, indicating a very high
level of consistency for the input data. Following Jiang et al. [13], the DoEs are the weighted
average difference between the measurements of a gravimeter i and the KCRVs at given site j,
𝐷𝑖 = [∑ 𝑤𝑖𝑗 (g𝑖𝑗 − g𝑗)] ∑ 𝑤𝑖𝑗⁄
, (10)
where the weights wij = 1/UDij2 and UDij is the expanded uncertainty of the difference gij - gj. The
differences, expanded uncertainties, and DoEs are shown in Table 9. UDi is the expanded
uncertainty of the weighted differences. The official DoE results for comparison SIM.M.G-K1
are given in Table 10 and Figure 4. All the gravimeters are in excellent equivalence.
Table 8. Key Comparison Reference Values (KCRVs) linked to the CCM.G.K-2 using linking converter of (0.72 ± 5.73) µGal (k=2) related to DI gravimeter FG5X-216. The constant value 979 622 000.0 µGal is subtracted from the KCRVs. U is the expanded standard uncertainty at 95% confidence computed as the root mean square of the expanded standard uncertainty from the LSA and the expanded uncertainty of the linking converter.
Official Key Comparison Results
Pier KCRV/µGal U/µGal
AG 755.68 5.99
AH 755.24 5.94
AJ 765.61 5.98
AQ 757.14 5.97
AS 753.43 6.04
AT 754.09 6.01
Table 9. DoEs of NMI/DIs (pink) and non-NMI/DIs. gij are the measured gravity values transferred to 125 cm with expanded uncertainty Uij. gj are the KCRVs with associated expanded (k=2) uncertainties Uj given in Table 8. UDij is the expanded uncertainty of differences gij-gj. Di is the final DoE computed according to Eq.10 along with the expanded uncertainty UDi. The constant value 979 622 000.0 µGal was subtracted from the gravity measurements.
Gravimeter Pier gij Uij gj U j gij-gj UDij Di UDi
/µGal /µGal /µGal /µGal /µGal /µGal /µGal /µGal
FG5X-252 AG 756.70 4.40 755.68 5.99 1.02 7.44 1.79 3.71
FG5X-252 AH 758.00 4.40 755.24 5.94 2.76 7.39
FG5X-252 AJ 766.40 4.40 765.61 5.98 0.79 7.42
FG5X-252 AQ 759.70 4.40 757.14 5.97 2.56 7.41
FG5X-216 AH 755.20 4.76 755.24 5.94 -0.04 7.61 -0.40 3.82
FG5X-216 AJ 765.50 4.76 765.61 5.98 -0.11 7.64
FG5X-216 AQ 757.10 4.76 757.14 5.97 -0.04 7.63
FG5X-216 AS 752.00 4.76 753.43 6.04 -1.43 7.69
FG5-238 AJ 767.40 3.70 765.61 5.98 1.79 7.03 2.46 3.56

page 14/19
FG5-238 AQ 761.30 3.74 757.14 5.97 4.16 7.04
FG5-238 AS 755.90 4.12 753.43 6.04 2.47 7.31
FG5-238 AT 755.50 3.80 754.09 6.01 1.41 7.11
FG5-234 AG 758.00 3.98 755.68 5.99 2.32 7.20 1.92 3.66
FG5-234 AQ 758.60 3.94 757.14 5.97 1.46 7.15
FG5-234 AS 755.20 4.80 753.43 6.04 1.77 7.71
FG5-234 AT 756.20 4.02 754.09 6.01 2.11 7.23
FG5-218 AG 759.60 3.74 755.68 5.99 3.92 7.07 3.54 4.13
FG5-218 AH 757.30 3.68 755.24 5.94 2.06 6.99
FG5-218 AS 758.20 4.28 753.43 6.04 4.77 7.40
FG5-301 AG 755.10 4.66 755.68 5.99 -0.58 7.59 1.30 3.79
FG5-301 AH 758.00 4.64 755.24 5.94 2.76 7.54
FG5-301 AJ 766.90 4.66 765.61 5.98 1.29 7.58
FG5-301 AT 755.80 4.68 754.09 6.01 1.71 7.61
FG5X-102 AG 759.20 3.68 755.68 5.99 3.52 7.03 1.15 3.53
FG5X-102 AJ 765.80 3.70 765.61 5.98 0.19 7.03
FG5X-102 AS 753.70 3.74 753.43 6.04 0.27 7.10
FG5X-102 AT 754.70 3.70 754.09 6.01 0.61 7.05
FG5-204 AG 758.20 3.66 755.68 5.99 2.52 7.02 2.14 3.54
FG5-204 AH 757.50 3.64 755.24 5.94 2.26 6.97
FG5-204 AQ 756.90 3.66 757.14 5.97 -0.24 7.00
FG5-204 AT 758.30 4.26 754.09 6.01 4.21 7.36
FG5-107 AG 756.50 3.76 755.68 5.99 0.82 7.08 1.87 3.55
FG5-107 AH 756.20 3.70 755.24 5.94 0.96 7.00
FG5-107 AJ 768.50 3.74 765.61 5.98 2.89 7.05
FG5-107 AS 756.30 4.08 753.43 6.04 2.87 7.29
FG5-105 AH 754.20 3.42 755.24 5.94 -1.04 6.86 -0.85 3.55
FG5-105 AJ 765.90 3.44 765.61 5.98 0.29 6.90
FG5-105 AQ 754.00 5.02 757.14 5.97 -3.14 7.80
FG5-105 AT 754.10 3.48 754.09 6.01 0.01 6.94
FG5-236 AG 754.60 3.98 755.68 5.99 -1.08 7.20 0.02 3.62
FG5-236 AJ 765.70 4.02 765.61 5.98 0.09 7.20
FG5-236 AQ 757.30 3.96 757.14 5.97 0.16 7.16
FG5-236 AS 754.40 4.28 753.43 6.04 0.97 7.40
FG5X-302 AH 756.40 3.62 755.24 5.94 1.16 6.96 0.51 3.50
FG5X-302 AQ 759.10 3.62 757.14 5.97 1.96 6.98
FG5X-302 AS 753.00 3.64 753.43 6.04 -0.43 7.05
FG5X-302 AT 753.40 3.62 754.09 6.01 -0.69 7.01
page 15/19
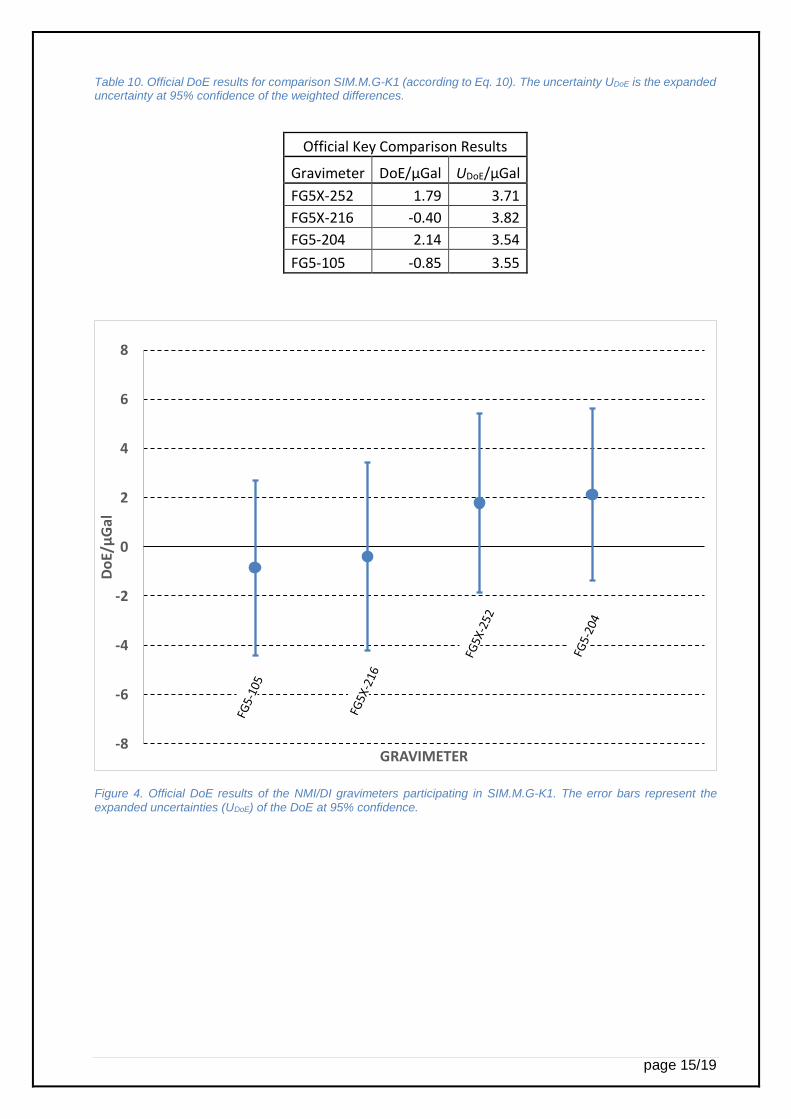
Table 10. Official DoE results for comparison SIM.M.G-K1 (according to Eq. 10). The uncertainty UDoE is the expanded uncertainty at 95% confidence of the weighted differences.
Official Key Comparison Results
Gravimeter DoE/µGal UDoE/µGal
FG5X-252 1.79 3.71
FG5X-216 -0.40 3.82
FG5-204 2.14 3.54
FG5-105 -0.85 3.55
Figure 4. Official DoE results of the NMI/DI gravimeters participating in SIM.M.G-K1. The error bars represent the expanded uncertainties (UDoE) of the DoE at 95% confidence.
-8
-6
-4
-2
0
2
4
6
8
Do
E/µ
Gal
GRAVIMETER

page 16/19
8. Conclusions
Twelve absolute gravimeters were compared during the regional Key Comparison
SIM.M.G-K1 of absolute gravimeters. Four gravimeters were from different NMIs and DIs. The
comparison was linked to the CCM.G-K2 through EURAMET.M.G-K2 via the DI gravimeter
FG5X-216. A subsequent verification of the link was provided by calculating the linking converter
of SIM.M.G-K1 to CCM.G-K1 through the DoE of NMI gravimeter FG5-105 during CCM.G-K1.
The two links differ by 0.36 µGal, well within the uncertainties of the links, adding confidence in
the stability of the two links separated by four years. Non-NMI/DI gravimeters participating did
not contributed to the determination of the KCRVs. Their g-values were used to determine relative
gravity ties for a better estimation of gravity differences between the 6 sites used during the
comparison. One measurement from a non NMI/DIs was found to be inconsistent at the 95%
confidence level and was excluded in the final estimate of the KCRVs. Overall, the results and
uncertainties indicate an excellent agreement among the gravimeters, with a standard deviation of
the gravimeters’ DoEs better than 1.3 µGal.

page 17/19
Appendix A: Pilot Study
The Pilot Study results presented below are from a comparison where all participating
gravimeters are treated as equivalent in terms of their contribution to the definition of the reference
values (RVs). No link is considered to CCM.G.K2. The analysis follows the same procedure as
in Section 6. The set of equations are given in Eqs. 4 and 5 with d = 0 and the normalized weights
calculated from Eq. 7. The normalized weights �̅�𝑖, the initial biases , and pier Reference Values
g from the variance weighted LSA are given in Table A1.
Table A1. Normalized weights (wi), initial biases (), and pier Reference Values (g) at a height of 125 cm for the
Pilot Study using all the reported absolute measurements. The constant value 979 622 000.0 µGal is subtracted from the Reference Values. U is the expanded standard uncertainty at 95% confidence (k=2).
Gravimeter �̅�𝑖 /µGal U/µGal Pier g/µGal U/µGal
FG5X-252 0.070 0.46 2.16 AG 756.93 1.46
FG5X-216 0.059 -1.74 2.35 AH 756.50 1.45
FG5-238 0.091 0.99 1.88 AJ 767.00 1.48
FG5-234 0.076 0.48 2.04 AQ 758.54 1.50
FG5-218 0.086 3.00 1.92 AS 754.72 1.53
FG5-301 0.062 -0.12 2.29 AT 755.87 1.44
FG5X-102 0.098 -0.27 1.81
FG5-204 0.093 0.65 1.85
FG5-107 0.092 0.54 1.87
FG5-105 0.089 -2.11 1.83
FG5-236 0.082 -1.33 1.99
FG5X-302 0.102 -0.93 1.77
The high level of consistency is the same as the initial results in section 7.1, with 31 degrees
of freedom, chi square statistic 2 = 16.3, probability p(16.3|31) = 0.99 and Birge ratio of
RB = √16.3 31⁄ = 0.73. As before, following the consistency investigation of Section 7.2, the
input data of FG5-218 on pier AT has Rij = 1.39 and Eij = 1.31. This datum is omitted in the final
analysis.
Following the procedure outlined in Section 7.4 and using Eq. 10, Table A2 and Figure A1 give
the DoEs and their expanded standard uncertainties for the Pilot Study calculated from the
differences between gravimeter measurements and the Reference Values in Table A1. All
gravimeters are in equivalence. Note that the uncertainties Uj of the Reference Values do not
include an uncertainty from a linking converter. As with the Key Comparison SIM.M.G-K1, the
overall results and uncertainties indicate good agreement among the gravimeters, with a standard
deviation of the gravimeters’ DoEs better than 1.3 µGal

page 18/19
Table A2. DoEs from the Pilot Study (according to Eq. 10). The uncertainty UDoE is the expanded uncertainty at 95% confidence of the weighted differences.
Gravimeter DoE/µGal UDoE/µGal
FG5X-252 0.46 2.32
FG5X-216 -1.72 2.49
FG5-238 1.14 2.06
FG5-234 0.61 2.21
FG5-218 2.16 2.40
FG5-301 -0.02 2.45
FG5X-102 -0.16 2.00
FG5-204 0.74 2.03
FG5-107 0.52 2.04
FG5-105 -1.99 2.00
FG5-236 -1.32 2.16
FG5X-302 -0.81 1.96
Figure A1. Degrees of Equivalence (DoE) from the Pilot Study calculated from the difference between the gravimeter measurements and the RVs. The error bars represent the expanded uncertainties (UDoE) of the DoE at 95% confidence. Gravimeters of NMI/DIs are highlighted in pink.
-8
-6
-4
-2
0
2
4
6
8
Do
E/µ
Gal
GRAVIMETER

page 19/19
References
[1] Francis O, Baumann H, et al. (2015) CCM.G-K2 key comparison Metrologia 52 07009
doi:10.1088/0026-1394/52/1A/07009.
[2] Pálinkáš V, Francis O, Val'ko M, Kostelecký J, Van Camp M, Castelein S, Bilker-Koivula
M, Näränen J, LothhammerA, and Falk R (2017) Regional comparison of absolute
gravimeters, EURAMET.M.G-K2 key comparison Metrologia 54 TS 07012.
[3] Niebauer T M (1989) The Effective Measurement Height of Free-fall Absolute Gravimeters
Metrologia 26 115 – 118.
[4] Timmen L (2003) Precise definition of the effective measurement height of free-fall absolute
gravimeters Metrologia 40 62-65.
[5] Dam T M and Francis O (1998) 2 Years of Continuous Measurement of Tidal and Nontidal
Variations of Gravity in Boulder, Colorado, Geophysical Research letters 25 (3) 393-396
[6] Smith D A, Saleh J, Eckl M. (2013) Optimizing an Absolute Gravimeter Comparison
Schedule.http://www.ngs.noaa.gov/web/science_edu/presentations_library/files/agu_2013_p
oster.pdf
[7] US Standard Atmosphere (1976), NASA-TM-X-74335, NOAA 77-16482.
[8] Petit G. and B Luzum, IERS Conventions (2010), IERS Technical Note 36, Frankfurt am
Main: Verlag des Bundesamts fur Kartographie und Geodasie, 2010.
[9] Pálinkáš V, Jiang Z, Liard J (2012) On the effective position of the free-fall solution and the
self-attraction effect of the FG5 gravimeters. Metrologia 49 552-559.9 Pálinkáš V, Jiang Z,
Liard J (2012) On the effective position of the free-fall solution and the self-attraction effect
of the FG5 gravimeters. Metrologia 49 552-559.
[10] Niebauer T, Billson R, Schiel A, van Westrum D, and Klopping F (2012), “The self-
attraction correction for the FG5X absolute gravity meter” Metrologia, 50 1-8.
[11] van Westrum D and Niebauer T (2003) The diffraction correction for absolute gravimeters
Metrologia 40 258 – 263.
[12] Koo A and Clare J F (2012) On the equivalence of generalized least-squares approaches to
the evaluation of measurement comparisons Metrologia 49 340–348.
[13] Jiang Z, Pálinkáš V, Arias F E, Liard J, Merlet S, Wilmes H, Vitushkin L, et al. (2012) The
8th International Comparison of Absolute Gravimeters 2009: the first Key Comparison
(CCM.G-K1) in the field of absolute gravimetry Metrologia 49 666.