Embed Size (px)
Citation preview
IntroductionRecent studies in a number of countries have firmly established a strong social gradientin a range of health outcomes including mortality (Blakely et al, 2005a; 2005b;Mackenbach et al, 2003; Shaw et al, 1999), various types of morbidity such as cancerincidence (Parikh et al, 2003), and health-related behaviours including smoking patterns(Barnett et al, 2005). Most of these studies have tended to find higher rates of ill healthamong more socially and materially disadvantaged groups, and the health gap betweenlow and high socioeconomic groups appears to have increased in relative risk terms inmost countries over the past twenty years (Blakely et al, 2005a; Davey Smith et al, 2002;
Regional and urban ^ rural variations in the association ofneighbourhood deprivation with community resource access:a national study
Jamie PearceGeoHealth Laboratory, Department of Geography, University of Canterbury, Private Bag 4800,Christchurch 8020, New Zealand; e-mail: [email protected]
Karen WittenCentre for Social and Health Outcomes Research and Evaluation, Massey University,PO Box 6137, Wellesley Street, Auckland, New Zealand; e-mail: [email protected]
Rosemary HiscockGeoHealth Laboratory, Department of Geography, University of Canterbury, Private Bag 4800,Christchurch 8020, New Zealand; e-mail: [email protected]
Tony BlakelyWellington School of Medicine and Health Sciences, University of Otago, PO Box 7343,Wellington, New Zealand; e-mail: [email protected] 11 January 2007; in revised form 22 March 2007; published online 5 August 2008
Environment and Planning A 2008, volume 40, pages 2469 ^ 2489
Abstract. Recent work has identified growing geographical inequalities in health between deprivedand nondeprived areas in a number of countries. Despite the plethora of studies monitoring thesetrends, the explanations for this growing spatial divide remain unclear. This lack of clarity has been ahindrance to the implementation of strategies by policymakers to reduce health inequalities. Oneexplanation for the noted spatial differences in health is that geographical access to a range ofcommunity resources, such as health care facilities, supermarkets, and recreational amenities, is lowerin deprived areas. However, the evidence base for this explanation is low. In our previous work wenoted a strong relationship at the national level between community resource accessibility and socialdeprivation, with access tending to be better in more deprived neighbourhoods. Other researchsuggests that the relationship between community resources varies at a subnational scale. Here, weconsider whether the relationship of better access to community resources in more deprived areaspersists for all regions of New Zealand, urban and rural. Using geographical information systems, wecalculate levels of geographical access to sixteen types of community resources in 38350 small censusareas across the country and, using an index of deprivation, examine whether access varies betweendeprived and nondeprived areas of the country. The results suggest that access to communityresources in New Zealand is to some extent context specific. In urban areas, access is better inmore deprived neighbourhoods, and the same is true of intermediate urban/rural areas although thegradient is considerably more pronounced. However, for rural areas, the relationship between com-munity resource access and deprivation is more mixed, with access to the majority of resources beingworse in more deprived areas. Similarly, there are regional variations in the relationship betweendeprivation and community resource access. These results challenge some aspects of neomaterialinterpretations of geographical inequalities in health.
doi:10.1068/a409

Mackenbach et al, 2003). One area of growing interest concerns geographical inequalitiesin health between areas of differing socioeconomic circumstances. For example, inthe UK it has been demonstrated that inequalities between rich and poor areas of thecountry widened during the 1980s and 1990s, and have continued to widen in the earlypart of the 21st century, despite the current government's rhetoric about reducing thehealth divide (Shaw et al, 2005). New Zealand is no exception to this trend, with wideregional variations in health including mortality (Tobias et al, 2001), cancer incidence(Pearce et al, 2006a) and health-related behaviours such as smoking (Barnett et al,2005). Furthermore, it has been reported that the mortality gap widened betweensocially deprived and nondeprived regions of the country during the 1980s and 1990s(Pearce et al, 2006b). Over these two decades, the geographical inequalities in mortalityfor regions across New Zealand have increased by about 50% (Pearce and Dorling,2006).
Despite the attention that has been given to monitoring growing geographicalinequalities in health, the explanation for this widening spatial divide remains unclear.One area of explanation that has received much attention is the importance of placeor neighbourhood effects in explaining geographical and social variations in health(Diez-Roux et al, 1997; Yen and Kaplan, 1999). The focus of such work has been toconsider whether particular attributes of the places in which people live have an effectupon their health, independently of an individual's sociodemographic characteristics.A review of research into neighbourhood determinants of health concluded that moststudies have found that contextual factors are significant in explaining variations inhealth outcomes and health-related behaviour, although the effect is generally smallrelative to individual factors (Pickett and Pearl, 2001). The growing interest in neigh-bourhoods and health has resulted in a number of studies which have demonstratedthat certain aspects of the physical and social environments in which people live canpromote or inhibit health (Macintyre and Ellaway, 2003). A renewed focus on place asa key theoretical and policy-relevant determinant of health has ensued, and interven-tion at the area level has become an important part of strategies to reduce healthinequalities (Acheson, 1998; Kearns et al, 2000).
A number of different neighbourhood characteristics have been suggested as havingan independent effect upon the health of residents. These characteristics include areadeprivation (Breeze et al, 2005), social capital (Kawachi et al, 2004), residentialsegregation (Collins and Williams, 1999), differential accessibility to a range of com-munity resources (Macintyre et al, 1993), social inequality (Barnett et al, 2005), as wellas aspects of the physical environment including air pollution (Brunekreef andHolgate, 2002). Importantly, it has been suggested that these characteristics of the localneighbourhood may make an important contribution to increasing geographicalinequalities in health (Macintyre et al, 2002). One domain of the neighbourhoodsand health literature has been to consider the influence of the physical infrastructureor community resources upon a range of health outcomes. It has been suggested thatdifferential access to a range of community resources between neighbourhoods may bean important component of understanding why health varies between neighbourhoods(Macintyre et al, 1993). However, most studies have examined whether aggregatemeasures of neighbourhood socioeconomic context are related to health, and havemerely speculated about the possible importance of differential access to communityresources that may be correlated with neighbourhood socioeconomic context. To datethere has been little research which directly measures specific community resourceswithin an area, establishes whether access to these resources actually varies by neigh-bourhood socioeconomic context, and determines whether community resources predicthealth outcomes (Diez-Roux, 2001).
2470 J Pearce, K Witten, R Hiscock, T Blakely

An implicit assumption in the provision of community resources by central andlocal government is that they contribute to the well-being of citizens. The assumptionhas been more explicit in recent policy initiatives in a number of countries, includingNew Zealand, where investment in urban renewal programmes and communityresource development in more deprived neighbourhoods has been used as a strategyto reduce health inequalities and social exclusion (Greenaway and Witten, 2005; Judgeand Bauld, 2001; Sullivan et al, 2004). The World Health Organization's `HealthyCities' programme, for example, endeavours to engage local governments in recognis-ing the wider determinants of health and health inequalities in economic regenerationand development efforts (Davies and Kelly, 1993).
In this paper we focus on access to community resources at the neighbourhoodlevel and question whether variation in access by neighbourhood deprivation maycontribute to geographic inequalities in health. Residential location determines ahousehold's access to an assortment of community resources such as shops, parks,schools, and health services (Knox, 1982). Proximity to these and other neighbourhoodservices and amenities can be theorised as contributing to health and well-being in anumber of ways. For example, a park provides opportunities for physical activity whichin turn may reduce the burden of chronic illnesses such as heart disease, and a super-market provides access to healthy food. Additionally, the time and financial costs ofaccess are reduced where resources are nearby, releasing individual and householdresources for use elsewhere. We report on geographical accessibility to sixteen typesof community resources, all of which can be theoretically linked to one or more healthoutcomes. The community resources can be grouped into five domains: recreationamenities; shopping facilities; education facilities; health facilities; and marae (a Ma� orimeeting place). Our analysis does not suppose to incorporate all community resourcesthat influence health but, rather, identifies the key resources that are pertinent in theNew Zealand context and for which national data were available.
In our previous work we found that there were regional differences in access to allresources between urban and rural New Zealand and that there were also noticeabledifferences in accessibility between neighbourhoods in urban areas (Pearce et al, 2006c).We also found that there was a strong social gradient in access to most of the com-munity resources we measured in New Zealand, with access being better in the moredeprived neighbourhoods (Pearce et al, 2007). In this paper we extend this work byaddressing two research questions:. Does the association of neighbourhood deprivation with community resource accessvary by rurality?
. Does the association of neighbourhood deprivation with community resource accessvary by region?Why might we expect the relationship between deprivation and community
resource access to vary by rurality and region in New Zealand? There is some evidencethat rural areas have pockets of extreme deprivation in New Zealandönot just inincome and personal socioeconomic resources, but also in terms of communityresources (Barnett and Barnett, 2001; 2003; Janes et al, 2001). We formally test thishypothesis, regarding possible variations by region. Current patterns of service provi-sion reflect varying histories of regional development and resource provision over timeas well as contemporary resource allocation policies. For example, changing practicesin industries such as agriculture, manufacturing, and tourism have led to changingrural population profiles with differential impacts on the service and amenity land-scapes of neighbourhoods and regions (Le Heron and Pawson, 1996; Witten et al,2003a). Resource allocation decisions at each level of government in New Zealandöcentral, regional, and localöcan determine levels of service and amenity access in
The association of neighbourhood deprivation with community resource access 2471
local neighbourhoods. The private sector is also influential in the siting of shopsand primary health care. Of the government agencies, central government has juris-diction over the spatial distribution and quality of education and health services,regional government has a mandate to oversee regional parks and public transport,while local government is concerned with the provision of social and recreationalfacilities such as libraries, swimming pools, local parks, and playgrounds. Local govern-ment income, and therefore expenditure on community resources, is largely determinedby the rates levied from residents so it reflects the socioeconomic characteristics of thearea. However, all levels of government have the potential to adopt more or lessredistributive policies with respect to service and amenity provision, policies that couldover time result in differing relationships between deprivation and community resourceaccess by region and rurality in New Zealand.
Geographical access to community resourcesNeomaterialist theorising on explanations for health inequalities posits a systematicunderinvestment in community infrastructure in poor areas (Lynch, 2000). It has beentheorised that residential proximity to community resources such as parks and recrea-tional facilities, health care provision, and shops selling healthy food contributes tohealth and well-being in a number of ways. However, surprisingly little research hasexamined whether geographical access to community resources varies betweendeprived and nondeprived neighbourhoods at a local or regional scale, and we knowof no work that has examined trends at a national level. From the research that hasbeen undertaken in urban areas, no consistent picture has emerged on the relationshipbetween the socio-economic characteristics of areas and their community resourceaccess. In some cities socioeconomically poorer areas, or areas that are ethnicallysegregated, have been found to be relatively poorly endowed with community resources(Pacione, 1989; Sooman and Macintyre, 1995). However, research in other urban areashas shown no clear association between socioeconomic deprivation and communityresource access, or areas of higher deprivation have been found to have higher levels ofcommunity resource access (Field et al, 2004; Knox, 1982; Levy et al, 1974; Lineberry,1977; McLafferty, 1982). A review of early studies by Lineberry (1977) indicated that`̀ pockets of discrimination can be found, but probably not patterns of discrimination''(page 186, emphasis in original). In Lineberry's `pockets of discrimination' low levels ofcommunity resource access coincided with areas in which residents' access to individualresources was also low. A recent New Zealand study found that access to commu-nity resources in two cities within the urban area of Auckland (North Shore andWaitakere) was, overall, better in the more wealthy city, but within both cities thedeprived areas had the best access (Field et al, 2004; Witten et al, 2003b).
Prior to detailing the methods and results for our own New Zealand research,we review research that has examined geographical inequalities in access to specifichealth-related community resources: health care provision, recreational amenities,shops selling healthy food, and educational facilities.
Access to health care provisionPerhaps the health-related community resource which has received the most attentionin the neighbourhoods and health literature is geographical access to health careprovision. It has been argued that greater distances to health care provision mayprovide a barrier to the utilisation of primary (Haynes et al, 2003), secondary (Arcuryet al, 2005; Hippisley-Cox and Pringle, 2000; Pierce et al, 1998) and preventativeservices (Clements et al, 1998; Hyndman and Holman, 2000; Iredale et al, 2005). Inparticular, many researchers have examined whether people living in the most deprived
2472 J Pearce, K Witten, R Hiscock, T Blakely

areas of a region have the worst access to health care services: an example of the`inverse care law' (Hart, 1971).
In deprived areas access to secondary care such as specialist physicians (Mansfieldet al, 1999) and pharmacies (Dokmeci and Ozus, 2004; Lin et al, 2005) has been foundto be worse than in nondeprived areas in the United States and Turkey. This is animportant finding as poor access has been shown to reduce utilisation, especially forvulnerable groups such as older people (McCarthy and Blow, 2004), the physicallydisabled (LaVela et al, 2004), and the mentally ill (Allard et al, 2003; Schmitt et al,2003).
In contrast, research on inequalities in proximity to primary health care provisionis mixed. British research studies have found that access to a GP is better in moredeprived neighbourhoods (wards) across the country (Adams and White, 2005), and inrural areas access tends to be better in the poorer locations where health needs aregreatest (Lovett et al, 2002). Similar results have been noted in Perth, Australia, whereaverage distances to the closest GP were shown to be significantly lower in poorerareas of the city (Hyndman and Holman, 2001). However, the opposite trend has beennoted in the United States, where, for example, more deprived areas have been foundto have poorer access to primary care (Guagliardo et al, 2004).
Access to recreational resourcesAccess to a range of recreation resources and spaces (such as parks, beaches, sportsand leisure centres, swimming pools, tennis courts, and skating rinks) has been notedas important to a local community's health (Ellaway and Macintyre, 1996). Such spacesare postulated to improve health and well-being by providing the opportunity struc-tures that enable regular exercise to become a local community norm and communalspaces for social interaction that builds social capital (Bedimo-Rung et al, 2005). Somestudies have found that access to leisure facilities, including open green space, increaseslevels of physical activity and reduces levels of obesity (Ellaway et al, 2005; Sallis et al,1998), although others suggest that any effect may be slight (Giles-Corti and Donovan,2002). There is also some evidence that there is a social gradient in access to recrea-tional resources (Giles-Corti and Donovan, 2002). For example, research in Scotlandhas noted an inequitable distribution in recreational facilities in the favour of high-income neighbourhoods which, it has been suggested, may contribute to lower levelsof physical activity in disadvantaged areas (Macintyre et al, 1993). Other research hasnoted the importance of access to safe recreational facilities (Humpel et al, 2002;Talen and Anselin, 1998). A link has been suggested between poor access to safefacilities in deprived areas, levels of exercise that are sufficiently low to endanger health,and a high level of exercise-related problems such as obesity (Kavanagh et al, 2005;Oliver and Hayes, 2005).
Access to food shopping facilitiesThere has been considerable focus upon whether socially deprived neighbourhoodshave poor access to shops selling high-quality and nutritious food, or, in other words,whether there is a presence of what has become termed a `food desert' (Clarke et al,2002). Researchers in Scotland have suggested that access to supermarket shopping isassociated with a better diet in terms of fruit and vegetable consumption, comparedwith shopping in smaller shops as the larger stores offer a greater range of foods atlower prices (Cummins and Macintyre, 2002a). The strongest evidence for food desertscomes from the USA where it has been suggested that supermarkets are shiftingaway from poorer inner-city areas, increasing the chance of food deserts developing;residents of such areas tend to eat fewer fruit and vegetables (Alwitt and Donley,1997; Zenk et al, 2005). For example, a study in four areas of the USA found a larger
The association of neighbourhood deprivation with community resource access 2473

proportion of supermarkets and gas stations with convenient stores in wealthier andwhite-dominated neighbourhoods compared with the poorest and black neighbourhoods(Morland et al, 2002).
Outside of North America, the evidence for food deserts is more mixed (Cumminsand Macintyre, 2006). Early work in Glasgow supported the existence of food deserts(Ellaway and Macintyre, 2000; Sooman and Macintyre, 1992) but more recent workhas not (Cummins and Macintyre, 1999; 2002b; Cummins et al, 2005). On the otherhand, results of work in Leeds has generally been supportive of food deserts (Clarkeet al, 2002; Whelan et al, 2002). Both research teams studied the effects of an openingof a new supermarket in a deprived area on the diet of the local community. TheGlasgow group found no difference in diet (Cummins et al, 2005) whereas the Leedsgroup found a small improvement (Wrigley et al, 2002; 2003). Other work in Britain(Pearson et al, 2005) and work in Australia (Winkler et al, 2006) also failed to findevidence of food deserts.
Access to educational facilitiesIn contrast to the plethora of literature on access to health care, exercise opportunities,and good diet, there is very little on access to education facilities and health. Therationale for examining access to education facilities is twofold: the association betweeneducational achievement, mortality, and health outcomes; and the place of schoolsas common sites of neighbourhood participation and interaction (Witten et al, 2001).The decline of communities in the wake of school closures has highlighted the crucialrole of schools in neighbourhood social relations (Valencia, 1984).
Distance is a strong factor when choosing a preschool (Davis and Connelly, 2005;Hofferth et al, 1996). Poorer access has been found in deprived areas for some types ofpreschool in Sheffield (Holloway, 1998), and to American primary schools in areaswhere rural poverty is an issue (Talen, 2001). With respect to secondary school choice,lower socioeconomic households are less likely than higher socioeconomic householdsto pursue entry to their school of choice as the distance from home to school increases(Lauder et al, 1995). Distance is only one of several factors that determine school choiceand access. School quality, or parents' perception of school quality, is associated withchoice and access and in turn with residential attachment and stability or converselywith neighbourhood instability and decline (Power, 2000).
In summary, the literature on access to community resources as it relates to area-level deprivation is ambiguous, with findings varying by context and for specificresources. To date, most studies have undertaken analysis within a local context(eg comparing neighbourhood access with community resources in one city or region),not on a national scale (ie comparing neighbourhood access with community resourcesacross the whole nation). In this paper we consider whether there are strong neighbour-hood inequalities in access to community resources across New Zealand. In particular,we focus on whether accessibility varies with neighbourhood deprivation. We use anindex of community resources which has been constructed for neighbourhoods acrossthe whole of New Zealand. A nationally created index allows us to explore variationsin the association of neighbourhood deprivation and community resource accessbetween urban and rural areas, and variations across different regions.
Data and methodsIn this study we adopt a geographical information systems (GIS) approach to measurecommunity resource accessibility. A GIS approach enables access to a range ofkey community resources to be measured in small areas across the country.
2474 J Pearce, K Witten, R Hiscock, T Blakely

Community resource access dataAccess to sixteen different types of community resources that have been empiricallylinked to health was calculated for small areas across New Zealand (see table 1 below).Data were obtained on the location of community resources at the national level(where possible) in order to maintain a consistent and directly comparable dataset.Some datasets (eg food outlets) had to be requested from the seventy-four individualterritorial authorities (local authorities with some delegated governance with an averagepopulation of 50 000) across New Zealand and then the precise location of each recordwas computed from its address by using geocoding software. All datasets were the mostaccurate at the time of collection (2004 ^ 05) and no dataset was older than 2002.
Calculating community resource accessibilityAccessibility was calculated for each type of community resource for all 38350 census`meshblocks' or `neighbourhoods' across New Zealand. Meshblocks are the smallestunit of dissemination of census data in New Zealand, with each area representingapproximately 100 people. In this analysis each meshblock was represented by itspopulation-weighted centroid (the centre of population in the area rather than the geo-metric centroid) and the time taken to travel to each community resource along theroad network was calculated using the network functionality in a GIS. In order torepresent accessibility more accurately, it is important to use the distance between eachmeshblock and the location of each community resource through the road network tocalculate total travel time rather than the euclidean (or straight line) distance (Wittenet al, 2003b). All segments in the road system were adjusted to account for variations inspeed limits, type of road surface, sinuosity, and differences in the topography acrossthe network. These modifications to the road network were important because theyallowed for realistic estimates of the least cost (ie quickest route) from each popula-tion-weighted meshblock centroid to each facility. In all 38350 meshblocks, the traveltime along the road network between each population-weighted meshblock centroidand the closest example of each type of community resource (eg the travel time to thenearest school) was calculated. Full details of the methodology used to calculateaccessibility is documented elsewhere (Pearce et al, 2006c).
AnalysisBecause the travel time variables are highly skewed, nonparametric analysis wasappropriate. To consider whether access to each of the sixteen types of communityresources varied between areas of differing levels of social deprivation, the mediantravel time to each community resource was calculated for neighbourhoods dividedinto quintiles of deprivation. Neighbourhood deprivation was defined using the 2001New Zealand Deprivation Index (NZDep 2001), an index based on nine socioeconomicvariables taken from the 2001 New Zealand Census (Salmond and Crampton, 2002).
We initially describe the association of neighbourhood deprivation with communityresources access across all of New Zealandöpartly reproducing previous work, butproviding valuable context to this paper. In the main analyses, we examined whetherthe neighbourhood-level relationship between community resources accessibility anddeprivation varied by urban/rural status. Using the New Zealand Urban ^Rural Profileclassification (Statistics New Zealand, 2005), we allocated an urban, rural, or inter-mediate rural/urban classification to all meshblock neighbourhoods across the country.The index categorises all neighbourhoods into one of seven urban/rural categoriesranging from major urban centres to highly rural areas. Due to the small numbers ofmeshblocks in some urban/rural categories, the seven categories were collapsed intothree groups: urban (main urban areas), intermediate (satellite urban areas; indepen-dent urban areas; rural areas with high urban influence; rural areas with moderate
The association of neighbourhood deprivation with community resource access 2475

urban influence), and rural (rural areas with low urban influence; highly rural/remoteareas).
Within the three urban/rural strata, we conducted a simple unweighted linearregression model between neighbourhood deprivation (NZDep 2001 quintiles) and themedian travel distance for each of the domains and types of community resources. Theratios of the regression-based estimates in deprivation quintile 5:deprivation quintile 1were derived to provide a measure of the strength of association between deprivationand community resource access in each urban/rural category for each resource (see theappendix for details). We also considered whether the relationship between the depriva-tion and community resource accessibility varied between the sixteen New Zealandregional council areas (excluding the Chatham Islands (figure 1) by using the sameregression-based estimation procedure.
0 75 150 300 km
Figure 1. Map of the sixteen regions across New Zealand.
2476 J Pearce, K Witten, R Hiscock, T Blakely

ResultsTable 1 shows travel times to each of the sixteen resources for all neighbourhoods inNew Zealand, the ratio for deprived compared with nondeprived neighbourhoodsacross New Zealand, and travel times by rurality (and the main urban:rural ratio) acrossNew Zealand. Some of these results have been presented elsewhere (Pearce et al,2007), but are reproduced here to provide context for the subsequent analyses of thedeprivation ^ resource association stratified by rurality and region.
There is a clear deprivation gradient in access to community resources for mesh-blocks across New Zealand (table 1). Median travel times were greater in the leastdeprived quintile compared with the most deprived quintile for all community resour-ces except beaches. Median travel times in the most deprived quintile ranged fromthree quarters to half those in the least deprived quintile. Ratios of travel timescomparing the most deprived with the least deprived quintiles were lowest for the dietand marae domains and highest (ie approaching 1.0) for the recreation domain. Therewas the most variation within the health domain, with a stronger gradient for GPs andpharmacies than for fire and ambulance stations. An inspection of the Kendall's tau-Bmeasure demonstrates that for all community resources, except beaches, access wassignificantly related to deprivation (table 1), with the relationship being strongest forthe education, diet, and marae domains. Looking at the relationship between urban/rural status and travel time to community resources, we found, unsurprisingly, therewas better geographical access in more urban parts of the country, and the strength ofassociation is consistently strong for all resources (table 2).
Does the association of neighbourhood deprivation with community resource access vary by rurality?To explore the interaction between deprivation and the urban/rural status, we examinedwhether there is a social gradient in geographical access to community resources inurban, rural, and intermediate urban/rural areas of New Zealand. The appendixprovides details of regression analyses of the relationship between travel time anddeprivation for all community resources across the three urban/rural strata. Figure 2shows the ratio of the regression-based estimates of the relationship between depriva-tion and median travel time to each community resource for quintile 5 to quintile 1.When the ratio is less than 1 it indicates that geographical access is better in moredeprived neighbourhoods, whereas when the value is greater than 1, less deprivedneighbourhoods have better access.
In urban areas the ratio value is less than 1 for all domains and types of communityresources, except for beaches (1.33). The effect size in urban areas is reasonably con-sistent as, with the exception of beaches, the ratio values range from 0.88 (recreation)to 0.57 (food shops) (see the appendix). In intermediate urban/rural areas, the ratiovalue was less than 1 for most domains and community resources, with the exceptionof ambulance stations, fire stations, and beaches (ratios ranging from 1.01 to 1.36).However, the ratio values for the remaining community resources tended to be muchsmaller than in urban areas, with few values exceeding 0.4. These results indicate thataccess to most types of community resources tends to be far better in deprivedneighbourhoods in intermediate urban/rural areas.
In rural New Zealand the relationship between community resource accessibility anddeprivation was generally the converse. For some community resources (parks, beaches,primary, and intermediate schools) the ratio value was negative, but for most resourcesthe ratio was positive. For some resources, including Plunket (a government-fundedwell child service), ambulance stations, fire stations, supermarkets, and sport andleisure centres, the effect sizes were relatively large, with ratios of greater than 2. Itshould be noted that the ratio values represent the results within strata of rurality and,
The association of neighbourhood deprivation with community resource access 2477

2478JPearce,
KWitten,
RHiscock,T
Blakely
N:/psfiles/epa4010w
/Table 1. Average travel times (minutes) to community resources, and variations in travel time by neighbourhood deprivation and rurality: results for allneighbourhoods in New Zealand.
Domain (italics) and type Average travel time for Variation in travel times Travel times, and variation, by ruralityall neighbourhoods in times by neighbourhoodNew Zealand (minutes)a deprivationa
mean median standard ratio tau-Bb rural inter- main ratio main tau-Bdeviation quintile 5: mediate urban urban: rural
quintile 1 areas
Health 5.17 2.00 9.65 0.54 ÿ0.201 12.99 2.27 1.63 0.13 ÿ0.365Accident and emergency 21.24 11.41 36.75 0.63 ÿ0.130 34.68 17.94 8.75 0.25 ÿ0.364General practitioners 5.83 2.39 11.32 0.56 ÿ0.192 14.23 2.84 1.91 0.13 ÿ0.381Pharmacy 6.60 2.54 13.72 0.57 ÿ0.192 15.63 3.03 2.06 0.13 ÿ0.386Plunketc 11.39 4.04 23.23 0.66 ÿ0.116 21.45 4.22 3.28 0.15 ÿ0.329Fire station 21.16 10.66 28.82 0.78 ÿ0.102 33.29 11.04 4.57 0.14 ÿ0.408Ambulance 14.58 5.73 23.36 0.67 ÿ0.085 41.38 16.65 8.11 0.20 ÿ0.361Diet 3.97 1.54 8.67 0.47 ÿ0.254 8.93 1.69 1.29 0.14 ÿ0.326Food establishment 4.25 1.61 8.94 0.47 ÿ0.245 9.57 1.80 1.34 0.14 ÿ0.334Supermarket 6.95 3.17 13.52 0.56 ÿ0.211 14.02 2.89 2.75 0.20 ÿ0.298Recreation 2.17 1.29 3.52 0.70 ÿ0.149 3.91 1.36 1.12 0.29 ÿ0.273Park 2.28 1.33 5.24 0.71 ÿ0.145 3.97 1.45 1.15 0.29 ÿ0.280Beach 22.74 16.89 18.85 1.06 ÿ0.005 34.94 22.45 13.94 0.40 ÿ0.235Sports and leisure facility 9.83 5.07 19.00 0.62 ÿ0.171 17.88 4.30 4.44 0.25 ÿ0.274Marae 13.09 7.36 22.80 0.48 ÿ0.241 18.19 7.63 6.34 0.35 ÿ0.244Education 2.87 1.41 6.69 0.55 ÿ0.225 5.45 1.54 1.20 0.22 ÿ0.354Kindergarten or day care 4.61 1.72 10.88 0.56 ÿ0.199 10.17 2.00 1.41 0.14 ÿ0.367Primary school 3.41 2.04 6.70 0.60 ÿ0.226 5.73 2.11 1.82 0.32 ÿ0.267Intermediate or full primary 3.59 2.05 6.95 0.58 ÿ0.228 6.31 2.10 1.82 0.29 ÿ0.276
schoolSecondary school 7.53 4.08 11.70 0.59 ÿ0.198 15.40 4.26 3.48 0.23 ÿ0.322a Results reproduced from table 2 of Pearce et al (2007).b The tau-B statistic is a nonparametric measure of correlation for ordinal or ranked variables which ranges between �1 and ÿ1 (Korey, 2005).Its absolute value indicates the strength of the association between deprivation (quintiles) and rurality (trichotomous) and resource access, and the signindicates the direction of association. P-values for all tau-B statistics were less than 0.001, except beaches by neighbourhood deprivation ( p � 0:26).c Plunket is a government-funded well child service established in 1907.
The
associationof
neighbourhooddeprivation
with
community
resourceaccess
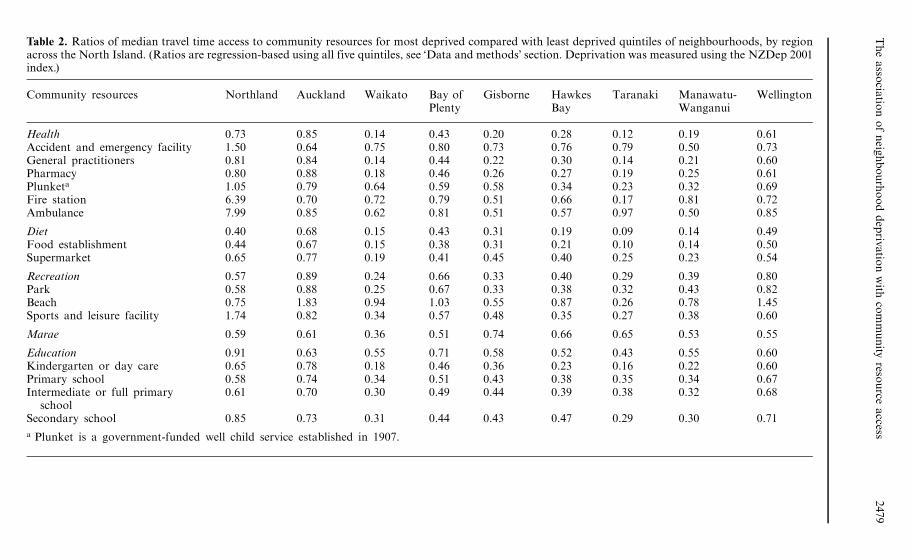
2479Table 2. Ratios of median travel time access to community resources for most deprived compared with least deprived quintiles of neighbourhoods, by regionacross the North Island. (Ratios are regression-based using all five quintiles, see `Data and methods' section. Deprivation was measured using the NZDep 2001index.)
Community resources Northland Auckland Waikato Bay of Gisborne Hawkes Taranaki Manawatu- WellingtonPlenty Bay Wanganui
Health 0.73 0.85 0.14 0.43 0.20 0.28 0.12 0.19 0.61Accident and emergency facility 1.50 0.64 0.75 0.80 0.73 0.76 0.79 0.50 0.73General practitioners 0.81 0.84 0.14 0.44 0.22 0.30 0.14 0.21 0.60Pharmacy 0.80 0.88 0.18 0.46 0.26 0.27 0.19 0.25 0.61Plunketa 1.05 0.79 0.64 0.59 0.58 0.34 0.23 0.32 0.69Fire station 6.39 0.70 0.72 0.79 0.51 0.66 0.17 0.81 0.72Ambulance 7.99 0.85 0.62 0.81 0.51 0.57 0.97 0.50 0.85
Diet 0.40 0.68 0.15 0.43 0.31 0.19 0.09 0.14 0.49Food establishment 0.44 0.67 0.15 0.38 0.31 0.21 0.10 0.14 0.50Supermarket 0.65 0.77 0.19 0.41 0.45 0.40 0.25 0.23 0.54
Recreation 0.57 0.89 0.24 0.66 0.33 0.40 0.29 0.39 0.80Park 0.58 0.88 0.25 0.67 0.33 0.38 0.32 0.43 0.82Beach 0.75 1.83 0.94 1.03 0.55 0.87 0.26 0.78 1.45Sports and leisure facility 1.74 0.82 0.34 0.57 0.48 0.35 0.27 0.38 0.60
Marae 0.59 0.61 0.36 0.51 0.74 0.66 0.65 0.53 0.55
Education 0.91 0.63 0.55 0.71 0.58 0.52 0.43 0.55 0.60Kindergarten or day care 0.65 0.78 0.18 0.46 0.36 0.23 0.16 0.22 0.60Primary school 0.58 0.74 0.34 0.51 0.43 0.38 0.35 0.34 0.67Intermediate or full primary 0.61 0.70 0.30 0.49 0.44 0.39 0.38 0.32 0.68
schoolSecondary school 0.85 0.73 0.31 0.44 0.43 0.47 0.29 0.30 0.71
a Plunket is a government-funded well child service established in 1907.

as detailed in table 1, that the median travel distances in rural areas of the country are,on average, considerably higher than those in urban neighbourhoods, for both deprivedand nondeprived neighbourhoods (figure 2).
Does the association of neighbourhood deprivation with community resource access vary by region?The analysis presented in tables 2 and 3 illustrates regional variations in the relation-ship between deprivation and access to each of the community resources. Most regionsdemonstrate a ratio of less than 1 for most resources (ie better access in more deprivedneighbourhoods); the effect sizes differ between regions. In some regions, such asGisborne, West Coast, Taranaki (three coastal and remote regions), and Waikato andOtago (rural areas with service towns and cities) the ratio values are relatively small
Secondary
Intermediate/full primary
Primary
Kindergarten/day care
Education (combined)
Marae
Sports and leisure
Beach
Parks
Recreation (combined)
Supermarket
Food shops
Diet (combined)
Fire station
Ambulance station
Plunket
Pharmacy
General practitioners
Accident and emergency
Health (combined)
0 1 2 3
Ratio NZDep quintile 5 to NZDep quintile 1
Urban
Intermediate
Rural
Figure 2. Ratios of median travel time access to community resources for most deprived com-pared with least deprived quintiles of neighbourhoods, by urban, intermediate, and rural areasacross New Zealand (see the appendix for the data from which the figure is derived; ratiosare regression-based using all five quintiles, see `Data and methods' section. Deprivation wasmeasured using the NZDep 2001 index).
2480 J Pearce, K Witten, R Hiscock, T Blakely
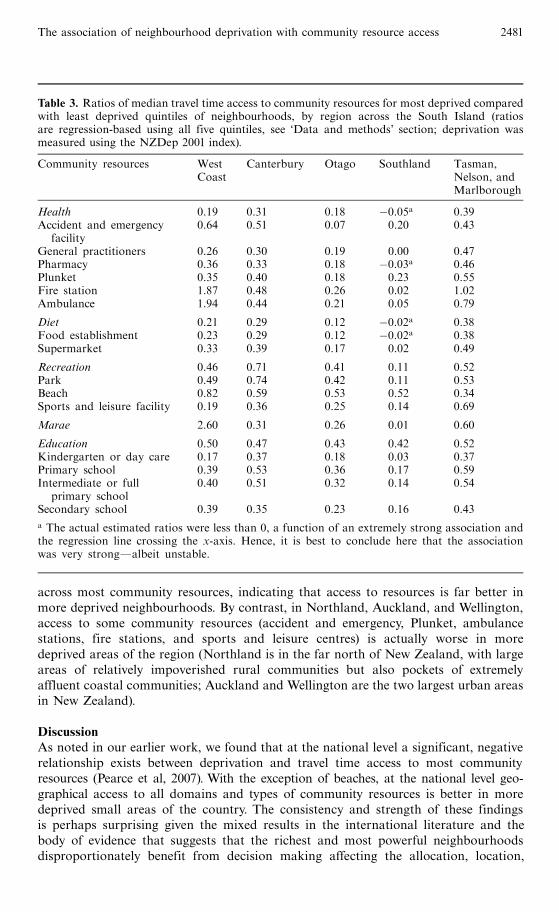
across most community resources, indicating that access to resources is far better inmore deprived neighbourhoods. By contrast, in Northland, Auckland, and Wellington,access to some community resources (accident and emergency, Plunket, ambulancestations, fire stations, and sports and leisure centres) is actually worse in moredeprived areas of the region (Northland is in the far north of New Zealand, with largeareas of relatively impoverished rural communities but also pockets of extremelyaffluent coastal communities; Auckland and Wellington are the two largest urban areasin New Zealand).
DiscussionAs noted in our earlier work, we found that at the national level a significant, negativerelationship exists between deprivation and travel time access to most communityresources (Pearce et al, 2007). With the exception of beaches, at the national level geo-graphical access to all domains and types of community resources is better in moredeprived small areas of the country. The consistency and strength of these findingsis perhaps surprising given the mixed results in the international literature and thebody of evidence that suggests that the richest and most powerful neighbourhoodsdisproportionately benefit from decision making affecting the allocation, location,
Table 3. Ratios of median travel time access to community resources for most deprived comparedwith least deprived quintiles of neighbourhoods, by region across the South Island (ratiosare regression-based using all five quintiles, see `Data and methods' section; deprivation wasmeasured using the NZDep 2001 index).
Community resources West Canterbury Otago Southland Tasman,Coast Nelson, and
Marlborough
Health 0.19 0.31 0.18 ÿ0.05a 0.39Accident and emergency 0.64 0.51 0.07 0.20 0.43
facilityGeneral practitioners 0.26 0.30 0.19 0.00 0.47Pharmacy 0.36 0.33 0.18 ÿ0.03a 0.46Plunket 0.35 0.40 0.18 0.23 0.55Fire station 1.87 0.48 0.26 0.02 1.02Ambulance 1.94 0.44 0.21 0.05 0.79
Diet 0.21 0.29 0.12 ÿ0.02a 0.38Food establishment 0.23 0.29 0.12 ÿ0.02a 0.38Supermarket 0.33 0.39 0.17 0.02 0.49
Recreation 0.46 0.71 0.41 0.11 0.52Park 0.49 0.74 0.42 0.11 0.53Beach 0.82 0.59 0.53 0.52 0.34Sports and leisure facility 0.19 0.36 0.25 0.14 0.69
Marae 2.60 0.31 0.26 0.01 0.60
Education 0.50 0.47 0.43 0.42 0.52Kindergarten or day care 0.17 0.37 0.18 0.03 0.37Primary school 0.39 0.53 0.36 0.17 0.59Intermediate or full 0.40 0.51 0.32 0.14 0.54
primary schoolSecondary school 0.39 0.35 0.23 0.16 0.43
a The actual estimated ratios were less than 0, a function of an extremely strong association andthe regression line crossing the x-axis. Hence, it is best to conclude here that the associationwas very strongÐalbeit unstable.
The association of neighbourhood deprivation with community resource access 2481
and organisation of public goods and services (Johnston, 1984; Knox, 1982; Miranda andIttipone, 1994). Previous studies outside of New Zealand have found varied evidence for asocial gradient in access to health care provision, recreational resources, food shoppingfacilities, and educational facilities and for some resources, such as secondary healthcare provision, most of the international literature suggests that access is worse inmore deprived areas (Dokmeci and Ozus, 2004; Lin et al, 2005; Mansfield et al,1999). Nonetheless, some researchers have noted a lack of correspondence between thesocioeconomic characteristics of neighbourhoods and the geographical organisationsof community resources (Rich, 1982), including earlier work in two New Zealand citieswhich found that access to resources was better in more deprived areas of thesecities (Field et al, 2004; Witten et al, 2003b).
The key research questions addressed in this paper, however, were whether thisassociation between neighbourhood deprivation and community resource access variedby rurality or region.We found that it did. The deprivation gradient in access observednationally was reproduced for urban and intermediate urban/rural areas, whereas inrural parts of the country a distinctly different pattern was evident with access generallypoorer in more deprived neighbourhoods. Further, for some community resourcesönamely supermarkets, sports and leisure, kindergarten/day care facilitiesöand for fireand ambulance services, the effect sizes were relatively large, suggesting that there is astrong deprivation gradient in access to these resources in rural New Zealand. Keyhealth services such as general practitioners and pharmacies were also markedly lessaccessible in poorer compared with more affluent rural areas.
What about regional variation in the association of neighbourhood deprivation andaccess to community resources? While access patterns in most regions generally mirrorthose established at the national level, there are variations between regions. Forexample, in Northland (remote in many parts, largely rural, with a high Ma� ori popula-tion) access to accident and emergency services, ambulance, fire stations, and sportsand leisure facilities is notably poorer in more deprived areas. However, there is noclear pattern of systematic variation in the association between access and neighbour-hood deprivation by region. Rather, in regions with significant rural poverty, thereappear to be pockets of poor access in socially disadvantaged communities. In the caseof Northland there are examples of relatively poor access to community resourcesfunded by the central, regional, and local government and the private sector.
The results of this study are not limited to academic interest. Better understandingof how neighbourhood environments may be related to health can have important impli-cations for health promotion and for the reduction in health inequalities (DiezRoux,2001). Poor access to key health-related community resources may be particularlyimportant in the context of the spatial concentration of poverty. Our results suggestthat at a national level, geographical accessibility to services and amenities alone isunlikely to be a key mediator between deprivation and health in urban areas. However,regional variation in access to resources in rural communities has implications forresource allocation decisions. If allocative decisions are made based on area deprivationwithout taking account of existing inequities between regions, access inequities may bemagnified.
The limitations of this study need to be considered. Firstly, our examinationfocused only on locational accessibility and, as has been suggested elsewhere, thereare, of course, other important barriers to utilising community resources beyondresidential proximity to community resources such as cost and perceived quality ofservices (Kelaher et al, 2006). For example, in New Zealand there is a cost associatedwith visiting a general practitioner, a key barrier that has been found to limit utilisationof health care, particularly in socially deprived communities (Barnett et al, 2000).
2482 J Pearce, K Witten, R Hiscock, T Blakely

Secondly, the perceived safety of the neighbourhood through which people pass toreach a service or amenity, particularly if they are walking, may also impact on itsuse (Kavanagh et al, 2005). For example, locational access to parks may be health-promoting in some neighbourhoods, yet in other neighbourhoods it may be associatedwith fear and violence. There is some evidence that perceptions of neighbourhooddisorder and safety are associated with the socioeconomic characteristics of an area(Sampson and Raudenbush, 2005). Third, there are other health-related communityresources that we were not able to evaluate due to data limitations, including access topublic transport options and local community halls. Fourth, the index is based ontravel times by car, but access to cars themselves is patterned by neighbourhoodsocioeconomic characteristics. This is pertinent in the New Zealand context wherepublic transport is poor or nonexistent in many areas.
We noted earlier the equivocal nature of the international evidence on the relation-ship between community resource accessibility and social deprivation, and the variedfindings from place to place. If we take the `food deserts' literature as an example,results of studies have varied within and between countries and even within cities(Cummins and Macintyre, 2002a; Sooman and Macintyre, 1992). These contrastingresults suggest that historical and social factors that have determined the developmentof neighbourhood infrastructure and service provisions in different places at differenttimes, may need to be examined if we are to better understand the relationshipsobserved between community resource accessibility and social deprivation in differentcontexts (Popay et al, 1998). The dominant transport mode at the time of settlement,patterns of agricultural and industrial development, landownership, and land-useplanning decisions have all been potent influences on urban and rural developmentin the New Zealand context. Differential access to community resources reflects thechequered history of different places. An improved understanding of patterns of accessbetween rural and urban areas and between regions and neighbourhoods underpinsmore informed policies and resource allocation decisions to redress observed inequities.
In conclusion, this study has used methodological advances in GIS to betterrepresent one important aspect of neighbourhood context which has been postulatedas influencing individual health outcomes and well-being. These results have potentiallyimportant implications for our understanding of the way neighbourhood infrastructuremay be modified to improve population health and reduce health inequalities. Ourresults suggest that at the national level poor locational access to community resourcesin deprived neighbourhoods in New Zealand is unlikely to be an explanation for therelatively poor health outcomes in these neighbourhoods. Rather, neighbourhoodinequalities in health by deprivation may actually be tempered by the pro-equitydistribution of community resources. However, for rural areas, and in some regionsof the country, the relationship between community resource access and deprivation ismore mixed, with access to the majority of resources being worse in more deprivedareas. These findings highlight the importance of evaluating the distribution of anassortment of health-related community resources at the national level and also in arange of contexts prior to developing strategies to reduce health inequalities based on`factoid' type assumptions (Cummins and Macintyre, 2002b).
ReferencesAcheson D, 1998 Independent Inquiry into Inequalities in Health (The Stationery Office, London)Adams J,White M, 2005, `̀ Socio-economic deprivation is associated with increased proximity to
general practices in England: an ecological analysis'' Journal of Public Health 27 80 ^ 81Allard S, Tolman R, Rosen D, 2003, `̀ Proximity to service providers and service utilization among
welfare recipients: the interaction of place and race''Journal of Policy Analysis andManagement22 599 ^ 613
The association of neighbourhood deprivation with community resource access 2483

Alwitt L, DonleyT, 1997, `̀ Retail stores in poor urban neighborhoods'' Journal of Consumer Affairs31 139 ^ 164
Arcury T, Gesler W, Preisser J, Sherman J, Spencer J, Perin J, 2005, `̀ The effects of geography andspatial behavior on health care utilization among the residents of a rural region''Health ServicesResearch 40 135 ^ 155
Barnett P, Barnett J R, 2001, `̀ Community ventures in rural health: the establishment of communityhealth trusts in Southern New Zealand''Australian Journal of Rural Health 9 229 ^ 234
Barnett R, Barnett P, 2003, `̀ `If you want to sit on your butts you'll get nothing!' Communityactivism in response to threats of rural hospital closure in southern New Zealand''Healthand Place 9 59 ^ 71
Barnett R, Coyle P, Kearns R, 2000, `̀ Holes in the safety net? Assessing the effects of targetedbenefits upon the health care utilization of poor New Zealanders'' Health and Social Care inthe Community 8 159 ^ 171
Barnett R, Pearce J, Moon G, 2005, `̀ Does social inequality matter? Changing ethnic socio-economic disparities and Maori smoking in New Zealand, 1981 ^ 1996'' Social Science andMedicine 60 1515 ^ 1526
Bedimo-Rung A, Mowen A, Cohen D, 2005, `̀ The significance of parks to physical activity andpublic health: a conceptual model''American Journal of Preventive Medicine 28 159 ^ 168
BlakelyT, Fawcett J, Atkinson J,Tobias M, Cheung J, 2005aDecades of Disparity II: SocioeconomicMortality Trends in New Zealand, 1981 ^ 1999 (Ministry of Health,Wellington)
Blakely T, Tobias M, Robson B, Ajwani S, Bonne M,Woodward A, 2005b, `̀ Widening ethnicmortality disparities in New Zealand 1981 ^ 99'' Social Science and Medicine 61 2233 ^ 2251
Breeze E, Jones D,Wilkinson P, Bulpitt C, Grundy C, Latif A, Fletcher A, 2005, `̀Area deprivation,social class, and quality of life among people aged 75 years and over in Britain'' InternationalJournal of Epidemiology 34 276 ^ 283
Brunekreef B, Holgate S, 2002, `̀Air pollution and health'' Lancet 360 1233 ^ 1242Clarke G, Eyre H, Guy C, 2002, `̀ Deriving indicators of access to food retail provision in British
cities: studies of Cardiff, Leeds and Bradford'' Urban Studies 39 2041 ^ 2060Clements S, Stone N, Diamond I, Ingham R, 1998, ``Modelling the spatial distribution of teenage
conception rates withinWessex'' British Journal of Family Planning 24 61 ^ 71Collins C,Williams D, 1999, `̀ Segregation and mortality: the deadly effects of racism'' Sociological
Forum 14 495 ^ 523Cummins S,Macintyre S,1999,`̀ The location of food stores in urban areas: a case study inGlasgow''
British Food Journal 101 545 ^ 553Cummins S, Macintyre S, 2002a, `̀A systematic study of an urban foodscape: the price and
availability of food in Greater Glasgow'' Urban Studies 39 2115 ^ 2130Cummins S, Macintyre S, 2002b, `̀ `Food deserts': evidence and assumption in health policy
making'' British Medical Journal 325 436 ^ 438Cummins S, Macintyre S, 2006, ``Food environments and obesity: neighbourhood or nation?''
International Journal of Epidemiology 35 100 ^ 104Cummins S, Petticrew M, Higgins C, Findlay A, Sparks L, 2005, `̀ Large scale food retailing as
an intervention for diet and health: quasi-experimental evaluation of a natural experiment''Journal of Epidemiology and Community Health 59 1035 ^ 1040
Davey Smith G, Dorling D, Mitchell R, Shaw M, 2002, `̀ Health inequalities in Britain: continuingincreases up to the end of the 20th century'' Journal of Epidemiology and Community Health56 434 ^ 435
Davies J K, Kelly M P, 1993 Healthy Cities: Research and Practice (Routledge, London)Davis E E, Connelly R, 2005, `̀ The influence of local price and availability on parents' choice of
child care'' Population Research and Policy Review 24 301 ^ 334Diez-Roux A, 2001, ``Investigating neighborhood and area effects on health''American Journal
of Public Health 91 1783 ^ 1789Diez-Roux A, Nieto F, Muntaner C, Tyroler H, Comstock G W, Shalar E, Cooper L,Watson R,
Szklo M, 1997, `̀ Neighbourhood environments and coronary heart disease''American Journalof Epidemiology 146 48 ^ 63
Dokmeci V, Ozus E, 2004, ``Spatial analysis of urban pharmacies in Istanbul'' European PlanningStudies 12 585 ^ 594
Ellaway A, Macintyre S, 1996, `̀ Does where you live predict health related behaviours?: A casestudy in Glasgow''Health Bulletin 54 443 ^ 446
Ellaway A, Macintyre S, 2000, ``Shopping for food in socially contrasting localities'' British FoodJournal 102 52 ^ 59
2484 J Pearce, K Witten, R Hiscock, T Blakely

Ellaway A, Macintyre S, Bonnefoy X, 2005, `̀ Graffiti, greenery, and obesity in adults: secondaryanalysis of European cross sectional survey'' British Medical Journal 331 611 ^ 612
Field A,Witten K, Robinson E, Pledger M, 2004, `̀ Who gets to what? Access to communityresources in two New Zealand cities'' Urban Policy and Research 22 189 ^ 205
Giles-Corti B, Donovan R J, 2002, `̀ The relative influence of individual, social and physicalenvironment determinants of physical activity'' Social Science and Medicine 54 1793 ^ 1812
Greenaway A,Witten K, 2005, `̀ Meta-analysing community action projects in Aotearoa NewZealand'' Community Development Journal 41 143 ^ 159
Guagliardo M F, Ronzio C R, Cheung I, Chacko E, Joseph J G, 2004, `̀ Physician accessibility:an urban case study of pediatric providers''Health and Place 10 273 ^ 283
Hart J, 1971, `̀ The inverse care law'' Lancet 1 405 ^ 412Haynes R, Lovett A, Sunnenberg G, 2003, `̀ Potential accessibility, travel time, and consumer
choice: geographical variations in general medical practice registrations in Eastern England''Environment and Planning A 35 1733 ^ 1750
Hippisley-Cox J, Pringle M, 2000, `̀ Inequalities in access to coronary angiography andrevascularisation: the association of deprivation and location of primary care services''British Journal of General Practice 50 449 ^ 454
Hofferth S L, Chaplin D D,Wissoker D A, Robins P K, 1996, ``Choice characteristics and parents'child-care decisions''Rationality and Society 8 453 ^ 495
Holloway S L, 1998, `̀ Geographies of justice: preschool-childcare provision and the conceptualisationof social justice'' Environment and Planning C: Government and Policy 16 85 ^ 104
Humpel N, Owen N, Leslie E, 2002, `̀ Environmental factors associated with adults' participationin physical activity: a review''American Journal of Preventive Medicine 22 188 ^ 199
Hyndman J C G, Holman C D J, 2000, `̀ Differential effects on socioeconomic groups of modellingthe location of mammography screening clinics using Geographic Information Systems''Australian and New Zealand Journal of Public Health 24 281 ^ 286
Hyndman J C G, Holman C D J, 2001, `̀Accessibility and spatial distribution of general practiceservices in an Australian city by levels of social disadvantage'' Social Science and Medicine53 1599 ^ 1609
Iredale R, Jones L, Gray J, Deaville J, 2005, `̀ `The edge effect': an exploratory study of some factorsaffecting referrals to cancer genetic services in rural Wales''Health and Place 11 197 ^ 204
Janes R, Dowell A, Cormack D, 2001, `̀ New Zealand rural general practitioners 1999 surveyöpart 1: an overview of the rural doctor workforce and their concerns'' New Zealand MedicalJournal 114 492 ^ 495
Johnston R J, 1984 City and Society (Hutchinson, London)Judge K, Bauld L, 2001, ``Strong theory, flexible methods: evaluating complex community-based
initiatives'' Critical Public Health 11 19 ^ 38KavanaghAM,Goller J L, KingT, JolleyD, CrawfordD,Turrell G, 2005,`̀ Urban area disadvantage
and physcial activity: a multilevel study in Melbourne, Australia'' Journal of Epidemiology andCommunity Health 59 934 ^ 940
Kawachi I, Kim D, Coutts A, Subramanian S V, 2004, `̀ Health by association? Social capital,social theory, and the political economy of public healthöcommentary: reconciling thethree accounts of social capital'' International Journal of Epidemiology 33 682 ^ 690
Kearns A, Gibb K, Mackay D, 2000, `̀Area deprivation in Scotland: a new assessment'' UrbanStudies 37 1535 ^ 1559
Kelaher M, Dunt D, Day S, Feldman P, 2006, `̀ Effects of financial disadvantage on use and non-useof after hours care in Australia''Health Policy 79 16 ^ 23
Knox P L, 1982 Urban Social Geography: An Introduction (Longman, Harlow, Essex)Korey J, 2005 Contingency Table Analysis; The Powermutt Project (California State Polytechnic
University, Pomona, CA)Lauder H, Hughes D,Watson S, Simiyu I, Strathdee R,Waslander S, 1995 Trading Futures: The
Nature of Choice in Educational Markets in New Zealand. The Smithfield Project Phase One,Third Report to the Ministry of Education Ministry of Education,Wellington
LaVela S L, Smith B,Weaver F M, Miskevics S A, 2004, `̀ Geographical proximity and health careutilization in veterans with SCI&D in the USA'' Social Science and Medicine 59 2387 ^ 2399
Le Heron R, Pawson E, 1996 Changing Places: New Zealand in the Nineties (Longman Paul,Auckland)
Levy F, Meltsner A,Wildavsky A, 1974 Urban Outcomes: Schools, Streets, and Libraries (Universityof California Press, San Francisco, CA)
The association of neighbourhood deprivation with community resource access 2485
Lin S J, Crawford S Y, Salmon J W, 2005,``Potential access and revealed access to pain managementmedications'' Social Science and Medicine 60 1881 ^ 1891
Lineberry R L, 1977 Equality and Urban Policy: The Distribution of Municipal Public Services(Sage, Beverly Hills, CA)
Lovett A, Haynes R, Sunnenberg G, Gale S, 2002, `̀ Car travel time and accessibility by bus togeneral practitioner services: a study using patient registers and GIS'' Social Science andMedicine 55 97 ^ 111
Lynch J, 2000, `̀ Income inequality and health: expanding the debate'' Social Science and Medicine51 1001 ^ 1005
McCarthy J F, Blow F C, 2004, `̀ Older patients with serious mental illness: sensitivity to distancebarriers for outpatient care''Medical Care 42 1073 ^ 1080
Macintyre S, Ellaway A, 2003, `̀ Neighbourhoods and health: an overview'', in Neighbourhoodsand Health Eds I Kawachi, L Berkman (Oxford University Press, Oxford) pp 20 ^ 42
Macintyre S, Maciver S, Sooman A, 1993, `̀Area, class and health: should we be focusing onplaces or people?'' Journal of Social Policy 22 213 ^ 234
Macintyre S, Ellaway A, Cummins S, 2002, `̀ Place effects on health: how can we conceptualise,operationalise and measure them?'' Social Science and Medicine 55 125 ^ 139
Mackenbach J P, Bos V, Andersen O, Cardano M, Costa G, Harding S, Reid A, Hemstrom O,Valkonen T, Kunst A E, 2003, `̀ Widening socioeconomic inequalities in mortality in sixWestern European countries'' International Journal of Epidemiology 32 830 ^ 837
McLafferty S, 1982, `̀ Urban structure and geographical access to public services''Annals of theAssociation of American Geographers 72 347 ^ 354
Mansfield C J,Wilson J L, Kobrinski E J, Mitchell J, 1999, ``Premature mortality in the UnitedStates: the roles of geographic area, socioeconomic status, household type, and availabilityof medical care''American Journal of Public Health 89 893 ^ 898
Miranda R, Ittipone T, 1994, ``Patterned inequality? Reexamining the role of distributive politicsin urban service delivery'' Urban Affairs Quarterly 29 509 ^ 534
Morland K,Wing S, Diez-Roux A, Poole C, 2002, `̀ Neighborhood characteristics associated withthe location of food stores and food service places''American Journal of Preventive Medicine22 23 ^ 29
Oliver L, Hayes M, 2005, `̀ Neighbourhood socio-economic status and the prevalence of overweightCanadian children and youth'' Canadian Journal of Public Health 96 415 ^ 420
Pacione M, 1989, `̀Access to urban services: the case of secondary-schools in Glasgow'' ScottishGeographical Magazine 105 12 ^ 18
Parikh S, Brennan P, Boffetta P, 2003, `̀ Meta-analysis of social inequality and the risk of cervicalcancer'' International Journal of Cancer 105 687 ^ 691
Pearce J, Dorling D, 2006, ``Increasing geographical inequalities in health in New Zealand,1980 ^ 2001'' International Journal of Epidemiology 35 597 ^ 603
Pearce J, Barnett R,Kingham S, 2006a,`̀ Slip! Slap! Slop! Cutaneousmalignantmelanoma incidenceand social status in New Zealand, 1995 ^ 2000''Health and Place 12 239 ^ 252
Pearce J, Dorling D,Wheeler B, Barnett R, Rigby J, 2006b, `̀ Geographical inequalities in healthin New Zealand, 1980 ^ 2001: the gap widens''Australian and New Zealand Journal of PublicHealth 30 461 ^ 466
Pearce J,Witten K, Bartie P, 2006c, `̀ Neighbourhoods and health: a GIS approach to measuringcommunity resource accessibility''Journal of Epidemiology and Community Health 60 389 ^ 395
Pearce J,Witten K, Hiscock R, Blakely T, 2007, `̀Are socially disadvantaged neighbourhoodsdeprived of health-related community resources?'' International Journal of Epidemiology 36348 ^ 355
Pearson T, Russell J, Campbell M J, Barker M E, 2005, `̀ Do `food deserts' influence fruit andvegetable consumption?: A cross-sectional study''Appetite 45 195 ^ 197
Pickett K, Pearl M, 2001, `̀ Multilevel analyses of neighbourhood socioeconomic context and healthoutcomes: a critical review'' Journal of Epidemiology and Community Health 55 111 ^ 122
Pierce R P,Williamson H A, Kruse R L, 1998, `̀ Distance, use of resources, and mortality amongrural Missouri residents with acute myocardial infarction'' Journal of Rural Health 14 28 ^ 35
Popay J,Williams G, Thomas C, Gatrell T, 1998, `̀ Theorising inequalities in health: the place oflay knowledge'' Sociology of Health and Illness 20 619 ^ 644
Power A, 2000, `̀ Poor areas and social exclusion'', in Social Exclusion and the Future of CitiesEds A Power,W Wilson (Centre for Analysis of Social Exclusion, London)
Rich R, 1982 The Politics of Urban Public Services (Lexington Books, Lexington, MA)
2486 J Pearce, K Witten, R Hiscock, T Blakely

Sallis J F, Bauman A, Pratt M, 1998, `̀ Environmental and policy interventions to promote physicalactivity''American Journal of Preventive Medicine 15 379 ^ 397
Salmond C, Crampton P, 2002 NZDep 2001 Index of Deprivation Department of Public Health,Wellington School of Medicine and Health Sciences,Wellington
Sampson R, Raudenbush S, 2005, `̀ Neighbourhood stigma and the perception of disorder'' Focus24 (Fall) 7 ^ 11
Schmitt S K, Phibbs C S, Piette J D, 2003, `̀ The influence of distance on utilization of outpatientmental health aftercare following inpatient substance abuse treatment''Addictive Behaviors28 1183 ^ 1192
Shaw M, Dorling D, Gordon D, Davey Smith G, 1999 TheWidening Gap: Health Inequalitiesand Policy in Britain (Policy Press, Bristol)
ShawM, Davey Smith G, Dorling D, 2005, `̀ Health inequalities and New Labour: how the promisescompare with real progress'' British Medical Journal 330 1016 ^ 1021
SoomanA,Macintyre S,1992,`̀ Scotland's health: a more difficult challenge for some? The price andavailability of healthy foods in socially contrasting localities in theWest of Scotland'' HealthBulletin 51 276 ^ 284
Sooman A, Macintyre S, 1995, `̀ Health and perceptions of the local environment in sociallycontrasting neighbourhoods in Glasgow''Health and Place 1 15 ^ 26
Statistics New Zealand, 2005 New Zealand: An Urban/Rural Profile (Statistics New Zealand,Wellington)
Sullivan H, Judge K, Sewel K, 2004, `` `In the eye of the beholder': perceptions of local impactin English Health Action Zones'' Social Science and Medicine 59 1603 ^ 1612
Talen E, 2001, `̀ School, community, and spatial equity: an empirical investigation of access toelementary schools inWest Virginia''Annals of the Association of American Geographers91 465 ^ 486
Talen E, Anselin L, 1998, `̀Assessing spatial equity: an evaluation of measures of accessibility topublic playgrounds'' Environment and Planning A 30 595 ^ 613
Tobias M, Salmond C, Crampton P, Chan M, Marmot M, Reid P, 2001Life Expectancy and SmallArea Deprivation Ministry of Health,Wellington
Valencia R, 1984, `̀ The school closure issue and the Chicano community: a follow-up study ofthe Los Angeles case'' Urban Review 16 145 ^ 163
Whelan A,Wrigley N,Warm D, Cannings E, 2002, `̀ Life in a `food desert' '' Urban Studies 392083 ^ 2100
Winkler E, Turrell G, Patterson C, 2006, `̀ Does living in a disadvantaged area mean feweropportunities to purchase fresh fruit and vegetables in the area? Findings from the Brisbanefood study''Health and Place 12 306 ^ 319
Witten K, McCreanor T, Kearns R A, Ramasubramanian L, 2001, `̀ The impacts of school closureon neighbourhood social cohesion: narratives from Invercargill, NewZealand''Health andPlace7 307 ^ 317
Witten K, Kearns R, Lewis N, Coster H, McCreanor T, 2003a, `̀ Educational restructuring froma community viewpoint: a case study of school closure from Invercargill, New Zealand''Environment and Planning C: Government and Policy 21 203 ^ 223
Witten K, Exeter D, Field A, 2003b, `̀ The quality of urban environments: mapping variation inaccess to community resources'' Urban Studies 40 161 ^ 177
Wrigley N,Warm D, Margetts B,Whelan A, 2002, `̀Assessing the impact of improved retail accesson diet in a `food desert': a preliminary report'' Urban Studies 39 2061 ^ 2082
Wrigley N,Warm D, Margetts B, 2003, `̀ Deprivation, diet, and food-retail access: findings fromthe Leeds `food deserts' study'' Environment and Planning A 35 151 ^ 188
Yen I H, Kaplan G A, 1999, `̀ Poverty area residence and changes in depression and perceivedhealth status: evidence from the Alameda County study'' International Journal of Epidemiology28 90 ^ 94
Zenk S N, Schulz A J, Israel B A, James S A, Bao S M,Wilson M L, 2005, `̀ Neighborhoodracial composition, neighborhood poverty, and the spatial accessibility of supermarketsin metropolitan Detroit''American Journal of Public Health 95 660 ^ 667
The association of neighbourhood deprivation with community resource access 2487

AppendixTable A1. Results of OLS regression analysis between deprivation and access to communityresources in urban intermediate, and rural areas of New Zealand.
Community resources b Standard Signifi- NZDep NZDep Ratioerror cance 2001 2001 quintile 5:
quintile 1 quintile 5 quintile 1
UrbanHealth (combined) ÿ0.157 0.044 0.038 1.969 1.342 0.682Accident and emergency ÿ0.912 0.188 0.017 10.751 7.103 0.661
facilityGeneral practitioners ÿ0.182 0.052 0.040 2.309 1.581 0.685Pharmacy ÿ0.179 0.054 0.045 2.450 1.735 0.708Plunketa ÿ0.212 0.035 0.009 3.694 2.845 0.770Fire station ÿ0.853 0.139 0.009 9.836 6.424 0.653Ambulance ÿ0.271 0.095 0.065 5.102 4.017 0.787
Diet (combined) ÿ0.184 0.037 0.016 1.710 0.973 0.569Food establishment ÿ0.191 0.038 0.015 1.767 1.003 0.568Supermarket ÿ0.289 0.059 0.016 3.352 2.196 0.655
Recreation (combined) ÿ0.035 0.007 0.013 1.199 1.059 0.883Parks ÿ0.038 0.009 0.022 1.235 1.082 0.876Beach 0.977 0.264 0.034 12.028 15.938 1.325Sports and leisure facility ÿ0.389 0.109 0.038 5.218 3.660 0.701
Marae ÿ0.834 0.066 0.001 8.107 4.771 0.588
Education (combined) ÿ0.119 0.021 0.012 1.487 1.013 0.681Kindergarten or day care ÿ0.138 0.023 0.009 1.708 1.155 0.676Primary school ÿ0.156 0.017 0.003 2.180 1.556 0.714Intermediate or full ÿ0.163 0.019 0.003 2.191 1.537 0.702
primary schoolSecondary school ÿ0.318 0.062 0.014 4.161 2.888 0.694
IntermediateHealth (combined) ÿ1.115 0.243 0.019 5.224 0.763 0.146Accident and emergency ÿ0.066 0.509 0.905 18.149 17.886 0.985
facilityGeneral practitioners ÿ1.358 0.283 0.017 6.423 0.992 0.154Pharmacy ÿ1.451 0.312 0.019 6.903 1.100 0.159Plunket ÿ1.436 0.371 0.030 7.723 1.978 0.256Fire station 0.651 1.025 0.570 9.667 12.272 1.269Ambulance 1.271 0.377 0.043 14.161 19.244 1.359
Diet (combined) ÿ0.812 0.182 0.021 3.881 0.632 0.163Food establishment ÿ0.836 0.179 0.019 4.050 0.707 0.175Supermarket ÿ1.353 0.309 0.022 6.456 1.043 0.162
Recreation (combined) ÿ0.388 0.073 0.013 2.390 0.838 0.351Parks ÿ0.394 0.072 0.012 2.479 0.902 0.363Beach 0.073 0.835 0.936 22.110 22.401 1.013Sports and leisure facility ÿ1.552 0.325 0.017 8.152 1.945 0.239
Marae ÿ2.081 0.145 0.001 12.281 3.955 0.322
Education (combined) ÿ0.539 0.099 0.012 2.989 0.835 0.279Kindergarten or day care ÿ0.771 0.158 0.017 4.040 0.958 0.237Primary school ÿ0.549 0.076 0.005 3.510 1.315 0.375Intermediate or full ÿ0.589 0.085 0.006 3.637 1.283 0.353
primary schoolSecondary school ÿ1.592 0.308 0.014 8.431 2.062 0.245
2488 J Pearce, K Witten, R Hiscock, T Blakely

Table A1 (continued).
Community resources b Standard Signifi- NZDep NZDep Ratioerror cance 2001 2001 quintile 5:
quintile 1 quintile 5 quintile 1
RuralHealth (combined) 1.678 0.714 0.100 11.185 17.898 1.600Accident and emergency 1.831 1.000 0.164 32.807 40.132 1.223
facilityGeneral practitioners 1.776 0.588 0.057 12.394 19.499 1.573Pharmacy 2.220 0.734 0.057 13.115 21.993 1.677Plunket 6.970 1.796 0.030 13.411 41.291 3.079Fire station 10.730 2.487 0.023 19.890 62.811 3.158Ambulance 10.117 2.251 0.021 28.137 68.607 2.438
Diet (combined) 0.038 0.431 0.935 9.386 9.538 1.016Food establishment 0.033 0.352 0.931 10.002 10.135 1.013Supermarket 2.979 1.139 0.079 10.697 22.612 2.114
Recreation (combined) ÿ0.284 0.178 0.208 4.444 3.307 0.744Parks ÿ0.253 0.180 0.254 4.456 3.442 0.773Beach ÿ5.581 0.464 0.001 43.434 21.109 0.486Sports and leisure facility 4.545 1.130 0.028 12.812 30.992 2.419
Marae ÿ2.973 0.777 0.031 24.180 12.287 0.508
Education (combined) ÿ0.551 0.093 0.010 6.592 4.387 0.666Kindergarten or day care 1.705 0.763 0.112 8.472 15.291 1.805Primary school ÿ0.602 0.104 0.010 7.059 4.649 0.659Intermediate or full ÿ0.661 0.144 0.019 7.777 5.132 0.660
primary schoolSecondary school 0.781 0.357 0.117 14.866 17.989 1.210
a Plunket is a government-funded well child service established in 1907.
ß 2008 Pion Ltd and its Licensors
The association of neighbourhood deprivation with community resource access 2489

Conditions of use. This article may be downloaded from the E&P website for personal researchby members of subscribing organisations. This PDF may not be placed on any website (or otheronline distribution system) without permission of the publisher.