Embed Size (px)
Citation preview

Working Papers
N° 10 - September 2013
Ministry of Economy and Finance
Department of the Treasury
Reforms, labour market functioning and
productivity dynamics:
a sectoral analysis for Italy
Cecilia Jona Lasinio, Giovanna Vallanti
ISSN 1972-411X
Working Papers
The working paper series promotes the dissemination of economic research produced in the Department of the Treasury (DT) of the Italian Ministry of Economy and Finance (MEF) or presented by external economists on the occasion of seminars organized by MEF on topics of institutional interest to the DT, with the aim of stimulating comments and suggestions. The views expressed in the working papers are those of the authors and do not necessarily reflect those of the MEF and the DT.
Copyright: © 2013, Cecilia Jona Lasinio, Giovanna Vallanti. The document can be downloaded from the Website www.dt.tesoro.it and freely used, providing that its source and author(s) are quoted.
Editorial Board: Lorenzo Codogno, Mauro Marè, Libero Monteforte, Francesco Nucci, Flavio Padrini, Franco Peracchi
Organizational coordination: Marina Sabatini

CONTENTS
1 INTRODUCTION ............................................................................................................................................. 2
2 THEORETICAL BACKGROUND AND EMPIRICAL EVIDENCE ................................................... 3
3 LABOUR MARKET FACTS AND LABOUR PRODUCTIVITY TRENDS ..................................... 7
3.1 Labour market reforms ......................................................................................................................... 7
4 EMPIRICAL STRATEGY AND DATA ................................................................................................... 13
4.1 Labour market reforms and industry productivity ....................................................................... 14
4.2 Labour market institutions and the reallocation component .................................................. 16
4.3 Data ......................................................................................................................................................... 18
5 ESTIMATION RESULTS ........................................................................................................................... 20
5.1 Reforms and labour productivity ..................................................................................................... 20
5.2 Reforms and reallocation .................................................................................................................. 22
6 CONCLUSIONS ............................................................................................................................................ 24
REFERENCES .................................................................................................................................................... 25
TABLES AND FIGURES ................................................................................................................................. 31


Reforms, labour market functioning and productivity dynamics:
a sectoral analysis for Italy
Cecilia Jona Lasinio, Giovanna Vallanti**
Abstract
Over the last two decades Italy registered notable improvements in the performance of the labour market both in terms of unemployment and participation. However, such improvements have been accompanied by a deterioration of productivity and competitiveness. This paper provides evidence in this respect evaluating to what extent labour market reforms might have influenced the poor productivity performance of the Italian economy over the period 1980-2008. Our results show that the increased flexibility in the use of temporary contracts has led to a lower productivity (level and to a lesser extent growth rate) in all sectors, with a higher impact on those sectors with a larger technological need for flexibility and a lower skill content. Moreover, the reforms had a negative impact on the productivity-enhancing reallocation by favoring a shift of employment towards low-productive industries. The negative effect of the reforms on the reallocative capacity is stronger in those industries with a higher flexibility need that are also the relatively lower productivity sectors in the period 1993-2008. JEL Classification: J08, J23, J24. Keywords: Productivity, Fixed Term contracts, Labour Market Institutions.
Istat and Luiss Lab.
Luiss University, Luiss Lab and CeLEG.
1

1 Introduction
In the last two decades the Italian labour market registered notable improve-
ments in terms of employment and job creation. Such results have been at-
tributed to several reforms which were adopted in the eighties and nineties to
modify labour market institutions towards a higher degree of flexibility. The
Italian labour market has been for decades one of the world’s most regulated,
with quite stringent legislation on firings. However, over the past two decades,
Italy’s labour market has undergone important reforms. Some flexibility-oriented
reforms took place in the early eighties, with the introduction of temporary ap-
prenticeship contracts (1984) and norms aimed to ease limitations to real wage
flexibility (1986). Since the early 90s a number of more substantial reforms
have been introduced which have led to some important changes in the regu-
lation of labour market by reducing employment protection levels by facilitat-
ing the use of temporary forms of employment and enhancing wage flexibility.
Such improvements towards a higher degree of flexibility, however, have been
accompanied by a deterioration in terms of productivity and competitiveness
(Codogno, 2009; Lucidi, 2008). Italian labour productivity growth started di-
verging from the trend of other industrialized countries at the end of the 1990s,
a phenomenon that does not appear to be cyclical, but a sign of a structural
deterioration of Italian competitiveness (Ciriaci and Palma, 2008; Ferrari et al.,
2007; Faini and Sapir, 2005). While the impact of labour market reforms on
labour utilisation and aggregate unemployment rate has been documented in a
number of works, the effects of such reforms on productivity (both in levels and
growth) is still an open issue. As the impact of a deregulation in both wage
setting and on labour productivity is, in principle, ambiguous, and the empirical
evidence is quite inconclusive, structural labour reforms are typically supported
on the grounds of promoting an efficient use of labour resources (OECD, 2006).
Our aim is to provide evidence in this respect evaluating from a industry
perspective to what extent labour market reforms aimed to deregulate the use of
temporary contracts might have influenced the poor productivity performance
2
2
of the Italian economy over the period 1980-2008. A number of works (OECD,
2007; Daveri and Jona-Lasinio, 2005) stressed that if the purpose of the anal-
ysis is to investigate the effects of labour market reforms on productivity and
competitiveness dynamics, the industry dimension must be considered. In fact,
while labour reforms are defined at an aggregate level, their impact is likely to
differ across industries. The sector level analysis allows to identify the effects
of labour market reforms based on the assumption that reforms impact sectors
differently according to their technological characteristics i.e. the industry in-
trinsic need for reallocation (Cingano et al., 2010). Moreover we exploit the
industry dimension of our database, to assess the impact of reforms on the ag-
gregate productivity by looking at the change in productivity within sectors as
well as by assessing the role of structural shifts across sectors.
The paper is organized as follows. In the next session we discuss the the-
oretical motivations and previous empirical evidence. In session 3 we report
some stylized facts. In session 4 we discuss the empirical strategy and session 5
reports the results, Session 6 concludes.
2 Theoretical background and empirical evidence
From a theoretical point of view, the impact of labour market reforms on pro-
ductivity (both in levels and growth) is an open issue. Several authors argued
that labour market reforms aimed to increase labour utilization may, at the
same time, reduce productivity growth (Boeri and Garibaldi, 2007; Dew-Becker
and Robert J Gordon, 2008) due to the entrance in the market of the marginal
workers (e.g. low skilled workers) and the creation of low productivity jobs
(thereby reducing the average quality of the labour supply), or simply because
of the presence of diminishing return to labour for a given capital stock (the so
called composition effect in Bassanini and Venn, 2008; Nickel and Bell, 1996).
The presence of composition effects does not necessarily mean that the produc-
tivity of incumbents (jobs and workers) cannot benefit from a more flexibility
in the labour market. In fact, any slowdown in average labour productivity
3
3

resulting from a change in employment is, by far, a statistical artefact and does
not imply that individual productivity has fallen (OECD, 2007).
Labour market regulation can directly affect workers productivity through
several channels: it may (1) influence the incentives for workers and firms to in-
vest in training or education and then affect the composition of human capital;
(2) improve the quality of job matching and increase the efficiency of labour re-
source allocation; (3) encourage the movement of resources between declining or
emerging firms/industries/activities by helping firms respond quickly to changes
in demand or technology; (4) reduce social conflict by influencing workers’ will-
ingness to align their behaviours with their employers’ targets; and (5) make
labour more expensive and then influence the direction of technological change.
This implies that it is, in general, difficult to establish whether the regulation
affect the level of productivity, its growth, or both, and in which direction.
In general, labour market regulation affect the capacity of the economy to
allocate resources efficiently by imposing limitations to the adjustment of both
quantities (employment adjustments) and wages.
Regarding the allocative effects, a key role is played by the employment
protection legislation (EPL) whose effect on labour market productivity is am-
biguous from a theoretical point of view. On the one hand, stringent EPL is
an obstacle to the reallocation of workers and jobs across firms and sectors
(Hopenhayan and Rogersons, 1993; Poschke, 2007), reduce the propensity to
undertake risky activities (Bartelsman and Hinloopen, 2005), reduce workers’
effort (Ichino and Riphahn, 2005) with a negative impact on overall productiv-
ity. On the other hand strict protection for regular workers may promote specific
investment by firms and workers and result in more learning by doing with a
positive effect on productivity (Belot et al., 2007). Moreover partial EPL re-
form via the introduction/liberalization of temporary forms of employment has
an ambiguous effect on productivity depending on the reasons why firms em-
ploy temporary workers rather than permanent workers. In principal the use
of temporary workers as buffer stocks increases job instability and uncertainty
inside the firm, reduces investment in training, lowers workplace cooperation
4
4

and workers’ motivations and harms long-run growth prospects (Blanchard and
Landier, 2002). Morover the availability of temporary contracts may have a
positive effect on job creation (due to a reduction in the expected labour costs)
and a negative (temporary) effect on the average labor productivity as a conse-
quence of decreasing marginal returns on labour (Boeri and Garibaldi, 2007).1
On the contrary, temporary contracts used as screening devices generate better
growth prospects due to better learning about the quality of the match and
lower incentive to shirking for temporary workers. This may translate into bet-
ter job matches and, therefore, more stable and productive employer-employee
relationships in the long run (Portugal and Varejao, 2009).
The empirical evidence on the effect of EPL on productivity is quite incon-
clusive. In fact, depending on the cross-country/industry approach used and
the sample of countries considered in the analysis, results suggest both positive
and negative effects. Nickell and Layard (1999) reckoned that ‘there seems to
be no evidence that either stricter labour standards or employment protection
lowers productivity growth rates. If anything, employment protection lowers
productivity growth if it is associated with other measures taken by firms to
enhance the substantive participation of the workforce’.
In order to overcome the identification problem arising from cross-countries
regressions on aggregate outcomes, many authors exploit both variation in the
regulation across countries/time and the differences in the impact of the regula-
tion in different sectors. Using firm data for a panel of 14 European countries,
Cingano et al. (2010) find that EPL reduces labour productivity in high real-
locative sectors relative to low reallocative sectors. Their result, however, is not
robust to the exclusion of the UK in the sample. Scarpetta and Tressel (2004)
analyse the effects of employment protection law and centralized bargaining on
firm productivity and dynamics using harmonized data for 17 manufacturing
1Winfried and Prat (2007) show that EPL has quite different effects across worker and firm
types. Their results suggest that less skilled individuals are more affected by strict EPL in
terms of a lower quantity of employment. Similarly, EPL seems to drive small or less efficient
firms out of the market.
5
5
industries in 18 OECD countries, and conclude that strict employment pro-
tection law has a significant negative impact on productivity only in countries
with an intermediate degree of centralisation /coordination in wage bargaining.
Bassanini et al. (2009) examined the dynamic impact of EPL on productivity
growth using annual cross-country aggregate data on the degree of regulations
and industry-level data on productivity from 1982 to 2003 on 11 OECD coun-
tries. They find that dismissal regulation have significant negative impact on
total factor productivity. Autor et al (2007) focus on the US case and, by ex-
ploiting firm level data, find that an increase in employment protection reduces
TFP. A similar result is provided by Cingano et al. (2008) for Italy.
Regarding the effects of temporary contracts on productivity, a number of
authors attributed the rather poor labour productivity performance of two tier
countries in the last decade, to compositional factors, such as inflows into em-
ployment of low skilled workers (Daveri, 2004). With regard to the Italian case,
there are a number of recent empirical works which try to assess the effects of
temporary contracts on productivity using information at a firm level. Using
a panel of Italian firms, Boeri and Garibaldi (2007) find evidence of a negative
correlation between temporary employment and productivity implied by their
model. Differently, Addessi (2012) suggests that the negative effect of tempo-
rary employment on productivity dynamics may be persistent since it affects
not only workers’ productivity but also their contribution to firm productivity
growth. Finally Cappellari et al. (2012) exploit regional and industry differences
in the timing of reforms in the legislation of fixed-term and apprenticeship con-
tracts in Italy and find evidence of a negative effect of temporary employment
on productivity.
Labour market (de)regulation may also affect firms/workers incentives and
the reallocation of resources in the economy through the determination of wages.
More centralized/coordinated wage-bargaining systems reduce the responsive-
ness of industry and firm-level wages to industry price and productivity devel-
opments (Holmlund and Zetterberg, 1991; Teulings and Hartog, 1998) with a
negative effect on allocative efficiency. On the other hand, in decentralized wage-
6
6

bargaining regimes, incentives to innovate and adopt new technologies depend
crucially on workers’ bargaining power. The risk of hold-up can be partly miti-
gated when bargaining occurs at the national level (or at the industry level but
with economy-wide coordination)2 and sets the general frame of the wage sched-
ule (Teulings and Hartog, 1998). From an empirical point of view, Acemoglu
and Pischke (1999b) find some evidence of more firm-sponsored training in more
coordinated countries with potentially negative effects on productivity growth.
Moreover, empirical evidence suggests countries with coordinated industrial re-
lations systems and relatively stringent employment protection have stronger
technological comparative advantage in industries characterized by cumulative
technological progress than countries with decentralized wage bargaining, no
coordination and low EPL (Bassanini and Ernst, 2002).
3 Labour market facts and labour productivity
trends
3.1 Labour market reforms
The process of liberalisation of the Italian labour market was gradual and oc-
curred as a sequence of incremental reforms started in the early 1980s (see Table
1).
TABLE 1AROUND HERE
The first wave of reforms can be dated back to the mid-80s with the intro-
duction of the first norms aimed to regulate the use of part time (1983-84) and
training/work contracts (1984)3 and norms aimed to reduce the wage indexa-
2An industrial relations system can be said to be coordinated when: i) the wage-bargain
occurs in a centralized way or co-ordination among employers and/or trade unions sets a
uniform band of wages; ii) employers and trade unions co-operate as regard to decision-
making inside the firm; and iii) business associations have an active role in solving free-riding
problems across firms (Carlin and Soskice, 1990).3Training/work contracts are temprary working arrangements (max. two years) under
which an employer assumes a young workers (aged 15 to 32), combining ad hoc training
7
7
tion (1986). However, it is in the early 90s that the deregulation process had
a substantial acceleration partly triggered by the economic and political crisis.
In 1991 a new law specified the procedures for collective firing, and it set new
limits to the use of the “Cassa Integrazione Guadagni”.4 The following year
the automatic indexation of wages to inflation (Scala Mobile) was definitively
abolished. In 1993, the so-called Giugni agreement between the government,
the unions and the employers’ associations introduces a comprehensive reform
of wage bargaining in order to reduce inflation and to achieve higher wage flex-
ibility. The aim of the agreement was to allow for regional differences (without
excluding national coordination) in productivity levels and make wages more
responsive to firms/individuals’ performance and skill levels. The new collec-
tive bargaining structure was organised on two levels: national (centralised)
level for the adjustments of wages to inflation dynamics and firm/regional level
for the regulation of productivity-related pay schemes. In 1997, a series of re-
forms by Labour Minister Treu (“Pacchetto Treu”) formalised the evolving flex-
ibility arrangements in the Italian productive sectors. The reforms eased the
regulation of apprenticeship schemes, part-time employment, and temporary
contracts. Moreover they introduced private temporary work agencies, which
even if rather limited in scope, introduced modern job matching services in an
environment dominated by an inefficient public employment service. The use
of fixed-term (interim) work arrangements, albeit subject to conditions such
as restricting their application for low-skilled workers, boomed in subsequent
years. In 1999, the rules concerning the use of interim contracts for unskilled
cycles and work in the workplace.4A peculiar feature of Italian labour market is the limited scope of the unemployment
insurance. Unemployment benefits in Italy are traditionally low and available to a limited
number of workers. Workers in large manufacturing however can benefit of a short-term wage
replacement benefits known as “Cassa Integrazione Guadagni” (CIG).The CIG was originally
introduced by a private agreement between employers’ associations and unions and it is based
on private and government contributions. It provides benefits proportional to wages in case
of an involuntary reduction in working time or temporary layoffs. Peculiarly, workers who
benefit of CIG, are nor regarded as unemployed even in case of total suspension of activity.
8
8

jobs were eased (this condition having been largely ignored in any event). Fi-
nally in mid-2001, the new government extended the possibility and terms for
use of temporary contracts, aligning Italy with EU directives. In 2003, “Biagi
Law” reinforce some of the measures already introduced with Treu reform. It
allowed private employment agency to compete with public ones on wider range
of services, extended the use of staff-leasing contract and regulated the use of
part-time work and non-standard forms of employment relationships.
In Table 2, we report the indicators for labour market institutional settings
in the three periods of major reforms (as identified above) and in the pre-reform
years.5
TABLE 2 AROUND HERE
The table shows two indicators of job protection: employment protection
of regular workers (i.e. workers with open ended contracts) and employment
protection on temporary jobs. The index of employment protection on regular
workers includes legal restrictions on dismissals and the extent of compensa-
tions in case of redundancy. Employment protection on temporary contracts
concerns the rules and limitations in the use of temporary forms of employ-
ment. Regarding the institutional framework governing the wage bargaining
system, the indicators reported in Table 2 consider two dimensions: the degree
of centralization of the bargaining process and the extent of coordination across
the social parties (unions, the employers’ associations and the Government).
Overall, information reported in Table 2 shows a clear trend toward a higher
degree of labour market liberalization both in the use of flexible forms of em-
ployment and in the decentralization of the bargaining process. Two facts are
noteworthy. First, the reforms appear to have provided flexibility through the
liberalization of the use of temporary form of employment rather than the relax-
ation of employment protection for permanent workers. In fact, the firing rules
on regular contracts have remained unchanged over the period. Conversely, the
5Labour market institutional indexes and the share of temporary contracts are from OECD
(2008, 2004) and from ICTWSS database, Visser (2007). See note on Table 2 for detailed data
descriptions.
9
9
regulation of temporary contracts was eased with the consequence of increasing
the share of temporary employment by almost 6 percentage points since the
beginning of the reforms process (column 3). Second, the decentralization of
wage bargaining, formalized with the Giugni agreement in 1993, has been ac-
companied by an increase in the coordination across the social parties, which
has resulted in a change in the industrial relations environment and led to a
period of “institutional” wage moderation.
As the labour market became more flexible, its performance improved markedly.
During the 1995-2000 period, participation and employment rates rose by 212
and 3 percentage points, respectively, partially reversing the trends earlier in
the decade, while three-quarters of the total employment growth was registered
in 1998-2000. A strong initial expansion of “atypical” work contracts, i.e. part-
time and fixed-term, tended to favour women, youths and unskilled workers.
The rise in female participation and employment rates (by 4 percentage points
each) was particularly steep and the employment rate of youth (25-30) increased
by 3 percentage points since 1997. Regarding the composition of the labour force
by education attainment, data show an increase in the employment rate of low
and middle skilled workers (by 2 and 3 percentage points) since the 1997 Treu
Reform, while the employment rate of skilled workers has declined by almost 3
percentage points.6
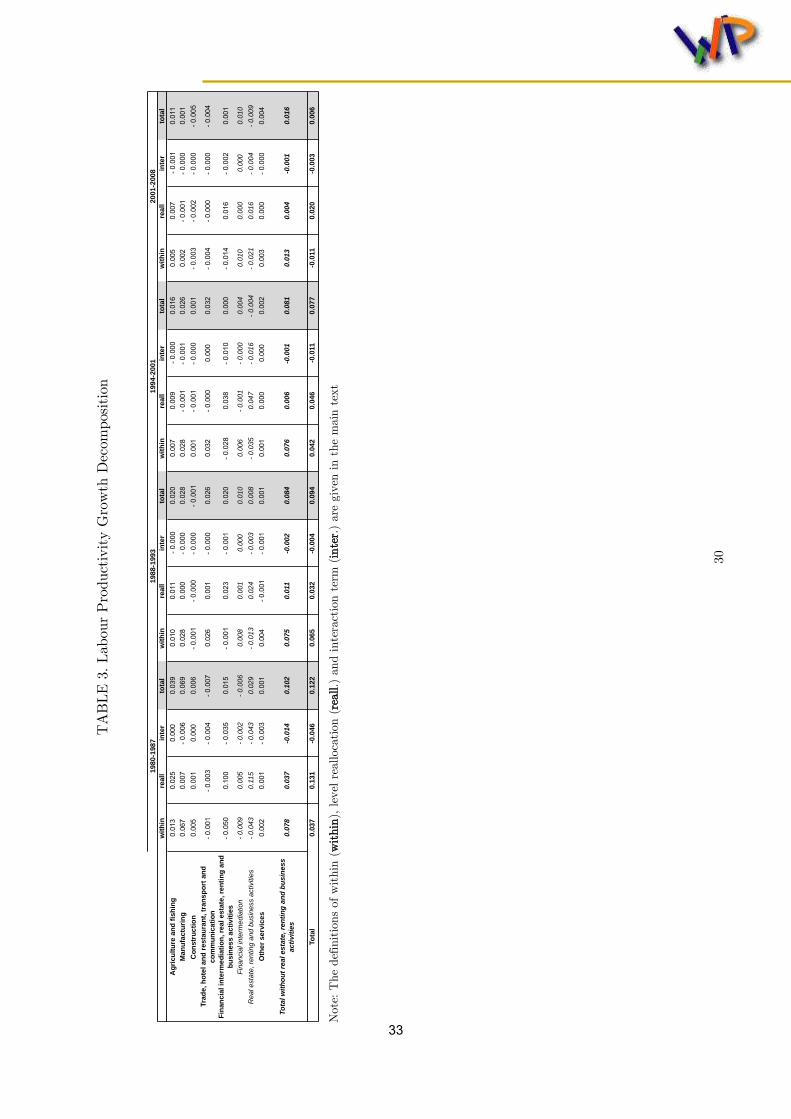
3.1.1 Labour productivity growth decomposition
In this section we provide descriptive evidence of the decline of Italian labour
productivity growth over the last thirty years, focusing on the three periods of
relevant labour market reforms outlined above.
As a first step, we investigate whether the declining labour productivity
trend over the whole period is the result of insufficient resource reallocation
away from slow-growing industries or if instead is the consequence of the loss of
6The educational attainment concerns the highest level of education or training successfully
completed. ‘Low’ refers to ISCED 0/1/2, ‘medium’ refers to ISCED 3, and ‘high’ refers to
ISCED 5/6/7 (Source: Eurostat, 2010).
10
10

dynamism of industries which used to grow fast in the past. We start decompos-
ing aggregate labour productivity growth into the contribution of each industry
taking into account three different effects: within industry, level reallocation
and interaction effects.
To this end we resort to the decomposition by Foster, Haltiwanger and
Krizan (2001). That is as follows:
LPT − LP0
LP0=
∑j
wj0 (LPjT − LPj0)
LP0+
∑j
∆wjT (LPjT − LP0)
LP0(1)
+
∑j
∆wjT [(LPjT − LPj0) (LPT − LP0)]
LP0
where LPjt is the level of labour productivity in industry j (aggregate if
industry index is missing) at time t (t = T, 0), wjt is the employment share
in industry j at time t and ∆wjT is the change in the share of employment in
industry j between time 0 and T . The first summation on the right-hand side
is the within effect (namely, the intra-sectoral effect), the second summation is
the level reallocation effect and the third summation is the growth reallocation
effect (these two last summations account for a structural-change effect). The
jth component of the three pieces of the equation above represents the overall
contribution of industry j to aggregate productivity growth. By means of this
decomposition the observed reallocation effect is referred only to the shift of
workers between industries.
The decomposition was carried out for four time periods (1980-1987, 1988-
1993, 1994-2001 and 2001-2008) resorting to ISTAT - National Account data at
2digit sectoral level. Labour productivity is measured as value added per FTE
employed person. The results of the decomposition are reported in Table 3. The
results show that the cumulated growth of labour productivity over the period
1980-1987 was slightly above 12 percent, decreased a bit both in 1988-1993 (9.4
percent) and in 1994-2001 (7.2 percent) and declined sharply to 0.6 percent in
2001-2008 (Table 3).
TABLE 3 AROUND HERE
11
11
The reallocative component accounts for the bulk of productivity trends in
three periods out of four. The reallocative effect grasps the gain (or loss) in
aggregate labour productivity stemming from a rise (or fall) in the employment
share of an industry with productivity levels higher (lower) than the national
average. The data indicate that there was a significant shift of employment
away from less productive sectors to higher productivity industries with the
exception of the last period, when the within (negative) effect dominates. Be-
tween 1980 and 1987, aggregate productivity was driven by manufacturing sec-
tor contributing for 6.9 percentage points and by agriculture for 3.9 percentage
points. Services accounted only for 0.8 percentage points. In the following pe-
riod, instead, the service sectors as a whole contributed for the largest share of
aggregate productivity accounting for 4.6 percentage points while manufactur-
ing contributed for 2.8 percentage points. The role of the manufacturing sector
was entirely of the within type while the contribution of the services is more
mixed with Trade accounting for a within effect of 2.6 percentage points and
Financial services for a reallocation effect of 2.0 percentage points. This is the
result of the reallocation of manufacturing employment away to other industries
or to the unemployment pool at a rate of 2.5 percent over the period (Figure
1). On the contrary, employment in business services grew by 7.2 percent in
1988-93, absorbing both agriculture and manufacturing employment.
In 1994-2001, as shown in table 1, four labour market reforms entered into
force giving full legal recognition to different contractual forms of part-time and
temporary jobs. In the same period, labour productivity growth slowed down a
bit and it was driven by a positive reallocative component in business services
and a comparable positive within component in both manufacturing and trade.
However, once real estate has been taken away from the business services, the
reallocation effect becomes smaller and the within component turns to be the
driving component of labour productivity growth.7
7As suggested by OECD in its productivity measurement guidelines, real estate has to
be excluded because a significant proportion of its value added consists of ”Imputed rent of
owner-occupied dwellings”. Since this is a pure National Accounts imputation with no buyers
12
12

In 2001-2008, labour productivity growth fall down to 1.6 percent as the
result of a negative within component accounting for -1.1 percentage points,
because of the zeroing of manufacturing contribution (0.2 percentage points) and
of the negative sign of the contribution from market services (-1.8 percentage
points). On the other hand, the reallocation component counterbalances these
effects providing a positive contribution of 2.0 percentage points. Here we might
catch the effect of the extension of the use of temporary contracts that allowed
more competition between private and public agencies on a larger variety of
services. This might be one of the potential explanations for the still increasing
employment share (3.5 per cent over the period) in the business service sectors
(Figure 2).
FIGURE 1 AROUND HERE
Our industry decomposition indicates that the productivity slowdown is of
a within type associated with a declining reallocation effect over the whole
period. Daveri and Jona Lasinio (2005) found that over the period 1995-2003
the productivity slowdown was mainly driven by a within effect in manufacturing
and by a reallocative effect in market services.
4 Empirical strategy and data
The aim of the empirical analysis is to assess the impact of the labour mar-
ket reforms introduced in Italy in the last three decades on aggregate labour
productivity level and growth. The effect on the level of productivity is mainly
a compositional effect due to the fact that the availability of temporary con-
tracts facilitate the entrance of marginal workers in the market (unskilled and
low skilled workers) and the creation of jobs with a low skill content. The
growth effect may be induced either by a decline in the industry productivity
growth, i.e. the within component in equation (1), for the reasons we discussed
and sellers nor any associated labour input, the inclusion of ”Real Estate Activities” can
distort productivity measures; particularly as volume growth of owner-occupied dwellings is
differs from that for other business services, (OECD, 2005).
13
13

extensively in the previous section or by a change of the relative importance
in the economy of low productive industries, i.e. the reallocative component
in (1). As institutional indicators, we consider the evolution of an index for
employment adjustment costs (namely the EPL index on temporary contracts
elaborated by the OECD) and we take into account also two indicators of the
wage bargaining regime, capturing the level at which wage bargaining occurs
(being centralised, intermediate or decentralised at firm level) and the degree of
coordination amongst employers representatives and unions.
The empirical analysis develops in two main steps. In the first step we
evaluate the impacts of the changes in the labour market institutions on industry
performance looking at both productivity level and growth effects. In the second
step we focus on the growth effect and we estimate the impact of labor market
reforms on the rate of growth of aggregate productivity which may occur through
the industry reallocative component.
4.1 Labour market reforms and industry productivity
Our empirical approach follows the difference-in-differences technique first pro-
posed by Rajan and Zingales (1998). The basic idea is to exploit the fact that
labour market reforms which were common to all sectors, may have had a dif-
ferent impact according to industry characteristics. In particular, the effect of
reforms towards a higher degree of flexibility may be stronger in sectors with
a higher need of flexibility (i.e. sectors where the frequency or incidence of
the adjustments of the labour force are larger because of their technological
characteristics).
In line with a number of labour studies adopting the Rajan and Zingales
approach (Micco and Pages, 2004; Bassanini et al., 2009 ; Cingano et al., 2010),
we use job reallocation rates computed at industry level for a frictionless labour
market (in our specific case for the UK) as a proxy for the “intrinsic flexibil-
ity need”. The underlying assumption is that, in a deregulated environment,
labour reallocation is mainly driven by country-invariant industry-specific fac-
14
14
tors such as the technological characteristics of the production processes and
the dynamics of the global demand for the industry. Following this approach
we are able to differentiate the effect of reforms according to the intrinsic real-
locative characteristics of each sectors and estimate more precisely their impact
on productivity over the sample period.
We also interact our indicators of labour market reforms with a dummy
which identifies sectors with a larger endowment of high skilled workers in order
to capture differences in the impact of reforms according to the characteristics
of human capital or the skill content of the jobs. Our assumption is based on
the theoretical (and empirical) result that firms respond differently to a dereg-
ulation in the use of fixed-term contracts, depending on the types of jobs they
create. For jobs in which a good match with the worker entails a large gain in
productivity (the “high skilled” jobs), firms use fixed-term contracts to screen
workers, allowing them to experiment without paying a high dismissal cost if
the worker is not a good match. In this case a deregulation of fixed-term con-
tracts would be beneficial in terms of productivity gains. For jobs in which
match quality is less important (mainly in low-skilled sectors), fixed-term con-
tracts provide flexibility against potential productivity shocks or a reduction in
labour costs, implying a substitution between temporary and permanent forms
of employment.8
Finally, we also distinguish between manufacturing and services in order
to verify whether and to what extent labour market reforms may explain the
differences in the productivity trends observed since the late 90s.
We then estimate the following linear regression model:
Yjt = Ztρ+ (Zt × secj)ψ +Xjtς + λi + εit (2)
Where Yit is labour productivity (both in level and growth rate) of sec-
tor j at time t; Zt are time-varying indexes of labour market institutions
8Empirical evidence of the relevance of human capital in determing the conversion of tem-
porary contratcs into permannet ones is provided in a number of papers, among the others
Casquel and Cunyat (2004) and Guell and Petrongolo (2007) for Spain, and Booth et al.
(2000) for the UK.
15
15
(EPL on temporary contracts, centralization index and coordination index);
secj = man, hs, ejr are sector (time invariant) characteristics (namely a dummy
for manufacturing sectors, a dummy for high skilled sectors and an index of in-
trinsic job reallocation respectively). The Xjt are sectoral specific characteris-
tics (among the other an industry-specific time trend) and λi are industry fixed
effects. Equation 2 allows better identifying the effect of Zt on Yjt, exploiting
variability at the sector-time level. In equation 2, the parameter ψ measures the
differential effect on productivity across industries (for example the difference
between sectors characterized by a high degree and a low degree of intrinsic
needs of reallocation) originated by a change in the institutional variable, while
ρ represents the main effect of a change in the labour market regulations on
productivity9.
4.2 Labour market institutions and the reallocation com-
ponent
In the next step, we aim to assess whether the labour market reforms affect
positively the reallocative component of aggregate productivity by enhancing
labour reallocation in favour of relative more productive sector or, conversely,
the effect is negative by increasing job creation in sector relatively less produc-
tive. Following Brown and Earle (2004, 2006), we can express the reallocative
component in equation (1) as a covariance between the change in the employ-
ment share of sector j and the productivity gap of sector j with respect to the
average as follows:∑jt
∆ωjt(LPjt−1 − LPt−1) = ncov(∆ωjt, LPjt−1 − LPt−1) (3)
From equation 3,we then compute the average reallocative component over
the sample period as the coefficient β from the following OLS regression:
∆ωjt = α+ βDjt−1 + ωjt (4)
9We also estimate a set of specifications in which we substitute the industry invariant
institutional endex with year dummies in order to check the robustness of the results.
16
16
where Djt−1 =
LPjt−1−LPt−1
nV ar(LPjt−1−LPt−1)is the productivity gap at time t − 1
normalized by (n times) the sample variance (normalized productivity gap) and
n is number of sectors.
In equation (4), β̂ can be interpreted as the average responsiveness of the
industry size adjustment to its relative productivity, scaled so that the respon-
siveness is measured in terms of its overall contribution to aggregate productivity
growth: if market works well to reallocate resources towards more productive
sectors, then β̂ (the overall reallocative component) will be high, while if the
reallocation process is sclerotic, β̂ will be low.
This specification allows us to express the reallocative component as a func-
tion of institutional indicators and sectoral characteristics (i.e. manufacturing
production; intrinsic JR index; human capital endowment) in order to estimate
the impact of changes in the institutions on the extent of productivity-enhancing
reallocation.
We first estimate the following specification:
∆ωjt = βDjt−1 + δ(Djt−1 × secj) + λ t + λi + υjt (5)
where λt and λi are year and country dummies.
In specification (5) the first derivative with respect to Djt−1 is an expres-
sion of the reallocative component, while the coefficient δ captures the differ-
ence in the reallocative contribution to aggregate productivity growth of sectors
with different characteristics (e.g. if secj is 1 for manufacturing and 0 for non-
manufacturing, β and β + δ represent the average reallocative contribution to
aggregate productivity over the sample period of non manufacturing sectors and
manufacturing sectors respectively)
Finally, we run a fully interacted model, including interactions between
Djt−1, secj and the (time-variant) institutional indicator Zt in order to cap-
ture the effect of the change in the institutional framework on the reallocative
component in sectors with different characteristics.
17
17
The empirical specification is the following:
∆ωjt = β + δ(Djt−1 × secj) + (Djt−1 × Zt)η + (6)
+(Djt−1 × Zt × secj)ξ + λ t + λi + υjt
Hence, we in principle allow for the effects of Zt on the reallocative compo-
nent of the aggregate productivity to differ according to sectoral characteristics.
If we now take the derivative of (6) with respect to Djt−1, we obtain an
expression of the reallocative component
∂∆ωjt
∂Djt−1= β + δ secj +Ztη + (Zt × secj)ξ (7)
which now depends both on Zt and industry characteristics. Our primary
interest relates to the marginal effects of Zt on the reallocative component,
hence to the partial derivative of (7) with respect to Zt expressed as
∂2∆ωjt
∂Djt−1∂Zt= η + ξ secj (8)
Let us concentrate on the impact of Zt on sectors with different flexibility
need by assuming that secj represents the extent of intrinsic job reallocation
of sector j. Hence η < 0 and ξ < 0 imply that the higher the flexibility need,
the stronger the negative effect of the deregulation of temporary employment
on the reallocative contribution to aggregate productivity.
4.3 Data
Productivity is measured as industry valued added per employment (full time
equivalent) using data available from ISTAT National Accounts at a two digit
industry classification while information on skill composition at industry level
are provided by the EUKLEMS database. Our analysis is focused on the non
agricultural business sectors. For this reason we exclude industries characterized
by a large share of public employment such as health care service and educa-
tion. We also exclude energy and utility, real estate, and renting and business
activities. Our final sample includes information for 18 industries over a period
of 27 years (1980-2008).
18
18

Aggregate data on EPL and the wage bargaining centralization index are
from OECD database (OECD, 2007). The EPL indicator considered in the
analysis is the index of the regulation of temporary contracts and available form
1982 to 2008. The index of the degree of centralization of the wage bargaining
system is available from 1982 to 2004.10 The index for coordination of wage
bargaining is taken from the ICTWSS Database compiled by Visser.11
Finally the data on gross job reallocation for the UK (the frictionless econ-
omy) are taken from Messina and Vallanti (2007) job flows database, which
provides cross-country comparable job flows statistics for 13 EU countries over
the period 1990-2001.12 The UK appears a natural benchmark because the UK
labour market is much less regulated in comparison to other OECD countries.
Previous works have used gross job reallocation (the sum of creation and de-
struction rates) as a measure of reallocation intensity within a given sector in
order to capture the simultaneous creation and destruction of jobs in a given
period of time. However, sectors which are experiencing large changes in em-
ployment (either positive or negative) may be characterized by high gross job
reallocation rates without any simultaneous creation and destruction of jobs.
10We extrapolate the OECD index of the degree of the centralization for the years 2004-2008
in order to cover all the period. Results do not change significantly.11The ICTWSS database (Database on Institutional Characteristics of Trade Unions, Wage
Setting, State Intervention and Social Pacts ) covers four key elements of modern politi-
cal economies in advanced capitalist societies: trade unionism, wage setting, state interven-
tion and social pacts. The database contains annual data for 34 countries for the period
1960-2008. Data and a description of the content of the database are publicly available on
http://www.uva-aias.net/208.12Following Davis and Haltinwanger (1990), the job reallocation rate for sector j and year t
is costructed by summing up the absolute changes in employment nomalized for the firm size
over all the firms i in a given sector j
JRUKjt = 2iεj
|nijt − nijt−1|niijt + nijt−1
The excess job reallocation is then calculated by subtracting the net employment change
at industry level and in each year. Finally we take the average of the excess job reallocation
over time and obtain the index ejrj
19
19
In order to circumvent this difficulty, we consider a closed related measure of
reallocation which is the excess job reallocation. Excess job reallocation is cal-
culated as the difference between gross reallocation and the absolute value of
the net employment change and captures the reallocation over and above the
amount necessary to accommodate changes in the sectoral employment over a
given period of time.13
5 Estimation results
5.1 Reforms and labour productivity
We start evaluating the effects of the labour market reforms on productivity
by estimating the impact of labour market deregulation on labour productivity
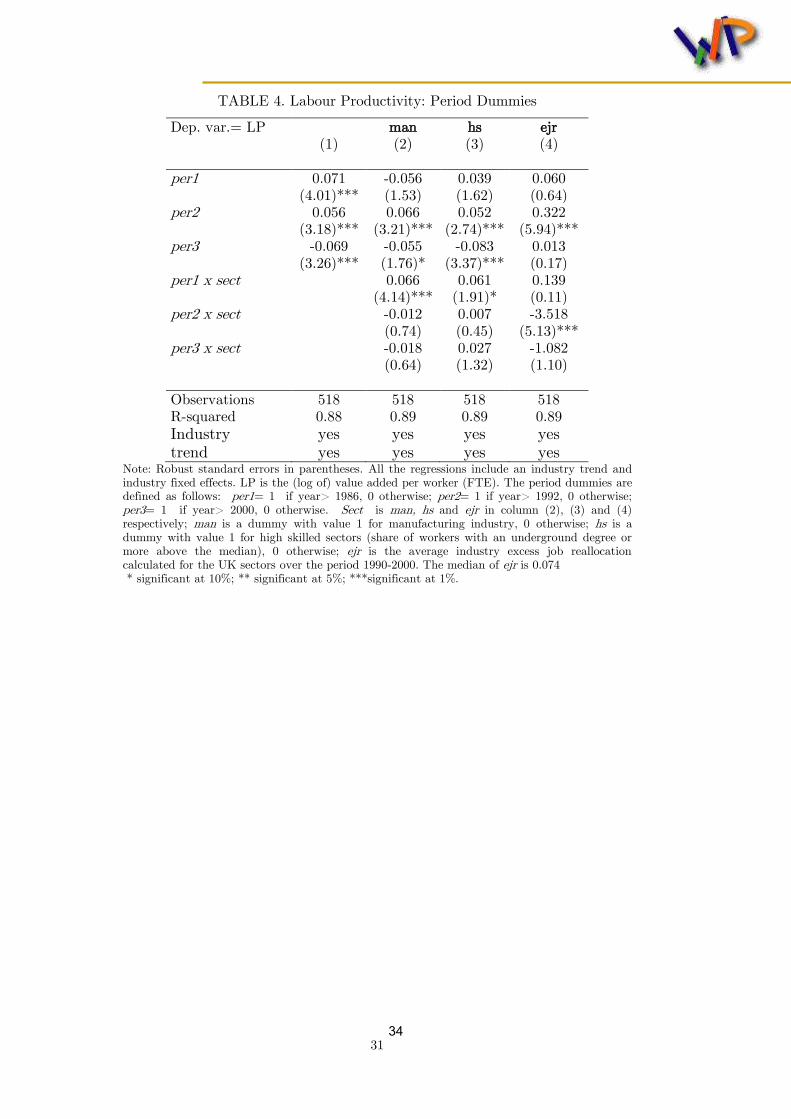
at the industry level. As a preliminary evidence in Table 4 we report the re-
sults of a simple regression in which labour productivity (in log) is regressed on
three dummies, one for each period of major reforms as discussed in the previ-
ous sections, in order to capture any significant change in the trend of labour
productivity over the period.
TABLE 4 AROUND HERE
We also interact the reform period dummies with the industry characteristics
(manufacturing, high skilled and index of reallocative need in columns 2, 3 and 4
respectively) to detect any differential in labour productivity in different sectors.
In all specifications we include also a trend variable in order to control for
common patterns of productivity across industries over the period of analysis.
The results in Table 4 show that during the first period and second period
of reforms productivity increased significantly especially in manufacturing and
high skilled sectors. The trend appears to reverse in correspondence with the
third wave of reforms, starting from the beginning of 2000s, especially in sectors
13In our sample the cross sector correlation of gross employment reallocation and excess
employment reallocation is 0.89. Results obtained using gross job reallocation as an indicator
of “sectoral intrinsic flexibility” are qualitatively and quantitatively similar and are available
from the authors under request.
20
20

with a lower skill content. Interestingly, the increase in labour productivity
registered during the second period of reforms is less strong in high-reallocative
sectors which should have been more affected by the liberalization and the trend
reverses dramatically in the high reallocative sectors in last period.
In order to better assess the effect of changes in the labour market institu-
tional settings, we estimate a second set of regressions (Table 5) substituting
the period dummies with the indicators for employment protection legislation
on temporary contracts (EPL), wage bargaining centralization (CENT ) and
coordination (COOR).14
TABLE 5 AROUND HERE
The results unambiguously show that labour productivity is negatively af-
fected by a relaxation of the rules governing the use of temporary contract.
Such negative effect is smaller in high skilled sectors, and becomes quantita-
tively stronger in sectors with a higher intrinsic reallocation. The marginal
effect of reducing the EPL index by 1 unit ranges from -2.5% for the sector at
10th percentile of the distribution of the “flexibility need” (Transport, storage
and communication with an ejr index equal to 0.066) to -4% for the sector at
the 90th percentile (Manufacture of electrical and optical equipment with an
ejr index equal to 0.089). The magnitude of the effects is not negligible, and
lies around 6% of the difference in labour productivity of high relative to low-
reallocative sectors over the period considered. Interestingly, looking at the wage
bargaining institutional framework, the process of decentralization appears to
have led to a significant increase in labour productivity in sectors which employ
a larger share of high skilled workers. The effect is significant and accounts for
almost 3 percentage points of the differences in productivity level in favour of
high-skilled sectors.
The impact of labour market institutions on productivity growth appears to
14As a robustness check, we run the same regression by substituting the institutional in-
dicators (which are time variant but common to all sectors) with time dummies in order to
capture common industry shocks. The coefficients on the interaction terms in column (2) to
(4) are not significantly affected once we remove the main effect.
21
21
be less neat (see Table 6 and Table 7). In general, the first period of reforms
registers a slight increase in the growth rate of productivity in services and low
reallocative sectors, while productivity growth declines in the third period of
reforms. When we consider the impact of specific institutional indicators, a
larger degree of flexibility in the use of temporary forms of employment (lower
EPL) has no significant effect on the rate of growth of productivity in high a
low reallocative sectors.
Finally, in Tables from 8 to 11 we explore the effects of the reforms on capital
deepening (level and growth). The results in Table 9 and Table 11 show that the
decrease in EPL on temporary contract reduces the capital labour ratio in the
high job reallocation industries, implying substitution of capital for labour in
sectors where the impact of the reforms is expected to be stronger. This result
is in line with the theoretical prediction that a reduction in labour costs (which
is a consequence of the liberalization in the use of temporary contracts) imply a
substitution of capital with more labour, and then a decline in capital deepening.
Interestingly, the results shows that the positive effects on productivity of the
decentralization of the bargaining process in high skilled sectors goes through
an increase in the use of capital stock relative to labour input.
5.2 Reforms and reallocation
Here we look at the results of the second set of our estimates aimed at investigat-
ing the impact of institutional changes on the extent of productivity-enhancing
reallocation. First, we test whether there are differential effects of reallocation
according to some industry characteristics and then we look also at the impact
of labour market reforms. Table (10) reports the results for the aggregate av-
erage reallocation effect as in the empirical specifications (4) and (5) . Column
(1) shows that at the aggregate level, the average reallocation contribution is
positive and significant and it accounts, on average, for 0.04 pp of yearly labour
productivity growth. The reallocation effect is instead negligible in manufactur-
ing confirming the major role of the within effect that drove the manufacturing
22
22

contribution to labour productivity growth over the whole period (Table 3). The
reallocation is not related with the industrial skill content since the coefficient
in table (10) column (3) is not significant. In column (4) we test whether the
productivity-enhancing reallocation has a different impact on aggregate produc-
tivity according to the degree of flexibility needs across sectors. The coefficient
of the interaction term is negative and significant at 5 percent indicating that in
those industries where the flexibility need is higher the reallocative component
contribute less to the aggregate productivity growth.
Table (11) reports the complete set of estimates of equation ( (6) to test
the link between institutions and the productivity-enhancing reallocation tak-
ing into account some industry characteristics. Column (1) shows that at the
aggregate level, EPL does not have any impact on the reallocative contribution
to aggregate productivity while the decentralization of the wage bargaining pro-
cess appears to negatively affect the reallocative component. Column (3) reports
the results for manufacturing as opposed to services. The EPL interaction coef-
ficient is positive and significant indicating that a lower regulated labour market
(lower EPL) reduces the reallocative contribution of services while it does not
have any impact on manufacturing. Then, column (5) shows that the industry
reallocative responsiveness to institutional reforms does not depend on the sec-
toral human capital endowment. Finally, the decline of EPL over time has a
stronger impact on the reallocative contribution of those sectors with a relatively
higher flexibility need. Accordingly to our estimates, the deregulation in the use
of temporary contracts accounts for a decline of the reallocative contribution to
aggregate growth which ranges from 0.06 pp (low reallocative sectors) to 0.12
pp (high reallocative sectors) over the second period of reforms (1993-2000) and
from 0.20 pp to almost 0.30 pp over the period 2001-2008. The overall impact
on the aggregate productivity is not negligible and can be quantified as large as
0.30pp of the annual aggregate productivity growth in the period 1995-2008.
23
23

6 Conclusions
The labour market deregulation has a negative effect on both the level and
growth rate of productivity. Our results show that the increased flexibility in
the use of temporary contract has led to a lower productivity (level and to a
lesser extent growth rate) in all sectors, with a higher impact on those industries
with a higher flexibility need. The marginal effect of reducing the EPL index by
1 unit, ranges from -2.5%, for the sector at 10th percentile of the distribution of
“flexibility need” (Transport, storage and communication) to -4% for the sector
at the 90th percentile (Manufacture of electrical and optical equipment). Con-
versely, the use of temporary contracts has a significant lower effect in industries
with higher skill content. This result confirms the theoretical prediction that
the use of fixed-term contracts can produce different results in term of produc-
tivity losses according to the type of jobs they create. For ”high skilled” jobs
firms use them to screen employees with a beneficial effect on the firm-worker
match (this is mainly the case for jobs created in high skilled industry). On
the other hand, in sectors with a high flexibility need, fixed-term contracts pro-
vide flexibility against negative productivity shocks and a reduction in labour
adjustment costs, implying a substitution between temporary and permanent
forms of employment and substitution between labour and capital. Moreover
the extensive use of temporary form of employment appears to have favoured
the access to the labour market of the so called marginal low-productive work-
ers (basically women, youth and unskilled workers) and/or have made profitable
the creation of jobs and activities with a low skills requirement.
The negative effect of the reforms on the reallocative capacity is stronger for
those industries with a higher flexibility need that are also the relatively lower
productivity sectors in the period 1993-2008. At the same time these sectors
experienced a larger increase in employment as a result of the deregulation
process. The productivity growth differentials between the higher (above the
90th percentile) and lower (below the 10th percentile) flexibility need sectors is
on average 0.5 percentage points, while higher flexibility need flexibility sectors
24
24

experienced an average increase in employment 6 percentage points higher than
sectors with lower flexibility need. Such decline in the reallocative contribution
is then the result of reforms that favoured higher job creation in industries which
benefited more from the reduction in the adjustment costs of the labour force.
However, this has also implied an increase in the relative economic importance of
sectors characterized by slower productivity dynamics with an overall negative
impact on the aggregate productivity growth.
References
[1] Acemoglu D., J. Pischke (1999a), ”Minimum Wages and On-the-Job Train-
ing,” Working papers 99-25, Massachusetts Institute of Technology (MIT),
Department of Economics
[2] Acemoglu, D., R. Shimer (1999b), ”Holdups and Efficiency with Search
Frictions,” International Economic Review, vol. 40(4), pp. 827-49.
[3] Addessi W. (2012), ”Labor Contracts and Productivity Dynamics”, Paper
LuissLab1298, Dipartimento di Economia e Finanza, LUISS Guido Carli.
[4] Autor, David H., William R. Kerr and Adriana D. Kugler, (2007), Do
Employment Protections Reduce Productivity? Evidence from U.S. States,
The Economic Journal
[5] Bartelsman, E. J. and J. Hinloopen (2005), ”Unleashing animal spirits: ICT
and economic growth”, in L. Soete and B. ter Weel (eds.), The Economics
of the Digital Economy, Edward Elgar Publishing.
[6] Bassanini A., E. Ernst, (2002), ”Labour market regulation, industrial re-
lations and technological regimes: a tale of comparative advantage,” In-
dustrial and Corporate Change, Oxford University Press, vol. 11(3), pages
391-426, June
25
25
[7] Bassanini A., L. Nunziata and D. Venn (2009). ”Job protection legislation
and productivity growth in OECD countries,” Economic Policy, vol. 24,
pages 349-402, 04.
[8] Bassanini A. and D. Venn (2008), ”The Impact of Labour Market Policies
on Productivity in OECD Countries,” International Productivity Monitor,
Centre for the Study of Living Standards, vol. 17, pp. 3-15, Fall.
[9] Belot, M. and J.C. van Ours, 2004, Does the recent success of some OECD
countries in lowering their unemployment rates lie in the clever design of
their labour market reforms?, Oxford Economic Papers, vol. 56, no. 4, pp.
621-642.
[10] Bertola, G. (2004), ”A Pure Theory of Job Security and Labour Income
Risk,” Review of Economic Studies, Blackwell Publishing, vol. 71(1), pp.
43-61, 01.
[11] Blanchard, O. J. and A. Landier (2002), ”The Perverse Effects of Partial
Labor Market Reform: Fixed Duration Contracts in France” , Economic
Journal 112, F214-244..
[12] Boeri, T. and P. Garibaldi (2007), ”Two-Tier Reforms of Employment Pro-
tection Legislation: A Honeymoon Effect” Economic Journal 117, 357-385.
[13] Cappellari L., Dell’Aringa C., Leonardi M., (2012), ”Temporary Employ-
ment, Job Flows and Productivity: A Tale of Two Reforms,” IZA Discus-
sion Papers 6526, Institute for the Study of Labor (IZA)
[14] Carlin W.,Soskice D., (1990), ”Macroeconomics and the Wage Bargain: A
Modern Approach to Employment, Inflation, and the Exchange Rate” OUP
Catalogue, Oxford University Press, number 9780198772446, August.
[15] Cunyat A., E. Casquel, (2004). ”The Dynamics Of Temporary Jobs In
Spain” Royal Economic Society Annual Conference 2004 141, Royal Eco-
nomic Society.
26
26
[16] Cingano, F., M. Leonardi, J. Messina, and G. Pica, (2009). ”The Effect
of Employment Protection Legislation and Financial Market Imperfections
on Investment: Evidence from a Firm-Level Panel of EU Countries”, IZA
Discussion Papers 4158, Institute for the Study of Labour (IZA).
[17] Cingano F, M. Leonardi, J. Messina and G. Pica (2008), Employment
Protection Legislation, Productivity and Investment: Evidence from Italy,
mimeograph, University of Salerno.
[18] Ciriaci D., D. Palma (2008), “The role of knowledge-based supply spe-
cialization for competitiveness: a spatial econometric approach”, Papers in
Regional Science, Special issue on Spatial Econometrics, vol. 87, n. 3, 2008.
[19] Codogno L. (2009), “Two Italian Puzzles: Are Productivity Growth and
Competitiveness Really so Depressed?”, Working Papers wp2009-2, De-
partment of the Treasury, Ministry of the Economy and of Finance.
[20] Daveri F., C. Jona Lasinio. (2005), “Italy’s Decline: Getting the Facts
Right”, Giornale degli Economisti e Annali di Economia, vol. 64(4), pp.
365-410, December.
[21] Dew-Becker I.,R.J. Gordon, (2008), ”The Role of Labor Market Changes in
the Slowdown of European Productivity Growth” NBER Working Papers
13840, National Bureau of Economic Research, Inc.
[22] Faini R., A. Sapir (2005), ”Un Modello obsoleto? Crescita e specializ-
zazione dell’economia italiana, in Oltre il declino, ed. Tito Boeri, Riccardo
Faini, Andrea Ichino, Giuseppe Pisauro, e Carlo Scarpa, Il Mulino, Bologna
2005.
[23] Foster L., J. C. Haltiwanger, C. J. Krizan, (2001), ”Aggregate Productivity
Growth. Lessons from Microeconomic Evidence” NBER Chapters, in: New
Developments in Productivity Analysis, pages 303-372 National Bureau of
Economic Research, Inc.
27
27

[24] Gambacorta R. (2004) “Il dibattito sulla legge di Verdoorn: alcuni risultati
empirici usando l’analisi della cointegrazione”, Rivista di Politica Econom-
ica, vol. V-VI, pp. 251-277.
[25] Guell, M. and B. Petrongolo (2007), ”How Binding are Legal Limits?: Tran-
sitions from Temporary to Permanent Work in Spain” Labour Economics
14, 153-183..
[26] Hopenhayn, H. and R. Rogerson (1993), ”Job Turnover and Policy Evalu-
ation: A General Equilibrium Analysis” Journal of Political Economy 103,
915-938.
[27] Holmlund, B., J. Zetterberg (1991), ”Insider effects in wage determination:
Evidence from five countries” European Economic Review, Elsevier, vol.
35(5), pages 1009-1034, July.
[28] Huselid, M., (1995). “The impact of human resource management practices
on turnover, productivity and corporate financial performance”, Academy
of Management Journal, 38, pp. 635–670.
[29] Kent C. and J. Simon, (2007), Productivity Growth: The Effect of Market
Regulations,” RBA Research Discussion Papers rdp2007-04, Reserve Bank
of Australia.
[30] Ichino, A. and R. T. Riphahn, (2005), ”The Effect of Employment Pro-
tection on Worker Effort: A Comparison of Absenteeism During and After
Probation” Journal of the European Economic Association, 3(1), 120-143).
[31] Lucidi F. (2008), “Labour market flexibility and productivity growth: new
evidence from firm-level data”, XXIII National Conference of Labour Eco-
nomics, Brescia, 11-12 September 2008.
[32] Lucidi F., A. Kleinknecht (2009), “Little innovation, many jobs: An econo-
metric analysis of the Italian labour Productivity”, Cambridge Journal of
Economics
28
28
[33] McCombie J.S.L., Pugno M. e Soro B. (2002), eds. Productivity Growth
and Economic Performance, London, Palgrave Macmillan.
[34] McCombie J.S.L., A. P. Thirlwall (1994), Economic Growth and the Bal-
ance of Payment Constraint, St. Martin’s Press, Basingstoke.
[35] Messina J and G. Vallanti (2007), ”Job Flow Dynamics and Firing Restric-
tions: Evidence from Europe,” Economic Journal, R, vol. 117(521), pages
279-301, 06.
[36] Micco A.and C.Pages,(2004), ”Employment protection and gross job flows:
a differences-in-differences approach” mimeograph, World Bank.
[37] Michie, J. and Sheehan, M. (2003). “Labour market deregulation, ‘flexibil-
ity’ and innovation”, Cambridge Journal of Economics, 27, pp. 123-143.
[38] Naastepad, C.W.M. and Storm, S. (2005). “The innovating firm in a soci-
etal context: productivity, labour relations and real wages”, in Verburg R.,
Ortt J.R. & Dicke W. (Eds), Management of Technology: An Introduction,
London: Routledge.
[39] Bell, S. Nickell, (1996), ”Would Cutting Payroll Taxes on the Unskilled
Have a Significant Effect on Unemployment?” CEP Discussion Papers
dp0276, Centre for Economic Performance, LSE
[40] OECD (2006), Employment Outlook (Paris: OECD).
[41] OECD (2007), “More Jobs But Less Productive? The Impact of Labour
Market Policies on Productivity: OECD Employment Outlook, (Paris:
OECD).
[42] Poschke, M. (2007), ”Employment protection, firrm selection, and growth”
IZA Discussion Paper 3164.
[43] Rajan, R. and Zingales, L. (1998), Financial Dependence and Growth
American Economic Review 88, 559-586.
29
29
[44] Scarpetta, S. and T. Tressel (2004), Boosting Productivity via Innovation
and Adoption of New Technologies: Any Role for Labour Market Institu-
tions?, World Bank Working Paper No. 3273
[45] Visser, J.(2009), ”Data Base on Istitutional Characterisctics of Trade
Unions, Wage Setting, Sate Intervention and Social Pacts, 1960-2008. Am-
sterdam Institute for Advanced Labor Studies.
[46] Wasmer, Etienne, 2006. ”The Economics of Prozac (Do Employees Really
Gain from Strong Employment Protection?)”, CEPR Discussion Papers
5991.
30
30

28
TABLE 1. Labour Market Reforms in Italy (breaking points)
Reforms description
1984-1987 Introduction of part-time and training contracts (1983-84); reduction in the wage indexation (1986).
1991-1993 New procedures for collecting firing and limits to the use of Cassa Integrazione e Guadagni; abolishment of indexation (1992); Giugni agreement (1993) which introduces two-tiers wage bargaining (centralized and at firm level)
1994-1995 Extension of the training contracts () to a wider range of situations and the collaboration contracts are introduced (no firing and hiring costs)
1997-1998 Pacchetto Treu (end of 1997): new atypical contracts such as job-sharing; use of temporary worker agency; new fiscal treatment of part-time work.
2001 Decree Law no. 368: Fixed term contracts are extended to regular employees .
2003 Legge Biagi which provides a common framework to atypical contracts and extends further the use of TWA
31

29
TABLE 2. Labour Market Institutional Indicators
EPL regular contracts(a)
EPL temporary contracts(b)
Centralization index(c)
Coordination index(d)
1980-1986 1.77 5.38 3 2.86
1987-1992 1.77 5.38 2 2.33
1993-2000 1.77 4.60 2 4.00
2001-2008 1.77 1.99 2 4.00
Note: (a) EPL regular contracts: measures the costs of dismissals of redundant workers and includes legal restrictions on dismissals and the extent of compensations in case of redundancy.; (OECD, 2004). (b) EPL temporary contracts:
measures the restrictions on the use of temporary employment by firms, with respect to the type of work for which these
contracts are allowed and their duration (scale: 1-6); OECD (2004). (c) Centralization index: the dominant level(s) at
which wage bargaining takes place (scale: 1- 3); OECD (2004). (d) Coordination index: coordination of wage bargaining
(scale1-5). 4=mixed industry and economy-wide bargaining (key unions and employers associations set pattern for the
entire economy); 2=mixed industry- and firm level bargaining, with weak enforceability of industry agreements; ICTWSS
database (Visser, 2007).
32
30
TA
BLE
3. Labour
Pro
duct
ivity G
row
th D
ecom
posi
tion
wit
hin
reall
inte
rto
tal
wit
hin
reall
inte
rto
tal
wit
hin
reall
inte
rto
tal
wit
hin
reall
inte
rto
tal
Ag
ricu
ltu
re a
nd
fis
hin
g0.0
13
0.0
25
0.0
00
0.0
39
0.0
10
0.0
11
- 0
.000
0.0
20
0.0
07
0.0
09
- 0.0
00
0.0
16
0.0
05
0.0
07
- 0
.00
10.0
11
Ma
nu
fac
turi
ng
0.0
67
0.0
07
- 0
.006
0.0
69
0.0
28
0.0
00
- 0.0
00
0.0
28
0.0
28
- 0.0
01
- 0
.00
10.0
26
0.0
02
- 0
.00
1-
0.0
00
0.0
01
Co
nstr
uc
tio
n0.0
05
0.0
01
0.0
00
0.0
06
- 0
.00
1-
0.0
00
- 0.0
00
- 0
.00
10.0
01
- 0.0
01
- 0
.00
00.0
01
- 0.0
03
- 0
.00
2-
0.0
00
- 0.0
05
Tra
de,
ho
tel
an
d r
esta
ura
nt,
tra
ns
po
rt a
nd
co
mm
un
ica
tio
n-
0.0
01
- 0
.00
3-
0.0
04
- 0.0
07
0.0
26
0.0
01
- 0.0
00
0.0
26
0.0
32
- 0.0
00
0.0
00
0.0
32
- 0.0
04
- 0
.00
0-
0.0
00
- 0.0
04
Fin
an
cia
l in
term
ed
iati
on
, re
al
esta
te,
ren
tin
g a
nd
bu
sin
es
s a
cti
vit
ies
- 0.0
50
0.1
00
- 0
.035
0.0
15
- 0
.00
10.0
23
- 0.0
01
0.0
20
- 0
.028
0.0
38
- 0
.01
00.0
00
- 0.0
14
0.0
16
- 0
.002
0.0
01
Fin
an
cia
l in
term
ed
iation
- 0.0
09
0.0
05
- 0
.002
- 0.0
06
0.0
08
0.0
01
0.0
00
0.0
10
0.0
06
- 0.0
01
- 0
.00
00.0
04
0.0
10
0.0
00
0.0
00
0.0
10
Re
al e
sta
te,
ren
tin
g a
nd
bu
sin
ess a
ctivitie
s-
0.0
43
0.1
15
- 0
.043
0.0
29
- 0
.01
30.0
24
- 0.0
03
0.0
08
- 0
.035
0.0
47
- 0
.01
6-
0.0
04
- 0.0
21
0.0
16
- 0
.004
- 0.0
09
Oth
er
se
rvic
es
0.0
02
0.0
01
- 0
.003
0.0
01
0.0
04
- 0
.001
- 0.0
01
0.0
01
0.0
01
0.0
00
0.0
00
0.0
02
0.0
03
0.0
00
- 0
.000
0.0
04
To
tal w
ith
ou
t re
al e
sta
te,
ren
tin
g a
nd
bu
sin
ess
ac
tivit
ies
0.0
78
0.0
37
-0.0
14
0.1
02
0.0
75
0.0
11
-0.0
02
0.0
84
0.0
76
0.0
06
-0.0
01
0.0
81
0.0
13
0.0
04
-0.0
01
0.0
16
To
tal
0.0
37
0.1
31
-0.0
46
0.1
22
0.0
65
0.0
32
-0.0
04
0.0
94
0.0
42
0.0
46
-0.0
11
0.0
77
-0.0
11
0.0
20
-0.0
03
0.0
06
19
80
-198
71
98
8-1
99
31
99
4-2
001
20
01
-200
8
Note
: T
he
def
init
ions
of w
ithin
(w
ithin
), lev
el r
ealloca
tion (
reall.)
and inte
ract
ion t
erm
(in
ter.
) are
giv
en in t
he
main
tex
t
33
31
TABLE 4. Labour Productivity: Period Dummies
Dep. var.= LP man hs ejr
(1) (2) (3) (4)
per1 0.071 -0.056 0.039 0.060
(4.01)*** (1.53) (1.62) (0.64)
per2 0.056 0.066 0.052 0.322
(3.18)*** (3.21)*** (2.74)*** (5.94)***
per3 -0.069 -0.055 -0.083 0.013
(3.26)*** (1.76)* (3.37)*** (0.17)
per1 x sect 0.066 0.061 0.139
(4.14)*** (1.91)* (0.11)
per2 x sect -0.012 0.007 -3.518
(0.74) (0.45) (5.13)***
per3 x sect -0.018 0.027 -1.082
(0.64) (1.32) (1.10)
Observations 518 518 518 518
R-squared 0.88 0.89 0.89 0.89
Industry yes yes yes yes
trend yes yes yes yes Note: Robust standard errors in parentheses. All the regressions include an industry trend and
industry fixed effects. LP is the (log of) value added per worker (FTE). The period dummies are defined as follows: per1= 1 if year> 1986, 0 otherwise; per2= 1 if year> 1992, 0 otherwise;
per3= 1 if year> 2000, 0 otherwise. Sect is man, hs and ejr in column (2), (3) and (4)
respectively; man is a dummy with value 1 for manufacturing industry, 0 otherwise; hs is a
dummy with value 1 for high skilled sectors (share of workers with an underground degree or
more above the median), 0 otherwise; ejr is the average industry excess job reallocation
calculated for the UK sectors over the period 1990-2000. The median of ejr is 0.074
* significant at 10%; ** significant at 5%; ***significant at 1%.
34

32
TABLE 5. Labour Productivity: Institutional Indicators
Dep. var.= LP man hs ejr
(1) (2) (3) (4)
EPL 0.032 0.025 0.038 -0.029
(3.53)*** (2.18)** (4.10)*** (1.11)
CENT -0.053 0.048 -0.024 -0.176
(1.42) (0.87) (0.61) (1.37)
COORD 0.009 0.007 0.009 0.067
(0.99) (0.43) (0.84) (1.84)*
EPL x sect 0.009 -0.015 0.815
(0.92) (2.14)** (2.54)**
CENT x sect -0.071 -0.073 1.629
(1.54) (1.82)* (0.98)
COORD x sect 0.003 0.001 -0.772
(0.21) (0.11) (1.58)
Observations 466 466 466 466
R-squared 0.88 0.90 0.89 0.89
Industry yes yes yes yes
trend yes yes yes yes Note: Robust standard errors in parentheses. All the regressions include an aggregate trend and
industry fixed effects. LP is the (log of) value added per worker (FTE). EPL is the employment
protection legislation on temporary contracts; CENT is an indicator for the centralization of the
wage bargaining process; COORD is an indicator for the coordination of the wage bargaining
process. Sect is man, hs and ejr in column (2), (3) and (4) respectively; man is a dummy with
value 1 for manufacturing industry, 0 otherwise; hs is a dummy with value 1 for high skilled
sectors (share of workers with an underground degree or more above the median), 0 otherwise;
ejr is the average industry excess job reallocation calculated for the UK sectors over the period 1990-2000. The median of ejr is 0.074
* significant at 10%; ** significant at 5%; ***significant at 1%.
35
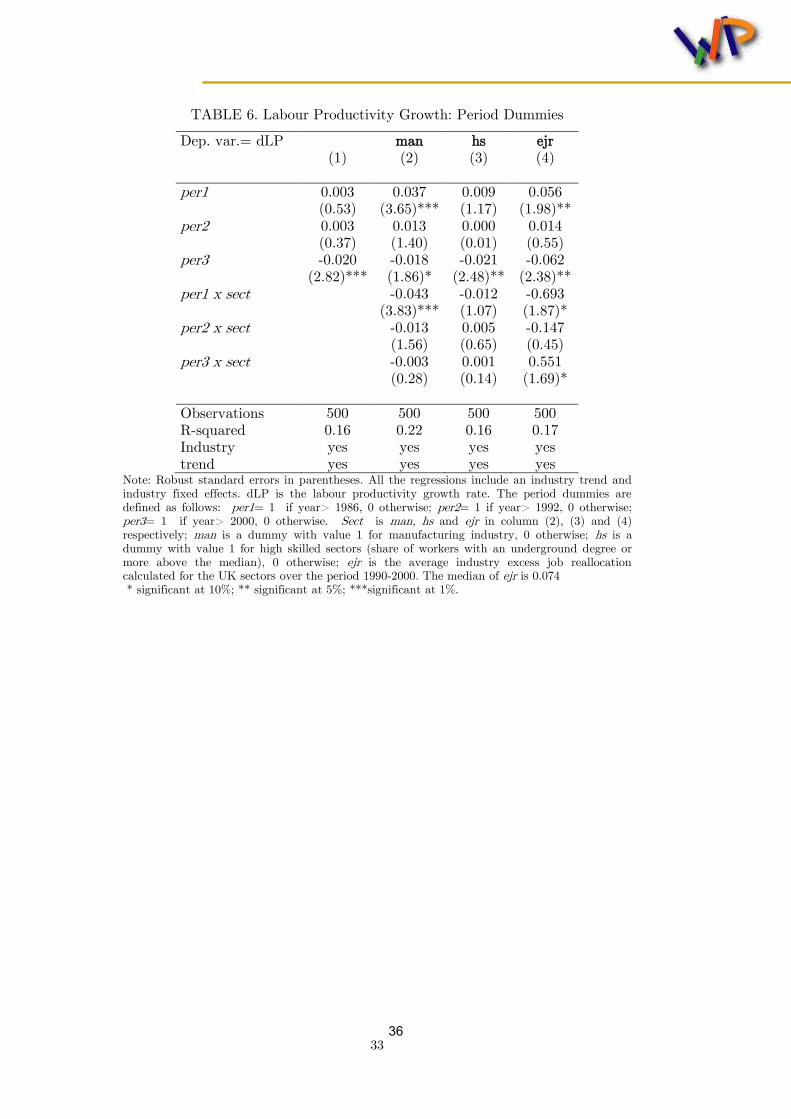
33
TABLE 6. Labour Productivity Growth: Period Dummies
Dep. var.= dLP man hs ejr
(1) (2) (3) (4)
per1 0.003 0.037 0.009 0.056
(0.53) (3.65)*** (1.17) (1.98)**
per2 0.003 0.013 0.000 0.014
(0.37) (1.40) (0.01) (0.55)
per3 -0.020 -0.018 -0.021 -0.062
(2.82)*** (1.86)* (2.48)** (2.38)**
per1 x sect -0.043 -0.012 -0.693
(3.83)*** (1.07) (1.87)*
per2 x sect -0.013 0.005 -0.147
(1.56) (0.65) (0.45)
per3 x sect -0.003 0.001 0.551
(0.28) (0.14) (1.69)*
Observations 500 500 500 500
R-squared 0.16 0.22 0.16 0.17
Industry yes yes yes yes
trend yes yes yes yes Note: Robust standard errors in parentheses. All the regressions include an industry trend and
industry fixed effects. dLP is the labour productivity growth rate. The period dummies are
defined as follows: per1= 1 if year> 1986, 0 otherwise; per2= 1 if year> 1992, 0 otherwise;
per3= 1 if year> 2000, 0 otherwise. Sect is man, hs and ejr in column (2), (3) and (4)
respectively; man is a dummy with value 1 for manufacturing industry, 0 otherwise; hs is a
dummy with value 1 for high skilled sectors (share of workers with an underground degree or
more above the median), 0 otherwise; ejr is the average industry excess job reallocation calculated for the UK sectors over the period 1990-2000. The median of ejr is 0.074
* significant at 10%; ** significant at 5%; ***significant at 1%.
36

34
TABLE 7. Labour Productivity Growth: Institutional Indicators
Dep. var.= dLP man hs ejr
(1) (2) (3) (4)
EPL 0.005 0.002 0.005 0.016
(1.61) (0.49) (1.42) (1.94)*
CENT -0.011 -0.045 -0.016 -0.088
(1.10) (3.30)*** (1.46) (3.16)***
COORD 0.007 0.003 0.005 0.014
(2.35)** (0.65) (1.77)* (1.35)
EPL x sect 0.004 0.001 -0.145
(1.44) (0.33) (1.44)
CENT x sect 0.043 0.014 1.027
(3.57)*** (1.17) (2.88)***
COORD x sect 0.005 0.003 -0.102
(1.32) (0.75) (0.73)
Observations 466 466 466 466
R-squared 0.18 0.23 0.18 0.19
Industry yes yes yes yes
trend yes yes yes yes Note: Robust standard errors in parentheses. All the regressions include an aggregate trend and
industry fixed effects. dLP is labour productivity growth rate. EPL is the employment
protection legislation on temporary contracts; CENT is an indicator for the centralization of the
wage bargaining process; COORD is an indicator for the coordination of the wage bargaining
process. Sect is man, hs and ejr in column (2), (3) and (4) respectively; man is a dummy with
value 1 for manufacturing industry, 0 otherwise; hs is a dummy with value 1 for high skilled
sectors (share of workers with an underground degree or more above the median), 0 otherwise;
ejr is the average industry excess job reallocation calculated for the UK sectors over the period 1990-2000. The median of ejr is 0.074
* significant at 10%; ** significant at 5%; ***significant at 1%.
37
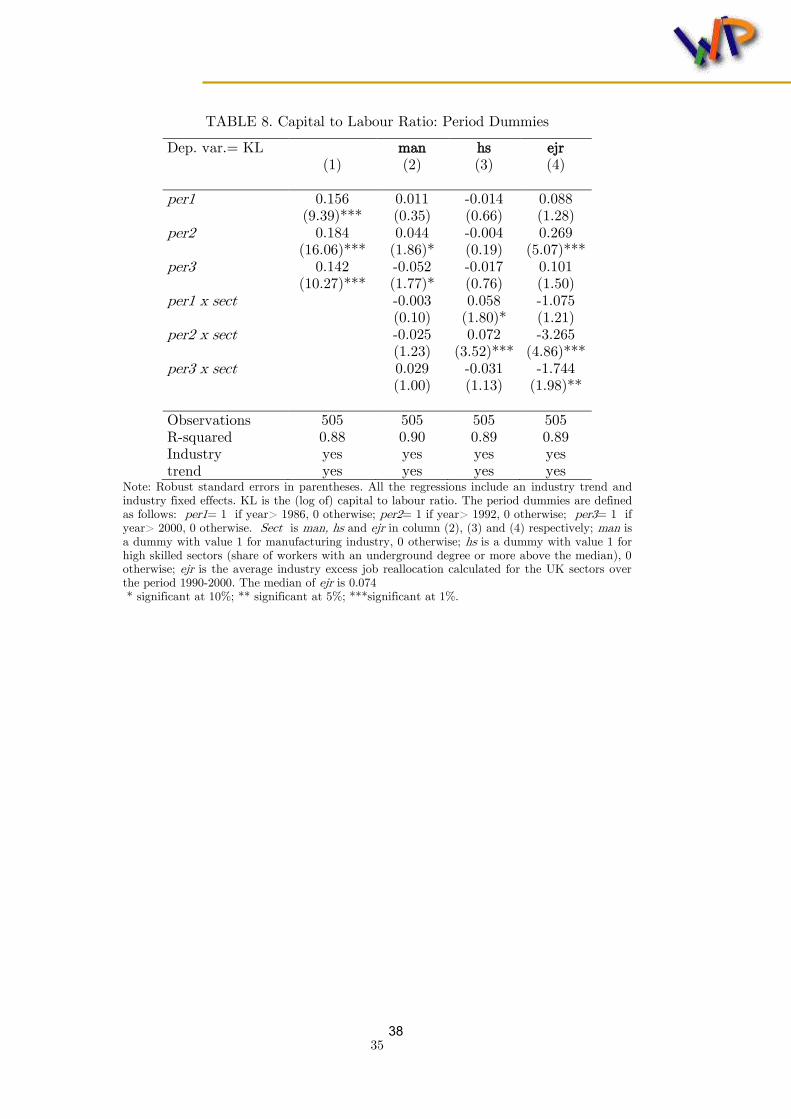
35
TABLE 8. Capital to Labour Ratio: Period Dummies
Dep. var.= KL man hs ejr
(1) (2) (3) (4)
per1 0.156 0.011 -0.014 0.088
(9.39)*** (0.35) (0.66) (1.28)
per2 0.184 0.044 -0.004 0.269
(16.06)*** (1.86)* (0.19) (5.07)***
per3 0.142 -0.052 -0.017 0.101
(10.27)*** (1.77)* (0.76) (1.50)
per1 x sect -0.003 0.058 -1.075
(0.10) (1.80)* (1.21)
per2 x sect -0.025 0.072 -3.265
(1.23) (3.52)*** (4.86)***
per3 x sect 0.029 -0.031 -1.744
(1.00) (1.13) (1.98)**
Observations 505 505 505 505
R-squared 0.88 0.90 0.89 0.89
Industry yes yes yes yes
trend yes yes yes yes Note: Robust standard errors in parentheses. All the regressions include an industry trend and
industry fixed effects. KL is the (log of) capital to labour ratio. The period dummies are defined
as follows: per1= 1 if year> 1986, 0 otherwise; per2= 1 if year> 1992, 0 otherwise; per3= 1 if
year> 2000, 0 otherwise. Sect is man, hs and ejr in column (2), (3) and (4) respectively; man is
a dummy with value 1 for manufacturing industry, 0 otherwise; hs is a dummy with value 1 for
high skilled sectors (share of workers with an underground degree or more above the median), 0 otherwise; ejr is the average industry excess job reallocation calculated for the UK sectors over
the period 1990-2000. The median of ejr is 0.074
* significant at 10%; ** significant at 5%; ***significant at 1%.
38

36
TABLE 9. Capital to Labour Ratio: Institutional Indicators
Dep. var.= KL man hs ejr
(1) (2) (3) (4)
EPL 0.006 0.009 0.004 -0.070
(0.59) (0.75) (0.46) (2.92)***
CENT -0.024 -0.049 0.010 -0.194
(0.74) (1.16) (0.33) (2.48)**
COORD 0.014 0.019 0.005 0.075
(1.61) (1.52) (0.54) (2.47)**
EPL x sect -0.004 0.003 0.997
(0.43) (0.32) (3.36)***
CENT x sect 0.032 -0.088 1.251
(0.82) (2.30)** (2.15)**
COORD x sect -0.007 0.024 -0.810
(0.54) (1.86)* (2.04)**
Observations 468 468 468 468
R-squared 0.88 0.90 0.89 0.89
Industry yes yes yes yes
trend yes yes yes yes Note: Robust standard errors in parentheses. All the regressions include an aggregate trend and
industry fixed effects. KL is the (log of) capital to labour ratio. EPL is the employment
protection legislation on temporary contracts; CENT is an indicator for the centralization of the
wage bargaining process; COORD is an indicator for the coordination of the wage bargaining
process. Sect is man, hs and ejr in column (2), (3) and (4) respectively; man is a dummy with
value 1 for manufacturing industry, 0 otherwise; hs is a dummy with value 1 for high skilled
sectors (share of workers with an underground degree or more above the median), 0 otherwise;
ejr is the average industry excess job reallocation calculated for the UK sectors over the period 1990-2000. The median of ejr is 0.074
* significant at 10%; ** significant at 5%; ***significant at 1%.
39
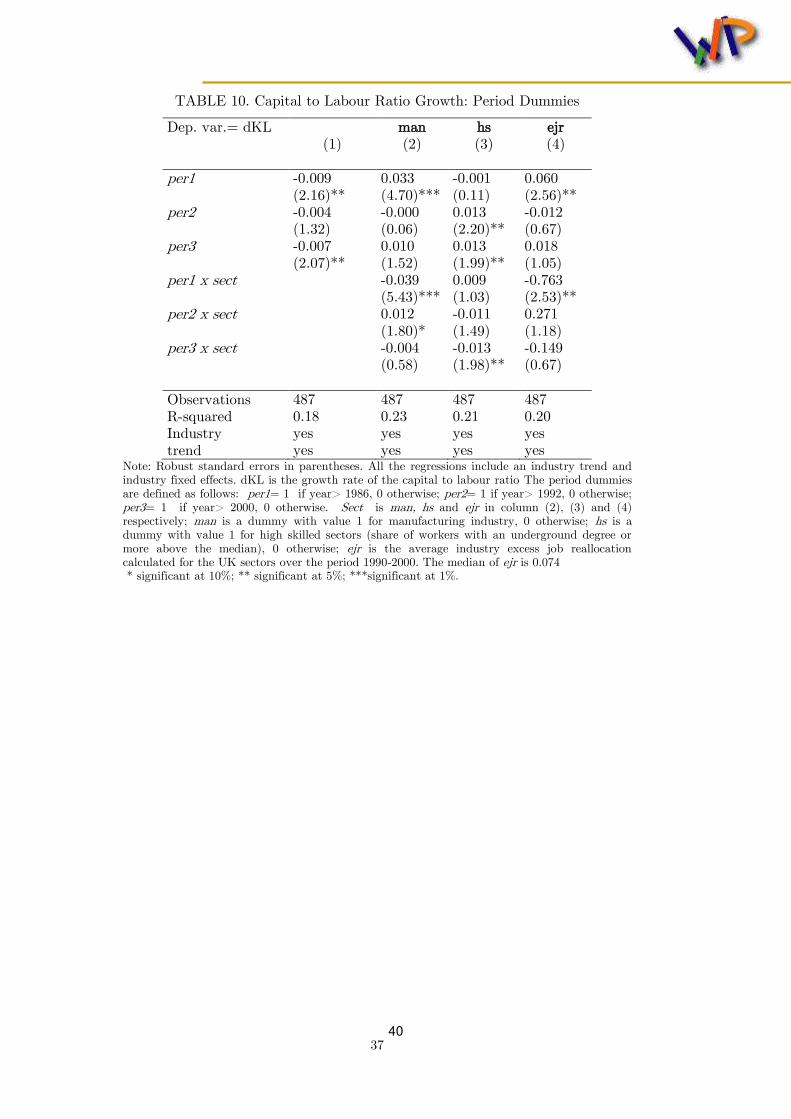
37
TABLE 10. Capital to Labour Ratio Growth: Period Dummies
Dep. var.= dKL man hs ejr
(1) (2) (3) (4)
per1 -0.009 0.033 -0.001 0.060
(2.16)** (4.70)*** (0.11) (2.56)**
per2 -0.004 -0.000 0.013 -0.012
(1.32) (0.06) (2.20)** (0.67)
per3 -0.007 0.010 0.013 0.018
(2.07)** (1.52) (1.99)** (1.05)
per1 x sect -0.039 0.009 -0.763
(5.43)*** (1.03) (2.53)**
per2 x sect 0.012 -0.011 0.271
(1.80)* (1.49) (1.18)
per3 x sect -0.004 -0.013 -0.149
(0.58) (1.98)** (0.67)
Observations 487 487 487 487
R-squared 0.18 0.23 0.21 0.20
Industry yes yes yes yes
trend yes yes yes yes Note: Robust standard errors in parentheses. All the regressions include an industry trend and
industry fixed effects. dKL is the growth rate of the capital to labour ratio The period dummies
are defined as follows: per1= 1 if year> 1986, 0 otherwise; per2= 1 if year> 1992, 0 otherwise;
per3= 1 if year> 2000, 0 otherwise. Sect is man, hs and ejr in column (2), (3) and (4)
respectively; man is a dummy with value 1 for manufacturing industry, 0 otherwise; hs is a
dummy with value 1 for high skilled sectors (share of workers with an underground degree or
more above the median), 0 otherwise; ejr is the average industry excess job reallocation
calculated for the UK sectors over the period 1990-2000. The median of ejr is 0.074 * significant at 10%; ** significant at 5%; ***significant at 1%.
40
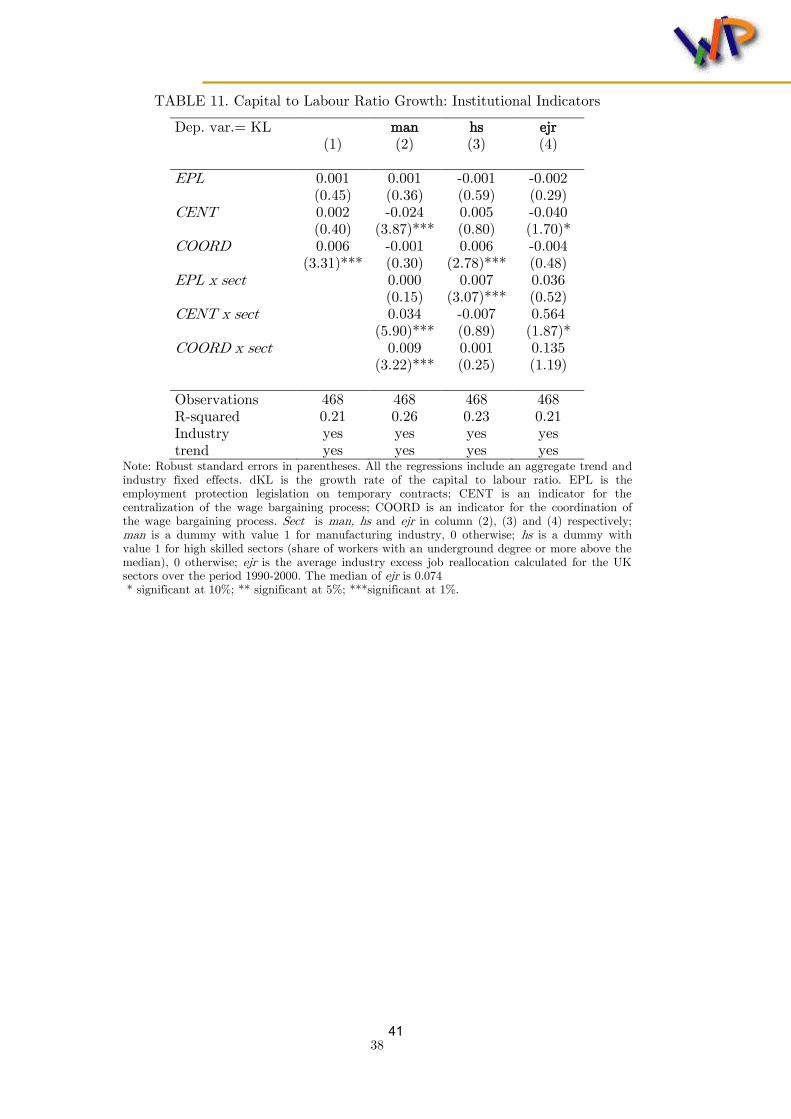
38
TABLE 11. Capital to Labour Ratio Growth: Institutional Indicators
Dep. var.= KL man hs ejr
(1) (2) (3) (4)
EPL 0.001 0.001 -0.001 -0.002
(0.45) (0.36) (0.59) (0.29)
CENT 0.002 -0.024 0.005 -0.040
(0.40) (3.87)*** (0.80) (1.70)*
COORD 0.006 -0.001 0.006 -0.004
(3.31)*** (0.30) (2.78)*** (0.48)
EPL x sect 0.000 0.007 0.036
(0.15) (3.07)*** (0.52)
CENT x sect 0.034 -0.007 0.564
(5.90)*** (0.89) (1.87)*
COORD x sect 0.009 0.001 0.135
(3.22)*** (0.25) (1.19)
Observations 468 468 468 468
R-squared 0.21 0.26 0.23 0.21
Industry yes yes yes yes
trend yes yes yes yes Note: Robust standard errors in parentheses. All the regressions include an aggregate trend and
industry fixed effects. dKL is the growth rate of the capital to labour ratio. EPL is the
employment protection legislation on temporary contracts; CENT is an indicator for the
centralization of the wage bargaining process; COORD is an indicator for the coordination of
the wage bargaining process. Sect is man, hs and ejr in column (2), (3) and (4) respectively;
man is a dummy with value 1 for manufacturing industry, 0 otherwise; hs is a dummy with
value 1 for high skilled sectors (share of workers with an underground degree or more above the
median), 0 otherwise; ejr is the average industry excess job reallocation calculated for the UK sectors over the period 1990-2000. The median of ejr is 0.074
* significant at 10%; ** significant at 5%; ***significant at 1%.
41

39
TABLE 12. Reallocative Component and Industry Characteristics
Dep. var.= dw man hs ejr
(1) (2) (3) (4)
D 0.0024 0.0023 0.0024 0.0034
(3.07)*** (3.96)*** (2.89)*** (2.14)**
D x sect -0.0024 0.0006 -0.437
(3.75)*** (0.25) (2.03)**
Observations 502 502 502 502
R-squared 0.18 0.36 0.19 0.23
Industry yes yes yes yes Note: Robust standard errors in parentheses. All the regressions include industry fixed effects.
dw is change in labour share. D is the lagged deviation of the industry’s productivity from the
aggregate productivity divided by (n times) the variance. Sect is man, hs and ejr in column (2), (3) and (4) respectively; man is a dummy with value 1 for manufacturing industry, 0 otherwise;
hs is a dummy with value 1 for high skilled sectors (share of workers with an underground
degree or more above the median), 0 otherwise; ejr is the average industry excess job
reallocation calculated for the UK sectors over the period 1990-2000. The median of ejr is 0.074.
* significant at 10%; ** significant at 5%; ***significant at 1%.
42

40
TABLE 13. Reallocative Component: Period Dummies
Dep. var.= dw man hs ejr
(1) (2) (3) (4)
D 0.0030 0.0366 0.0030 0.0336
(3.41)*** (5.70)*** (3.23)*** (2.13)**
D x sect -0.0318 0.0072 -0.4218
(5.44)*** (3.98)*** (1.97)**
D x per1 -0.0006 0.0121 -0.0006 -0.0017
(2.23)** (1.57) (2.09)** (0.36)
D x per2 0.0000 -0.0048 0.0000 0.0091
(0.57) (1.04) (0.72) (2.46)**
D x per3 -0.0000 -0.0132 0.0000 -0.0042
(0.01) (4.06)*** (0.02) (1.45)
D x per1 x sect -0.0122 -0.0063 0.0162
(1.59) (2.83)*** (0.26)
D x per2 x sect 0.0048 -0.0022 -0.1212
(1.05) (1.33) (2.46)**
D x per3 x sect 0.0132 -0.0000 0.0613
(4.04)*** (0.15) (1.48)
Observations 502 502 502 502
R-squared 0.18 0.36 0.19 0.23
Industry yes yes yes yes Note: Robust standard errors in parentheses. All the regressions include industry fixed effects.
dw is change in labour share. D is the lagged deviation of the industry’s productivity from the
aggregate productivity divided by (n times) the variance. The period dummies are defined as follows: per1= 1 if year> 1986, 0 otherwise; per2= 1 if year> 1992, 0 otherwise; per3= 1 if
year> 2000, 0 otherwise. Sect is man, hs and ejr in column (2), (3) and (4) respectively; man
is a dummy with value 1 for manufacturing industry, 0 otherwise; hs is a dummy with value 1
for high skilled sectors (share of workers with an underground degree or more above the
median), 0 otherwise; ejr is the average industry excess job reallocation calculated for the UK
sectors over the period 1990-2000. The median of ejr is 0.074
* significant at 10%; ** significant at 5%; ***significant at 1%.
43

41
TABLE 14. Reallocative Component: Institutional Indicators
Dep. var.= dw man hs ejr (1) (2) (3) (4)
D 0.0023 0.0582 0.0020 0.0371
(2.47)** (1.96)* (2.56)** (1.70)*
D x sect -0.0576 -0.0168 -0.4974 (1.93)* (2.60)*** (1.63)
D x EPL -0.0000 0.0042 -0.0000 -0.0006 (0.42) (3.85)*** (0.64) (0.71)
D x CENT 0.0006 -0.0132 0.0006 0.0000
(2.26)** (1.28) (2.18)** (0.03) D x COORD 0.0000 -0.0024 0.0000 0.0017
(1.62) (0.92) (1.63) (1.19) D x EPL x sect -0.0043 0.0006 0.0210
(3.84)*** (1.47) (1.75)*
D x CENT x sect 0.0132 0.0066 0.0048 (1.29) (3.84)*** (0.07)
D x COORD x sect 0.0025 -0.0000 -0.0264 (0.94) (0.36) (1.12)
Observations 468 468 468 468 R-squared 0.18 0.37 0.19 0.22
Industry yes yes yes yes Note: Robust standard errors in parentheses. All the regressions include industry fixed effects.
dw is change in labour share. D is the lagged deviation of the industry’s productivity from the
aggregate productivity divided by (n times) the variance. EPL is the employment protection
legislation on temporary contracts; CENT is an indicator for the centralization of the wage
bargaining process; COORD is an indicator for the coordination of the wage bargaining process.
Sect is man, hs and ejr in column (2), (3) and (4) respectively; man is a dummy with value 1 for manufacturing industry, 0 otherwise; hs is a dummy with value 1 for high skilled sectors
(share of workers with an underground degree or more above the median), 0 otherwise; ejr is the
average industry excess job reallocation calculated for the UK sectors over the period 1990-2000.
The median of ejr is 0.074
* significant at 10%; ** significant at 5%; ***significant at 1%.
44
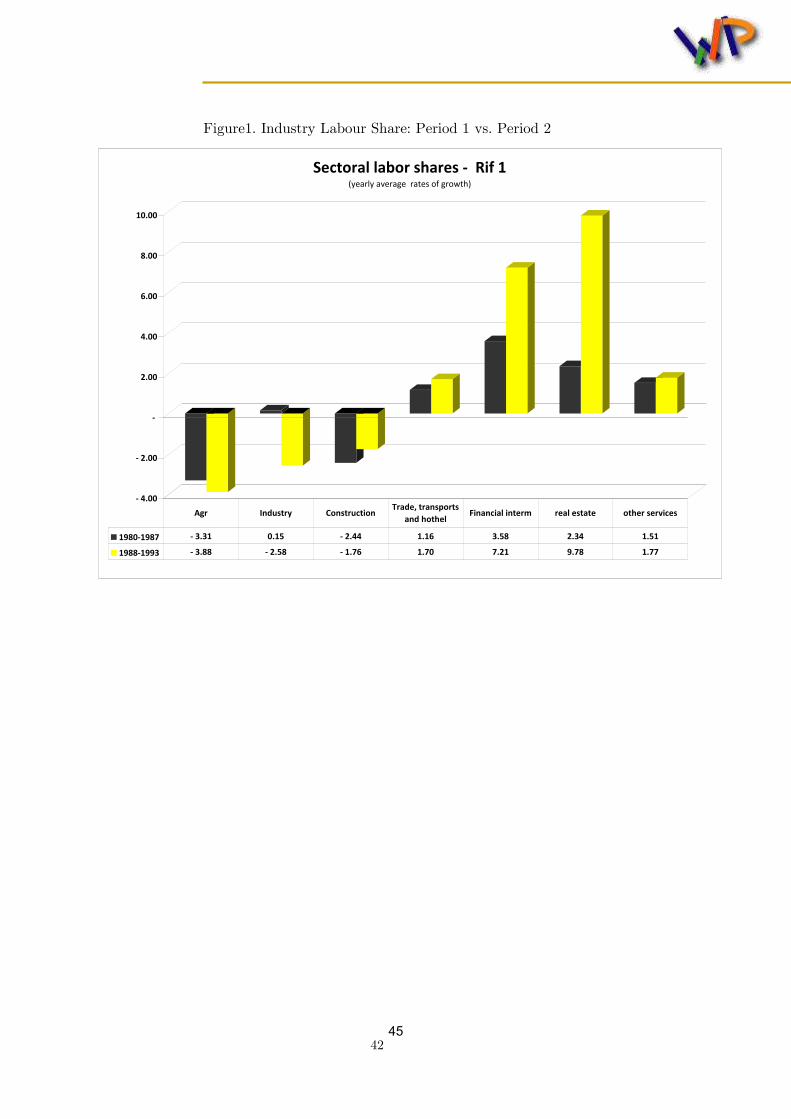
42
Figure1. Industry Labour Share: Period 1 vs. Period 2
- 4.00
- 2.00
-
2.00
4.00
6.00
8.00
10.00
Sectoral labor shares - Rif 1 (yearly average rates of growth)
1980-1987 - 3.31 0.15 - 2.44 1.16 3.58 2.34 1.51
1988-1993 - 3.88 - 2.58 - 1.76 1.70 7.21 9.78 1.77
Agr Industry ConstructionTrade, transports
and hothelFinancial interm real estate other services
45
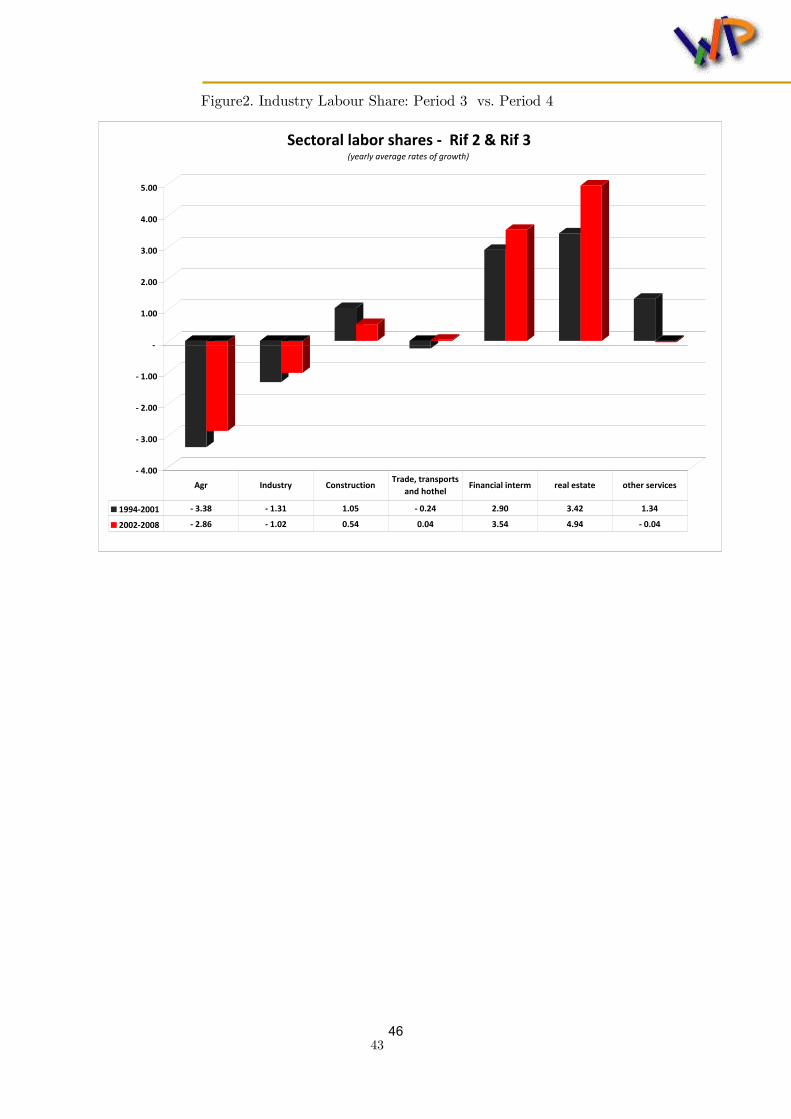
43
Figure2. Industry Labour Share: Period 3 vs. Period 4
- 4.00
- 3.00
- 2.00
- 1.00
-
1.00
2.00
3.00
4.00
5.00
Sectoral labor shares - Rif 2 & Rif 3 (yearly average rates of growth)
1994-2001 - 3.38 - 1.31 1.05 - 0.24 2.90 3.42 1.34
2002-2008 - 2.86 - 1.02 0.54 0.04 3.54 4.94 - 0.04
Agr Industry ConstructionTrade, transports
and hothelFinancial interm real estate other services
46


Ministry of Economy and Finance
Department of the Treasury
Directorate I: Economic and Financial Analysis
Address: Via XX Settembre, 97 00187 - Rome Websites: www.mef.gov.it www.dt.tesoro.it e-mail: [email protected] Telephone: +39 06 47614202 +39 06 47614197 Fax:
+39 06 47821886