Embed Size (px)
Citation preview

TURNAROUND REFORM AGENDA FOR INDIA’S ENVIRONMENTAL REGULATORS
CENTRE FOR SCIENCE AND ENVIRONMENTNew Delhi
2009
Centre for Science and Environment41, Tughlakabad Institutional Area,
New Delhi 110 062, INDIAPh: +91-11-29956110 - 5124 - 6394- 6399
Fax: +91-11-29955879E-mail: [email protected]
Website: www.cseindia.org

vi blank

Centre for Science and EnvironmentNew Delhi
2009
i
TURNAROUNDREFORM AGENDA
FOR INDIA’S ENVIRONMENTAL REGULATORS

ii
© 2009 Centre for Science and Environment
Material from this publication can be used, but with acknowledgement.
Published by
Centre for Science and Environment
41, Tughlakabad Institutional Area, New Delhi – 110 062
Ph: 91-11-2995 6110, 2995 5124, 2995 6394, 2995 6399
Fax: 91-11-2995 5879, 2995 0870
Email: [email protected] Website: www.cseindia.org
Printed at Multi Colour Services, New Delhi
RESEARCH AND DIRECTIONChandra Bhushan
Research Nivit Kumar Yadav Anil Roy
EditorSouparno Banerjee
Cover designSurya Sen
Design and layoutKirpal Singh
ProductionRakesh Shrivastava Gundhar Das

iii
Contents
Acronyms and abbreviationsList of tables, figures and boxes
Chapter 1: Introduction …………………………………………………………………………………………………………………1The rationale behind the study ……………………………………………………………………………………………………………1Environmental regulations and institutional capacity: a review …………………………………………………………………………1The CSE study and its scope ………………………………………………………………………………………………………………2
Chapter 2: Regulatory capacity and resource mobilisation ………………………………………………………………………3Introduction …………………………………………………………………………………………………………………………………3Composition of the State Pollution Control Boards………………………………………………………………………………………3Staffing patterns: identifying the gaps ……………………………………………………………………………………………………4Financial resource mobilisation ……………………………………………………………………………………………………………8Nature and pattern of expenditure ………………………………………………………………………………………………………11Regulatory costs……………………………………………………………………………………………………………………………14Conclusion …………………………………………………………………………………………………………………………………15
Chapter 3: Compliance and enforcement performance …………………………………………………………………………16 Introduction ………………………………………………………………………………………………………………………………16Grant of consent ………………………………………………………………………………………………………………………… 16Inspections and pollution sample analysis ………………………………………………………………………………………………18Sample collection and testing ……………………………………………………………………………………………………………19Compliance assurance ……………………………………………………………………………………………………………………21Status of show cause and closure notices and litigations ………………………………………………………………………………22Training and capacity building ……………………………………………………………………………………………………………27Conclusion …………………………………………………………………………………………………………………………………29
Chapter 4: People’s perception ………………………………………………………………………………………………………30Introduction ………………………………………………………………………………………………………………………………30Stakeholders’ report card on the SPCBs’ performance …………………………………………………………………………………30Conclusion …………………………………………………………………………………………………………………………………36
Chapter 5: Recommendations …………………………………………………………………………………………………………38
Notes and references……………………………………………………………………………………………………………………42

iv
Acronyms and abbreviations
ADB Asian Development Bank
APPCB Andhra Pradesh Pollution Control Board
BSPCB Bihar State Pollution Control Board
CDM Clean Development Mechanism
CECB Chhattisgarh Environment Conservation Board
CETP Common Effluent Treatment Plant
CPCB Central Pollution Control Board
CSE Centre for Science and Environment
CTE Consent to establish
CTO Consent to operate
EIA Environment Impact Assessment
EMPRI Environmental Management Policy Research Institute
EMS Environmental Management Systems
ENVIS Environmental Information System
EPTRI Environmental Protection Training and Research Institute
GDP Gross Domestic Product
GHG Greenhouse gases
GoI Government of India
GPCB Gujarat Pollution Control Board
GSPCB Goa State Pollution Control Board
HSPCB Haryana State Pollution Control Board
LCA Life Cycle Assessment
MoEF Ministry of Environment and Forests
MPCB Maharashtra Pollution Control Board
MPPCB Madhya Pradesh Pollution Control Board
NEP National Environment Policy
NGO Non-Government Organisations
OECD Organisation for Economic Cooperation and Development
OSPCB Orissa State Pollution Control Board
PCB Pollution Control Board
PIL Public Interest Litigation
RTI Right to Information
SMEs Small and Medium Enterprises
SPCB State Pollution Control Board
SSI Small-scale Industries
TNPCB Tamil Nadu Pollution Control Board
UPPCB Uttar Pradesh Pollution Control Board
USEPA United States Environment Protection Agency
UTPCC Union Territory Pollution Control Committee
WBPCB West Bengal Pollution Control Board

v
List of tables, figures and boxes
LIST OF TABLES
Table 1: Predominance of IAS/IFS officers as chairperson and member secretary in SPCBsTable 2: Average workloads of technical staff: 2005-2006Table 3: Time spent by technical staff for industrial monitoring in a yearTable 4: Incomes of various pollution control boardsTable 5: Source-wise incomes of various pollution control boardsTable 6: Expenditures of SPCBsTable 7: Ratio of expenditure to income in SPCBsTable 8A: Patterns of expenditure in SPCBsTable 8B: Patterns of expenditure in SPCBsTable 9: Expenditure per industry Table 10: Expenditure per polluting industry (red + orange categories)Table 11: Status of consent to establish issued by SPCBsTable 12: Status of consent to operate (2005-06)Table 13: Number of inspections conducted by SPCBsTable 14: Inspection schedules of the CPCB and SPCBsTable 15: Samples analysed by various SPCBsTable 16: Compliance status with standardsTable 17: Show cause notices, closure notices and cases filedTable 18: Legal cases filed by different boardsTable 19: Status of cases filed by the boards as in 2006Table 20: Legal staff in different PCBs
LIST OF FIGURES
Figure 1: Vacancies in SPCBsFigure 2: Board-wise composition of staffFigure 3: Staff vs Industries: the case of the Karnataka State Pollution Control BoardFigure 4: Sources of funds for SPCBsFigure 5: Expenditure on salariesFigure 6: Refusal rate for consent to establish issued by SPCBsFigure 7: Status of complaint redressalFigure 8: Regional distribution of civil society respondentFigure 9: Classification of industry respondentsFigure 10: Industry view on staff strength in boardsFigure 11: SPCB’s responses to public complaintsFigure 12: Accessibility and availability of EIA reportsFigure 13: Access to proceedings of public hearingsFigure 14: Corruption in SPCBs as viewed by the civil societyFigure 15: Corruption in SPCBs as per the industryFigure 16: Easy compliance, no penalty
LIST OF BOXES
Box 1: Humanpower crisis at CPCB Box 2: Performance indicators: the Maharashtra Pollution Control BoardBox 3: Use of administrative enforcement authorities as a credible deterrentBox 4: Use of self-monitoring data for compliance enforcementBox 5: CSE’s Green Rating Project

vi blank

IntroductionTHE RATIONALE BEHIND THE STUDY
One of the key challenges faced by India today is how to maintain a high economic growth, and at the
same time, ensure environmental sustainability and social justice. The high growth rate during the last
decade has not gone hand in hand with the mandate of environmental sustainability. The air of cities is
dirty, rivers are polluted, and hazardous wastes are ill-managed. This could be attributed to the
increasing gap that has been created over the years in the overall capacity of environmental regulations
and regulatory institutions to address the negative environmental impacts of rapid industrialisation.
Environmental regulations are intended to ensure sustainable resource use and facilitate effective
natural resource management. Regulatory institutions are entrusted to protect the natural environment
from degradation by means of a well developed mechanism of monitoring, compliance and enforcement.
However, there are certain inherent capacity constraints within the regulatory institutions that come in
the way of effective compliance and enforcement of regulations. The capacity constraints of regulatory
institutions such as the Union ministry of environment and forests (MoEF), the Central Pollution Control
Board (CPCB) and the State Pollution Control Boards (SPCBs) need to be identified and removed or
ameliorated, so that effective implementation of environmental regulations is ensured in the country.
ENVIRONMENTAL REGULATIONS AND INSTITUTIONAL CAPACITY: A REVIEW
Indian regulations for pollution control have a comparatively longer colonial history which dates back to
the nineteenth century. The British had introduced some legislative measures such as the Shore Nuisance
Act, 1853; the Indian Penal Act, 1860; the Indian Easement Act, 1882; the Bengal Smoke Nuisance Act, 1905;
the Bombay Smoke Nuisance Act, 1912; and the Motor Vehicles Act, 1939. All these acts attempted at
abatement of air, water and even noise pollution. During the post-independence era, environmental
legislations were passed and enacted which, inter alia, also attempted to deal with some facets of pollution
control and prevention. These included the Factories Act, 1948; the Industries (Development and
Regulation) Act, 1951; the River Boards Act, 1956; the Atomic Energy Act, 1962; the Insecticides Act, 1968;
the Merchant Shipping (Amendment) Act, 1970; and the Radiation Protection Rules, 1971.
A major development took place in Indian environmental legislation when the Water (Prevention and
Control of Pollution) Act, 1974 was passed by the Parliament, earmarking the establishment of Boards for
Prevention and Control of Pollution of Water. The passing of the Air (Prevention and Control of Pollution)
Act in 1981 provided the much needed basis for an integrated approach on pollution control. The Water
Pollution Control Boards were thereby authorised to deal with air pollution also and were henceforth
called Central/State Pollution Control Boards.
Various committees were set up (the Bhattacharya Committee, 1984 and the Belliappa Committee, 1990)
and reports prepared (the Administrative Staff College of India report, 1994 and the Planning Commission
1
CHAPTER 1

report, 2001-02) examining the functioning and performance of regulatory institutions. These have
pointed to the poor implementation and enforcement of environmental laws, rules and regulations by
regulatory agencies, especially by the SPCBs. These reports have also looked at the capacity constraints
of the state boards and the reasons behind their ineffective functioning.
More recently, in 2005, the United States Environment Protection Agency (USEPA), under a memorandum
of understanding signed with the MoEF, undertook a study on ‘environmental compliance and
enforcement in India’ and came out with an 11-point recommendation for corrective measures. Some of
the major recommendations are developing policy and implementing guidelines for the SPCBs and zonal
offices of the CPCB; using self-monitoring, self-recordkeeping and self-reporting as direct evidence of
violation in courts of law; providing training to SPCBs; utilising statutory provisions to establish a civil
administrative authority; developing a uniform database system; and establishing a support organisation
to facilitate effective communication between CPCB and the SPCBs.
In 2006, the Secretariat of the Asian Environmental Compliance and Enforcement Network undertook a
rapid assessment of India’s environmental compliance and enforcement programme. This assessment
reveals the constraints and challenges faced by the SPCBs and has recommended both short-term and
medium-term solutions for better compliance and enforcement. It has also elaborated on the key
challenges faced by the SPCBs’ management system and has endorsed most of the USEPA, 2005 study’s
recommendations. The report finds that there is insufficient coordination between the CPCB and the
SPCBs. The lack of nation-wide implementing guidelines, coupled with human and technical capacity
constraints, comes in the way of effective compliance and enforcement.
Also in 2006, the World Bank published the Country Environment Analysis of India (India: Strengthening
Institution for Sustainable Growth), which highlights the importance of capacity building for compliance
and enforcement in line with environmental pressures. This analysis also identified the gaps between the
regulators’ capacity and the ever-expanding multiple regulatory mandate.
THE CSE STUDY AND ITS SCOPE
The present study aims to identify the gaps between existing regulatory provisions and implementing
capacity of the SPCBs in India. The study’s objectives and methodology are as follows:
● To critically assess the roles and responsibilities of the SPCBs;
● To examine the regulatory capacity of the SPCBs for monitoring, compliance and enforcement;
● To explore the training requirements and provisions for capacity building; and,
● To gather public opinion about the overall performance of the SPCBs.
The study aims to identify the strengths, weaknesses and challenges faced by the state boards. For this
purpose, information has been collected from different SPCBs through a structured questionnaire.
Secondary data from annual reports and websites of respective SPCBs have also been used. In addition,
an opinion poll of the stakeholders (industry and civil society organisations) was conducted to know
their perceptions about the performance of the SPCBs.
The result of the study is this report, which primarily deals with the environmental regulators’ capacity to
monitor and enforce laws, rules and regulations in the country. The current chapter introduces the various
studies done on the performances of the SPCBs. It also explains the aims and objectives of the CSE study,
followed by an account of the methodology. Chapter Two examines the regulatory capacity of the SPCBs in
terms of financial and human resources. Chapter Three deals with the compliance and enforcement
performance of SPCBs, and presents a status report on training and capacity building in the boards.
Chapter Four provides an account of public perceptions about the performance of the SPCBs, while Chapter
Five lists the recommendations.
2
REFORM AGENDA FOR INDIA’S ENVIRONMENTAL REGULATORS

Regulatory capacity and resource mobilisationINTRODUCTION
Environmental regulatory capacity in India, reflected through various functions of the SPCBs, has not
been up to the mark; reports mentioned in Chapter One provide enough indications towards this. The
SPCBs’ capacity for effective monitoring, compliance and enforcement largely depends on a balanced
composition of board members, technical and legal skills of the staff, pattern of staffing, workloads and
the time and resources spent on monitoring and enforcement. These are the vital areas of the boards’
capacity that ensure their proper functioning. Resource mobilisation – technical and financial – by the
respective boards helps in building required capacity and infrastructure for effective functioning. The
boards have been empowered to mobilise resources from a wide spectrum of sources. This chapter
examines the regulatory capacity and the board’s ability to mobilise resources.
COMPOSITION OF THE STATE POLLUTION CONTROL BOARDS
The Water Act, 1974 prescribes the broad composition of the SPCBs, with specific qualifications for the
board members1. However, in many cases, the boards are by and large dominated by state bureaucracies
in their overall composition, though there are exceptions like the West Bengal Pollution Control Board
(WBPCB) which has technical and scientific members. It has three members each from the Calcutta
Medical College; the Department of Chemical Engineering of Jadavpur University; and the Institute of
Nuclear Physics. In addition to that, there is a fair representation of government departments, municipal
corporations and state-controlled cooperatives.2 The Andhra Pradesh Pollution Control Board (APPCB)
also has technical staff from Andhra University and the Environment Protection Training and Research
Institute (EPTRI).3 These two boards are exceptions as far as a balanced board is concerned. Rest of the
SPCBs in India are composed of members from state bureaucracies. For instance, the Gujarat Pollution
Control Board (GPCB) comprises of nine board members, all of whom hail from government
departments. There are no representations from local municipal authorities or academia.4 On the other
hand, representatives of local municipalities dominate the Madhya Pradesh Pollution Control
Board (MPPCB).5
The posts of the member secretary and chairperson are also dominated by bureaucrats (see Table 1 on
page 4: Predominance of IAS/IFS officers as chairperson and member secretary in SPCBs). Dilip Biswas,
former chairperson of CPCB, has critical views on appointing IAS/IFS officers as chairperson and member
secretary. He says: “The key person in an SPCB is the chairperson, who should be professionally qualified
and appointed on a full-time basis. Several SPCBs are headed by part-time chairpersons without the
requisite qualifications and experience. Most of them are often drawn either from the administrative
3
CHAPTER 2

service or the forest service and do not
have the requisite technical background
in pollution control. As a result, it
becomes difficult for them to provide
proper leadership and guidance to their
subordinates.”
Functioning of a board also depends on
security of tenure. Frequent replacement
of chairpersons hampers the overall
functioning of the boards. By the time a
chairperson becomes familiar with the
functioning of the organisation, he/she is
moved out. For example, the Uttar
Pradesh Pollution Control Board (UPPCB) has changed 24 chairpersons in the last 24 years, whereas the
Haryana State Pollution Control Board (HSPCB) has changed its chairperson 26 times since 1974,
indicating an average tenure of only one year for each chairperson.6 The Goa State Pollution Control
Board (GSPCB) reflects comparatively better security of tenure of its chairperson – over three years on
an average.7
STAFFING PATTERNS: IDENTIFYING THE GAPS
VacancyThe staff strength and composition of different boards have been assessed in this study, taking a
reference period from 2001-02 to 2005-06.
It has been found that many of the boards faced a staff crunch during this period. A majority of the boards
have failed to recruit personnel for their vacant posts, even after they have been sanctioned the requisite
staff. The Karnataka State Pollution Control Board (KSPCB) had 60 per cent of its sanctioned positions lying
vacant every year. This means that the board’s day-to-day activities were being run by less than half of its
sanctioned staff. Data shows that the percentage of vacant positions in the board has gone down marginally
in recent years (see Figure 1: Vacancies in SPCBs). The KSPCB has now decided to hire staff on a contractual
basis. The WBPCB had 24 per cent of its total sanctioned positions lying vacant, while the Chhattisgarh
board had 32 per cent vacant posts every year. The Maharashtra Pollution Control Board (MPCB) has a
comparatively better staff strength; it had only 8 per cent of its sanctioned posts lying vacant during the
REFORM AGENDA FOR INDIA’S ENVIRONMENTAL REGULATORS
Chairperson Member secretary
Boards contacted 28 28
Vacant posts 2 0
Boards with IAS/IFS officers as 14 17
Percentage of boards with IAS/IFS
officers as 54 61
Source: Information collected from various pollution control boards
Table 1: Predominance of IAS/IFS officers as chairpersonand member secretary in SPCBs
14
63
15
24
14
66
9
38
25
14
66
8
38
25
14
50
4
38
26
15
56
4
46
21
0
10
20
30
40
50
60
70
GPCB KSPCB MPCB CSPCB WBSPCB
Perc
en
tage o
f v
acan
t p
osit
ion
s
2001-02 2002-03 2003-04 2004-05 2005-06
Source: Analysis of information provided by the SPCBs to CSE for the regulator’s programme
Figure 1: Vacancies in SPCBs
4

same period. The number of vacancies also shows a progressively declining trend, indicating the MPCB’s
willingness to fill up the posts.
Responses from SPCBs reveal that many posts were sanctioned, but hiring did not take place due to the
cumbersome process that requires approvals from the state government. In some cases, financial
constraints and budgetary restrictions were highlighted as reasons for a large number of vacant posts.
Communication with officials of the SPCBs revealed that the boards were unable to attract qualified staff
due to poor pay scales (compared to the private sector), fewer promotions and lack of opportunities for
growth. The CPCB also faces similar problems (see Box: Humanpower crisis at CPCB).
5
REFORM AGENDA FOR INDIA’S ENVIRONMENTAL REGULATORS
The Central Pollution Control Board is facing a shortfall of
personnel, especially in the technical and scientific areas.
One of the reasons for this problem is the cumbersome
recruitment process. Also, existing staff are lured away by
private sector organisations which offer better salaries and
job profiles. Although the CPCB is a scientific and technical
organisation responsible for advising the Union ministry of
environment and forests (MoEF) and undertaking research
on pollution control and abatement, salaries of its
employees are not at par with those of other technical
organisations like the DRDO, CSIR, Department of Space,
Department of Atomic Energy, etc.
Although the Board is a highly specialised and scientific
institution, its scientific and technical staff are not covered
under the Flexible Complimentary Scheme (FCS), unlike
the employees of organisations like CSIR, DRDO and MoEF.
Under FCS, a time-bound promotion is applicable after
every five years of tenure at one post. Denied this scheme,
the scientific staff of CPCB are demotivated and their
positions have stagnated due to lack of time-bound
promotions. The employees of CPCB also do not get social
benefits such as medical or accidental insurance despite
the fair amount of risk of injuries and threats to their life
while conducting laboratory work and inspection visits to
industries.
Though the CPCB has tried to introduce computerisation,
data management and information technology, it lacks
computer specialists, which hampers its progress in this
direction. There are no basic qualifications required for
hiring staff at CPCB. Personnel recruited at junior levels
do not have even basic computer training and
knowledge.
There exists a gap between the pay scales of the
chairperson and member secretary of the CPCB. The
member secretary functions as the second-in-command
after the chairperson. However, the salary of the member
secretary is the same as that of the director/s in CPCB,
whereas, as per the official hierarchy, these directors have
to report to the member secretary. Also, the member
secretary has been entrusted with more responsibilities
compared to the directors.
According to J M Mauskar, former chairperson of CPCB,
“As CPCB functions with professionals recruited from a
pool of scientists and engineers, the pay package should
be made more lucrative. Being a low-paying organisation,
talented professionals are leaving it and joining other
private organisations where they are being paid
handsomely.” Mauskar also believes that a well-paid
employee will be more honest and diligent and will help
in weeding off the corruption in the Board.
The CPCB has given some suggestions to the Sixth Pay
Commission to contain its loss of quality personnel. These
suggestions include:
● All scientific and technical employees in CPCB should
be covered under the FCS.
● A special pay package/allowance should be given as
incentive to high risk departments/laboratories along
with accidental insurance covers.
● Pay scales of scientific and technical staff should be at
par with other technical institutions such as CSIR,
DRDO, etc.
● Lower-level staff should be recruited with basic
working knowledge of computers and other office
automation. They should also be graduates at least.
● Specialised professionals such as IT and legal experts
should be hired.
● Pay scales for the post of member secretary should be
raised to somewhere between that of the chairperson
and the directors.
The Sixth Pay Commission recommendations kept the pay
scales of the members secretary and the directors at the
same level. However, a source in the MoEF says the
ministry has issued four orders in 2008 to regularise the
contractual staff in CPCB.
HUMANPOWER CRISIS AT CPCB

To overcome the staff shortage, most SPCBs have resorted to hiring contractual staff. However,
contractual employees cannot be used for any activities that may involve legal compliance and
enforcement. These employees are also not eligible for standard benefits and therefore, have low work
motivation.
CompositionThe functions of a state board are highly technical in nature and involve monitoring of industries vis-à-
vis the existing laws and regulations and implementing programmes and policies for pollution control.
Though the SPCBs hire technical personnel comprising of technical officers and scientists, non-technical
staff dominate the boards. The MPCB, which represents one of the most industrialised states in the
country, has (on an average) 55 per cent non-technical staff on its payrolls. Similarly, the Tamil Nadu
Pollution Control Board (TNPCB), the Chhattisgarh Environment Conservation Board (CECB) and the
WBPCB are also dominated by non-technical staff (see Figure 2: Board-wise composition of staff). The
KSPCB has a healthy ratio in favour of technical staff. However, the high ratio of technical staff in KSPCB
may not represent a correct picture, as a significant number of positions lie vacant.
WorkloadThe SPCBs are facing this problem of inadequate staff amidst an increasing number of industries that
need to be regulated. As a result, workload on the staff is increasing every year. The data shows an
overall increase in number of industries, while sanctioned positions have remained more or less constant
during 2001-02 and 2005-06 in most of the boards. For example, in Karnataka, the number of industries
has increased 2.5 times over the five years (2001-02 to 2005-06), while the number of sanctioned posts has
gone down from 769 to 675 during the same period (see Figure 3: Staff vs industries: the case of the
Karnataka State Pollution Control Board). Considering that 60 per cent of the sanctioned posts are lying
vacant at the KSPCB, the workload of the existing staff has increased manifold.
The case is similar in other SPCBs. While the number of industries in Gujarat has gone up by 70 per cent
during 2002-03 and 2005-06, the sanctioned positions in the Gujarat board have remained constant at 549.
The same was also observed in the case of CECB and MPCB.
6
REFORM AGENDA FOR INDIA’S ENVIRONMENTAL REGULATORS
52
62
4547
4345
48
38
5553
5755
0
10
20
30
40
50
60
70
GPCB KSPCB MPCB CECB TNPCB WBPCB
Technical and scientific staff Non-technical staff
Pe
rce
nta
ge
of
tota
l sta
ff
Source: Analysis of information provided by the SPCBs to CSE for the regulator’s programme
Notes: The data is an average of the years 2001-2002 to 2005-2006. Legal staff and scientists have been considered as technical.
Figure 2: Board-wise composition of staff
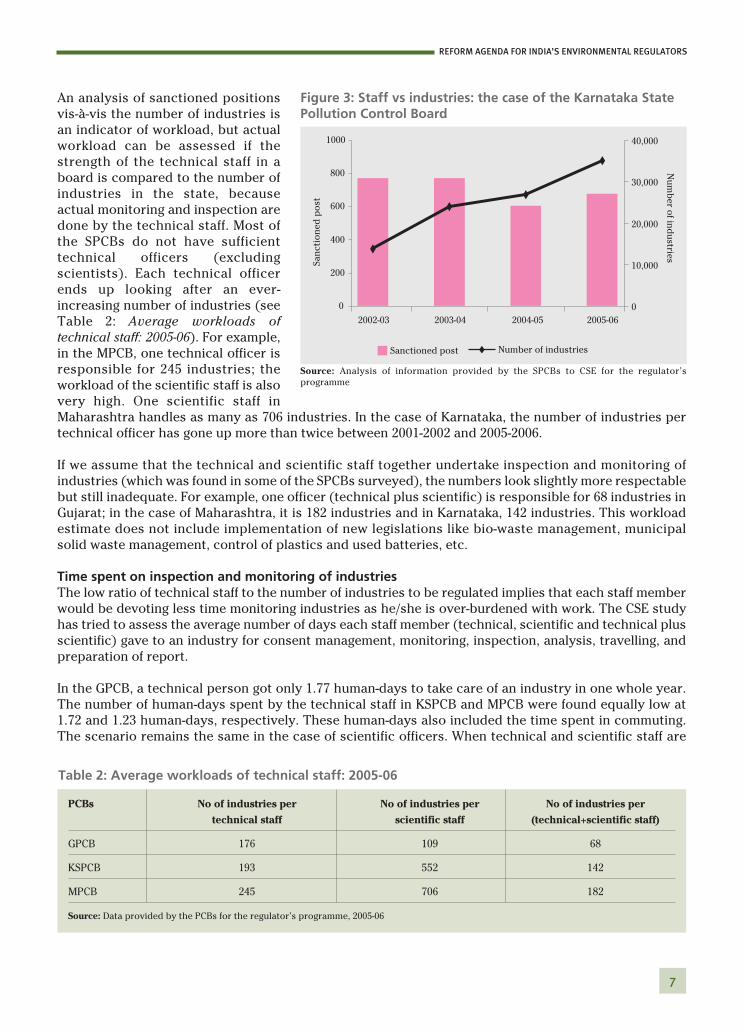
An analysis of sanctioned positions
vis-à-vis the number of industries is
an indicator of workload, but actual
workload can be assessed if the
strength of the technical staff in a
board is compared to the number of
industries in the state, because
actual monitoring and inspection are
done by the technical staff. Most of
the SPCBs do not have sufficient
technical officers (excluding
scientists). Each technical officer
ends up looking after an ever-
increasing number of industries (see
Table 2: Average workloads of
technical staff: 2005-06). For example,
in the MPCB, one technical officer is
responsible for 245 industries; the
workload of the scientific staff is also
very high. One scientific staff in
Maharashtra handles as many as 706 industries. In the case of Karnataka, the number of industries per
technical officer has gone up more than twice between 2001-2002 and 2005-2006.
If we assume that the technical and scientific staff together undertake inspection and monitoring of
industries (which was found in some of the SPCBs surveyed), the numbers look slightly more respectable
but still inadequate. For example, one officer (technical plus scientific) is responsible for 68 industries in
Gujarat; in the case of Maharashtra, it is 182 industries and in Karnataka, 142 industries. This workload
estimate does not include implementation of new legislations like bio-waste management, municipal
solid waste management, control of plastics and used batteries, etc.
Time spent on inspection and monitoring of industriesThe low ratio of technical staff to the number of industries to be regulated implies that each staff member
would be devoting less time monitoring industries as he/she is over-burdened with work. The CSE study
has tried to assess the average number of days each staff member (technical, scientific and technical plus
scientific) gave to an industry for consent management, monitoring, inspection, analysis, travelling, and
preparation of report.
In the GPCB, a technical person got only 1.77 human-days to take care of an industry in one whole year.
The number of human-days spent by the technical staff in KSPCB and MPCB were found equally low at
1.72 and 1.23 human-days, respectively. These human-days also included the time spent in commuting.
The scenario remains the same in the case of scientific officers. When technical and scientific staff are
7
REFORM AGENDA FOR INDIA’S ENVIRONMENTAL REGULATORS
PCBs No of industries per No of industries per No of industries per
technical staff scientific staff (technical+scientific staff)
GPCB 176 109 68
KSPCB 193 552 142
MPCB 245 706 182
Source: Data provided by the PCBs for the regulator’s programme, 2005-06
Table 2: Average workloads of technical staff: 2005-06
Sanctioned post Number of industries
0
200
400
600
800
1000
2002-03 2003-04 2004-05 2005-06San
cti
on
ed
po
st
0
10,000
20,000
30,000
40,000
Nu
mb
er o
f ind
ustrie
s
Source: Analysis of information provided by the SPCBs to CSE for the regulator’s
programme
Figure 3: Staff vs industries: the case of the Karnataka StatePollution Control Board

8
REFORM AGENDA FOR INDIA’S ENVIRONMENTAL REGULATORS
taken together, the average time spent on one industry goes up marginally, but it still not enough for
proper monitoring and enforcement (see Table 3: Time spent by technical staff for industrial monitoring in
a year).
Most boards end up giving a range of responsibilities to their technical staff due to the shortage of
human-power. An environmental engineer is made responsible for monitoring and inspection of
industries, but he/she has to also look after administrative responsibilities of clearing day-to day files. A
significant amount of human-days of the technical staff goes into paperwork that involves clearances and
consents. In fact, according to most SPCBs, their technical staff spent maximum time and effort on
consent management. Most SPCBs lack the resources to develop the necessary computerised systems to
manage information flow and to track activities. As a result, much of their human-days are devoted to
administrative activities instead of actions that may reduce pollution. In addition, the judicial activism
ensuring the agenda of environmental improvement in India has added new roles and responsibilities to
the boards, including the CPCB. The courts often ask boards to address priority programmes or provide
information on a certain industrial unit or programme. Similarly, court cases (mainly PILs) by individuals
against industries or boards also add to the workload. In the recent past, several new programmes have
been introduced under the Environment Protection Act (such as hazardous waste management, bio-
waste management, and control of plastics and used batteries) with significant start-up needs which
have added to the workload of the boards without a corresponding increase in human resources.
FINANCIAL RESOURCE MOBILISATION
Financial resources of the SPCBs come from their own resources and from external assistance. Many
boards are highly dependent on external sources of funds, even for salary and office expenses. The
financial resources of an SPCB can broadly be categorised into the following:
● Own resources of a state board consist of cess reimbursement8, consent fees9 and interest on
investments. Other minor sources include receipts from consultancy and sponsored projects,
sample testing fees, appellate fees, receipts from the sale of forms, fines and forfeitures, etc.
● External assistance is composed of funds received by the board from the government of India, the
concerned state government and the CPCB10, grants-in-aid provided by the concerned state
government and other grants from time to time.
There is a wide variation in the level of income generated by different boards. The Bihar State
Pollution Control Board (BSPCB) has an average annual income of Rs 3.18 crore, whereas the KSPCB and
MPCB earn as much as Rs 36.94 and Rs 35.91 crore, respectively (see Table 4: Incomes of various pollution
control boards). This disparity exists mainly because the states of Maharashtra and Karnataka have a
large number of industries and therefore, earn more revenues through consent fees and cess
reimbursements. Similarly, the TNPCB, UPPCB and WBPCB have much larger financial resources.
No of days/ Technical No of days/ Scientific staff No of days/ Technical + No of days/
year staff work industry work load industry scientific staff industry
load (No of (No of work load
industries industries (No of industries
per staff) per staff) per staff)
GPCB 300 176 1.77 109 2.87 68 3.9
KSPCB 300 193 1.72 552 0.60 142 1.9
MPCB 300 245 1.23 706 0.43 182 1.4
Source: Analysis of information provided by the SPCBs to CSE for the regulator’s programme
Table 3: Time spent by technical staff for industrial monitoring in a year

Trends in financial resource mobilisation by select state boards show a progressive increase over time,
except in the case of Karnataka, where the board shows a drop of 8 per cent in its income during 2001-02
and 2005-06. The KSPCB has registered a decline in aid from external sources, whereas the OSPCB and
CECB – which are in states that are the new emerging destinations of industrialisation – have posted a
healthy growth in their incomes. The income of the OSPCB has almost increased three times during 2002-
03 and 2005-06, while that of the Chhattisgarh board has gone up by as much as eight times during the
same period.
Sources of income: grants and internal resourcesInternal resources such as water cess, fees from consent and NOCs are the major avenues of income for
many boards. The WBPCB, UPPCB, MPCB, GPCB, KSPCB and the TNPCB have generated more than 80 per
cent of their incomes from internal resources (see Figure 4: Sources of funds for SPCBs). On the other
hand, the pollution control boards/committees in the northeastern states and in Jammu & Kashmir (J&K)
depend heavily on external aid from their respective state governments. The Sikkim State Pollution
Control Board (SSPCB) received Rs 22.5 lakh as grant from state government in 2007-08; other receipts
were worth another Rs 8.55 lakh. The total grant received from state was utilised for the payment of
salaries of SPCB officials. Therefore, the board was left with a mere Rs 8.55 lakh for all other expenses
which included monitoring, inspection, laboratory, travel, etc. The boards of Kerala and J&K receive over
80 per cent of their funding through government
grants.11 This is because there are very few
industries in these states and they face
constraints in mobilising their own resources.
Consent and NOC feesAmong the various sources of income of the
boards in Maharashtra, Karnataka, West Bengal,
Orissa and Chhattisgarh, consent (consent to
establish and consent to operate) and NOC fees
offer the major share of the income (see Table 5
on page 10: Source-wise incomes of various
pollution control boards). However, many boards
like the BSPCB do not benefit much from these
fees. This is because they are less industrialised;
another reason is the differential structure of the
consent fees across the states of India. For
instance, if an industrial unit that falls in an
investment limit between Rs 50 lakh and Rs 100
9
REFORM AGENDA FOR INDIA’S ENVIRONMENTAL REGULATORS
BSPCB GPCB KSPCB MPCB OSPCB WBPCB UPPCB TNPCB CECB
2001-02 307.9 1313.4 3386.6 2794.6 NA 1501.3 1398.9 2029.9 69.1
2002-03 294.3 1324.7 2962.8 2480.6 291.4 1655.0 1242.3 2181.8 NA
2003-04 322.5 2570.6 4355.0 3328.8 525.5 2075.6 1031.3 2375.0 321.2
2004-05 NA 2428.1 3825.7 3933.2 850.8 1803.5 1647.3 2354.9 537.7
2005-06 NA 1397.8 3121.7 5421.4 866.5 3156.9 881.0 NA NA
Average 318.0 1806.9 3694.3 3591.7 722.1 2038.4 1240.1 2235.4 392.6
Source: Analysis of information provided by the SPCBs to CSE for the regulator’s programme
NA: Not available
Table 4: Incomes of various pollution control boards (Rs in lakh)
93.8
91.5
91.2
91.0
83.8
98.9
100.0
86.6
6.2
8.5
8.8
9.0
16.2
1.1
0.0
13.4
0 20 40 60 80 100
GPCB
KSPCB
MPCB
OSPCB
CECB
TNPCB
UPPCB
WBPCB
Contribution in per cent
Fund received Internal source
Source: Analysis of information provided by the SPCBs to CSE for the
regulator’s programme
Figure 4: Sources of funds for SPCBs

10
REFORM AGENDA FOR INDIA’S ENVIRONMENTAL REGULATORS
BSP
CB
%
GP
CB
%
KSP
CB
%
MP
CB
%
OSP
CB
%
CE
CB
%
TN
PC
B%
U
PP
CB
%
WB
PC
B%
Sale
of
form
s a
nd
pu
bli
cati
on
s1.2
40.3
94.4
30.2
50.6
50.0
220.1
60.5
60.1
00.0
30.0
9.5
90.4
7
Wate
r cess
56.2
917.7
0302.6
916.7
5306.0
78.2
8813.0
022.6
4140.8
019.5
0147.3
637.5
3299.2
13.4
1035.4
883.5
0935.5
245.8
9
Co
nsen
t an
d N
OC
fees
95.3
229.9
8954.4
752.8
21985.6
853.7
51703.0
347.4
2354.3
149.0
6173.8
944.2
91008.3
45.1
204.6
516.5
0786.2
738.5
7
Inte
rest
on
inv
estm
en
t129.0
540.5
8287.0
015.8
8236.9
06.4
1416.5
911.6
047.7
46.6
17.8
52.0
0523.9
23.4
Receip
t fr
om
co
nsu
ltan
cy
an
d
oth
er
pro
ject
3.1
60.1
70.0
Sam
pli
ng f
ees
12.2
13.8
4139.3
37.7
133.8
30.9
2217.6
66.0
66.2
10.8
6327.7
14.7
Ap
pell
ate
fees
0.0
50.0
00.0
10.0
00.0
20.0
00.0
Fin
es a
nd
forf
eit
ure
s e
tc0.5
50.0
30.6
40.0
20.6
50.0
20.0
An
y o
ther
1.4
90.4
72.3
60.1
3814.7
122.0
5104.1
32.9
0108.0
314.9
651.2
2.3
33.5
61.6
5
To
tal
ow
n
reso
urc
es
295.6
92.9
61694.0
393.7
53378.5
91.4
53275.2
591.1
9657.0
790.9
9329.2
183.8
52210.3
98.9
1240.1
3100.0
01764.9
486.5
8
Gra
nt
in a
id f
rom
the s
tate
go
vern
men
t111.5
96.1
840.9
01.1
11.8
10.0
51.7
50.2
428.9
07.3
6180.0
98.8
3
Oth
er
fun
ds f
rom
the s
tate
go
vern
men
t31.3
91.5
4
Fu
nd
s r
eceiv
ed
fro
m t
he c
en
tral
go
vern
men
t 15.5
44.8
969.2
01.8
7238.9
66.6
57.3
61.8
70.0
3
Fu
nd
s r
eceiv
ed
fro
m t
he C
en
tral
Po
llu
tio
n C
on
tro
l
Bo
ard
6.8
42.1
51.3
00.0
78.4
00.2
375.6
72.1
115.0
03.8
20.6
1.1
0
An
y o
ther
fun
ds,
gra
nts
or
aid
s
receiv
ed
197.3
65.3
463.3
212.1
73.1
024.6
1.1
262.0
23.0
4
To
tal
exte
rnal
reso
urc
es
22.3
87.0
4112.8
96.2
5315.8
58.5
5316.4
48.8
165.0
79.0
163.4
316.1
525.1
0.0
3273.5
013.4
2
To
tal
inco
me
317.9
81806.9
23694.3
43591.6
9722.1
4392.6
32235.4
1240.1
32038.4
4
So
urc
e:
An
aly
sis
based
on
An
aly
sis
of
info
rmati
on
pro
vid
ed
by
th
e S
PC
Bs t
o C
SE
fo
r th
e r
egu
lato
r’s p
rogra
mm
e
No
tes:
Th
e d
ata
is a
n a
vera
ge o
f th
e y
ears
2001-2
002 t
o 2
005-2
006.
Tab
le 5
: So
urc
e-w
ise
inco
mes
of
vari
ou
s p
ollu
tio
n c
on
tro
l bo
ard
s (R
s in
lakh
)

lakh applies for consent in Haryana, it has to pay Rs 14,500 as fees, whereas if the same unit applied for
consent in Gujarat, the fee would only be Rs 5,000. Despite this differential consent fees structure, the
number of industries in most of the states has been going up, and so has been the collection from consent
fees during the recent period. In the case of MPCB, earnings from consent fees and NOCs have gone up
by 142 per cent during 2001-02 and 2005-06. The OSPCB has also registered a growth of 101 per cent
during the same period.
Water cessWater cess constitutes the second largest source of income for most of the boards. The Water
(Prevention and Control of Pollution) Cess Act, 1977 provides for “the levy and collection of cess on
water consumed by persons carrying on certain industries and by local authorities, with a view to
augment financial resources of the Central Board and the State Boards”. The Act extends to the whole of
India, except J&K. The Act has specified industries that have to pay water cess. These include the ferrous
and non-ferrous metallurgical industry, and mining, ore processing, petroleum, petrochemicals,
chemicals, ceramics, cement, textiles, paper, fertilizers, coal, power, processing of animal or vegetable
products and engineering sectors. Restricting the payment of water cess to these specific industries has
a direct implication for the total revenues of SPCBs whose states do not have these industries; these
boards lose their revenues. Many state boards have suggested that the water cess should be made
applicable for all types of industries, thereby ensuring a steady flow of income to the exchequer.
Interest and finesThe income from interest on investments contribute significantly to the total revenues of some state
boards. For example, about 25 per cent of TNPCB’s revenues come from interest; the BSPCB generated 40
per cent of its total funds from the interest on its investments. Fines and forfeitures currently contribute
below 1 per cent in most of the boards. Once the principle of ‘polluter pays’ is adopted, fines and
forfeitures could become an important source for most of the boards.
Bank guaranteesSome SPCBs (Maharashtra, Andhra Pradesh and West Bengal) have also started a bank guarantee
scheme which is not only a source of income for them, but also an instrument to ensure compliance.
Under this scheme, a state board requires the non-complying firm to post a bank guarantee to ensure the
implementation of corrective actions in accordance with the negotiated compliance schedule. Renewal
of consent to operate is conditional on posting the guarantee. Normally, 10 per cent of the estimated total
compliance cost is required as bank guarantee. If a firm fails to comply on time, the SPCB forfeits a
portion or the entire bank guarantee for its discretionary use. There is no official procedure to determine
the amount of forfeiture, and the decision is made by the SPCB chairperson and member secretary.
Between January 2005 and August 2006, the WBPCB imposed 92 bank guarantees worth US $3.5 million,
of which two were forfeited.
The forfeiture is a powerful monetary penalty for a violator and a significant deterrent against future non-
compliance. However, many issues related to the application of bank guarantees remain to be clarified:
how the guarantee should be calculated, how forfeitures should be calculated and revenues used, and
whether supplementary collateral should be required if the compliance schedule is extended. Most
importantly, many boards believe that a bank guarantee is not allowed under current law and a legal
clarification is required before it can be widely used.
NATURE AND PATTERN OF EXPENDITURE
The pattern of expenditure of state boards indicates fairly high variability, with some boards spending
more than Rs 35 crore annually to some spending as low as Rs 2 crore. The KSPCB, on an average, spent
as much as Rs 32.67 crore annually between 2001-02 to 2005-06. The CECB, on the other hand, spent Rs
1.89 crore every year (see Table 6 on page 12: Expenditures of SPCBs).
11
REFORM AGENDA FOR INDIA’S ENVIRONMENTAL REGULATORS

Most of the boards have a balanced income-expenditure ratio; however, the Karnataka, Madhya Pradesh
and Orissa boards have spent more than their earnings in one or two years over the last five years (see
Table 7: Ratio of expenditure to income in SPCBs). The Karnataka board has incurred a huge expenditure
on infrastructure and equipment as well as on wages and salaries (see Table 8A and 8B: Patterns of
expenditure in SPCBs). The KSPCB had hired more people on contract during this period.
There is a wide variation in resource utilisation pattern of different boards. While the Karnataka board
has shown high resource utilisation, the GPCB, WBPCB and TNPCB indicate relatively lower resource
utilisation rates. The WBPCB has been able to utilise only 27.6 per cent of its income in 2005-06. Excluding
the year 2004-05, it has also shown a consistent decline during the last five years in income-expenditure
ratio, indicating poor fund utilisation.
Some of the SPCBs that this study examined do not manage to spend even 60 per cent of their incomes;
they, therefore, have surpluses. For example, the boards of Maharashtra and Gujarat were left with a
surplus of Rs 25.19 crore in 2005-06 and Rs 22.97 crore in 2004-05, respectively. One of the reasons for this
low resource utilisation is the control exerted by the respective state governments. The GPCB, for
instance, requires prior permission of the state government for any capital expenditure towards
purchase of assets, furniture, vehicles, land or buildings.
The degree of state control is much less in the case of MPCB; the board is free to plan and use its
resources, but needs to present its budget to the state government and take an approval. Contrary to
12
REFORM AGENDA FOR INDIA’S ENVIRONMENTAL REGULATORS
GPCB KSPCB MPCB OSPCB CECB TNPCB WBPCB UPPCB
2001-02 75.3 81.8 67.5 NA 147.6 53.4 46.3 97.6
2002-03 82.4 156.3 59.9 114.4 NA 48.3 37.7 77.1
2003-04 41.1 70.0 67.0 69.5 NA 45.4 32.8 68.5
2004-05 50.9 81.4 112.6 53.3 33.6 46.4 55.8 50.0
2005-06 92.6 88.9 53.7 46.3 NA NA 27.6 79.2
Average 68.5 95.7 72.2 70.9 90.6 48.4 40.0 74.5
Source: Data analysed based on information provided by various boards for the regulator’s programme
NA: Data Not available
Table 7: Ratio of expenditure to income in SPCBs (in percentage)
GPCB KSPCB MPCB OSPCB CECB TNCPB WBPCB UPPCB
2001-02 988.9 2771.9 1887.3 NA 102.0 1084.1 694.4 1365.9
2002-03 1092.1 4630.3 1485.8 333.4 195.4 1053.0 623.3 958.0
2003-04 1055.8 3046.8 2231.5 365.4 NA 1078.1 681.0 706.7
2004-05 1235.7 3113.9 4429.7 453.8 180.8 1092.1 1005.8 823.0
2005-06 1293.8 2775.9 2910.2 401.4 202.3 NA 871.7 697.3
Average 1133.3 3267.7 2588.9 388.5 189.3 1076.8 775.2 910.2
Source: Analysis of information provided by the SPCBs to CSE for the regulator’s programme
NA: Not available
Table 6: Expenditures of SPCBs (Rs in lakh)

13
REFORM AGENDA FOR INDIA’S ENVIRONMENTAL REGULATORS
this, prohibitive spending restrictions have been imposed by the respective state governments on most
of the northeastern state boards. The SSPCB, for example, does not even have a separate budget. Its
entire budget comes from the Department of Forest, government of Sikkim.
Heads of expenditure Wages and salaries, legal fees and charges for consultants etc are the major heads of expenditure of the
SPCBs. With the exception of the KSPCB and the CECB, the rest of the boards spend almost half of their
money on salaries (see Figure 5: Expenditure on salaries). The TNPCB, GPCB and OSPCB have spent as
much as 85.9 per cent, 68.7 per cent and 63.7 per cent of their total expenses, respectively, on salaries.
The Gujarat board has spent only 0.27 per cent of its total expenditure on testing, monitoring and office
equipment, while this figure for the MPCB stands at 8.27 per cent. This indicates that most of the boards
are not spending sufficiently on testing, monitoring and compliance assurance.
Average: 2001-02 to 2005-06 OSPCB CECB TNPCB WBPCB
Rs lakh % Rs lakh % Rs lakh % Rs lakh %
Wages and salaries 247.3 63.7 45.0 23.8 925 85.9 349.2 45.1
Legal fees and fees to consultant
and specialists NA 0.4 0.2 7.6 0.7 NA
Other administrative expenses 75.4 19.4 44.3 23.4 27.1 2.5 426.0 54.9
Total revenue expenditure 322.8 83.1 89.7 47.4 959.7 89.1 775.2 100.0
Testing and monitoring
equipment and instruments NA 4.8 2.5 20.5 1.9 NA
Office equipment NA 11.1 5.9 54.6 5.1 NA
Other capital expenses 65.7 16.9 83.6 44.2 42.0 3.9 NA
Total Capital expenditure 65.7 16.9 99.6 52.6 117.1 10.9 NA
Total expenditure 388.5 189.3 1076.8 775.2
Source: Data analysed based on information provided by various boards for the regulator’s programme
Table 8B: Patterns of expenditure in SPCBs
Average: 2001-02 to 2005-06 BSPCB GPCB KSPCB MPCB
Rs lakh % Rs lakh % Rs lakh % Rs lakh %
Wages and salaries 168.2 79.8 778.2 68.7 720.2 22.3 1150.0 44.4
Legal fees and fees to consultant
and specialists 1.7 0.8 12.4 1.1 0.0 0.3 7.7 0.3
Other administrative expenses NA NA 288.9 25.5 1516.5 3.6 653.5 25.2
Total revenue expenditure 169.9 80.6 1079.5 95.3 2236.7 26.2 1811.3 70.0
Testing and monitoring
equipment and instruments 0.4 0.2 6.6 0.6 0.0 0.0 214.2 8.3
Office equipment 0.7 0.4 1.6 0.1 0.0 0.1 0.00
Other capital expenses 39.7 18.8 45.5 4.0 1031 73.7 563.4 21.8
Total capital expenditure 40.8 19.4 53.7 4.7 1031 73.8 777.6 30.0
Total expenditure 210.7 1133.3 3267.7 2588.9
Source: Data analysed based on information provided by various boards for the regulator’s programme
Table 8A: Patterns of expenditure in SPCBs

The other administrative costs also
account for significant portions of
the total expenditure. Except the
KSPCB and the CECB, none of the
other boards have made any
significant capital investments. In
fact, the KSPCB has the maximum
capital investment of 74 per cent of
the total expenditure in five years
(2001-02 and 2005-06).
REGULATORY COSTS
The ratio of expenditure and
industries gives an idea of the
regulatory costs. There are wide
variations between the SPCBs in
regulatory costs per industry (see
Table 9: Expenditure per industry).
Available data indicates the MPCB
spent only Rs 5,004 per industry,
whereas the CECB spent as much as
Rs 47,230. The most industrialised
states of Gujarat and Maharashtra
seem to have comparatively lower
regulatory costs compared to other
states. There is no explanation for
this, other than the fact that the
number of industries being covered
under the regulatory basket in Orissa
and Chhattisgarh is low compared to
Gujarat and Maharashtra. The
analysis of the number of inspections
done, amount of monitoring and
sample collection and compliance
records of different states does not
indicate any corelation between
expenditure per industry and
monitoring and enforcement
performance (see Chapter Three).
While there are no fixed patterns of
expenditure emerging across the
boards, in most cases, the spending
per industry has been declining
over the years. The amount of
money spent by the Karnataka
board on monitoring an industry
has declined almost 10 times
between 2002-03 and 2005-06. This
can be partly explained by the high
capital expenditure incurred by the
KSPCB in the initial years.
14
REFORM AGENDA FOR INDIA’S ENVIRONMENTAL REGULATORS
GPCB KSPCB MPCB OSPCB CECB
2001-02 8503 NA NA NA 35905
2002-03 7325 33778 2976 22495 73187
2003-04 5923 12742 4205 20869 NA
2004-05 6884 11634 7937 18439 46608
2005-06 6348 7921 4899 14576 33220
Average 6997 16519 5004 19094 47230
Source: Analysis of information provided by the SPCBs to CSE for the regulator’s
programme
NA – Not available
Table 9: Expenditure per industry (in Rs)
GPCB KSPCB MPCB OSPCB CECB
2001-02 12284 NA NA NA 36418
2002-03 9450 62462 8300 NA 73187
2003-04 6684 NA 12776 NA NA
2004-05 7777 NA 24491 NA 46608
2005-06 6959 NA 14831 17154 33220
Average 8631 62462 15100 17154 47358
Source: Analysis of information provided by the SPCBs to CSE for the regulator’s
programme
Table 10: Expenditure per polluting industry (red + orange categories) (in Rs)
68.7
22.3
44.4
63.7
23.8
85.9
45.1
0
20
40
60
80
100
GPCB KSPCB MPCB OSPCB CECB TNPCB WBPCB
Pe
rce
nta
ge
ex
pe
nd
itu
re o
n
sa
lary
an
d w
ag
es
Figure 5: Expenditure on salaries
Source: Analysis of information provided by the SPCBs to CSE for the regulator’s programme

In the case of expenditure on monitoring of polluting (red and orange category) industries, the spending
increases significantly in some boards. On an average, the board of Maharashtra spent
Rs 15,100 per polluting industry, while the KSPCB spent as much as Rs 62,462 (see Table 10: Expenditure
per polluting industry). The Gujarat board, which probably has to monitor the highest number of polluting
industries, does not show much difference in its expenditure on them.
CONCLUSION
The boards need to improve the strength of their staff by filling the vacant posts and demanding creation
of more technical posts. The performance of the boards indicates a serious lack of quality personnel, as
existing staff members are over-burdened and hence unable to perform optimally. According to the
member secretary of the Gujarat PCB, “The board should continuously build its technical staff capacity
and competency as new rules, strictures and responsibilities are entrusted upon it from time to time…
lack of staff, infrastructure, technical skills and legal powers are the major weaknesses which need
strengthening.” The current analysis also indicates that there are few legal personnel in the boards and
no fresh recruitments have been done to amend this situation (see Chapter Three). It is important to
develop expertise beyond the traditional skills to include legal professionals, programme analysts,
computer experts, training experts, statisticians, communication specialists, etc.
In terms of financial performance of the boards, the study finds that no clear pattern is emerging. Many
boards depend heavily on government grants. Some are self-sufficient in a sense that they earn more than
their expenditures. However, what needs a detailed examination is whether the money would be
adequate in case the staff strength is enhanced and more intense monitoring and inspection is done. In
any case, a multi-faceted approach is required to increase and improve the human and financial
resources of the boards.
15
REFORM AGENDA FOR INDIA’S ENVIRONMENTAL REGULATORS
PERFORMANCE INDICATORS: THE MAHARASHTRA POLLUTION CONTROL BOARD
The MPCB is the most well-funded and well-staffed board in the country. However, a critical analysis of the board’s
performance indicates large scope for improvements. The board’s average human-days spent on inspection amounts to 1.4
per year per industry. The average inspection per industry is 0.3, meaning that only 30 per cent of the regulated industries
are inspected annually. Expenditure on testing and monitoring equipments is very low.
Performance parameters Average of 2001-02 to 2005-06
Income (Rs in lakh) 3591.7
Expenditure (Rs in lakh) 2588.9
Expenditure as percentage of income 72 per cent
Percentage expenditure on testing and monitoring equipment 8.3 per cent
Percentage expenditure on wages and salaries 44.4 per cent
Percentage increase in technical and scientific staff 2 per cent
Percentage increase in number of industries 19 per cent
Workload (industries per technical and scientific staff) 182
Avg. human-days spent by technical and scientific staff per industry 1.4
Consent to establish issued (2005-06) 2999
Consent to operate issued (2005-06) 8504
Average inspection per industry per year 0.3

16
CHAPTER 3
Compliance and enforcement performanceINTRODUCTION
The state boards are the primary compliance, monitoring and enforceable entities in the country. They
have been entrusted with a wide range of responsibilities ranging from implementation of policies to
creating public awareness. But the core responsibility of these boards lies in ensuring compliance with
standards through inspection and monitoring; award of consent; implementation of the National Ambient
Air and Water Quality Standards; conducting public hearings; generating environmental awareness; and
imparting training to their own staff. The performance of the boards in implementing these functions has
been analysed in this chapter.
GRANT OF CONSENT
Two types of consents are awarded by SPCBs – consent to establish (CTE) and consent to
operate (CTO). Consent to establish is essentially a site clearance for establishing an industrial unit
after an evaluation of the potential environmental impacts and proper design of pollution control
installations. This is an important power and function of the SPCBs, as it enables them to maintain an
inventory of new industries and examine each one of them on their levels of technological acumen,
pollution control measures, impacts on natural resources and other related environmental impacts.
Consent to operate refers to a permission that an industrial unit must obtain in order to operate for
discharge of wastes and emissions into water and air. Usually, a separate consent is granted under the
Air, Water and Hazardous Waste Act, but states like Gujarat and Maharashtra issue consolidated
consents for air and water pollution and hazardous wastes, based on a Common Consent Application
(CCA).
In the five years starting 2001-2002, the KSPCB, WBPCB and MPCB respectively issued 30,299, 19,931 and
14,993 CTEs. Except the UPPCB and the WBPCB, the rest have shown an overall increasing trend in
issuing consents to establish (see Table 11: Status of consent to establish issued by SPCBs). The increasing
trend in granting CTEs points to fast and rapid industrialisation in the country.
Refusal rate for CTEs varies across the boards. The WBPCB and MPCB have denied consents to
establish to less than 1 per cent of the total applications they received (see Figure 6: Refusal rate for
consent to establish issued by SPCBs). However, the refusal rate of the UPPCB and GPCB are as high 34
and 31 per cent, respectively. The OSPCB has denied the CTE to 8 per cent of the total proposals it
received. In the case of West Bengal and Maharashtra, it seems that almost all the upcoming projects
have complied with all the requirements and have therefore, got their CTEs. Conversely, it could also
mean that the projects were not scrutinised and evaluated properly before the granting of CTEs, as the
respective boards’ staff were over-burdened and did not spend enough time to examine the projects.

17
REFORM AGENDA FOR INDIA’S ENVIRONMENTAL REGULATORS
Issuing consents to operate is another function of the
SPCBs. The board can either grant the consent or deny
it. However, there is a provision called ‘deemed
consent’. The Water Act provides that the “consent
shall, unless be given or refused within a period of four
months of the making of an application, be deemed to
have been given unconditionally”.
All the boards, except the CECB, have claimed that all
the consent applications received by them were
disposed off within the stipulated time of four months.
The number of deemed consents issued by the CECB is
continuously increasing and went up from 82 in 2001-02
to 126 in 2005-06.
The refusal rate for CTOs has been found to be very low
across SPCBs, except in GPCB which has refused the
consent to 16.7 per cent of the total
applications it received (see Table
12: Status of consent to operate –
2005-06). This indicates that either
most industries are in compliance
with the standards, or monitoring
and enforcement is poor, or the
SPCBs are reluctant to initiate
action. In any case, it does indicate
the non-use of a credible
deterrence for non-compliance.
Information collected from boards
indicate poor and time consuming
consent management procedure in
most boards. Most of the boards
still collect, analyse and present
the data on consent management,
compliance and enforcement
manually, which leads to a lot of
31.21
0.81
8.19
34
0.66
0 10 20 30 40
GPCB
MPCB
OSPCB
UPPCB
WBPCB
Bo
ard
s
Refusal rate (in percentage)
Source: Analysis of information provided by the SPCBs to CSE for
the regulator’s programme
Notes: The data is an average of the years 2001-2002 to 2005-2006.
Figure 6: Refusal rate for consent toestablish issued by SPCBs
State Consent to Consent to Deemed Consent to Percentage
operate applied operate consent operate rejected
(sum of consent granted rejected
granted, deemed
consent and
consent rejected)
GPCB 3482 2900 - 582 16.7
KSPCB1 16463 16226 - 237 1.4
MPCB1 8559 8457 - 47 0.6
OSPCB 447 400 - 47 10.5
CECB 3066 2937 126 3 0.01
Source: Analysis of information provided by the SPCBs to CSE for the regulator’s
programme1Note: Information for the year 2004-05
Table 12: Status of consent to operate (2005-06)
GPCB KSPCB MPCB OSPCB TNPCB UPPCB WBPCB
2001-02 345 1860 2183 NA NA 1066 6736
2002-03 641 4405 2456 205 983 991 3040
2003-04 810 16748 2854 312 1170 848 3225
2004-05 928 3352 3668 355 1429 500 3225
2005-06 810 3934 3832 499 3832 586 3705
Total 3534 30299 14993 1371 7414 3991 19931
Source: Data provided by various boards for the regulator’s programme
NA: Not available
Table 11: Status of consent to establish issued by SPCBs

18
REFORM AGENDA FOR INDIA’S ENVIRONMENTAL REGULATORS
paper work. Some of the boards do not even have the resources or expertise to collect and present data;
only a few have computerised systems to store information. The APPCB, MPCB and WBPCB have
implemented online systems for storing and maintaining information and for receiving consent
applications electronically. However, these systems are not standardised; each board has developed a
data management system which is completely independent of the others. As a result, there may be issues
of compatibility and comparison between and among the state-level information systems. Currently,
there is no centralised database in the country which compiles data on consent or compliance status.
The USEPA faced this problem when it tried to aggregate state-level information into a national system,
and ended up spending a lot of money and resources to address the problem.1 Such a situation should be
avoided in India.
INSPECTIONS AND POLLUTION SAMPLE ANALYSIS
Under the Water and the Air Act, the pollution control boards have the authority to collect samples,
inspect facilities, impose corrective action and prescribe compliance schedules. Inspection of industries
involves checking compliance of consent conditions, collection of untreated/treated samples, collection
of hazardous waste samples for analysis, and observation of the concentration of pollutants in the
sample. Stack emissions are also monitored. The boards inspect facilities to ensure adequate treatment
of wastewater and mitigation of air pollution. Arrangements made for reuse and disposal of solid and
hazardous wastes are also verified. The number of inspections undertaken by a board gives an idea of its
proactiveness in monitoring. Ideally, a greater number of inspections can keep board officials well-
informed about the performance of the industrial unit in accordance with prescribed pollution norms.
The average number of inspections per industry per year remains very small for almost all the boards.
For example, the officials of MPCB and KSPCB had not been able to inspect all the industries within their
jurisdiction even once during 2001-02 and 2005-06 (see Table 13: Number of inspections conducted by
SPCBs). The average number of inspections per industry for these two boards is less than one for the
entire duration mentioned above.
The MPCB reported fewer inspections per industry and has shown a reducing trend. It undertook 18,210
inspections in 2001-02, which went down to 11,560 in 2005-06, showing an overall reduction of 36.5 per cent
in five years. This is clearly a worrying trend, especially since the numbers of industries have been increasing
in the state. The higher average
number of inspections were
undertaken by the GPCB and the
OSPCB – each conducted two
inspections per industry every year.
Monitoring and inspection are the
key functions of the SPCBs. The
frequency of on-site visits to verify
compliance is determined by the
pollution potential (red/orange/
green) and size (based on the value
of capital investment) of the
industry. The CPCB has issued a
guidance manual on the frequency
of regular inspections (see Table
14: Inspection schedules of the CPCB
and SPCBs). However, different
SPCBs seem to have varying
interpretations of the guidance and
have adopted their own inspection
GPCB KSPCB CECB MPCB OSPCB
2001-02 26968 12726 300 18210
2002-03 26421 15172 600 19218 2492
2003-04 35254 16748 658 16172 3519
2004-05 44021 17771 738 16046 4088
2005-06 45612 15907 908 11560 2839
Average 35655 15665 641 16241 3235
Average inspection
per industry per year 2 0.63 1.7 0.3 2
Average inspection
per technical staff 380 120 64 74 135
per year
Source: Analysis of information provided by the SPCBs to CSE for the regulator’s
programme
Table 13: Number of inspections conducted by SPCBs

19
REFORM AGENDA FOR INDIA’S ENVIRONMENTAL REGULATORS
frequencies. For instance, red category facilities are supposed to be inspected once a month in Gujarat
and Tamil Nadu, once per quarter in Orissa, and once every two years in West Bengal and Andhra
Pradesh. It is difficult to understand how an SPCB can be certain about compliance by a large-scale red
category industry by inspecting it only once in two years.
Given the available resources, many of the established evaluation frequencies are either too unrealistic
or too lenient. Regardless of the frequency used, the quality of inspection itself remains questionable. In
India, there are no standardised guidelines for inspection. Most boards do not have an inspection
manual. In such a scenario, the quality of inspection depends on the interpretation of the officer
conducting the inspection, as well as the time he/she has to conduct the inspection.
The quality of inspection can perhaps be judged by looking at the case of the Gujarat board: 94
technical staff members of the GPCB conducted 45,612 inspections in 2005-06. This translates into 485
inspections for each technical staff member – approximately two inspections by each technical staff
per day. In comparison, the inspection workload in other boards is relatively lower. The 131 technical
staff of KSPCB conducted 15,907 inspections in 2005-06 (about 120 inspections per staff member). Each
CECB and OSPCB technical staff member conducted 90 and 135 inspections in 2005-06, respectively. It
is important that a uniform and realistic inspection schedule is implemented by all SPCBs.
SAMPLE COLLECTION AND TESTING
Pollution control boards also collect random samples of wastewater and hazardous wastes during
inspection. They conduct stack monitoring to ascertain that the air pollution standards are maintained.
Effec tive monitoring and inspection is reflected by greater numbers of samples collected and tested.
The boards are often more comfortable collecting and testing wastewater samples, rather than collecting
hazardous waste samples or conducting stack monitoring. There is a reason for this. Water samples are
relatively easy to collect, with minimal time and effort. Sampling points are normally mentioned in the
CTO and industries are accustomed to this type of routine sampling. In the case of air sampling, however,
legal sampling can only be done through a stack test which requires specialised instruments and trained
CPCB guidance TNPCB GPCB APPCB WBPCB
RED CATEGORY
Large Once every 3 months Once in a month Once in a month Once in 2 years Once in 2 years
Medium Once every 3 months Once in 2 months
Small Once a year Once in 3-4 months
ORANGE CATEGORY
Large Once a year Once in 2 months Once in 6 months Once in 3 years Once in 3 years
Medium Once a year Once in 3 months
Small Once in 3 years Once in 4-6 months
GREEN CATEGORY
Large Once in 2 years Once in 3 months Once in a year Once in 5 years Once in 5 years
Medium Once in 2 years Once in 6 months
Small Once in 5 years Once in a year
Table 14: Inspection schedules of the CPCB and SPCBs

20
REFORM AGENDA FOR INDIA’S ENVIRONMENTAL REGULATORS
personnel. Also, sampling points are not generally specified in the CTO and in many industries, sampling
ports are not available or are inaccessible. In the case of hazardous wastes, the sampling procedure
itself is not well-defined and most inspecting officers do not know what to collect, how to collect and
where to collect.
However, it has been observed that the SPCBs are not collecting sufficient numbers of samples to assess
the compliance and effectiveness of treatment facilities (see Table 15: Samples analysed by various
SPCBs). Predictably, the situation is worse in case of stack monitoring and hazardous waste sampling. On
an average, the GPCB, MPCB and KSPCB have monitored stack emissions of only 0.55, 0.03 and 0.13 per
air polluting industry, respectively. In Maharashtra, samples from only half of the units producing
hazardous wastes were collected and tested. The situation is far worse in the case of KSPCB and GPCB.
2001-02 2002-03 2003-04 2004-05 2005-06 Average
GPCB
No of industrial effluent and water samples collected and tested 13742 13067 13156 13169 14807 13588
No of effluent samples per water polluting industry 1.34 1.28 1.27 1.07 0.93 1.18
No of stack emissions monitored 4917 4567 5927 6289 6992 5738
No of stack monitoring per air polluting industry 0.55 0.51 0.65 0.58 0.48 0.55
No of hazardous waste samples collected 862 1090 1135 507 240 767
No of hazardous waste samples per hazardous waste industry 0.12 0.15 0.33 0.08 0.03 0.14
KSPCB
No of industrial effluent and water samples collected and tested 8955 10086 8133 7913 3339 7685
No of effluent samples per water polluting industry 0.78 0.88 0.63 0.56 0.71
No of stack emissions monitored 344 606 362 337 357 401
No of stack monitoring per air polluting industry 0.03 0.05 0.03 0.02 0.03
No of hazardous waste samples collected 178 333 419 153 312 279
No of hazardous waste samples per hazardous waste industry 0.16 0.30 0.31 0.09 0.22
MPCB
No of industrial effluent and water samples collected and tested 13131 13629 11451 11367 12893 12494
No of effluent samples per water polluting industry 1.47 1.59 1.38 1.61 1.15 1.44
No of stack emissions monitored 742 1608 1419 1659 1236 1333
No of stack monitoring per air polluting industry 0.08 0.16 0.14 0.16 0.12 0.13
No of hazardous waste samples collected 1843 2118 2097 2159 1516 1947
No of hazardous waste samples per hazardous waste industry 0.50 0.57 0.59 0.50 0.33 0.50
CECB
No of industrial effluent and water samples collected and tested 2603 3418 2474 2392 1829 2543
No of effluent samples per water polluting industry 2.4 1.9 1.7 1.9 1.6 1.9
Source: Analysis of information provided by the SPCBs to CSE for the regulator’s programme
Table 15: Samples analysed by various SPCBs

21
REFORM AGENDA FOR INDIA’S ENVIRONMENTAL REGULATORS
The number of wastewater samples monitored per industry by each of the four boards shows a declining
trend. On one hand, boards are collecting lesser numbers of samples each year; on the other, the number
of industries are increasing. The total number of wastewater samples tested by KSPCB has decreased by
three times from 2001-02 to 2005-06. Similarly, there has been a sharp decline in the total number of
samples tested for hazardous wastes (four times) by the GPCB. This trend shows a gross inadequacy in
monitoring and assessment of industries by the SPCBs.
COMPLIANCE ASSURANCE
The CPCB has promulgated (a) industry-specific standards and (b) general standards wherever specific
industrial standards are not applicable. These standards stipulate pollutant-specific limits beyond which
air and water polluting units are not permitted to emit or discharge. The state boards are entitled to make
these standards more stringent. The standards, as they exist, are quite poorly framed as they are based
on concentration instead of load. This encourages dilution of effluents in order to achieve the desired
level of concentration. Also, concentration-based standards discount the assimilative capacity of the
environment. This is precisely the reason why despite the claims by SPCBs of industries meeting
standards, rivers remain polluted and ambient air quality keeps worsening in India.
As far as compliance is concerned, most boards claim that a majority of industries are complying with
the standards. However, compliance is defined quite uniquely in India: industries having pollution
control equipment are considered to be in compliance with standards! The data on actual compliance
status based on monitoring and inspection is not compiled by most boards.
For example, the GPCB claims that 94 per cent of air polluting units, 96 per cent of water polluting units
and 99 per cent of units producing hazardous wastes comply with the standards (see Table 16:
Compliance status with standards). But considering the fact that the GPCB conducted stack monitoring of
less than half of the air polluting units and tested samples of just 3 per cent of hazardous waste units, this
claim on compliance needs to be accepted with caution. Similarly, the MPCB has reported that 85 per
cent of the total industrial units it checked on were compliant – but the MPCB inspected less than 30 per
cent of the total units in a year.
As per data submitted by MPCB, the state’s compliance status has deteriorated between 2003-04 and
2005-06. The percentage of non-complying units has increased from 9.7 per cent of the total regulatory
basket in 2003-04 to 15.8 in 2005-06. On the other hand, the data submitted by CECB indicates that non-
compliance is a non-issue in the state (less than 5 per cent units are non-complying). However, the CECB
failed to provide data on the number of hazardous waste samples tested or stack monitoring conducted.
2003-04 2004-05 2005-06
Complying Non-complying Complying Non-complying Complying Non-complying
GPCB Water Act 8974 1347 (15%) 13822 1094 (8%) 15400 604 (4%)
Air Act 8183 900 (11%) 12745 675 (5.3%) 13910 664 (4.7%)
Hazardous Act 3319 172 (5%) 6018 433 (7.2%) 7132 67 (0.9%)
MPCB 48361 4709 (9.7%) 50685 5126 (10%) 51289 8109 (15.8%)
CECB Water Act 475 22 (4.6%) 649 23 (3.5%)
Air Act 478 22 (4.6%) 707 25 (3.5%)
Source: Analysis of information provided by the SPCBs to CSE for the regulator’s programme
Note: Figures in brackets indicate percentage of non-complying units.
Table 16: Compliance status with standards

22
REFORM AGENDA FOR INDIA’S ENVIRONMENTAL REGULATORS
In order to meet the standards, it is important that the industrial units have adequate effluent treatment
facilities and air pollution control equipment. The CECB and GPCB claim that all industrial establishments
in their states have adequate control equipment and treatment facilities. The Gujarat board also claims
that 22 common effluent treatment plants (CETPs) in the state are performing satisfactorily. The MPCB, on
its part, has said that there are industrial facilities in the state that do not have adequate or even partial
treatment facilities. The board has also indicated that only 41 per cent of its CETPs are operating
satisfactorily.2
It is surprising that despite various legislations and standards, industrial units that do not have any
control equipment or treatment facilities continue to function. This is because in India, non-compliance
is cheaper than meeting standards. There are also no deterrent mechanisms such as fines or penalties
that could be imposed on non-complying industries. In order to fine a defaulting industry, the board has
to initiate a long-drawn out process of filing a case in court of law. The court is entitled to impose
punishments ranging from imprisonment of 18 months to six years, in addition to a fine. However, there
is often a huge backlog of environmental cases as these are not a priority for the courts. It could
take quite a long time before a case is disposed off.
It is important to underline the fact that data on compliance is not compiled by most SPCBs and whatever
data is available, needs to be interpreted with caution. Compliance is not only about the accountability
of industries; it is also about the accountability of the SPCBs themselves.
STATUS OF SHOW CAUSE AND CLOSURE NOTICES AND LITIGATIONS
The Environment Protection Act (EPA), 1986 has vested powers upon the state boards for issuing closure
or prohibition notices to any industry, operation or process and/or stoppage or regulation of the supply
of electricity or water or any other services (with regard to pollution control). However, these directions
can only be issued by a board after hearing the views of the defaulting industry. Thus, to begin with, the
board has to issue a show cause notice to a unit asking for an explanation for why it is not complying with
the board’s directives. If the company does not take corrective actions or the board is not satisfied with
the company’s response, it can then issue a closure order or file a legal case in court.
The percentage of industries against which show cause notices are issued by the boards varies from year
to year, ranging from 5-15 per cent. For instance, the GPCB issued show cause notices to 6.3 per cent of the
total regulated industries in 2002-2003. The figure went up to 13.6 per cent in 2003-04 and climbed down to
6.6 per cent in 2005-06 (see Table 17: Show cause notices, closure notices and cases filed). The MPCB issued
show cause notices to 9.2 per cent of the total regulated industries in 2002-03, which went up to 12.3 per
cent in 2005-06.
The important point is not the number of show cause notices issued, but the conversion of show cause
notices into closure notices and then into legal cases.
● In the case of GPCB, about 35 per cent of the show cause notices get converted into closure notices
and about 10 per cent of the closure notices get converted into legal cases. In other words, on an
average, the GPCB issued show cause notices to 10 per cent of the total regulated industries and filed
legal cases against 0.4 per cent during 2002-06.
● The CECB, on an average, issued show cause notices to about 11 per cent of the total regulated
industries and filed legal cases against 1 per cent during 2002-06.
● The MPCB issued show cause notices to about 9 per cent of the total regulated industries annually
between 2002-03 and 2005-06; closure notices to 0.8 per cent and legal cases were filed against 0.02
per cent of the total industries annually.
Majority of the show cause notices issued by the boards are in relation to compliance with standards. For
example, 76 per cent of the total show cause notices issued by the MPCB were related to non-compliance
with standards; 15 per cent were for industries failing to upgrade their treatment facilities, and the
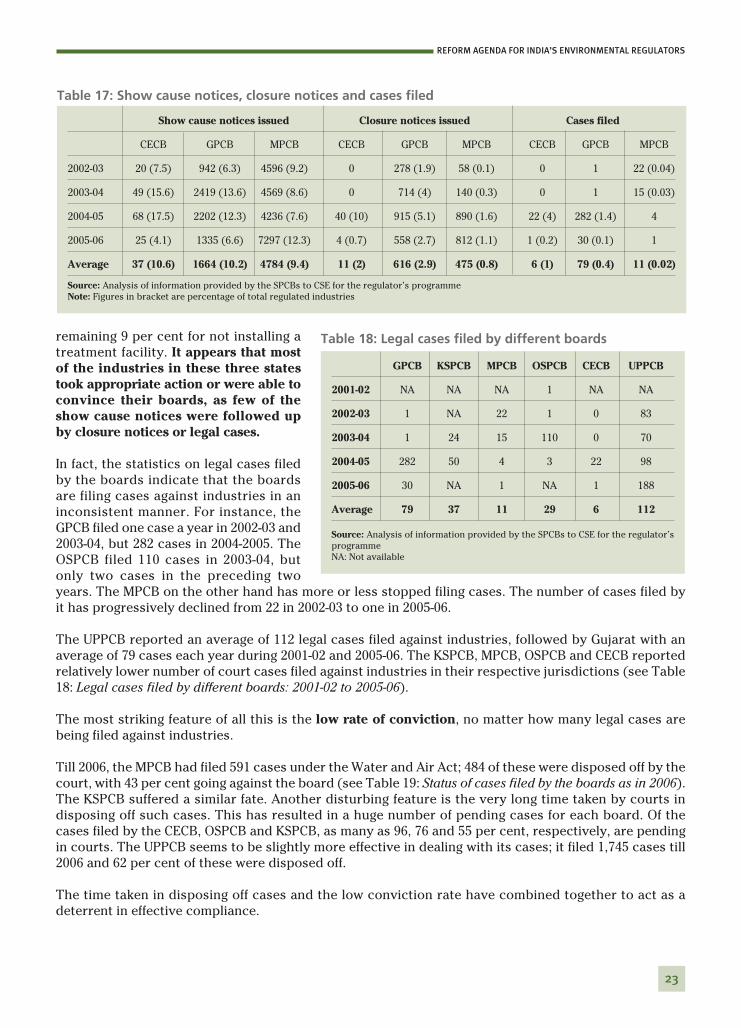
23
REFORM AGENDA FOR INDIA’S ENVIRONMENTAL REGULATORS
remaining 9 per cent for not installing a
treatment facility. It appears that most
of the industries in these three states
took appropriate action or were able to
convince their boards, as few of the
show cause notices were followed up
by closure notices or legal cases.
In fact, the statistics on legal cases filed
by the boards indicate that the boards
are filing cases against industries in an
inconsistent manner. For instance, the
GPCB filed one case a year in 2002-03 and
2003-04, but 282 cases in 2004-2005. The
OSPCB filed 110 cases in 2003-04, but
only two cases in the preceding two
years. The MPCB on the other hand has more or less stopped filing cases. The number of cases filed by
it has progressively declined from 22 in 2002-03 to one in 2005-06.
The UPPCB reported an average of 112 legal cases filed against industries, followed by Gujarat with an
average of 79 cases each year during 2001-02 and 2005-06. The KSPCB, MPCB, OSPCB and CECB reported
relatively lower number of court cases filed against industries in their respective jurisdictions (see Table
18: Legal cases filed by different boards: 2001-02 to 2005-06).
The most striking feature of all this is the low rate of conviction, no matter how many legal cases are
being filed against industries.
Till 2006, the MPCB had filed 591 cases under the Water and Air Act; 484 of these were disposed off by the
court, with 43 per cent going against the board (see Table 19: Status of cases filed by the boards as in 2006).
The KSPCB suffered a similar fate. Another disturbing feature is the very long time taken by courts in
disposing off such cases. This has resulted in a huge number of pending cases for each board. Of the
cases filed by the CECB, OSPCB and KSPCB, as many as 96, 76 and 55 per cent, respectively, are pending
in courts. The UPPCB seems to be slightly more effective in dealing with its cases; it filed 1,745 cases till
2006 and 62 per cent of these were disposed off.
The time taken in disposing off cases and the low conviction rate have combined together to act as a
deterrent in effective compliance.
Show cause notices issued Closure notices issued Cases filed
CECB GPCB MPCB CECB GPCB MPCB CECB GPCB MPCB
2002-03 20 (7.5) 942 (6.3) 4596 (9.2) 0 278 (1.9) 58 (0.1) 0 1 22 (0.04)
2003-04 49 (15.6) 2419 (13.6) 4569 (8.6) 0 714 (4) 140 (0.3) 0 1 15 (0.03)
2004-05 68 (17.5) 2202 (12.3) 4236 (7.6) 40 (10) 915 (5.1) 890 (1.6) 22 (4) 282 (1.4) 4
2005-06 25 (4.1) 1335 (6.6) 7297 (12.3) 4 (0.7) 558 (2.7) 812 (1.1) 1 (0.2) 30 (0.1) 1
Average 37 (10.6) 1664 (10.2) 4784 (9.4) 11 (2) 616 (2.9) 475 (0.8) 6 (1) 79 (0.4) 11 (0.02)
Source: Analysis of information provided by the SPCBs to CSE for the regulator’s programme
Note: Figures in bracket are percentage of total regulated industries
Table 17: Show cause notices, closure notices and cases filed
GPCB KSPCB MPCB OSPCB CECB UPPCB
2001-02 NA NA NA 1 NA NA
2002-03 1 NA 22 1 0 83
2003-04 1 24 15 110 0 70
2004-05 282 50 4 3 22 98
2005-06 30 NA 1 NA 1 188
Average 79 37 11 29 6 112
Source: Analysis of information provided by the SPCBs to CSE for the regulator’s
programme
NA: Not available
Table 18: Legal cases filed by different boards
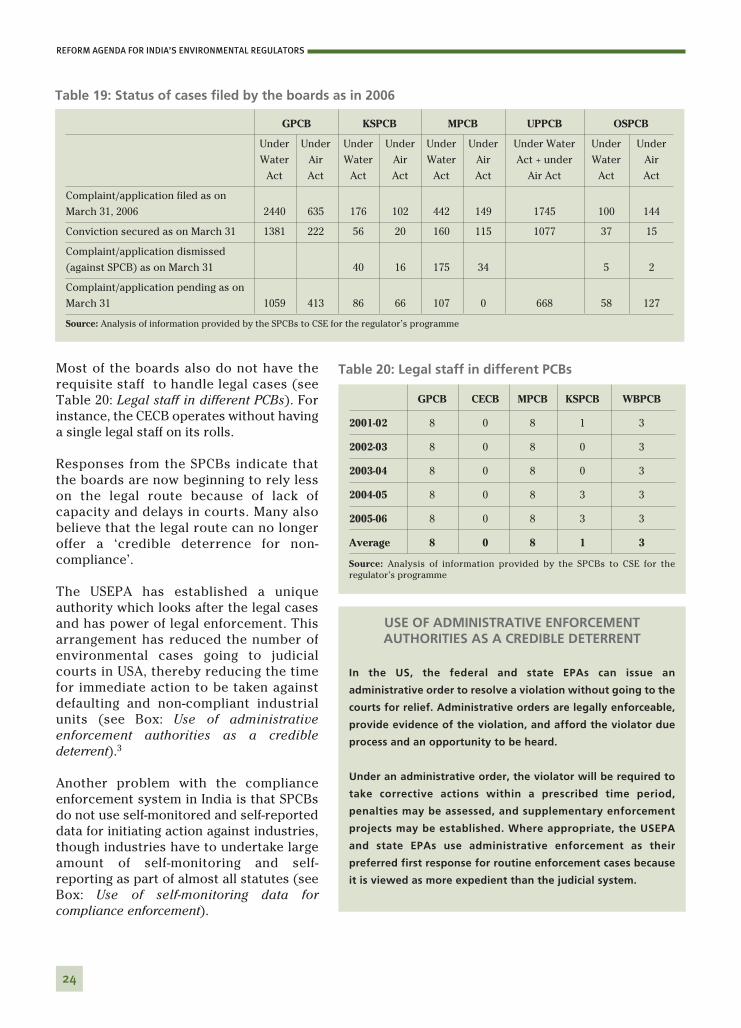
24
REFORM AGENDA FOR INDIA’S ENVIRONMENTAL REGULATORS
Most of the boards also do not have the
requisite staff to handle legal cases (see
Table 20: Legal staff in different PCBs). For
instance, the CECB operates without having
a single legal staff on its rolls.
Responses from the SPCBs indicate that
the boards are now beginning to rely less
on the legal route because of lack of
capacity and delays in courts. Many also
believe that the legal route can no longer
offer a ‘credible deterrence for non-
compliance’.
The USEPA has established a unique
authority which looks after the legal cases
and has power of legal enforcement. This
arrangement has reduced the number of
environmental cases going to judicial
courts in USA, thereby reducing the time
for immediate action to be taken against
defaulting and non-compliant industrial
units (see Box: Use of administrative
enforcement authorities as a credible
deterrent).3
Another problem with the compliance
enforcement system in India is that SPCBs
do not use self-monitored and self-reported
data for initiating action against industries,
though industries have to undertake large
amount of self-monitoring and self-
reporting as part of almost all statutes (see
Box: Use of self-monitoring data for
compliance enforcement).
USE OF ADMINISTRATIVE ENFORCEMENTAUTHORITIES AS A CREDIBLE DETERRENT
In the US, the federal and state EPAs can issue an
administrative order to resolve a violation without going to the
courts for relief. Administrative orders are legally enforceable,
provide evidence of the violation, and afford the violator due
process and an opportunity to be heard.
Under an administrative order, the violator will be required to
take corrective actions within a prescribed time period,
penalties may be assessed, and supplementary enforcement
projects may be established. Where appropriate, the USEPA
and state EPAs use administrative enforcement as their
preferred first response for routine enforcement cases because
it is viewed as more expedient than the judicial system.
GPCB CECB MPCB KSPCB WBPCB
2001-02 8 0 8 1 3
2002-03 8 0 8 0 3
2003-04 8 0 8 0 3
2004-05 8 0 8 3 3
2005-06 8 0 8 3 3
Average 8 0 8 1 3
Source: Analysis of information provided by the SPCBs to CSE for the
regulator’s programme
Table 20: Legal staff in different PCBs
GPCB KSPCB MPCB UPPCB OSPCB
Under Under Under Under Under Under Under Water Under Under
Water Air Water Air Water Air Act + under Water Air
Act Act Act Act Act Act Air Act Act Act
Complaint/application filed as on
March 31, 2006 2440 635 176 102 442 149 1745 100 144
Conviction secured as on March 31 1381 222 56 20 160 115 1077 37 15
Complaint/application dismissed
(against SPCB) as on March 31 40 16 175 34 5 2
Complaint/application pending as on
March 31 1059 413 86 66 107 0 668 58 127
Source: Analysis of information provided by the SPCBs to CSE for the regulator’s programme
Table 19: Status of cases filed by the boards as in 2006
25
REFORM AGENDA FOR INDIA’S ENVIRONMENTAL REGULATORS
The SPCBs are accused of not bringing non-complying
industries to the courts of law. The number of cases filed
are very few; besides, the SPCBs lose a large number of the
cases. This has posed a serious question on the working of
the SPCBs and their effectiveness as pollution control
agencies. In many cases, the boards have lost in court
because of faulty sample collection and analysis.
In India, to bring an industry to court for non-compliance,
SPCBs have to collect ‘legal samples’ as evidence. Even
though self-monitoring, maintaining records and self-
reporting are established parts of the compliance
mechanism in India (they are integral parts of the consent
to establish, consent to operate and environment clearance
process), SPCBs don’t use this data for enforcement actions.
The reason for this is the interpretation of Section 21 of the
Water Act, Section 26 of the Air Act and Section 11 of the
Environment Protection Act (EPA), which deal with the
collection of samples. They have been interpreted by the
boards as requiring legal samples as evidence in any
enforcement action bought before the courts. Even in a case
where Section 5 of the EPA (under which closure notice can
be issued) is applied, if the closure notice is challenged in
the court by the factory, the SPCB or CPCB cannot use self-
monitoring data – the boards will have to produce the
results of the legal sampling. This is the ‘official’
explanation widely resorted to by the SPCBs for not using
self-monitoring data for compliance enforcement.
However, there is an alternate view on this matter.
It can be successfully argued that under the current law,
there are provisions to use self-monitored and self-
reported data for enforcement.
All the three principal acts – Air, Water and EPA – have
provisions which empower the government to obtain
information (Section 20 in the Water Act, Section 25 in the
Air Act and Section 20 in EPA). Similarly, all the three acts
give powers of entry and inspection (Section 23 of the
Water Act, Section 24 of the Air Act and Section 10 of the
EPA), which includes powers to examine any record,
register or document and seize any record, register,
document or other material object, if the government has
reason to believe that it may furnish evidence of the
commission of an offense punishable under these acts or
the rules made thereunder.
There are also provisions under the acts that require
industry to intimate the government about non-
compliance (Section 31 of the Water Act, Section 23 of the
Air Act and Section 9 of the EPA).
It is quite clear that if the government can demand
information, and if it needs to be intimated about cases of
non-compliance, examine information and seize
information, then it can also utilise all the above
information to take an enforcement action and prove a
violation in court.
Each of the statutes also authorises the government to
take action where “it is apprehended” that contravention
of the law has occurred or is likely to occur. In its literal
sense, the word “apprehend” implies that the government
can rely upon a mere understanding (by using self-
monitored data) that a violation has occurred and does not
need legal samples before taking legal action.
As far as integrity of self-monitored data is concerned, the
statutes have a provision of penalty for falsification of data
(Section 42(f) of the Water Act and Section 38(f) of the Air
Act) which is rarely used.
In conclusion, there are powers under all three acts to use
self-monitored data for enforcement and provisions to
take action if the self-monitored data is false, but these
powers have not been operationalised.
Not using self-reported information is a significant
constraint in promoting compliance and enforcement.
Self-monitored and self-reported data is used for
compliance enforcement in most developed countries. In
the US, data gathered through self-monitoring, recording
and reporting is relied upon extensively to determine
compliance and take enforcement actions. Both the Clean
Water Act (CWA) and the Clean Air Act (CAA) require self-
monitoring, recording and reporting. Senior company
officials are personally liable for false reporting and
falsification of data is considered to be one of the most
serious offenses.
USE OF SELF-MONITORING DATA FOR COMPLIANCE ENFORCEMENT

26
REFORM AGENDA FOR INDIA’S ENVIRONMENTAL REGULATORS
Public disclosure and grievance redressal There are currently two sources of information on the working of SPCBs. The first are the annual reports
and the second are the websites. The RTI can also be used to access specific information.
Annual reports: There is no prescribed format for disclosure of information in an annual report.
Some annual reports are quite exhaustive, while others provide information which is skeletal. The annual
report of the MPCB is quite comprehensive, giving details of staff strength (sanctioned, vacant, and
filled); number of polluting industries (water and air) those generating hazardous wastes; activities
undertaken under new rules and regulations such as Batteries Act; consent status; legal cases; and
financial details. On the other hand, the annual report of the BSPCB provides very basic financial
information with no details of the pollution and compliance status in the state.
Websites: Proactive disclosure in terms of information displayed on the websites of respective
boards shows large variations. The PCBs of Maharashtra, Gujarat, Tamil Nadu, Orissa, Rajasthan and
West Bengal provide significant amounts of information on their websites. This includes the number
of industries, annual reports, executive summaries of EIA reports, publication lists, etc. On the other
hand, the websites of Haryana, Kerala, Goa and Punjab boards provide just the basic information
about the board – functions, acts and forms for consent. Many boards, including the BSPCB, do not
have their own websites. In order to ensure more transparency in the working of a board, information
disclosure has to improve significantly. The SPCBs should put all possible information on their
websites. This should include status of compliance and non-compliance, status of consent to operate
and establish, reports on public hearings for environmental clearance, status of court cases,
monitoring and inspection reports, status of samples collected and tested, status of ambient
environment quality, etc. This will also help the boards, as they will have to handle lesser numbers of
RTI applications.
Grievance redressalEvery board has a procedure in place to address the complaints it receives. In the case of GPCB, as soon
as a complaint is received, it is forwarded to the member secretary, who then passes it on to the
concerned unit head/regional offices or vigilance squad to investigate and initiate action. While the
WBPCB had set up a public grievance cell in 1994 to address complaints against environmental problems,
the OSPCB also has a public grievance cell where complaints are divided into three categories – A, B and
C – based on their importance. Category A complaints are priority complaints and are related to issues
dealing with environmental accidents, widespread pollution, VIP references, issues raised by major
NGOs and environmental organisations, complaints made by the courts and government offices,
complaints relating to the 17 highly polluting industries and complaints relating to disposal of hazardous
chemicals and wastes. Category B includes complaints related to pollution problems that are limited in
nature, while Category C includes complaints that are not within the purview of the board, such as issues
of public nuisance and other miscellaneous complaints. These categories thus indicate the priority in
which the complaints are addressed.
Although the state boards have, on paper, a provision for redressal of public complaints and claim to
address most of the complaints they receive, the stakeholders are by and large unhappy with the
response of the boards (see Chapter Four). Civil society organisations feel that the boards take too much
time to respond to their complaints, are unwilling to share information and do not want to provide
consent and compliance related information.4
Most SPCBs acknowledged the role of the public as a watchdog to improve the environmental conditions
in their respective states. They claimed that the redressal of public complaints is a priority area. The
MPCB and GPCB have forms on their websites through which complaints and grievances can be
registered. The TNPCB plans to have a dedicated phone line for public complaints. Recently, the Gujarat
board has initiated a unique concept of whistle-blower. Under this experiment, the person who informs
the board about violation of any environmental law within the state is financially rewarded and his/her

name is kept confidential. Based on the information provided by the whistle-blower, actions are initiated
by the vigilance squad to investigate the matter.
The MPCB on an average received 1,176 complaints annually and it claims to have successfully attended
to all of them, while the GPCB received 405 complaints and it too claims to have successfully addressed
all of them (see Figure 7: Status of complaint redressal). The OSPCB received, on an average, 216
complaints every year but was able to dispose off only 99 cases.
TRAINING AND CAPACITY BUILDING
As a primary function of the boards, training and capacity building have been a major concern for long.
New rules and regulations are being implemented as a result of developments in the field of pollution.
Updating the knowledge and improving the skills of the board officials is, therefore, an essential
function of the boards. But most of the boards do not have a mechanism in place to train their staff. The
boards of Tamil Nadu, Karnataka, Gujarat and Madhya Pradesh have some form of internal training
provisions and facilities. The West Bengal, Andhra Pradesh, Bihar, Maharashtra, Orissa, Himachal
Pradesh, and Rajasthan boards, on the other hand, do not have any in-house training facility; they send
their officials to other institutions.
The boards’ expenditure on training and capacity building programmes may be considered an indicator
of their performance in this regard. The MPCB spent an average of Rs 8 lakh (only 0.25 per cent of the
total expenditure) per annum for training and capacity building, with the spending registering a gradual
decline over the years – it went down from Rs 8.25 lakh in 2003-04 to Rs 3.25 lakh in 2005-06. The SPCBs
of Gujarat and Chhattisgarh do not have separate budgets for training.5
The strategies adopted by some boards on training of staff are listed below:
● Environmental Training Institute (TNPCB): The Tamil Nadu Pollution Control Board has developed
a training centre called the Environmental Training Institute (ETI). It is headed by the chairperson of
27
REFORM AGENDA FOR INDIA’S ENVIRONMENTAL REGULATORS
405
216
55
405
216
55
405
9955
1,176 1,176 1,176
0
200
400
600
800
1000
1200
1400
MPCB GPCB OSPCB CECB
Nu
mb
er
of
co
mp
lain
ts
Complaints received Complaints attended Complaints disposed
Source: Analysis of information provided by the SPCBs to CSE for the regulator’s programme
Note: The data for the Maharashtra board is only for two years – 2004-2005 and 2005-2006. The data for rest of the boards is an average of the years
2001-2002 to 2005-2006
Figure 7: Status of complaint redressal

the board and is technically supported by an advisory committee with members from industries,
private/public institutions and NGOs.
The main objective of this training centre is to improve the board’s environmental management
capacity and to create awareness, thereby helping reduce pollution from industries and
municipalities. The target groups that the centre trains include staff members of the board,
industries, NGOs and government organisations.
The annual report of TNPCB does not provide any figures on the number of board officials trained at
ETI. It only refers to the number of training programmes organised by the centre and the total
number of participants in them.
● Gujarat Environment Management Institute (GPCB): The Gujarat board does not have a training
centre. However, the Department of Forest and Environment of the government of Gujarat has
established the Gujarat Environment Management Institute (GEMI) to provide guidance through
research and training to industry and board officials. The GEMI conducts seminars and workshops on
various environmental issues such as disaster management, biomedical wastes, water conservation
and rainwater management. The GEMI, however, does not organise specific training programmes for
the GPCB. Instead, the GPCB sends its officials for training to other institutes.
● The WBPCB does not have any training facilities, and sends its officials to attend various training
programmes across the country. In 2005-06, the board sent 40 officials to attend training programmes
conducted on topics such as chemical waste management, aquatic eco-systems, strategic
environmental assessment, pesticide management, lake management and restoration of lake water
quality, disaster management, air pollution and its health impacts, municipal solid waste
management, operation and management of wastewater systems, etc.6
● Though the KSPCB has set up a training institute (EMPRI) with technical and financial support from
DANIDA, not many officers of the board attend EMPRI trainings. In fact, the EMPRI now does not
conduct any specific training programmes for KSPCB. The board, therefore, sends its officials for
training to other institutes.
● The APPCB has an established training centre called the EPTRI in Hyderabad. But it is an
independent institute and does not conduct any specific training programmes for the board.
● The BSPCB also sends its officials for training to various training centres located across the country.
In 2003-04, the board had sent 13 of its personnel for training on national air monitoring programme,
solid waste management, climate technology market, environmental compliance, etc.
● The MPCB does not have in-house capacity for training; hence, it sends its staff to other
organisations for training. The training undertaken by its officials have been on general
environmental issues ranging from hazardous waste management to noise and water pollution.
The other state boards in India send their staff members for training to various external agencies and
institutions. As many as 31 employees were sent for training by the OSPCB in 2005-06.7 While the HPPCB
sent 17 employees for training in 2004-058, the number of staff sent for training by the board never
exceeded 20 in a single year during the last five years. The number of employees sent by the Rajasthan
board has been found significantly higher at 55 in 2005-06; the training programmes ranged from
environmental planning and recent legislations to CDM, fly ash utilisation, etc.9
It has been observed that there is a serious lack of clear-cut planning and strategy for capacity building
and training among the boards. The boards’ efforts can be termed random at best and the employees
are despatched for training without any assessment of their real training needs. Training programmes
28
REFORM AGENDA FOR INDIA’S ENVIRONMENTAL REGULATORS

attended by the board officials are quite general in nature and do not address the specific needs of
boards. The MPCB has indicated a requirement of training on network monitoring, online display of data,
online consent management, data implementation and analysis including modelling, implementation of
e-governance, etc. However, none of the training programmes attended by its employees addressed
these topics. This is because none of the institutes engaged by the boards are designing training
programmes that target these special requirements and are in line with the need for regulators’ skill
development. This is true even with the boards that have in-house capacity.
The number of courses designed specifically for compliance and enforcement are extremely limited.
Most of the boards expressed their concern with regard to lack of compliance and enforcement training
material and non-availability of training programmes in this regard.
There is no induction or compulsory training for the board employees at the time when they join service.
In USA, the USEPA has an Inspector Training Order that stipulates mandatory training requirements to
lead an inspection. All inspectors are required to complete annual trainings. In addition, the
requirements of the inspectors vary depending upon the complexity of the regulated industry that needs
specialised skill upgradation of the inspector.10 It is important to consider training and capacity building
as a core function of the SPCBs in addressing inherent shortcomings of the board.
CONCLUSION
Compliance assurance is a major challenge in India. There is no centralised database which can indicate
the status of compliance in the country. There are also no indicators which can point to the success or
failure of the monitoring, compliance and enforcement programme. On one hand, the SPCBs are
structurally weak as they lack skilled staff; on the other, there is no accountability mechanism in place to
hold the SPCBs responsible for non-performance.
What also comes out quite clearly is that there is no credible deterrence for non-compliance as the legal
route of compliance enforcement is not working. The SPCBs conduct few inspections, collect fewer
samples and file even fewer cases. Use of civil administrative authority and self-monitored and self-
reported data for compliance enforcement can help overcome problems that plague enforcement actions
in the country today.
There is an urgent need for capacity building and training for the technical, scientific and administrative
staff of the boards. Most boards do not have any structured training programmes for their staff members
and the skills of the staff, therefore, remain ‘traditional’. Capacity building and specialised skill
improvement training programmes are needed to improve efficiency of the state boards.
29
REFORM AGENDA FOR INDIA’S ENVIRONMENTAL REGULATORS
30
Peoples’ perceptionINTRODUCTION
The earlier chapters in this report have thrown some light on the state of regulatory capacity in India. It
is now important to understand how stakeholders – industry, civil society organisations and the people
at large – perceive the SPCBs in terms of their performance. In many countries across the world,
peoples’ participation has been instrumental in building and improving upon regulatory mechanisms.
India too has seen many examples of public participation that have ensured better compliance and
enforcement (see Box on page 32: CSE’s Green Rating Project). Citizen monitoring and stakeholder
insights can be effectively involved in reviewing and getting a ‘Report Card’ on agencies or industrial
units to ensure better compliance, monitoring, inspection and enforcement of laws and regulations
(World Bank, 2006). The SPCBs, for instance, use the local area environment groups created by the
Supreme Court’s Monitoring Committee on Hazardous Wastes. The public interest litigation (PIL) – a
citizens’ legal monitoring and supervisory tool – is worth mentioning as an effective oversight
mechanism in India.
In 2007-08, CSE conducted an online opinion poll of public and industry in order to understand the
performance of the SPCBs through the lenses of the stakeholders. Separate questionnaires (for industry,
NGOs and general public) were placed on the CSE website. There was a provision for filling the
questionnaire anonymously, as many industry representatives were not comfortable putting their names
on record. CSE received 154 responses from representatives of civil society organisations and industries
(93 from civil society and 61 from industry), who provided a critical report card on the performance of
the SPCBs in India. This chapter analyses these stakeholders’ opinions against the key indicators of
functional responsibility and accountability.
STAKEHOLDERS’ REPORT CARD ON THE SPCBS’ PERFORMANCE
Most of the civil society respondents to the opinion poll were from the 14 major states of India (see Figure 8:
Regional distribution of civil society respondents). As the number of responses from other states was low,
these were not taken into account for assessing the performance of the boards. In the case of respondents
from industry, 42 per cent were from the large-scale sector. The small- and medium-scale sectors each turned
up with 29 per cent respondents (see Figure 9: Classification of industry respondents). Most of the industry
respondents were from Gujarat, Madhya Pradesh, Maharashtra and Uttar Pradesh.
These stakeholders expressed their opinions on various performance indicators of the SPCBs. Different
groups of stakeholders are usually seen to express contradictory opinions; this survey was no exception
to this rule. For instance, the results of the survey shows that NGOs and general public have, by and
large, lost faith in the capability of the SPCBs in improving environmental quality in the country. On the
other hand, representatives of industry remain hopeful of the SPCBs’ performance with the provision of
better infrastructure, staff, and training and capacity building.
CHAPTER 4

31
REFORM AGENDA FOR INDIA’S ENVIRONMENTAL REGULATORS
Regulatory capacity and performance Most of the respondents from civil society felt that India’s existing regulations and regulatory systems
are weak. They were also completely dissatisfied with role played by their SPCBs. Some of the views and
reasons cited are as follows:
● While the laws themselves are not stringent enough, the industries are not complying mainly because
of rampant corruption in the boards.
● There is a lack of political will within the boards to control pollution.
● SPCBs don’t have sufficient resources to implement the existing regulations.
● Inadequate understanding of various laws and legislation, poor knowledge of new technologies and
shoddy work culture are the main problems.
● No major research work has been undertaken by the SPCBs.
● According to a respondent from Mizoram, “the staff of the SPCBs are cocooning or confining
themselves within their offices and are not interested in monitoring environmental pollution”.
Civil society organisations want SPCBs to become more transparent and accountable. They also want the
boards to start involving local communities in environmental conservation.
As indicated earlier in this chapter, the opinions expressed by respondents from industry were quite
contrary to that of the civil society. Most respondents felt that current regulations and regulatory
standards are not weak – however, the boards do not have the necessary technical resources or
understanding to implement them. According to another respondent: “Existing regulatory standards are
nothing but a copy of Western standards, and there is a window for escape for the offenders.”
An interesting suggestion came from industry about the introduction of ‘incentives’ for continuous
improve ment in the production process, where the best industries can be rewarded. Some industry
respondents wanted a provision for financial penalties for non-complying units. They also suggested that an
independent agency should be made responsible for taking samples and analysing them. It appears that
industries are not confident of the boards’ monitoring abilities. The respondents from industry also
wanted the boards to organise regular meetings with industry to raise awareness on environmental
management and pollution control.
Lack of adequate staff was highlighted by the NGO respondents as one of the key weaknesses plaguing
the boards. Except Kerala and Tamil Nadu, almost all the state boards were targeted for their poor
staffing pattern. NGOs from Andhra Pradesh, Karnataka, Orissa and West Bengal rated their respective
SPCBs below 3, which meant that the boards do not have adequate personnel. On the other hand, most
of the industry respondents felt that humanpower was not a problem (except in the case of Rajasthan).
Small (29%)
Medium (29%)
Large (42%)
Source: Results of the survey conducted by CSE
Figure 9: Classification of industryrespondents
Andhra
Pradesh (11.10%)
Delhi (8.80%)
Gujarat
(13.12%)
Himachal
Pradesh (5.50%)
Karnataka (10.10%)
Kerala (10.10%)Madhya Pradesh (5.50%)
Maharashtra (8.80%)
Orissa (6.60%)
Punjab (5.50%)
Rajasthan (3.30%)
Tamil Nadu (10.10%)
Uttar Pradesh (3.30%)
West Bengal (5.50%)
Source: Results of the survey conducted by CSE
Figure 8: Regional distribution of civil societyrespondents

32
REFORM AGENDA FOR INDIA’S ENVIRONMENTAL REGULATORS
All of them gave their boards a rating of
more than 5 (see Figure 10: Industry view
on staff strength in boards).
The boards’ responseAbout 43.3 per cent respondents from
civil society felt that in most cases, the
pollution control board failed to respond
positively to a complaint, while 46.3 per
cent felt they responded positively
sometimes. Only about 10.4 per cent
indicated that a board responded
The Green Rating Project (GRP) of the Centre for Science
and Environment (CSE) is designed to track environmental
performance of key industries in India. It monitors the
impact of industrial growth on the environment and the
natural resource base and tries to steer industry towards
sustainability.
GRP is a environmental rating programme wherein
industries within an industrial sector are rated on their
environment performance on the basis of their life cycle
impacts. GRP is a tool that not only promotes compliance,
but it also promotes voluntary discloser and public
participation.
GRP is built on voluntary disclosure by companies and the
rating system consists of stick and carrot policy. The stick is
a “default option under which a company, which does not
voluntarily disclose information, is rated as worst
company. The carrot is “additional weightage” given to the
company for ensuring transparency. To ensure the
reliability of data, GRP also inspects the industry.
GRP’s ultimate aim is to move Indian industry ‘beyond
statutes’ and adopt global best practices.
Started in 1997, GRP has so far rated four industrial sectors
of India: pulp and paper, automobile, chlor-alkali and
cement. Pulp and paper sector has been rated twice. The
success of the rating can be gauged by the fact that more
than 90 per cent companies voluntarily participated in each
rating and opened their factories for inspection. Being a
public disclosure project, the ratings and the reports of
individual companies are disseminated to the public. The
final rating is also widely publicised through print and
electronic media.
THE IMPACT
The success of GRP depends not only on the participation
and disclosure of data but also on industry paying heed to
the rating and its recommendations. In all ratings, GRP has
made a difference in a sense that industries have improved
their environment performance. Between the two ratings,
the pulp and paper sector reduced its water consumption,
changed bleaching technology and moved towards farm
forestry. Chlor-alkali industry has reduced its mercury
consumption and emissions and have also improved its
energy efficiency. Many companies have implemented
recommendations specifically given to them by the project.
The findings of the projects have also helped to change the
environmental policy in the country. Based on the GRP’s
recommendations, the government of India had
announced subsidies to the chlor-alkali industry to move
from mercury-cell technology to membrane cell. The
concept of measuring and monitoring the inputs of volatile
materials like mercury in the production process, instead of
only measuring their concentration in the effluents was
also introduced by GRP.
The cement sector findings uncovered many surprises. The
traditional wisdom was that the industry had to be a big-
time polluter. But what emerged was a more nuanced
picture. The industry did well in energy use, point source
emissions and waste disposal, but failed in mine
management, fugitive emission control and livelihood
generation. This rating showed that in areas where the
economic and environmental interest coincide, industry
generally performs better. Proper pricing of natural
resources is therefore key to improving the environment
performance of Indian industry.
Source: CSE, Green Rating Project, 1998
CSE'S GREEN RATING PROJECT
Gujarat MadhyaPradesh
Maharashtra Rajasthan UttarPradesh
6.3
4.5
5.7
1.5
5.5
0
1
2
3
4
5
6
7
8
9
10
Staff strength scale: 0-highly deficient in staff; 10-sufficient staff
Source: Results of the survey conducted by CSE
Figure 10: Industry view on staff strength in boards

33
REFORM AGENDA FOR INDIA’S ENVIRONMENTAL REGULATORS
positively to public complaints (see Figure 11: SPCBs responses to public complaints).
Respondents from Andhra Pradesh had a very good opinion about their board’s performance in
responding positively to their complaints – but respondents from Gujarat, Chhattisgarh, Jammu &
Kashmir, Karnataka, Kerala, Meghalaya, Mizoram, Orissa, Pondicherry, Tamil Nadu, Rajasthan, Uttar
Pradesh and West Bengal felt their respective boards fared poorly on this count.
Proactive disclosure of EIA reports and proceedings of public hearingsThe public hearing is a process which offers an opportunity to members of the civil society, including
NGO representatives, to interact with an SPCB. It is the duty of the board to facilitate this interaction by
providing a soft or hard copy of the EIA report or its executive summary to the local people prior to the
public hearing. However, most respondents felt that the boards have failed in this respect. Only about
18.8 per cent of the respondents claimed that EIA reports were easily accessible (see Figure 12 on page
34: Accessibility and availability of EIA reports). All the respondents from Madhya Pradesh, Orissa, Punjab,
Rajasthan, Tamil Nadu and West Bengal recounted their torturous experiences in accessing EIA reports
from their respective boards.
Civil society organisations felt that the boards should upload EIA reports on their websites to enable easier
dissemination. Barring a few, a majority of the boards have not done this, and accessing these reports from
a board’s regional or sub-regional office is an extremely difficult process. Some of the respondents even
pointed out that “it is easier to get a copy of the EIA report from the project proponent directly, but not from
the board”. Respondents even complained that executive summaries of EIA reports neither contained
information on mitigation measures nor any proposals for expenditure on environmental mitigation.
A public hearing provides a forum to local communities for giving feedback about upcoming projects to the
regulatory agencies. Item 6.6 of the Environment Impact Assessment Notification, 2006 states that the
proceedings of the public hearing shall be conspicuously displayed at the following offices – those of the
panchayats within whose jurisdiction the project is located; the concerned zila parishad; the district
42.9
40.0
50.0
33.3
28.6
40.0
37.5
60.0
33.3
66.7
25.0
75.0
33.3
50.0
33.3
28.6
20.0
62.5
50.0
40.0
66.7
33.3
75.0
25.0
33.3
50.0
66.7
0 20 40 60 80 100
Andhra Pradesh
Delhi
Gujarat
Himachal Pradesh
Karnataka
Kerala
Madhya Pradesh
Maharashtra
Orissa
Punjab
Tamil Nadu
West Bengal
Percentage of total respondents
Responded positively Not responded positively Responded positively sometime
Source: Results of the survey conducted by CSE
Figure11: SPCBs’ responses to public complaints
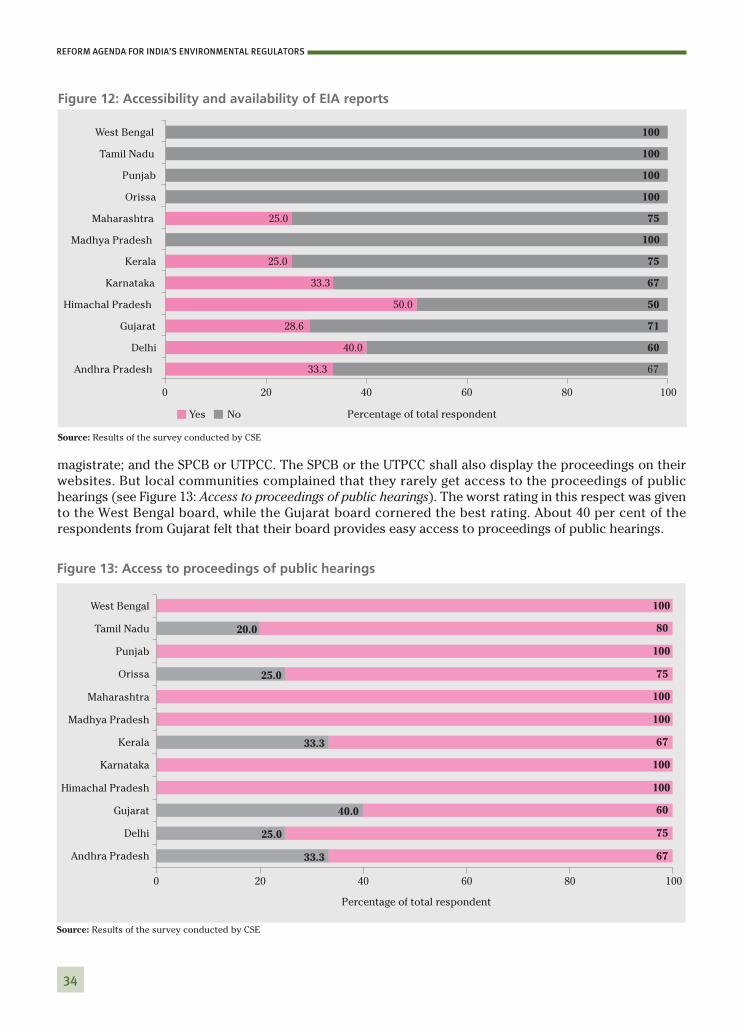
34
REFORM AGENDA FOR INDIA’S ENVIRONMENTAL REGULATORS
33.3
40.0
28.6
50.0
33.3
25.0
25.0
67
60
71
50
67
75
100
75
100
100
100
100
0 20 40 60 80 100
Andhra Pradesh
Delhi
Gujarat
Himachal Pradesh
Karnataka
Kerala
Madhya Pradesh
Maharashtra
Orissa
Punjab
Tamil Nadu
West Bengal
Percentage of total respondentYes No
Source: Results of the survey conducted by CSE
Figure 12: Accessibility and availability of EIA reports
magistrate; and the SPCB or UTPCC. The SPCB or the UTPCC shall also display the proceedings on their
websites. But local communities complained that they rarely get access to the proceedings of public
hearings (see Figure 13: Access to proceedings of public hearings). The worst rating in this respect was given
to the West Bengal board, while the Gujarat board cornered the best rating. About 40 per cent of the
respondents from Gujarat felt that their board provides easy access to proceedings of public hearings.
Andhra Pradesh
Delhi
Gujarat
Himachal Pradesh
Karnataka
Kerala
Madhya Pradesh
Maharashtra
Orissa
Punjab
Tamil Nadu
West Bengal
33.3
25.0
40.0
33.3
25.0
20.0
67
75
60
100
100
67
100
100
75
100
80
100
0 20 40 60 80 100
Percentage of total respondent
Source: Results of the survey conducted by CSE
Figure 13: Access to proceedings of public hearings

35
REFORM AGENDA FOR INDIA’S ENVIRONMENTAL REGULATORS
Corruption in the boards: a citizens’ report card A majority of the respondents (industry as well as civil society organisations) highlighted the various
malpractices prevailing in the SPCBs. Perceptions of the degree of corruption varied among the different
stakeholders. For example, NGOs from Maharashtra felt that their board was quite corrupt and gave it a
low score of 1.4 on a scale where 0 indicated ‘very corrupt’ and 10 indicated ‘no corruption’ (see Figure
14: Corruption in SPCBs as viewed by the civil society), whereas representatives of industry from the same
state gave the board an average rating of 5.3 (see Figure 15: Corruption in SPCBs as per industry).
Him
ach
al
Pra
desh
An
dh
ra P
rad
esh
Delh
i
Gu
jara
t
West
Ben
gal
Ori
ssa
Karn
ata
ka
Mad
hy
a P
rad
esh
Pu
nja
b
Tam
il N
ad
u
Kera
la
Mah
ara
shtr
a
7
5
4 4 4
2.5 2.3 2.32 2
1.5 1.4
0
1
2
3
4
5
6
7
8
Co
rru
pti
on
sc
ale
Corruption scale: 0-highly corrupt; 10-not corrupt
Source: Results of the survey conducted by CSE
Figure 14: Corruption in SPCBs as viewed by the civil society
5
3.5
5.3
1.5
2.5
0
1
2
3
4
5
6
Gujarat Madhya Pradesh Maharashtra Rajasthan Uttar Pradesh
Co
rru
pti
on
sca
le
Corruption scale: 0-highly corrupt; 10-not corrupt
Source: Results of the survey conducted by CSE
Figure 15: Corruption in SPCBs as per industry

36
REFORM AGENDA FOR INDIA’S ENVIRONMENTAL REGULATORS
Industries from Madhya Pradesh, Rajasthan and Uttar Pradesh rated their boards low on the corruption
scale. Civil society organisations from Himachal Pradesh gave a very high score of 7 to the HPPCB.
Though many of the industry respondents from across the states felt that board officials are corrupt, but
none of them claimed to have filed any complaints. The Gujarat and Maharashtra boards claimed that no
cases of corruption had been filed against them in the last five years. However, Maharashtra’s minister of
environment has gone on record admitting to corruption in the board.
Penalty for non-compliance In the poll, an interesting question was framed for industry: whether they have ever been penalised for
non-compliance. Industries were required to respond in either a ‘Yes’ or a ‘No’. Industries from most
states claimed that they were never penalised (see Figure 16: Easy compliance, no penalty). Industries
from Maharashtra and Uttar Pradesh, however, admitted that they have been penalised for non-
compliance. Easy compliance can be attributed to the reluctance of boards to take action against
industries; another reason could be weak and ineffective standards. Civil society organisations
attributed this phenomenon to the prevailing corrupt practices of board officials.
CONCLUSION
It is evident from the online opinion poll that the stakeholders are by and large not satisfied with the
performance of the SPCBs. The reasons behind this opinion are, however, as varied as the stakeholders
themselves. NGOs blame the poor performance of the boards on lack of staff, corruption and poor
regulations, while industry believes that though the boards have sufficient staff, they are not trained
enough and lack the understanding to implement rules and regulations. They have also highlighted
corruption as a major problem area.
Not panelised ever Panelised
0 0
33
0
50
100 100
67
100
50
0
20
40
60
80
100
120
Gujarat Madhya Pradesh Maharashtra Rajasthan Uttar Pradesh
Pe
rce
nta
ge
Source: Results of the survey conducted by CSE
Figure 16: Easy compliance, no penalty

37
REFORM AGENDA FOR INDIA’S ENVIRONMENTAL REGULATORS
Clearly, the stakeholders’ Report Card does not provide a very different picture from the analysis of
secondary information about the performance of the boards that has been dealt with in the previous
chapters. The public opinion poll has also identified almost the same core areas of weakness of the
SPCBs that need strengthening:
● Lack of adequate humanpower and poorly skilled staff;
● Poor understanding of technical and scientific issues;
● Lack of training, education and technical expertise;
● Prevailing malpractices (corruption in the boards); and,
● Lack of proactive disclosure and poor information dissemination.

38
Recommendations
India faces immense environmental challenges; its environmental protection and conservation agenda is,
therefore, equally vast. The pollution control boards are the frontline agency for environmental
protection in the country. Their performance will largely determine how successfully India is able to
overcome its environmental challenges. But a well-performing board requires a well-designed
institutional structure, clearly defined powers and responsibilities, and adequate resources (financial as
well as human) to discharge its responsibilities.
However, providing powers and resources alone will not transform the nation’s pollution control boards
into effective and efficient organisations. Accountability for non-performance, openness and
transparency, and a willingness to involve and engage with the public are the other parts of the package
that should constitute the next generation reform agenda for India’s pollution control boards.
STAFF/PERSONNEL
1. It is quite clear from the analysis that there is not sufficient staff to adequately manage and
implement the compliance and enforcement programme -- the core function of the SPCBs. Also, there
is no national-level guideline to indicate staff requirements based on the characteristics of the
regulatory basket (for instance, the number and types of industries). It is important for the CPCB to
introduce such a guideline, which can then be used by the SPCBs to carry out detailed analyses of
capacity requirement to fill the gaps in technical, legal and scientific capabilities.
2. The skill sets of the SPCBs remain ‘traditional’ at best. The focus is on hiring engineers and scientists,
while other technically skilled personnel like economists, programme analysts, social scientists,
legal consultants, computer professionals, communication experts, etc are ignored. It is important to
understand that environmental management has moved beyond engineering and environmental
sciences and now encompasses multi-disciplinary solutions. For instance, communication has
become very important; so have programme monitoring, public participation and legal remedies.
The SPCBs should expand and enhance their skills in these areas.
3. Recruiting and retaining trained and qualified personnel is important for the success of any
organisation – more so for technical regulatory bodies like SPCBs. Most SPCBs today lack such staff.
Unattractive pay packages and incentives and career stagnation keeps potential candidates away.
Interviews conducted by CSE during the preparation of this report indicate that the corruption in the
boards is due to a combination of factors, one of which is the poor pay package. The SPCBs need to
put in place a policy and programme to attract high-quality personnel – this could include
competitive pay packages and incentives, attractive career growth prospects, and rewards and
recognition for good performance.
CHAPTER 5
FINANCIAL RESOURCES
4. There are wide variations in the financial positions of the SPCBs. The boards of the less
industrialised states (northeastern states, Bihar, J&K etc) are under-funded and depend on the state
government and external aid. On the other hand, the SPCBs of Gujarat, Maharashtra, Karnataka,
Tamil Nadu, Andhra Pradesh etc claim to be financially ‘sufficient’ – meaning, their expenditures are
lower than their incomes. However, we believe that this financial sufficiency is a mirage, as it is
largely a result of the inadequacies (of staff strength, technical infrastructure, R&D and inspection,
monitoring, testing and compliance assistance capacities) in the structure and work profile of the
SPCBs. There is no doubt that SPCBs need to do more than what they are currently doing to improve
the environmental quality in the country. It is also clear that this will require far more resources
than what even the financially self-sufficient boards have. SPCBs, therefore, should look ahead and
start planning for more financial resources to expand and intensify their work programmes. This
could be done by increasing the water cess (which is very low) and applying it to all industries,
increasing consent fees and introducing a system of financial penalties for non-compliance. SPCBs
that have to deal with fewer industries should be directly funded by the Central government.
COMPLIANCE AND ENFORCEMENT
5. Some state boards have started a bank guarantee system as an instrument to ensure compliance,
which is a positive development. In case of non-compliance, a portion of the bank guarantee can be
forfeited. However, there is no national guideline on this system. There are no standard procedures
or processes to determine the amount of the bank guarantee, the amount that can be forfeited, where
the forfeited amount should be used, etc. The ministry of environment and forests should announce
a national system of bank guarantee with proper policies, procedures and implementation guidelines
to enable its use by all SPCBs in a transparent and fair manner.
6. There is no standard definition, guideline or manual for what constitutes compliance and enforcement
in the country. For instance, different state boards have different interpretations of what constitutes a
proper compliance inspection and how frequently should it be conducted. The fact is that
statutes/regulations are notified by the Central government without comprehensive guidance on how
to implement them. SPCBs, therefore, interpret statutes/regulations and design implementation
guidance as they see fit. There is an urgent need to develop and disseminate standard guidance
manuals on different facets of compliance and enforcement for different statutes/regulations. The
CPCB should identify best practices and work with the SPCBs to develop them. This will enable
consistent implementation of compliance and enforcement across the country.
7. The focus of the compliance and enforcement programme of SPCBs has been large- and medium-scale
industries. Many officials of the boards have confessed to CSE that they are unable to ‘handle’ small-
scale industries. Small-scale industries are significant sources of pollution (the small-scale sponge iron
sector is a case in point) and must be bought under the regulatory umbrella for targeted monitoring
and compliance enforcement. It is quite clear that compliance and enforcement package of small-scale
industries will be different from those applied to large- and medium-scale industries. It will include
compliance assistance, technology support and financial incentives, as also credible deterrence for
non-compliance (which is non-existent today). SPCBs, therefore, should develop and implement
priority and targeted programmes for compliance and enforcement for the small-scale sector.
8. The entire compliance and enforcement mechanism in India is based on the concept of ‘legal’ sample.
Large amounts of self-monitored data on pollution and resource consumption are demanded and
collected by the SPCBs, but these are not used for enforcement. Because the self-monitored and self-
reported data is not used, they lack integrity. In most developed countries, self-monitoring, self-
recordkeeping and self-reporting are integral parts of the enforcement mechanism. The data
generated is used to direct enforcement actions and penalise falsification (of data). Interestingly,
39
REFORM AGENDA FOR INDIA’S ENVIRONMENTAL REGULATORS

most of the provisions for using self-monitored data (including penalty for falsification) for
enforcement purposes exist under Indian law, but have not been interpreted as such. Reinterpreting
existing laws to enable SPCBs to use self-monitored data as legal evidence would greatly enhance
their capacity in compliance and enforcement. This would make enforcement easier and improve the
integrity of self-monitored data. Accessibility of self-monitored data to the public will allow greater
public scrutiny and improve compliance and enforcement in the country further.
9. The legal route of enforcement action is not working in the country. In other words, there is a lack of
credible deterrence for non-compliance. Many countries have established a civil administrative
authority and have given powers to their environmental regulators to set compliance schedules and
to directly impose penalties on companies for certain categories of violation. In case the industry is
not satisfied with the verdict of the civil administrative authority, it can challenge it in a court of law.
This mechanism provides an effective enforcement tool to the regulators. Considering that there is a
clear lack of credible deterrence for non-compliance, the ministry of environment and forests should
come out with a policy paper on this issue and institutionalise an appropriate civil administrative
authority for SPCBs. However, there are major accountability and transparency issues that need to
be resolved before setting up such a mechanism, because poor institutional design and
implementation procedures can lead to corruption.
10. There is little state-wide or nation-wide data on the status of compliance in the country. The data that
is available lacks reliability. In fact, many SPCBs have reported that they measure compliance in
terms of the availability of ‘appropriate’ pollution control equipment; companies not having such
equipments are termed as non-compliant. Few SPCBs reported that they measure non-compliance
based on inspection and monitoring. In either case, data is not available and no one knows what
percentage of the regulatory basket in the country is not complying with the standards. First of all,
there is an urgent need to develop a uniform definition of compliance and how it should be measured.
Secondly, a nation-wide computerised system should be established to collect, collate and
disseminate compliance and enforcement data. This will go a long way in prioritising enforcement
action in the country.
INFORMATION MANAGEMENT
11. Many boards have set up computerised systems for consent management and for managing
information on compliance and enforcement. However, they have developed independent systems
and there is a problem of compatibility. This can create a roadblock if is an effort to compile a nation-
wide database (which is a desirable goal). It is probably the right time for the CPCB to work with the
SPCBs and develop a uniform data management system for all boards. This will help poorly funded
boards to get computerised and allow for state-wide comparison and compatibility.
ACCOUNTABILITY
12. There are no success or failure standards/indicators for SPCBs. In many developed countries, success
or failure standards for regulators are defined in terms of ambient environmental quality. If the
pollution level in an area is increasing, the responsibility of the same lies with the regulators.
Indicators are used to define the success/failures of compliance and enforcement programme
(reduction in total pollution load, percentage of industries complying, frequency of inspection, money
spent per industry etc.). The CPCB needs to develop similar indicators for SPCBs and create a
reporting format to collect, collate and disseminate the same to the public.
TRAINING AND CAPACITY BUILDING
13. SPCBs have no structured programme in place to upgrade the knowledge and skills of their scientific
and technical personnel. Training is conducted largely in an ad hoc manner. Limited training
40
REFORM AGENDA FOR INDIA’S ENVIRONMENTAL REGULATORS

opportunities are available and most training programmes are supply-side driven -- not based on the
actual needs and demands of the boards. Formal compliance and enforcement training is virtually non-
existent, though this is identified by most SPCBs as their key training requirement. No national
minimum training requirement has been prescribed and most SPCBs rely on informal on-the-job
training for their employees. There is, therefore, a clear need to set up a mechanism to impart training
to SPCBs on various cross-cutting environmental issues, including training on compliance and
enforcement, data management, communication, programme management etc. There is also a need to
prescribe national minimum training requirements on compliance and enforcement for new recruits.
Similarly, training on specific topics should also be specified for mid-level officers and senior officers.
TRANSPARENCY AND DISCLOSURE
14. SPCBs suffer from poor public perception. By and large, people are not satisfied with the
performance of state boards. One of the main reasons for this -- apart from all the drawbacks that
exist within SPCBs -- is the poor communication strategy of the boards. To take people into
confidence, SPCBs will have to become more open and transparent and voluntarily disclose all
possible information to the public. They should proactively engage with people, as public perception
in democracy is a tool that can be harnessed for strengthening institutions. On the flip side, poor
public perception can also bring down an institution.
41
REFORM AGENDA FOR INDIA’S ENVIRONMENTAL REGULATORS

42
NOTES & REFERENCES
Chapter 2: Regulatory Capacity and Resource Mobilisation
1. Water Act, 1978 on Constitution of State Pollution Control Board: a) Chairman, being a person having special knowledge or
practical experience in respect of [matters relating to environmental protection] OR a person having knowledge and
experience in administering institutions dealing with the matters aforesaid, to be nominated by the State Government:
[provided that the Chairman may be either whole-time and part-time as the State Government may think fit]
2. Annual report 2005-2006, West Bengal Pollution Control Board
3. Annual report 2005-2006, Andhra Pradesh Pollution Control Board
4. Annual Report 2006-07, Gujarat Pollution Control Board
5. Annual report 2005-2006, Madhya Pradesh Pollution Control Board
6. Information from Haryana State Pollution Control Board website (http://hspcb.gov.in/home.html)
7. Information from Goa State Pollution Control Board website (http://goaspcb.gov.in/)
8. The item ‘cess reimbursement’ stands for that part of the water cess, collected by the state boards from specific industries
and local bodies and later deposited with the Consolidated Fund of India, which is reimbursed to the state boards.
9. Consent fee collections include the fee collected by a state board from industrial units, which apply to the state board for (a)
establishing the unit, (b) operating outlets for effluents and emissions, and (c) renewing the consent to operate.
10. CPCB funds are for specific projects such as Global Environmental Monitoring System (GEMS), National Ambient Air Quality
Monitoring (NAAQM), Monitoring of Indian National Aquatic Resources (MINARS), clean technology and preparation of zoning
atlas;
11. Anon, 2003, Environmental Compliance and Enforcement in India, Rapid Assessment, OECD
Chapter 3: Regulatory Powers and Functions
1. Report on Environment Compliance and Enforcement in India, USEPA, 2005
2. Information provided by the Maharashtra Pollution Control Board to CSE
3. Report on Environment Compliance and Enforcement in India, USEPA, 2005
4. Results of the online survey conducted by CSE in 2007-08 for stakeholders of the board - NGOs and Industry
5. Information provided by the Maharashtra, Chhattisgarh and Gujarat boards to CSE
6. Annual report, West Bengal Pollution Control Board, 2005-06
7. Annual report, Orissa Pollution Control Board, 2001-02, 2002-03 and 2003-04
8. Annual report, Himachal Pradesh Pollution Control Board, 2002-03 and 2003-04
9. Annual report, Rajasthan Pollution Control Board, 2001-02, 2004-05, 2005-06 and 2006-07
10. Anon, 2003, Environmental Compliance and Enforcement in India, Rapid Assessment, OECD

vi blank

TURNAROUND REFORM AGENDA FOR INDIA’S ENVIRONMENTAL REGULATORS
CENTRE FOR SCIENCE AND ENVIRONMENTNew Delhi
2009
Centre for Science and Environment41, Tughlakabad Institutional Area,
New Delhi 110 062, INDIAPh: +91-11-29956110 - 5124 - 6394- 6399
Fax: +91-11-29955879E-mail: [email protected]
Website: www.cseindia.org


![APEX HOME INSPECTIONS · APEX HOME INSPECTIONS (763) 441-446 alan@apexhomemn.com HOME ADDRESS [Redacted for privacy of sample report] CLIENT NAME [Redacted for privacy of sample report]](https://img.dokumen.tips/doc/110x75/5fce02a5ec05aa463951b966/apex-home-inspections-apex-home-inspections-763-441-446-alanapexhomemncom-home.jpg)