Embed Size (px)
Citation preview
Reflections on the Future of Library Collections
David W. Lewis
April 6, 2006
© 2006 David W. Lewis. Permission to use this work is granted under the Creative Commons Attribution-NonCommercial-NoDerives license (2.5). You are free: to copy, distribute, display, and perform the work Under the following conditions: 1. You must attribute the work; 2. You may not use this work for commercial purposes, and 3. You may not alter, transform, or build upon this work. For any reuse or distribution, you must make clear to others the license terms of this work. Any of these conditions can be waived with permission of the copyright holder. Your fair use and other rights are in no way affected by the above.

My Approach:
1. To be exploratory
2. To be provocative
3. This is a preliminary view, but one that I believe could (or should) lead to a reconsideration of library practice
Based on presentation first given at the Coalition for Networked
Information, Fall Meeting, Portland, OR, December 7, 2004

Underlying Assumptions:
• Collections drive library practice because most library resources go into purchasing, organizing, and managing them. In addition, libraries base much of their identity on their collections.
• Unless current collection practices are changed, libraries cannot change, except on the margins.
Underlying Assumptions:
• Libraries must change.
• Therefore collection practices and strategies must change.
See: David W. Lewis, “The Innovator's Dilemma: Disruptive Change and Academic Libraries,” Library Administration & Management 18(2):68-74 Spring 2004. http://hdl.handle.net/1805/173
Underlying Assumptions:
• This change will be very hard
• We need to develop arguments and a vocabulary so we talk about this issue clearly
• To do this we need to have a clear conceptual understanding of what we hope to accomplish

My Fear:
I will be the Daniel Gore of the early 21st century.
See: Daniel Gore, “Farewell to Alexandria: The Theory of the No-Growth, High-Performance Library,” in Farewell to Alexandria: Solutions to Space, Growth, and Performance Problems of Libraries, Edited by Daniel Gore, Westport, CT: Greenwood Press, 1976.

Agenda for Today:
• Supply versus Demand driven collection strategies
• Present a model of demand for library collections over the next 25 years
• Explore implications of the model• Propose alternative approach to collection
practice based on the model
• Discussion

Supply Driven Strategy
• Historically this is the way libraries have approached collections
• Collect it and they will check it out
• Responds to expressed needs of high-end users — the faculty — and uses them as allies to get more dollars so we can build larger collections

Supply Driven Strategy
• In a print world this was not a bad strategy. Demand for materials was, and is, unpredictable and to serve a local community well print materials need to be in that community. So building large “just in case” collections made sense.
• Except…

Supply Driven Strategy
• Lead to judging quality by size (as in the ARL rankings) and libraries were then held captive to this standard
• Lead to inelastic demand for journals and the exploitation of this fact by commercial publishers

Demand Driven Strategy
• Look at how collections are actually used, not at expressed need
• Modify collecting based on changes in the actual use
• “Follow the User”

My ModelReally a Thought Experiment
• Makes assumptions about the use of various types of information sources
• Projects these assumptions over 25 years — 2005 to 2029

Variables in the Model
1. Use of the free web versus scholarly/library materials
2. Use of purchased library materials versus the use of open access materials
3. Database use versus the use of other purchased materials

Variables in the Model
4. Use of paper books versus electronic books
5. Use of paper journals versus electronic journals
6. Use of books versus journals

Problems:
1. Continuity over this time frame is unlikely
2. Categories are fuzzy• Is ebrary electronic books or a database?• What is ArtSTOR?
3. There is little or no good data of the sort need to drive the model

My Solution
• Charge ahead
• Make up numbers that seem reasonable
• Look at the big picture and not worry too much about the details

Open Web versus “Scholarly” Materials
• Current Use: “Scholarly” Materials 75%
• Change:
2005 to 2009 — Library Materials decline 3.0% per year
2010 to 2014 — Library Materials decline 2.5% per year
2015 to 2019 — Library Materials decline 2.0% per year
2020 to 2024 — Library Materials decline 1.5% per year
2025 to 2029 — Library Materials decline 1.0% per year

Open Web versus “Scholarly” Materials
0%
10%
20%
30%
40%
50%
60%
70%
80%
90%
100%
Library Resources Free Web

Purchased versus Open Access
• Current Use: Open Access 10%
• Change:2005 to 2009 — Open Access increases 15% per year
2010 to 2014 — Open Access increases 10% per year
2015 to 2019 — Open Access increases 7.5% per year
2020 to 2024 — Open Access increases 5% per year
2025 to 2029 — Open Access increases 2% per year

Purchased versus Open Access
0%
10%
20%
30%
40%
50%
60%
70%
80%
90%
100%
2005
2006
2007
2008
2009
2010
2011
2012
2013
2014
2015
2016
2017
2018
2019
2020
2021
2022
2023
2024
2025
2026
2027
2028
2029
Purchased Open Access

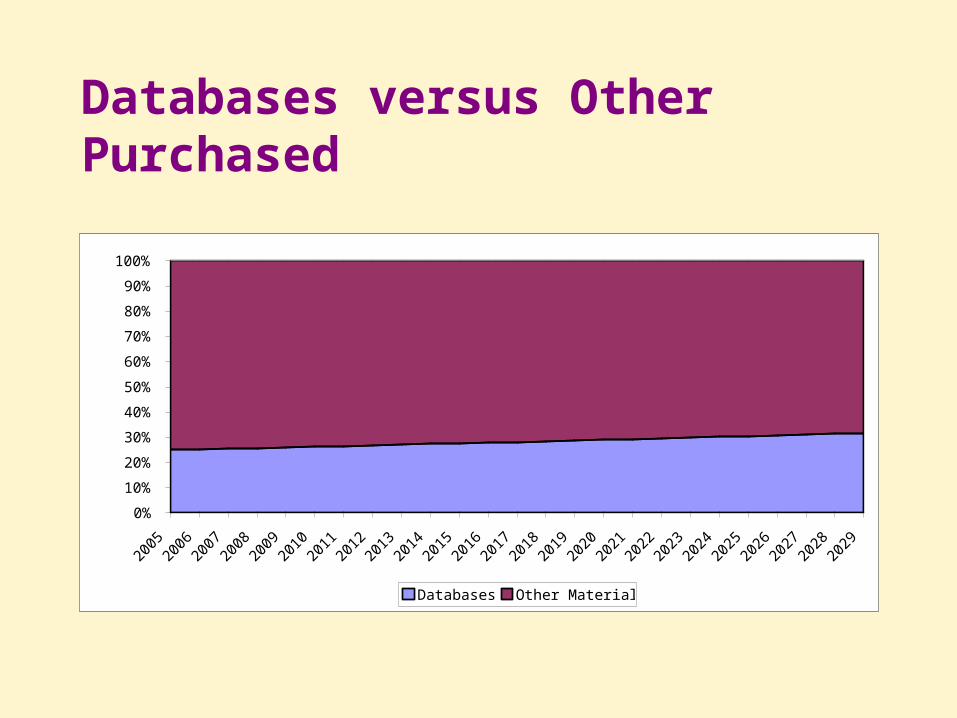
Databases versus Other Purchased
• Current Use: Database Use 25%
• Change:2005 to 2009 — Database use increases 1% per year
2010 to 2014 — Database use increases 1% per year
2015 to 2019 — Database use increases 1% per year
2020 to 2024 — Database use increases 1% per year
2025 to 2030 — Database use increases 1% per year
Databases versus Other Purchased
0%
10%
20%
30%
40%
50%
60%
70%
80%
90%
100%
2005
2006
2007
2008
2009
2010
2011
2012
2013
2014
2015
2016
2017
2018
2019
2020
2021
2022
2023
2024
2025
2026
2027
2028
2029
Databases Other Materials
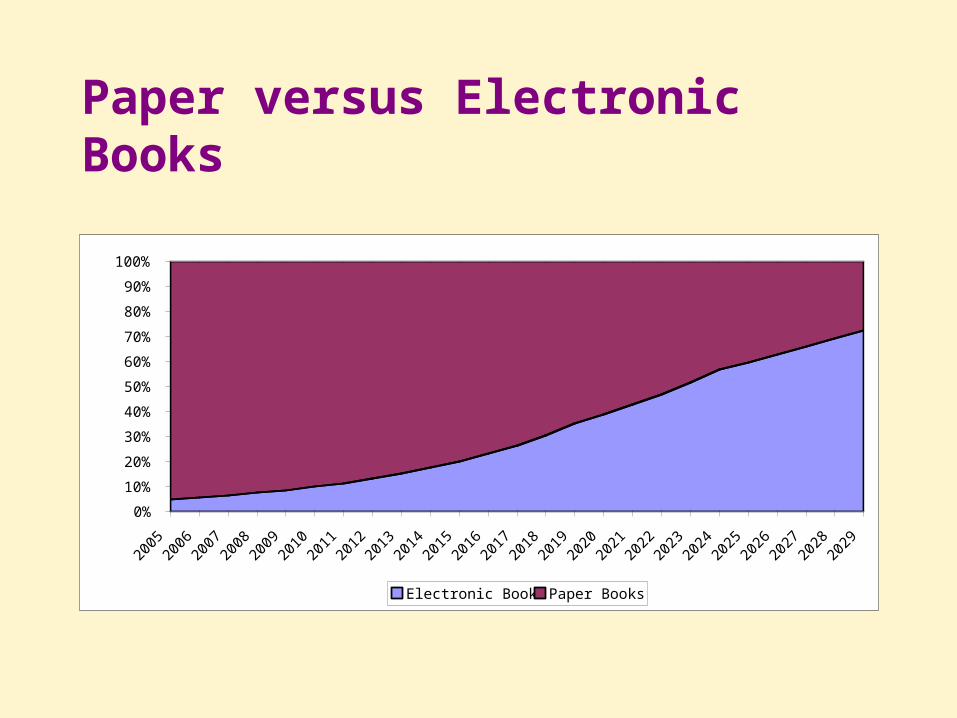
Paper versus Electronic Books
• Current Use: Electronic Books 5% of use
• Change:2005 to 2009 — E-Book use increases 15% per year
2010 to 2014 — E-Book use increases 15% per year
2015 to 2019 — E-Book use increases 15% per year
2020 to 2024 — E-Book use increases 10% per year
2025 to 2030 — E-Book use increases 5% per year
Paper versus Electronic Books
0%
10%
20%
30%
40%
50%
60%
70%
80%
90%
100%
2005
2006
2007
2008
2009
2010
2011
2012
2013
2014
2015
2016
2017
2018
2019
2020
2021
2022
2023
2024
2025
2026
2027
2028
2029
Electronic Books Paper Books

E-Book Use at Duke
“Based on this method of evaluation, e-books received 11 percent more use than comparable print books. Given their recent introduction to patrons at Duke, this suggests rapid growth in the adoption of e-books.”
p. 260.
See: Justin Littman and Lynn Silipigni Connaway, “A Circulation Analysis of Print and E-Books in an Academic Research Library,” Library Resources and Technical Services 48(4):256-262 October 2004.

Paper versus Electronic Journals
• Current Use: 20% Paper — 80% Electronic
• Change:2005 to 2009 — Electronic Journal use increases 2% per year
2010 to 2014 — Electronic Journal use increases 1% per year
2015 to 2019 — Electronic Journal use increases 1% per year
2020 to 2024 — Electronic Journal use increases 0.5% per year
2025 to 2030 — no change

Paper versus Electronic Journals
0%
10%
20%
30%
40%
50%
60%
70%
80%
90%
100%
20
05
20
06
20
07
20
08
20
09
20
10
20
11
20
12
20
13
20
14
20
15
20
16
20
17
20
18
20
19
20
20
20
21
20
22
20
23
20
24
20
25
20
26
20
27
20
28
20
29
Electronic Journals Paper Journals

Books versus Journals
• Current Use: 40% Books - 60% Journals
• Change: None

Results
0%
10%
20%
30%
40%
50%
60%
70%
80%
90%
100%
2005
2006
2007
2008
2009
2010
2011
2012
2013
2014
2015
2016
2017
2018
2019
2020
2021
2022
2023
2024
2025
2026
2027
2028
2029
Purchased Open Access Free Web
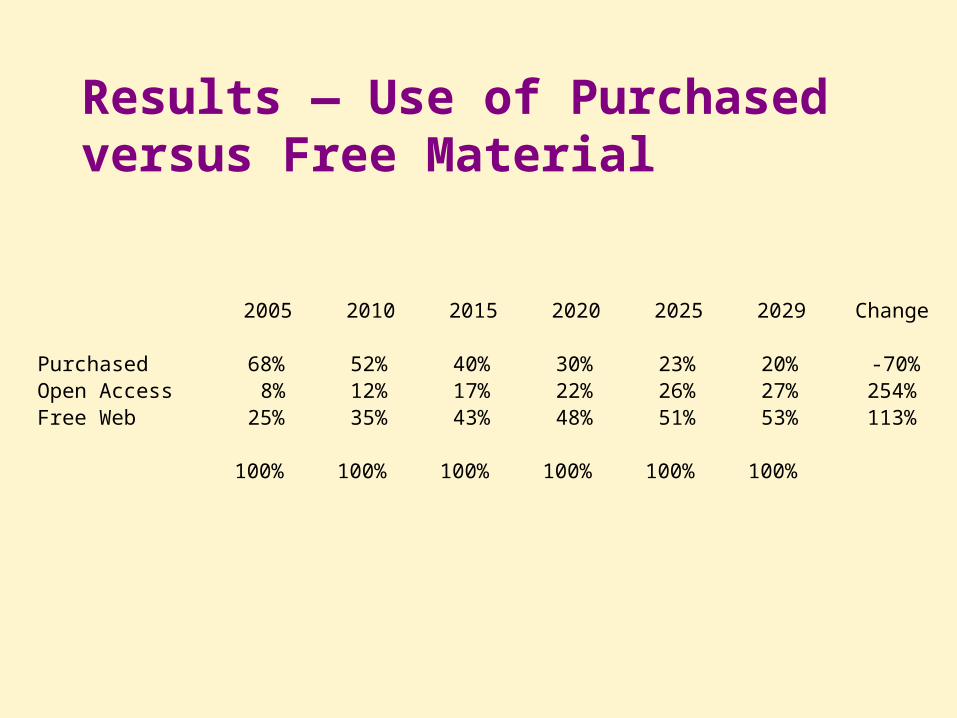
Results — Use of Purchased versus Free Material
2005 2010 2015 2020 2025 2029 Change
Purchased 68% 52% 40% 30% 23% 20% -70%Open Access 8% 12% 17% 22% 26% 27% 254%Free Web 25% 35% 43% 48% 51% 53% 113%
100% 100% 100% 100% 100% 100%

Results
0%
10%
20%
30%
40%
50%
60%
70%
80%
90%
100%
2005
2006
2007
2008
2009
2010
2011
2012
2013
2014
2015
2016
2017
2018
2019
2020
2021
2022
2023
2024
2025
2026
2027
2028
2029
Books Serials Databases Open Access Free Web

Results
2005 2010 2015 2020 2025 2029 Change
Paper Books 19% 14% 9% 5% 3% 1% -92%Electronic Books 1% 2% 2% 3% 4% 4% 293%Paper Journals 6% 3% 1% 1% 0% 0% -94%Electronic Journals 24% 20% 16% 12% 9% 8% -68%Databases 17% 14% 11% 9% 7% 6% -62%Open Access Monographs 3% 5% 7% 9% 10% 11% 254%Open Access Journals 5% 7% 10% 13% 15% 16% 254%Free Web 25% 35% 43% 48% 51% 53% 113%
100% 100% 100% 100% 100% 100%
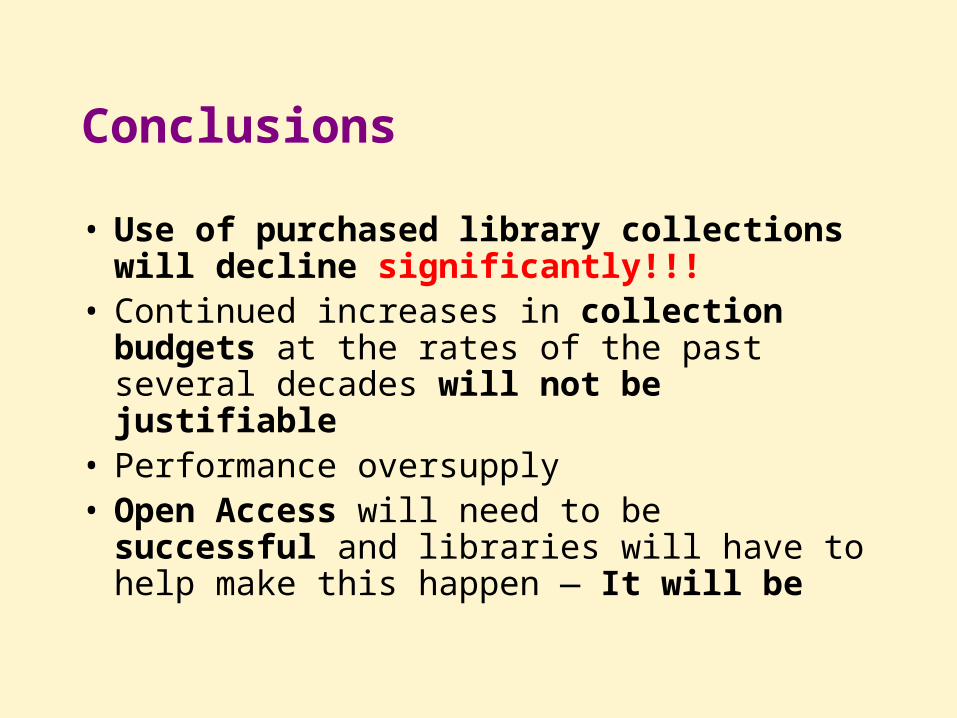
Conclusions
• Use of purchased library collections will decline significantly!!!
• Continued increases in collection budgets at the rates of the past several decades will not be justifiable
• Performance oversupply • Open Access will need to be successful
and libraries will have to help make this happen — It will be

Implications: Collection Strategies
Model a hypothetical library under two scenarios
1. Continue current collecting practice
2. Base collecting on the patterns of use or demand — “Follow the User” model

Hypothetical Library — Budget
Budget Cost per UnitUnits
Purchased
Paper Books $600,000 $50.00 12,000Electronic Books $60,000 $75.00 800
Databases $500,000
Paper Jounrals $800,000 $500.00 1,600Electronic Jounrals $800,000 $500.00 1,600
Binding $28,000 $10.00 2,800
Total $2,788,000
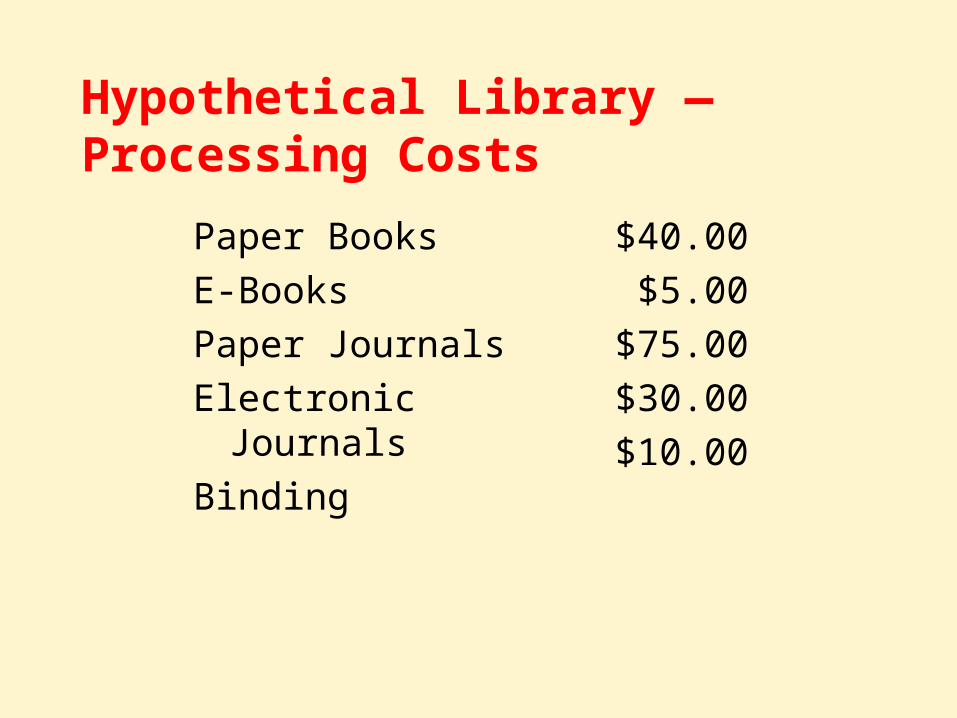
Hypothetical Library — Processing Costs
Paper Books
E-Books
Paper Journals
Electronic Journals
Binding
$40.00
$5.00
$75.00
$30.00
$10.00
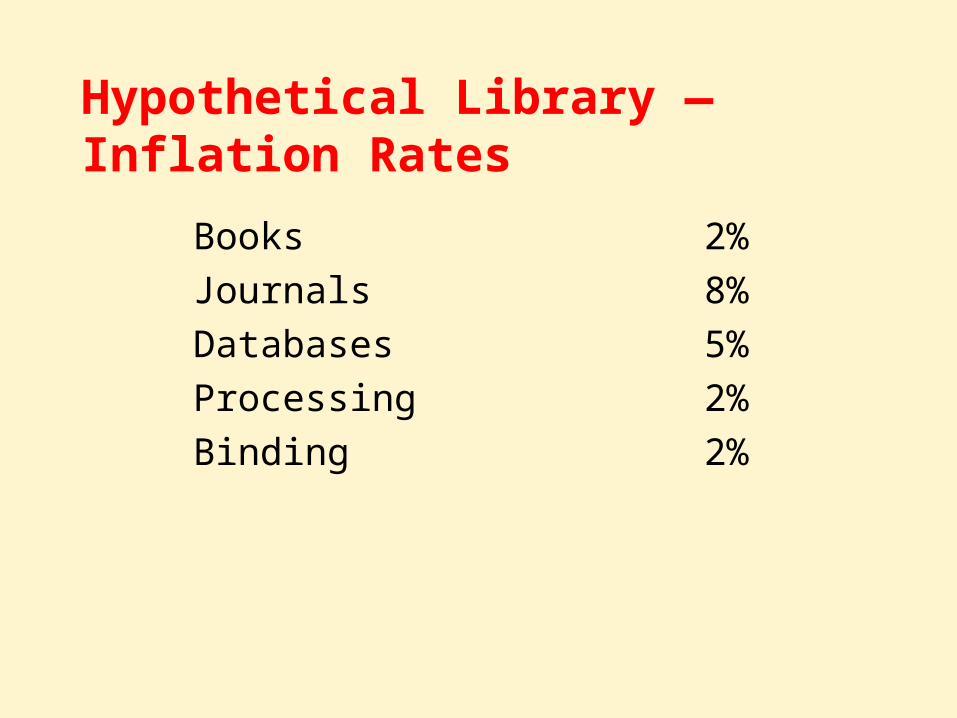
Hypothetical Library — Inflation Rates
Books
Journals
Databases
Processing
Binding
2%
8%
5%
2%
2%

Hypothetical Library — Changes in Practice
1. Migrate from 50/50 split between paper and electronic journals to a 20/80 split by 2015
2. Migrate from 94/6 split between paper books and e-books to a 40/60 split by 2020
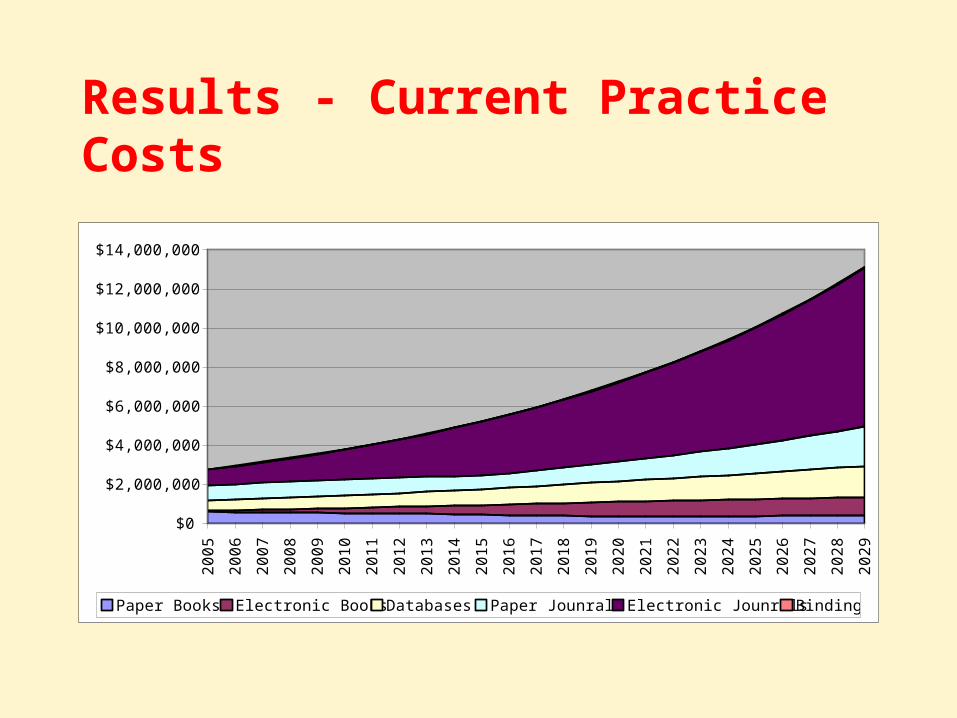
Results - Current Practice Costs
$0
$2,000,000
$4,000,000
$6,000,000
$8,000,000
$10,000,000
$12,000,000
$14,000,000
20
05
20
06
20
07
20
08
20
09
20
10
20
11
20
12
20
13
20
14
20
15
20
16
20
17
20
18
20
19
20
20
20
21
20
22
20
23
20
24
20
25
20
26
20
27
20
28
20
29
Paper Books Electronic Books Databases Paper Jounrals Electronic Jounrals Binding

Results - Current Practice Costs
2005 2010 2015 2020 2025 2029
Books $660,000 $631,710 $944,964 $1,119,762 $1,236,308 $1,338,220Databases $500,000 $638,141 $814,447 $1,039,464 $1,326,649 $1,612,550Jounrals $1,600,000 $2,350,925 $3,454,280 $5,075,471 $7,457,531 $10,145,889Binding $28,000 $23,071 $16,812 $15,504 $17,118 $18,529Processing $680,000 $630,050 $562,337 $510,784 $563,947 $610,434
Total $3,468,000 $4,273,896 $5,792,841 $7,760,985 $10,601,553 $13,725,622
Annual Rate of Increase Total 5.2% 5.7% 6.2% 6.5% 6.7%Annual Rate of Increase Materials 6.5% 6.6% 6.8% 6.8% 7.0%
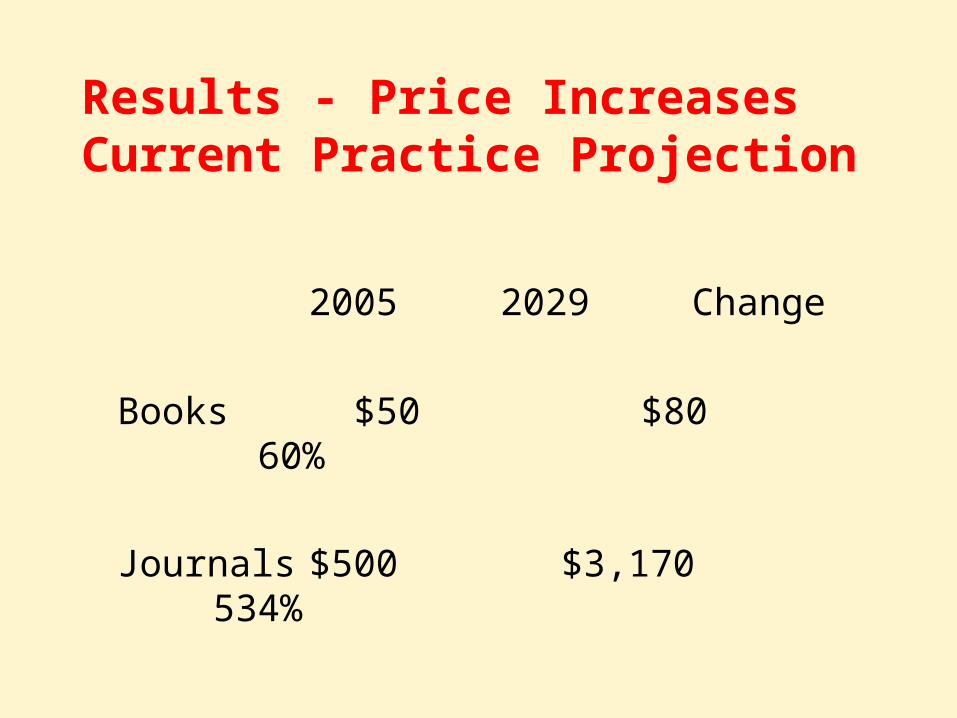
Results - Price Increases Current Practice Projection
2005 2029 Change
Books $50 $80 60%
Journals $500 $3,170 534%

Price Increases 1975 to 2000
1975 2000 Change
Books - U.S. Hardcover
$16.19 $60.80 275.5%
U.S. Periodicals
$19.94 $261.56 1,211.7%
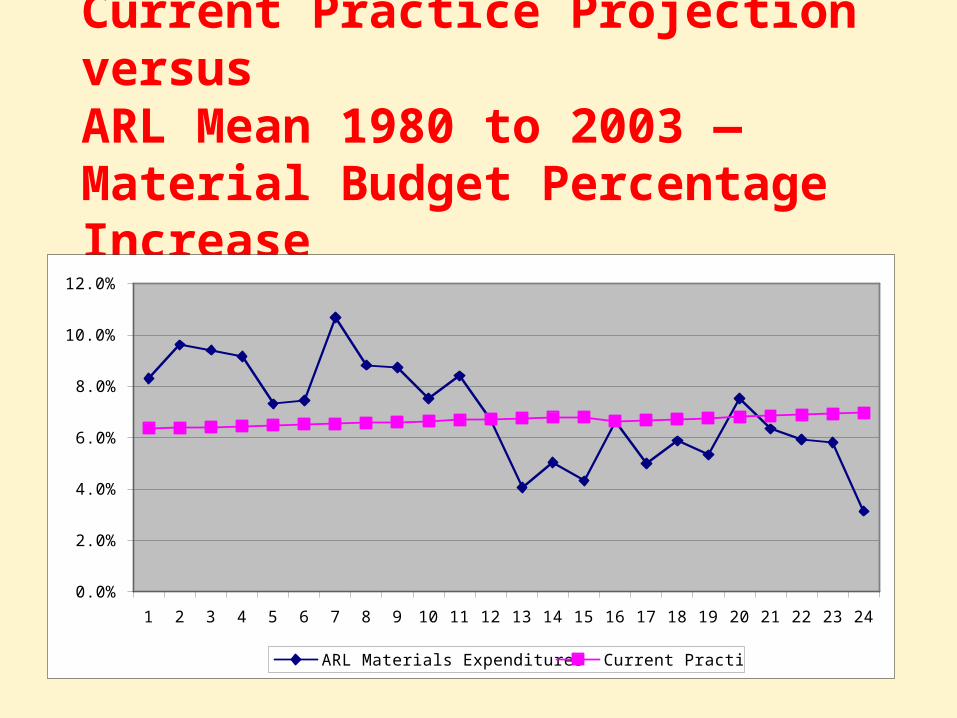
Current Practice Projection versus
ARL Mean 1980 to 2003 — Material Budget Percentage Increase
0.0%
2.0%
4.0%
6.0%
8.0%
10.0%
12.0%
1 2 3 4 5 6 7 8 9 10 11 12 13 14 15 16 17 18 19 20 21 22 23 24
ARL Materials Expenditures Current Practice
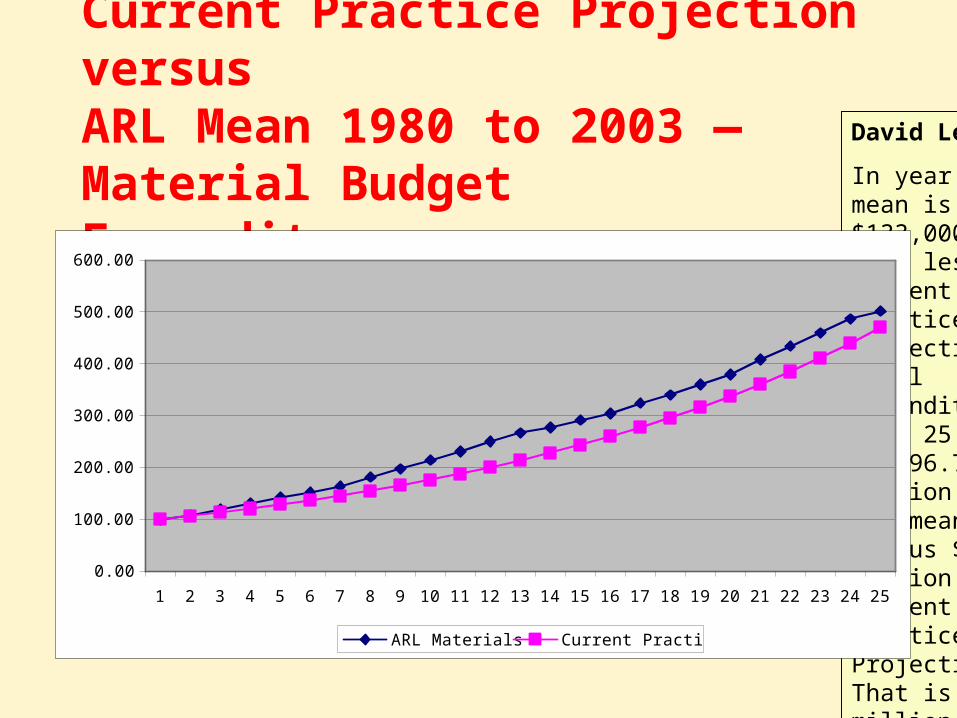
Current Practice Projection versus
ARL Mean 1980 to 2003 — Material Budget Expenditures
David Lewis:
In year 5 ARL mean is $133,000 or 1.8% less than Current Practice Projection. Total expenditure over 25 years is $96.7 million for ARL mean versus $88.4 million for Current Practice Projection. That is $8.3 million or 8.6% more for ARL mean over the 25 year period.
David Lewis:
In year 5 ARL mean is $133,000 or 1.8% less than Current Practice Projection. Total expenditure over 25 years is $96.7 million for ARL mean versus $88.4 million for Current Practice Projection. That is $8.3 million or 8.6% more for ARL mean over the 25 year period.
0.00
100.00
200.00
300.00
400.00
500.00
600.00
1 2 3 4 5 6 7 8 9 10 11 12 13 14 15 16 17 18 19 20 21 22 23 24 25
ARL Materials Current Practice

Current Practice - Summary
• Even though this seems like an impossible scenario, we have just lived through it
• But, it will not happen again!!!

“Follow the User” Collection Strategy
• Begin with current collecting patterns
• Change the number of items purchased in a category based on the changes in use — if book use drops by 5%, buy 5% fewer books
• Same processing and inflation assumptions also same shift from paper to electronic books and journals

“Follow the User” — Guess What Happens to Costs?
0%
10%
20%
30%
40%
50%
60%
70%
80%
90%
100%
2005
2006
2007
2008
2009
2010
2011
2012
2013
2014
2015
2016
2017
2018
2019
2020
2021
2022
2023
2024
2025
2026
2027
2028
2029
Books Serials Databases Open Access Free Web

Results — “Follow the User” Collection Strategy
$0
$500,000
$1,000,000
$1,500,000
$2,000,000
$2,500,000
$3,000,000
$3,500,000
$4,000,000
20
05
20
06
20
07
20
08
20
09
20
10
20
11
20
12
20
13
20
14
20
15
20
16
20
17
20
18
20
19
20
20
20
21
20
22
20
23
20
24
20
25
20
26
20
27
20
28
20
29
Paper Books Electronic Books Databases Paper Jounrals Electronic Jounrals Binding

Results — “Follow the User” Collection Strategy
$0
$500,000
$1,000,000
$1,500,000
$2,000,000
$2,500,000
$3,000,000
$3,500,000
$4,000,000
$4,500,000
20
05
20
06
20
07
20
08
20
09
20
10
20
11
20
12
20
13
20
14
20
15
20
16
20
17
20
18
20
19
20
20
20
21
20
22
20
23
20
24
20
25
20
26
20
27
20
28
20
29
Processing Books Databases Journals Binding

Results — “Follow the User” Collection Strategy
2005 2010 2015 2020 2025 2029
Books $660,000 $499,228 $540,066 $470,516 $390,136 $361,916Databases $500,000 $519,486 $532,751 $535,833 $551,288 $608,447Jounrals $1,600,000 $1,789,951 $1,974,192 $2,132,674 $2,353,336 $2,743,911Binding $28,000 $17,566 $9,609 $6,515 $5,402 $5,011Processing $680,000 $479,709 $321,387 $214,628 $177,962 $165,089
Total $3,468,000 $3,305,939 $3,378,005 $3,360,165 $3,478,123 $3,884,373
Annual Rate of Increase Total 0.3% 0.3% 0.8% 3.0% 2.7%Annual Rate of Increase Materials 1.5% 1.3% 1.4% 3.2% 2.9%
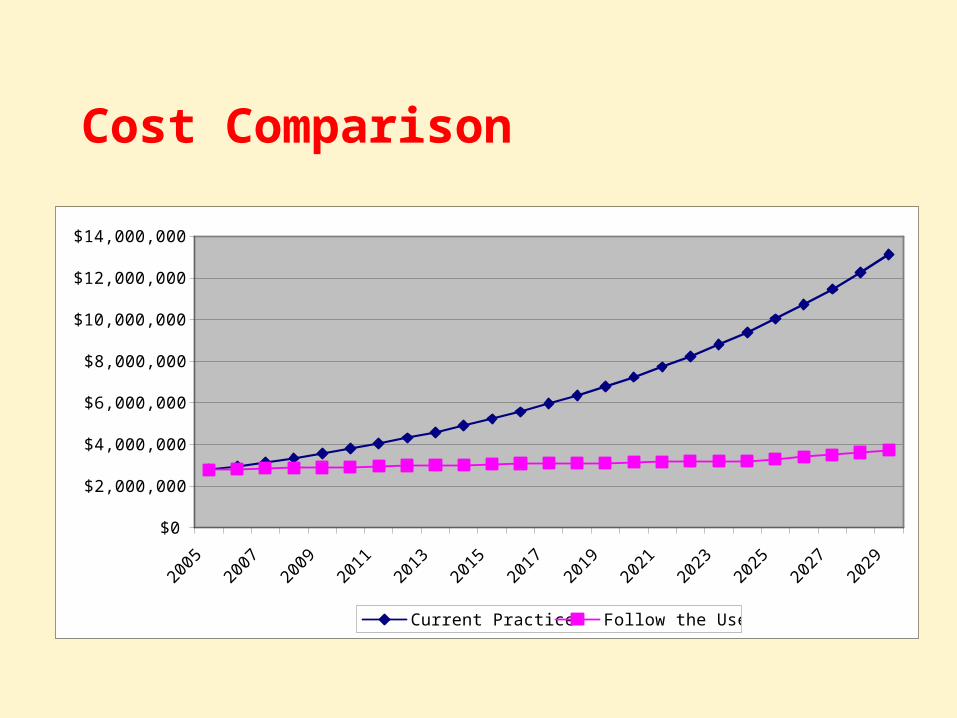
Cost Comparison
$0
$2,000,000
$4,000,000
$6,000,000
$8,000,000
$10,000,000
$12,000,000
$14,000,000
2005
2007
2009
2011
2013
2015
2017
2019
2021
2023
2025
2027
2029
Current Practice Follow the User
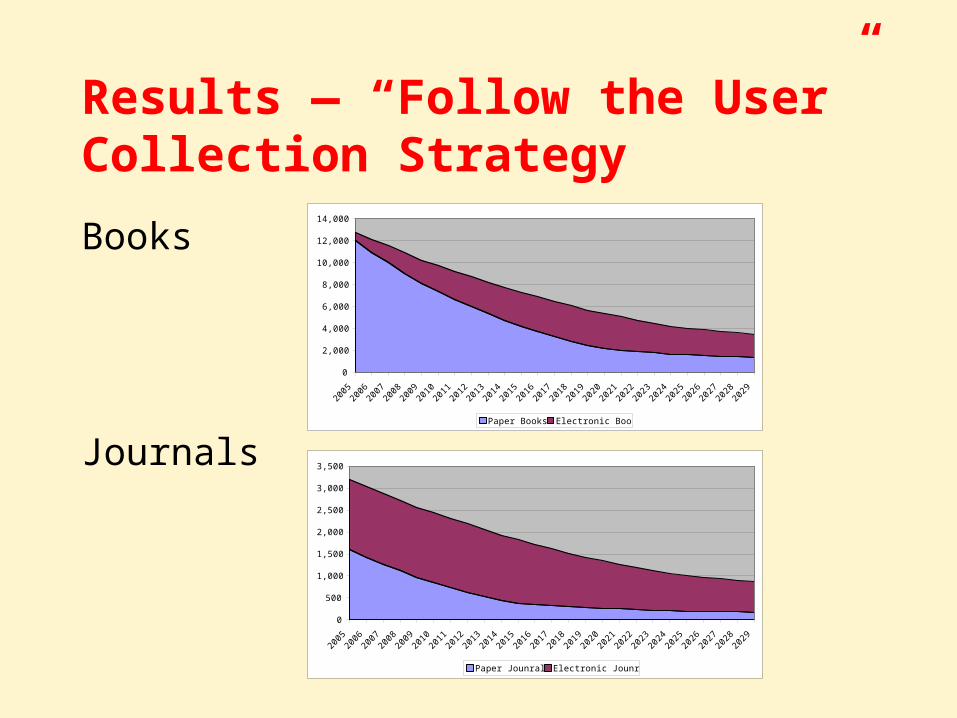
Results — “Follow the User” Collection Strategy
Books
Journals
0
2,000
4,000
6,000
8,000
10,000
12,000
14,000
2005
2006
2007
2008
2009
2010
2011
2012
2013
2014
2015
2016
2017
2018
2019
2020
2021
2022
2023
2024
2025
2026
2027
2028
2029
Paper Books Electronic Books
0
500
1,000
1,500
2,000
2,500
3,000
3,500
2005
2006
2007
2008
2009
2010
2011
2012
2013
2014
2015
2016
2017
2018
2019
2020
2021
2022
2023
2024
2025
2026
2027
2028
2029
Paper Jounrals Electronic Jounrals

Results — “Follow the User” Collection Strategy
2005 2010 2015 2020 2025 2029
Paper Books 12,000 7,382 4,225 2,151 1,616 1,385Electronic Books 800 2,363 3,091 3,227 2,424 2,077Total Books 12,800 9,746 7,315 5,378 4,039 3,462 % of 2005 76.1% 57.2% 42.0% 31.6% 27.0%
Paper Jounrals 1,600 853 366 269 202 173Electronic Jounrals 1,600 1,584 1,463 1,076 808 692Total Journals 3,200 2,436 1,829 1,345 1,010 865 % of 2005 76.1% 57.2% 42.0% 31.6% 27.0%

“Follow the User” Collection Strategy Comments
1. This version of a “follow the user” strategy may be too aggressive, but the general approach makes sense
2. Decreasing purchased collections is only one part of what is required
3. Other part is need for libraries to support open access

With Repository
$500,000 to start with 5% increase per year
$0
$1,000,000
$2,000,000
$3,000,000
$4,000,000
$5,000,000
$6,000,000
20
05
20
06
20
07
20
08
20
09
20
10
20
11
20
12
20
13
20
14
20
15
20
16
20
17
20
18
20
19
20
20
20
21
20
22
20
23
20
24
20
25
20
26
20
27
20
28
20
29
Materials Budget Processing Repository

With Repository
2005 2010 2015 2020 2025 2029
Materials Budget $2,788,000 $2,930,236 $3,056,618 $3,145,537 $3,300,161 $3,719,284Processing $680,000 $479,709 $321,387 $214,628 $177,962 $165,089Repository $500,000 $638,141 $775,664 $989,966 $1,263,475 $1,535,762
Total $3,968,000 $4,048,086 $4,153,669 $4,350,130 $4,741,598 $5,420,135Annual Rate of Increase Total 1.0% 0.3% 1.7% 3.5% 3.3%

Cost Comparison with Repository
$0
$2,000,000
$4,000,000
$6,000,000
$8,000,000
$10,000,000
$12,000,000
$14,000,000
$16,000,000
2005
2007
2009
2011
2013
2015
2017
2019
2021
2023
2025
2027
2029
Current Practice With Repository Follow the User

What this Means to Me
1. Assuming open access develops as it should, libraries can develop their collections in an appropriate way at a reasonable a cost
2. To do so requires that we change our collection building strategies — near term
3. To do so requires developing a new way of thinking about the role of the library — long term

New Collection Strategies — Near Term
• Really really good document delivery — maximize the use of paper collections
• Leverage the attributes of electronic formats– Aggregated journal collections purchased on an
FTE basis– “selected” collection versus user-drive purchasing
(or Patron Driven Access - PDA) especially for e-books

New Model — Long Term and More Important
Libraries have two roles:
1. To make purchased collections available to the members of the library’s community
2. To make special or unique collections held/managed by the library available to the world

New Model
In most libraries today
90% of the money for purchased collections
10% into special collections
Over the next 25 years this should change to at least a 50/50 split

New Model
2005 2010 2015 2020
Traditional Special Collections
Purchased Collections
Curated Collections100%
50%
0%

New Model
• Libraries should claim responsibility for institutional repository
• This role should be defined broadly to include digital libraries and digital publishing

New Model
• Put infrastructure in place — technology and people
• Some metadata is library responsibility• Developing repository collections is part of
librarian’s liaison work• Pay some authors fees for open access
journals• Fund national initiatives, for example Open
Content Alliance and LOCKSS

New Model
• Library Assets– Institutional commitment to access and
preservation for the long haul– Knowledge of how to do this (at least we
know more than anyone else — for now)– Significant resources (if we can repurpose
them)

Internal Political Dynamic
• Current materials purchasing is (or is generally viewed as being) balanced across the university
• Repository/Digital Libraries must also be seem as a university-wide service which serves all segments of the campus

“Free Rider” in the Commons
• Repository effort is self-serving because open access serves the institution and faculty by making their works easily available thus enhancing institutional and individual prestige
The Practical Question
• What annual percentage increase does the library need to manage its legacy print collections and to establish itself in the electronic/web environment?
• Answer — 2.5% to 3.0% a year

The Practical Question
$0
$1,000,000
$2,000,000
$3,000,000
$4,000,000
$5,000,000
$6,000,000
$7,000,000
2005
2007
2009
2011
2013
2015
2017
2019
2021
2023
2025
2027
2029
With Repository 2.5% Increase
The Practical Question — IUPUI
• 15 year model of IUPUI University Library materials budget– 2.5% annual increase– Hold book/serials dollar split constant for all
schools– 8% serials inflation and 2% book inflation– 50% annual increase in document delivery for five
years and 10% per year after that– Add 0.5% of total materials budget to digitization
fund each year (year one 0.5%, year two 1%, etc.)– Standard school allocation model
The Practical Question — IUPUI
$0
$1,000,000
$2,000,000
$3,000,000
$4,000,000
$5,000,000
$6,000,000
2006
/07
2007
/08
2008
/09
2009
/10
2010
/11
2011
/12
2001
2/13
2001
3/14
2001
4/15
2015
/16
2016
/17
2017
/18
2019
/20
2020
/21
2021
/22
Reserve Document Delivery Reference & General
Electronic Resources & E-Book Projects Other Digital Conversion
Schools Books Schools Serials

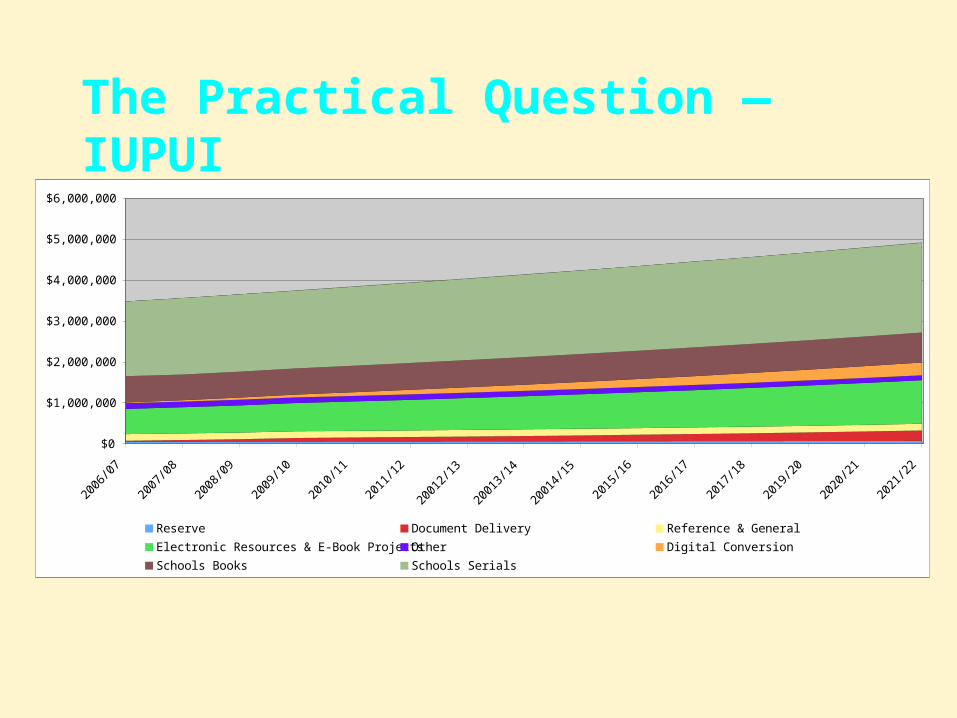
The Practical Question — IUPUI2006/07 2011/12 2016/17 2021/22
Budget Reserve $50,000 $57,596 $66,794 $73,728Document Delivery $26,500 $98,381 $174,288 $255,176Reference & General $163,000 $163,000 $163,000 $163,000Electronic Resources & E-Book Projects $615,000 $719,463 $910,350 $1,064,981Other $139,700 $134,419 $125,318 $119,836Digital Conversion $17,500 $91,530 $217,232 $311,997Schools Books $643,529 $645,121 $700,378 $733,077Schools Serials $1,823,371 $1,930,213 $2,095,542 $2,193,377
Total $3,478,600 $3,839,724 $4,452,902 $4,915,171
Budget Reserve 1.44% 1.50% 1.50% 1.50%Document Delivery 0.76% 2.56% 3.91% 5.19%Reference & General 4.69% 4.25% 3.66% 3.32%Electronic Resources & E-Book Projects 17.68% 18.74% 20.44% 21.67%Other 4.02% 3.50% 2.81% 2.44%Digital Conversion 0.50% 2.38% 4.88% 6.35%Schools Books 18.50% 16.80% 15.73% 14.91%Schools Serials 52.42% 50.27% 47.06% 44.62%
Total 100.00% 100.00% 100.00% 100.00%

The Practical Question — IUPUI
0
2,000
4,000
6,000
8,000
10,000
12,000
14,000
Total Books Total Serials
Books from 13,165 to 11,290 decline of 14.2%Serials from 2,635 to 1,333 decline of 49.4%

New Model — Conclusion
• By selling the repository role and open access
• And by documenting actual use of resources
• You can then make the case for constraining expenditures on purchased resources
• And then you can create the new model

Questions??
David W. Lewis
IUPUI University Library
© 2006 David W. Lewis. Permission to use this work is granted under the Creative Commons Attribution-NonCommercial-NoDerives license (2.5). You are free: to copy, distribute, display, and perform the work Under the following conditions: 1. You must attribute the work; 2. You may not use this work for commercial purposes, and 3. You may not alter, transform, or build upon this work. For any reuse or distribution, you must make clear to others the license terms of this work. Any of these conditions can be waived with permission of the copyright holder. Your fair use and other rights are in no way affected by the above.


![[Daniel Nolan] David Lewis (Philosophy Now)](https://img.dokumen.tips/doc/110x75/55cf9448550346f57ba0e491/daniel-nolan-david-lewis-philosophy-now.jpg)