Embed Size (px)
Citation preview

AP-42 Section Number: 9.1 1.1
Reference Number: 15
Title: Vegetable Oil Manufacturing Emission Test Report, Central Soya Inc., Delphos, Ohio,
EMB Report 78-VEG-4, Office of Air Quality Planning and Standards
US EPA
July 1979

1 United Siaies 0f:lce of Air @uali:y EMB Report 78-VEG-4 Environmental Protection Planning and Sfandaras Jbly 1979 ASency Rrsearch Triangle Park NC 1 7 7 1 1
Vegetable Oil Manufacturing
AP42 Section Reference & Report Sect. __ Reference -
Emission Test Report Central Soya, Incorporated Delphos, Ohio
i
. c -
i I GEM I I I I I I I I I
United Slates Office of Air Quality EMB Report 78-VEG-4 Environmental Protection Planning and Standards July 1979 Agency
Air
Research Triangle Park NC 2771 1
Vegetable Oil Manufacturing
Emission Test Report Central Soya, I n co rps rated Delphos, Ohio
CONTENTS
Page
I Introduction 1
11 Summary and Discussion of Results 4
111 Process Description and Location of Sampling Points 19
IV Sampling and Analytical Procedures 22
Appendix A 1.
2. Certification of Gas Standards Used
Gas Chromatograph Printouts - On Site Analysis CS2 Midget Bubbler Train
- 3 . TCA Train Analytical Data 4. Lab Analysis Hexane in CS2 and Meal 5. Waste Water Analysis
1. CS2 Bubbler Train Data Sheets 2. 3 .
Appendix B
TCA Sample Train Data Sheets Velocity Data - Cooler and Dryer Sites -
Appendix C Project Participants
Appendix D Sampling Log
7
, L
.. . ., .' .. - I . . '_ _.' - .

I . INTRODUCTION
During the week of January 8, 1979, an emission source s tudy
was conducted a t Central Soya vegetable o i l e x t r a c t i o n f a c i l i t y
i n Delphos, Ohio. The p l a n t processes soybeans t o produce vege-
I I 1 t a b l e o i l and l i ves tock feed. Vegetable o i l i s obtained from a
I so lvent . The p l a n t opera tes two s o l v e n t e x t r a c t o r s and two
so lvent e x t r a c t i o n process which uses hexane a s t h e e x t r a c t i o n
deso lven t i ze r - toas t e r s (DT) . Solvent vapor from t h e extra%ors
and D T ' s i s vented t o a condenser and then through two mineral
I o i l scrubbers (MOS) operated i n series. Meal from t h e D T ' s i s
then processed through a dryer and a cooler s t age before f i n a l
I preparat ion f o r shipment.
I
A i r from t h e meal cooler i s vented
through a cyclone and back i n t o t h e dryer . A i r from t h e dryer i s
. n ' i ( 1 r
&rcrl'. ., ventedl;to t h e atmosphere an 18 inch duct a t a r a t e of I
1 about 11,000 acfmJ d + - - p y k--.w>.s S - v . . .X..~--T
The purpose of t h i s study i s t o cha rac t e r i ze t h e flow of
I so lvent vapor through t h e var ious s t ages of t h e proce,ss, and t o
determine t h e ex ten t of so lven t l o s s e s from t h e w s through
I f u g i t i v e emissions, processed meal, fzxa-&e-W S , and p l a n t
p / A r?T
.)/C$CsA b l C 0 1 1
~ I waste water. In add i t ion , t h e emission measurements were ob-
t a ined using two sepa ra t e t e s t methods. This was done t o de t e r -
1 mine the b e s t method f o r use i n t h i s type of p l a n t and t o provide
I 1

d a t a f o r f u r t h e r development and improvement of t he t e s t methods.
The da ta from t h i s s tudy may a l s o be used t o e s t a b l i s h an emis-
s i o n s tandard f o r t h e vegetable o i l processing indus t ry .
Sampling f o r hexane vapor was conducted a t f i v e sites:
1. t h e i n l e t t o t h e f i rs t mineral o i l scrubber (MOS) 2 . o u t l e t of f irst MOS, i n l e t t o second MOS 3 . o u t l e t of second MOS (main vent t o atmosphere) 4. exhaust d u c t from meal cooler ( i n l e t a i r t o d rye r ) 5. dryer exhaust (vented t o atmosphere)
A t each of t hese s i t e s , measurements were taken simultaneously,
using two t e s t methods. Personnel from PEDCo Environmental, Inc.
employed a midget impinger t r a i n i n which carbon d i s u l f i d e ( C S 2 )
was used a s t h e c o l l e c t i n g media f o r hexane vapor. These samples
were analyzed on s i t e , using a Hewlett Packard model 5830A gas
~ chromatograph with f lame-ionizat ion de tec to r . -The tes t i s spe-
c i f i c f o r hexane and r e s u l t s a r e reported a s n-hexane. Personnel
from Po l lu t ion Control Science, Inc. used a t o t a l carbon ana lys i s
method ( T C A ) i n which t h e sample i s c o l l e c t e d i n a dry i c e f reeze
t r a p and cy l inde r . The t r a p and t h e evacuated cy l inder used t o
draw the sample a r e then capped o f f and returned t o t h e labora-
t o r y f o r a n a l y s i s . Analysis c o n s i s t s of oxidizing t h e sample t o
C02, methanating t h e sample, and determining t h e t o t a l amount of
carbon p resen t with a flame i o n i z a t i o n de tec to r ( F I D ) . Resul ts
a r e reported a s t o t a l gaseous non-methane organics (TGNMO).
R e s u l t s of both of t hese t e s t s a r e included i n t h e r epor t .
During each of t h e t e s t s a t t h e dryer and cooler s i t e s , meal
samples were c o l l e c t e d a t the following s i t e s :
2
e
I Y I I I I I 1 I
I I ' I I I
I '
7 1
I
'1

1. exit point from both desolventizer-toasters (DT-1 and DT-2)
2. exit point from the dryer 3 . exit point from the meal coolers before the final
preparation area
All meal samples were analyzed at the PEDCo Environmental, InC.,
laboratory to determine the hexane concentration. '
During each test at the mineral oil scrubber, a sample of
the mineral oil exiting the scrubber and a sample of the plant
wastewater effluent was obtained. In addition, one sample of
vegetable oil from the Central Soya storage tank was obtained.
Each of these samples was to be analyzed for residual hexane
content.
report.
necessary to analyze the oil samples and this data is not yet
available.
Results of the wastewater analysis are included in this
At this time, PEDCo Environmental lacks the equipment
3

11. SUMMARY AND DISCUSSION OF RESULTS
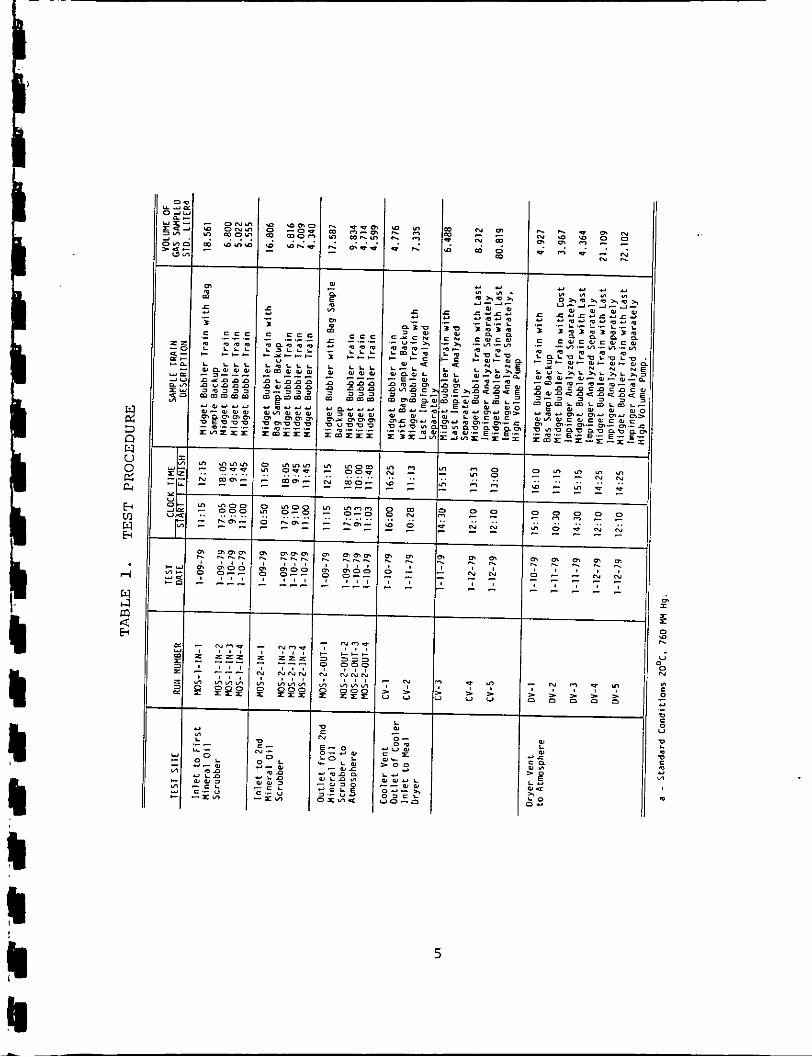
T e s t r esu l t s and da ta r e l a t i n g t es t procedures and sampling
condi t ions f o r a l l t r i a l s run with t h e carbon d i s u l f i d e bubbler
t r a i n method a r e l i s t ed i n Tables 1-5. Table 1 descr ibes t h e
t es t procedure used i n each t r i a l including t h e t e s t da t e , t h e
t i m e and dura t ion of sampling, t h e volume of gas sampled, and t h e
sample t r a i n desc r ip t ion . It should be noted t h a t t h r e e
d i f f e r e n t procedures a r e l i s t e d under sample t r a i n desc r ip t ion .
Midget bubbler t r a i n r e f e r s to t h e s tandard carbon d i s u l f i d e
bubbler t r a i n descr ibed i n t he sampling procedures sec t ion of
t h i s r epor t . The o the r two procedures were designed t o tes t t h e
c o l l e c t i o n e f f i c i e n c y of t he sample t r a i n . A t each t e s t s i t e ,
one t r i a l was run using a bag sampler behind t h e bubbler t r a i n .
This was done by connecting t h e o u t l e t of t h e bubbler t r a i n t o
t h e i n l e t of a t e d l a r bag contained i n an a i r t i g h t box.
drawn through t h e bubbler t r a i n i n t o t h e bag by ev'acuating the
box.
l o s t from t h e sample t r a i n . The second procedure used t o t e s t
t h e c o l l e c t i o n e f f i c i e n c y of t he t r a i n involved adding an e x t r a
impinger with 15 m l of carbon d i s u l f i d e t o t h e t r a i n . This
impinger was then recovered and analyzed sepa ra t e ly f o r hexane
concentrat ion. T a b l e 2 i s a summary of ambient and gas stream
A i r is
The bag i s then analyzed t o determine t h e amount of hexane
4
1 1 I I I 1 I I I I I I I I I I I I I
n 0 0 1 - 0-< . . . . . . . - - E m -
N
> u
5
3 - 0 - 0 I -" . . . . . . J " a z : - o - O I/ . . . . . . . . . .
- 0 9 " - . - - - -

0 H
8 .
yl m m N m 0000 m m m m m oooool . . . . . . . . . . . 00 o 00 " N O 0 . . . . .
" N - 7 < - o m --N- u w w w . . - ---- ---- 00 I , , , I , , , , , , I + + 4 + + I , , , ,
I
5 5 L 3 0 c o 0' Ln
Ln u r n 0 3
4 % 0 VI
I
VI z 0 H H H n
U
W 2 4 H
$ VI
h 0
N
w 4 m 5
1
t
c z ;k U
I
3 0 -
m u 0 w m c
Y I W w - D O I U L
n - a u
VI 0 0 U Z " w m -I. c .r l u .
U l= N
0 ' ' w . .-VI c o -E
52
2 = .
L L .
VI '0
' v z > c c O N U
6
I r I' I
i I ;I
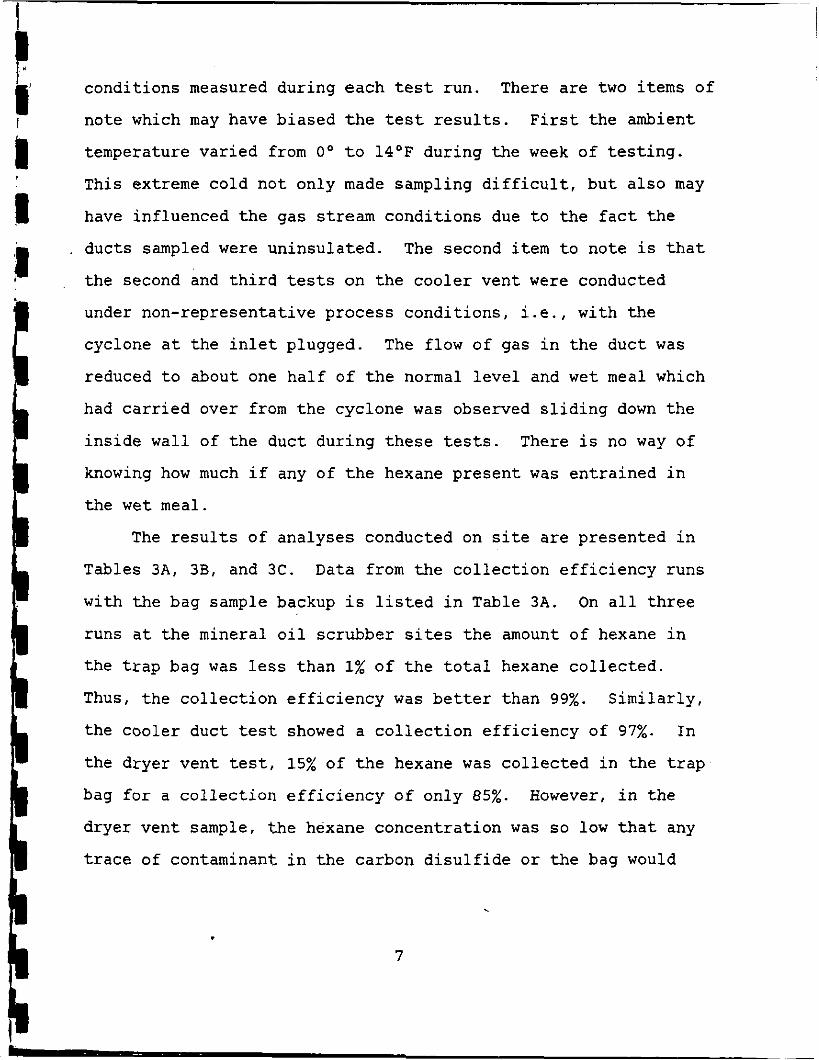
conditions measured during each test run. There are two items of
note which may have biased the test results.
temperature varied from 0' to 14'F during the week of testing.
This extreme cold not only made sampling difficult, but also may
have influenced the gas stream conditions due to the fact the
First the ambient
, ducts sampled were uninsulated. The second item to note is that
the second and third tests on the cooler vent were conducted
under non-representative process conditions, i.e., with the
cyclone at the inlet plugged. The flow of gas in the duct was
reduced to about one half of the normal level and wet meal which
had carried over from the cyclone was observed sliding down the
inside wall of the duct during these tests. There is no way of
knowing how much if any of the hexane present was entrained in
the wet meal.
The results of analyses conducted on site are presented in
Tables 3A, 3B, and 3C. Data from the collection efficiency runs
with the bag sample backup is listed in Table 3A. On all three
runs at the mineral oil scrubber sites the amount of hexane in
the trap bag was less than 1% of the total hexane collected.
Thus, the collection efficiency was better than 99%. Similarly,
the cooler duct test showed a collection efficiency of 97%. In
the dryer vent test, 15% of the hexane was collected in the trap
bag for a collection efficiency of only 85%.
dryer vent sample, the hexane concentration was so low that any
trace of contaminant in the carbon disulfide or the bag would
However, in the
.
7

H €i 0 w d d 0 U
.. v) H v) >I 4 4 z 4
w f i
z 0
4 m
o r ) , . c - 3 3 , . . . - e m o m m r - 3 m i c OI
- . m - - ii a -, Ln
N D I , . * o - 3 0 0 0 . . v o o / j A i
" - 3 ii 0 0

‘I I I I I I I I I I I I I I I I I l
a w Q
a u v1
2
;? 0
i3 w z E z H
z 0 H
H
2 h z w U 2 0 U
w z 4 x w z .. 01 H (0
4 z 4 W h H rn z 0
s
Q 0
W
3 h 9

3 0
- 9 4 , 0 0 - 3 D - I1
10

interfere significantly with the analysis. In all tests using an
extra impinger, (Table 3C). less than 5% of the hexane collected
was found in the last impinger.
A l s o listed in Table 3C are the results of integrated bag
samples taken from the cooler and dryer sites. These samples
,were analyzed directly on the gas chromatograph as soon as the
test was completed and are probably most representative of the
true source concentration. The values of 5.3 ppm at the cooler
site and 38.3 ppm at the dryer should correspond to the results
of bubbler train tests four and five. At the dryer, tests DV-4
and DV-5 showed an average concentration of 42 ppm. The analysis
on cooler vents tests CV-4 and CV-5 was not sufficiently
sensitive to determine the concentration in this low range.
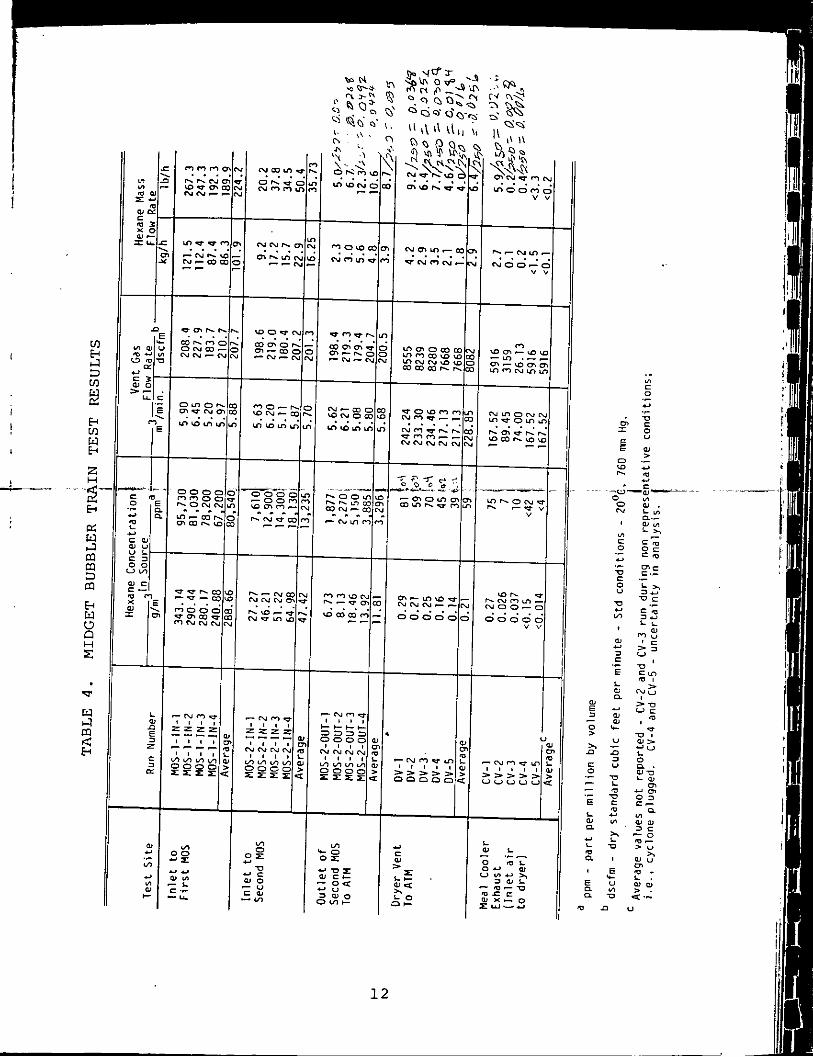
The final results of each test including the calculated
hexane concentration and corresponding mass flow rate, are sum-
marized in Table 4. Field data sheets and example calculations
for these tests are included in the appendix of this report.
In order to check the stability of the hexane samples in
carbon disulfide, all samples analyzed on site were stored for
one month and then reanalyzed in the PEDCo Environmental lab.
The gross weights of the samples and containers were checked in
the lab to determine if any of the sample had been lost due to
evaporation or spills. A comparison of the two analyses is
presented in Table 5. Laboratory analysis was done with a less
sensitive instrument and values less than 0.01 pg/pl are not
11
z Y
a w 4 m m 3 m
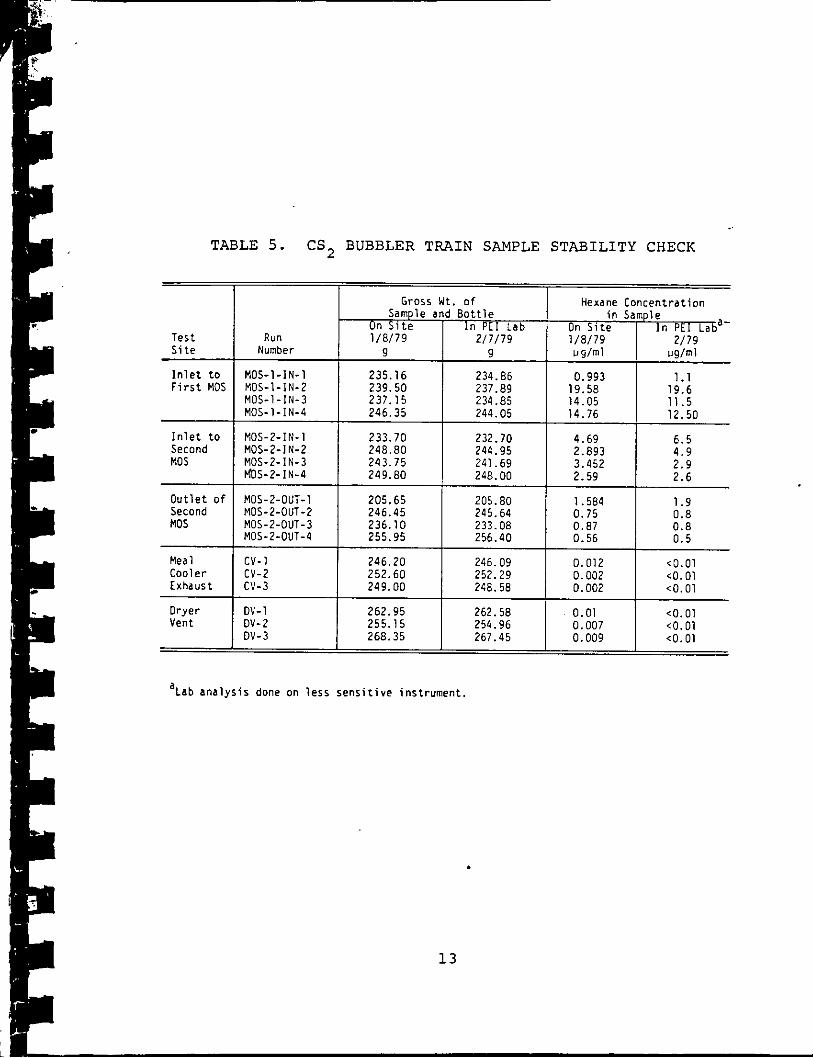
TABLE 5. C S 2 BUBBLER TRAIN SAMPLE STABILITY CHECK
Gross W t . o f Hexane Concen t ra t i on
On S i t e In P E I t a b On S i t e I n PEI Laba- Sample and B o t t l e i n Sample
Test Run 1/8/79 2/7/79 1/8/79 2/79 S i t e Number a 0 icolml , , " /ml
I n l e t t o MOS-1-IN-1 235.16 234.86 0.993 1.1 F i r s t MOS MOS-1-IN-2 239.50 237.89 19.58 19.6
MOS-1-IN-3 237.15 234.85 14.05 11.5 MOS-1-IN-4 246.35 244.05 14.76 12.50
233.70 Second HOS-2-IN-2 248.80
MOS-2-IN-3 243.75 mS-2- IN-4 249.80
205.65 Second MOS-2-OUT-2 246.45
MOS-2-OUT-3 236.10 MOS-2-OUT-4 255.95
cv- 1 246.20 252.60 249.00
232.70 4.69 6.5 244.95 2.893 4.9 241.69 3.452 2.9 248. 00 2.59 2.6
205.80 1.584 1 0.75 I {!! 1 245.64 233.08 0.87 256.40 0.56 0.5
1 1 I 246.09 0.012 <0.01 252.29 0.002 <0.01 248.58 0.002 <0.01
Dryer DY-1 262.95 262.58 0.01 <0.01 Vent DV-2 255.15 254.96 0.007 <0.01
DV-3 268.35 267.45 0.009 <0.01
aLab a n a l y s i s done on l e s s s e n s i t i v e i ns t rumen t .
13

I-
repor ted . With the gas chromatograph used on s i t e , concentra-
t i o n s a s low a s 0 . 0 0 1 p g / p 1 were de tec t ab le . Since t h e gross
weight of t he sample a t t h e t e s t s i t e was determined before
po r t ions were taken o u t f o r ana lys i s and s i n c e t h e weighings i n
the labora tory were done on a d i f f e r e n t s c a l e , small d i f f e rences
i n weight (<lg) would n o t be s i g n i f i c a n t . Given these considera-
t i o n s , agreement between on s i t e and p o s t - t e s t l a b ana lys i s was
good with only a couple of except ions.
changes i n concentrat ion occured with the l a s t two samples from
t h e i n l e t of t h e mineral o i l scrubber. Sample number MOS-1-IN-3
showed 2.3 g d i f f e rence i n weight and t h e concentrat ion changed
from 14.05 p g / p l t o 11.5 pg/p1.
2.3 g i n weight and from 14.76 p g / p l on s i t e t o 12.50 pg/pl i n
t h e l ab .
The most s i g n i f i c a n t
Sample I_ - - - number --- - MOS-l=IN=4 changed- .~ I___ I ---
Resul ts of ana lys i s f o r hexane i n meal samples a r e presented
i n Table 6 .
o r ppm by weight. The da ta i s extremely incons i s t en t . Values of
hexane concentrat ion vary a s much a s 500 ppm between dup l i ca t e
samples taken a t t h e dryer and cooler si tes. The weight of
sample was a l s o incons i s t en t and t h i s may have e f f ec t ed the
a n a l y t i c a l r e s u l t s .
than those recommended f o r t h e method.
process da ta taken during the t e s t per iod may a l s o be of help i n
understanding these incons i s t enc ie s .
Values f o r hexane concentrat ion a r e l i s t e d as pg/g
Also t h e sample b o t t l e s used were smaller
A thorough study of t h e
14

Test site
b DT -1 DT-2 DT-1 DT- 2 DT-1 DT-2 DT-1 DT-2 Dryer Dryer Cooler Cooler DT-1 DT-2 Dryer Dryer Cooler Cooler DT-1 DT-2 Dryer Cooler Cooler
TABLE 6. HEXANE ANALYSIS OF MEAL SAMPLES COLLECTED AT CENTRAL SOYA, DELPHOS, OHIO
Sample NO
001 002 0 03 004 005 006 007 008 009 010 011 012 013 014 015 016 017 018 019 02 0 021 023 024
Sample taken Da te/Time
1-9-79/17:35 1-9-79/17 :30 1-10-79/ 9:30 1-10-79/ 9:30 1-10-79/11:15 1-10-79/11:15 1-11-79/11: 05 1-11-79/11:05 1-11-79/11:05 1-11-79/11: 05 1-11-79/11:05 1-11-79/11:05 1-11-79/14 : 55 1-11-79/14 :55 1-11-79/14 : 55 1-11-79/14 : 55 1-11-79/14:55 1-11-79/14 : 55 1-12-79/12: 45 1-12-79/12:45 1-12-79/12:45 1-12-79/12 :45 1-12-79/12:45
Sample weight/g
1.5225 3.3094 1.6836 1.6005 1.8572 1.3956 2.2523 1.6147 1.9814 2.0210 2.2906 2.1682 1.4245 1.5648 2.3091 1.8955 2.3983 2.3486 1.1614 1.5363 2.3088 2.7055 1.8404
a Hexane conentr at ion
w / g
783 1047 1189 282
1399 +;+ 1489- <10 -L.J <lo 1010 1560 1257 1125 861 863 80
664 515 310 267 726 10 30 28 6
a b
Reported as n-Hexane Desolventizer toaster
i
15 Il!, I/
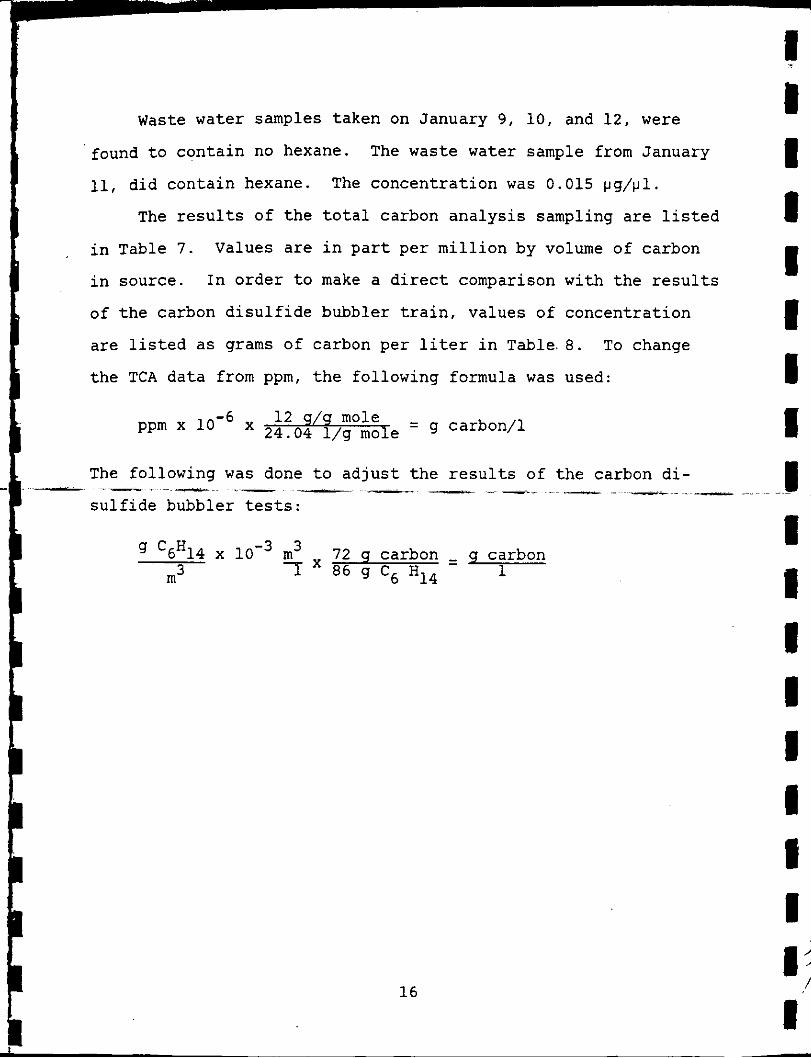
Waste water samples taken on January 9 , 10 , and 12 , were
‘found t o conta in no hexane. The waste water sample from January
11, did conta in hexane. The concent ra t ion was 0.015 p g / p l .
The r e s u l t s o f t h e t o t a l carbon ana lys i s sampling a r e l i s t e d
i n Table 7 .
i n source.
of t h e carbon d i s u l f i d e bubbler t r a i n , values of concentrat ion
a r e l i s t e d as grams of carbon per l i t e r i n Table .8 . To change
t h e TCA da t a from ppm, t h e following formula was used:
Values a r e i n p a r t p e r m i l l i o n by volume of carbon
I n order t o make a direct comparison with t h e r e s u l t s
ppm x x me = g carbon/l
The following was done t o a d j u s t t h e r e s u l t s of t h e carbon d i -
s u l f i d e bubbler tests: I_ .~ ~ - _I -~ __ ...~ ~ .. ~- - ~.-
72 g carbon - 9 carbon 1 ‘gH14 x m3 - m 3 7 86 g C6 H14
16
1 I I I I I 1 I I 1 1 I I I a 1
I I’ /

TABLE 7 . SUMMARY OF TCA DATA FROM CENTRAL SOYA-DELPHOS 1 / 3 1 / 7 9
Source
MINERAL OIL SCRUBBER #1
MINERAL OIL SCRUBBER # 2
MAIN VENT DISCHARGE
COOLER
DRYER
Sample mg C1 tank mg C1 trap
2 tank sample lost 2 4 0 3 2 . 3 1 9 1 8 9 . 0 4 6 4 . 4 3 1 8 1 . 0
2 tank sample lost 5 0 . 0 0 3 6 . 5 9 0 4 7 . 7 0 4 7 . 0 9 0 2 1 . 9 1
2 3 4
2 3 4
4 . 3 8 1 0 . 5 3 0 6 . 2 9 6 4 . 2 2 6 6 . 0 0 9 1 4 . 3 3
0 . 0 3 4 0 . 3 2 5 NDL
0 . 3 2 5 0 . 3 8 4 0 . 3 3 6 2
PPm C1 @ source
1 3 5 0 0 0 (trap only) 2 3 0 7 0 0 2 7 2 7 0 0
2 9 2 3 0 9 1 4 2 0 3 4 1 4 0
3 0 6 0
1 2 0 2 0
4 7 6 8 7 6 - 2 1 6
1 1 2 3 0
~ ~~
5 0 . 2 9 9 trap sample lostL - 2 . 4 2 5 1 . 4 5 4 7 9 8 0 2
3 0 . 3 8 7 1 . 0 6 9 1 1 6 0 4 NDL 0 . 1 3 3 2 4 7 0 5 NDL trap sample lost -
NDL - No Detectable Level.
Dirt and/or dried grain had gotten lodged in the tank quick connect, and the sample was contaminated.
These samples were taken by PEDCo personnel. were not refrigerated. were loose.
The trap samples 2
Nuts on traps from Dryer 5 and Cooler 5
NOTE: water in the traps, analysis of t h e trap samples from Mineral Oil Scrubber #1 was difficult.
Due to the extremely high concentrations of hexane and/or
17

source
Inlet to first MOS
Inlet to second MOS
Outlet of second MOS
-- -Dr-yer - vent
Cooler duct
Number
MOS-1-IN-2 MOS-1-IN-3 MOS-1-IN-4
MOS-2-IN-2 MOS-2-IN-3 MOS-2-IN-4
MOS- 2-OUT-2 MOS-2-OUT-3 MOS-2-OUT-4
-.DV-2- - DV- 3 DV-4 cv- 2 cv-3 cv-4
0.243 0.234 0.201
0.0386 0.0428 0.543
0.00679 0.0154 0.0116
-4 -1 .7-5 -x- 1-0 -7- 2.09 x 1.34 x 10
6.37 x 1.25 x 10
0.22 x 10:;
0.0674 0.115 0.136
0.0146 0.0456 0.017
0.0015 0.0056 0.017
-4 -3. 98-X-10 ~- 5.79 x 10:; 2.35 x 10 2.38 x 10:; 4.37 x 1.08 X 10
1 1 1 1 i 1 1 1 1 1 1 E 1 1 1 1 1 1 c
111. PROCESS DESCRIPTION AND LOCATION OF SAMPLING POINTS
The Central Soya plant processes vegetable oil from soybeans
through a solvent extraction process employing hexane. Figure
1.1 is a process flow diagram for this plant. Solvent vapor from
the extractor and desolventizer units are controlled through the
use of a condenser and two mineral scrubbers operated in series.
The condenser collects about 89% of the hexane, leaving the gas
entering the mineral oil scrubbers with about 10% by volume
hexane. Based on the test data, the mineral oil scrubbers are
from 80-85% efficient in removing the hexane.
across both scrubbers is better than 95% with only 0 . 3 % by volume
hexane in the exhaust gas from the second scrubber. Tempera-
tures, pressures, and concentrations listed in Figure 1.1 are
based on measurements taken during the emission testing. A more
detailed study of process flows and conditions was conducted by
personnel from Research Triangle Institute during the testing
period. This data will be made available at a later date.
The efficiency
Sampling points are indicated on Figure 1.1 by numbers.
Sites 2, 9, and 1 were sampling points used in mineral oil
scrubber tests. Sites 3 and 4 are the test sites for the dryer
and cooler air. These sites are more clearly diagramed in Figure
1.2.
Meal samples were obtained at sites 5, 6, and 7.
19
I

. . W L
x I - uz W -
20
1 b I I b 1 1 1
- I- 1 I I I 1 I' I, I I' I

I I E I I t
r - c /'..., :
I
W z 0 -I V > V
w c7 n: < V CJY H Q
C w 4 0 0 V Q z 4 n: w % n: Q
4 4 2 I
N
rl
a, LI

i 1 1 1
I V . SAMPLING AND ANALYTICAL PROCEDURES I Figure 1 . 2 shows t h e sampling s i t e s used on t h e dryer and
1 I I I
cooler vents . A i r flow a t both of t h e s e s i tes was measured
according t o methods 1 and 2 of t h e Federal Regis te r . Each duct
i s 18 inches i n diameter and 24 t r a v e r s e po in t s were used a t each
s i te .
Flow through t h e mineral o i l scrubbers was measured with a
vane anometer, f i t t e d t i g h t l y over t h e end of t he four inch
I exhaust duc t . This method - was used because the re were no-. ~ 1-
sampling p o r t s l a r g e enough t o accomodate an S-type o r standard
type p i t o t tube.
was done through 1/4-inch pressure t a p s i n t h e duct work.
Sampling f o r hexane vapors i n the MOS system
Moisture i n t h e dryer and coo le r vents was measured with a
s i l i c a ge l tube and a c a l i b r a t e d personnel sampling pump.
Moisture i n t h e mineral o i l scrubber system was estimated a t t h e
s a t u r a t i o n l e v e l based on previously obtained process da t a .
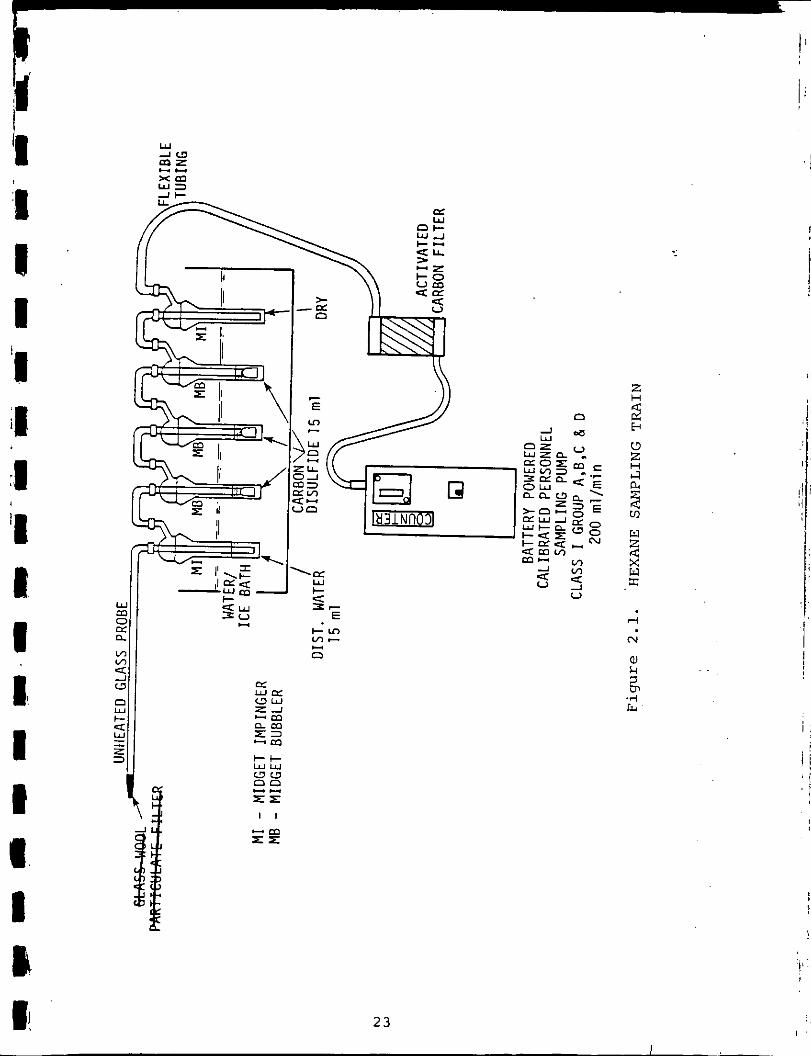
The midget impinger hexane sampling t r a i n used by personnel
from PEDCo Environmental, Inc. i s shown i n Figure 2 . 1 . Two
changes were made i n t h i s procedure t o accomodate t h e t e s t i n g
condi t ions . F i r s t d i s t i l l e d water was not added t o the f irst
impinger. This was done t o prevent t h e sampling t r a i n from
22
1 i I
c c
2 3
N
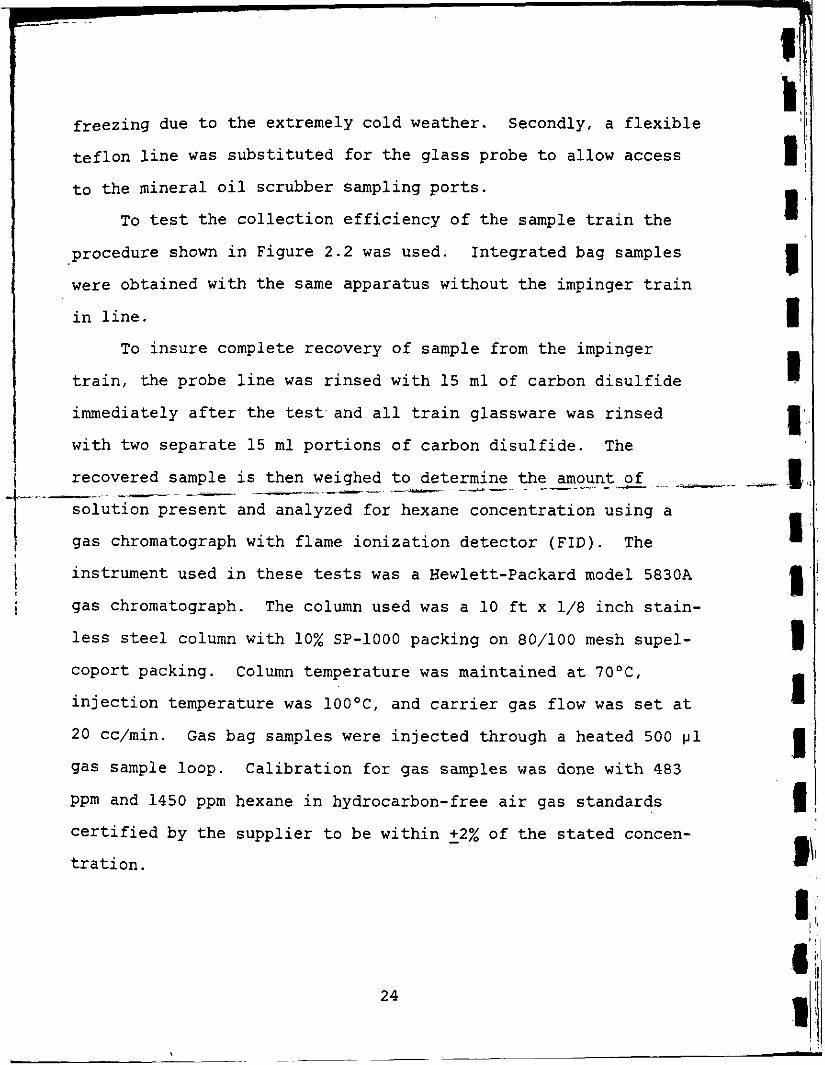
f reez ing due t o t h e extremely cold weather. Secondly, a f l e x i b l e
t e f l o n l i n e was s u b s t i t u t e d f o r t h e g l a s s probe t o allow access
t o t he mineral o i l scrubber sampling p o r t s ,
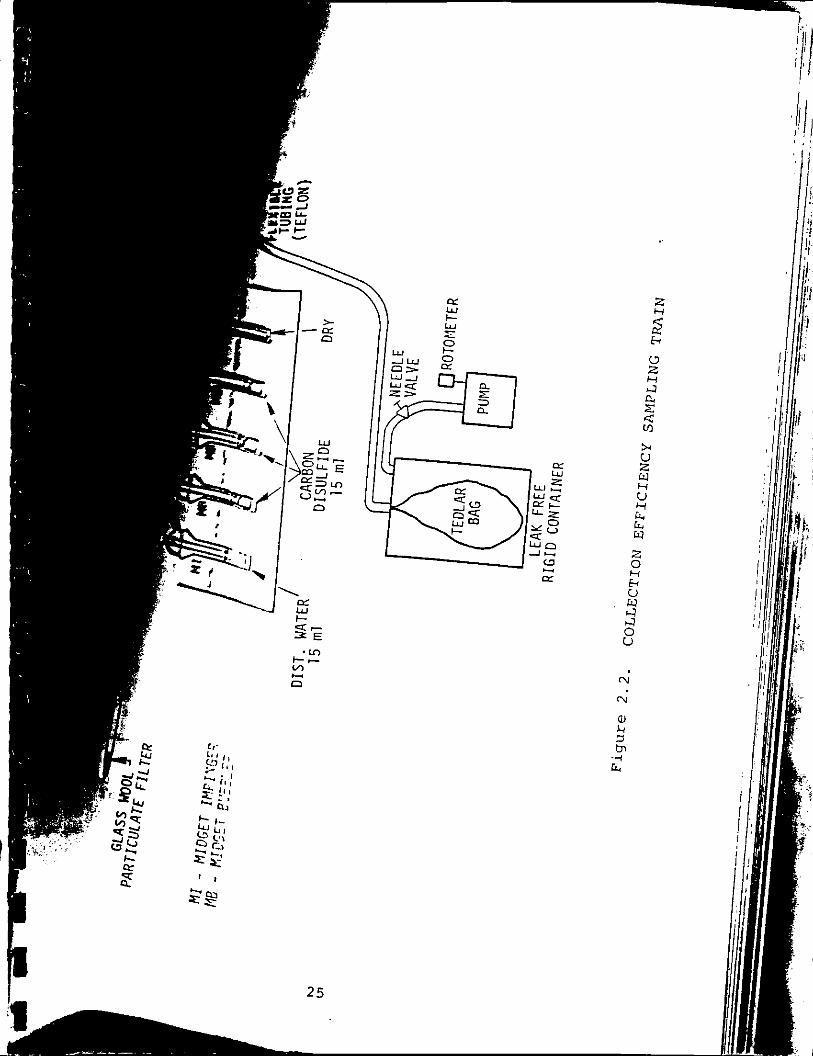
To t es t t h e c o l l e c t i o n e f f i c i e n c y of t h e sample t r a i n t h e
procedure shown i n Figure 2 . 2 was used.
were obtained with the same apparatus without t h e impinger t r a i n
i n l i n e .
In tegra ted bag samples
To i n s u r e complete recovery of sample from t h e impinger
t r a i n , t he probe l i n e was r insed with 15 m l of carbon d i s u l f i d e
immediately a f t e r t he t e s t and a l l t r a i n glassware was r in sed
with two sepa ra t e 15 m l por t ions of carbon d i s u l f i d e . The
s o l u t i o n p resen t and analyzed f o r hexane concentrat ion using a
gas chromatograph with flame i o n i z a t i o n d e t e c t o r ( F I D ) . The
instrument used i n these t e s t s was a Hewlett-Packard model 5830A
i gas chromatograph. The column used was a 1 0 f t x 1/8 inch s t a i n -
1 I I
less s t e e l column with 10% SP-1000 packing on 80/100 mesh supel-
coport packing.
i n j e c t i o n temperature was 100°C, and c a r r i e r gas flow was s e t a t
20 cc/min.
gas sample loop.
Ppm and 1450 ppm hexane i n hydrocarbon-free a i r gas s tandards
Column temperature was maintained a t 7OoC,
Gas bag samples were i n j e c t e d through a heated 500 wl
Cal ib ra t ion fo r gas samples was done with 483
cer t i f ied by t h e supp l i e r t o be wi th in - +2% of t h e s t a t e d concen-
t r a t i o n .
24
25
V w 4 4 0 u
l-4
' I Ill.
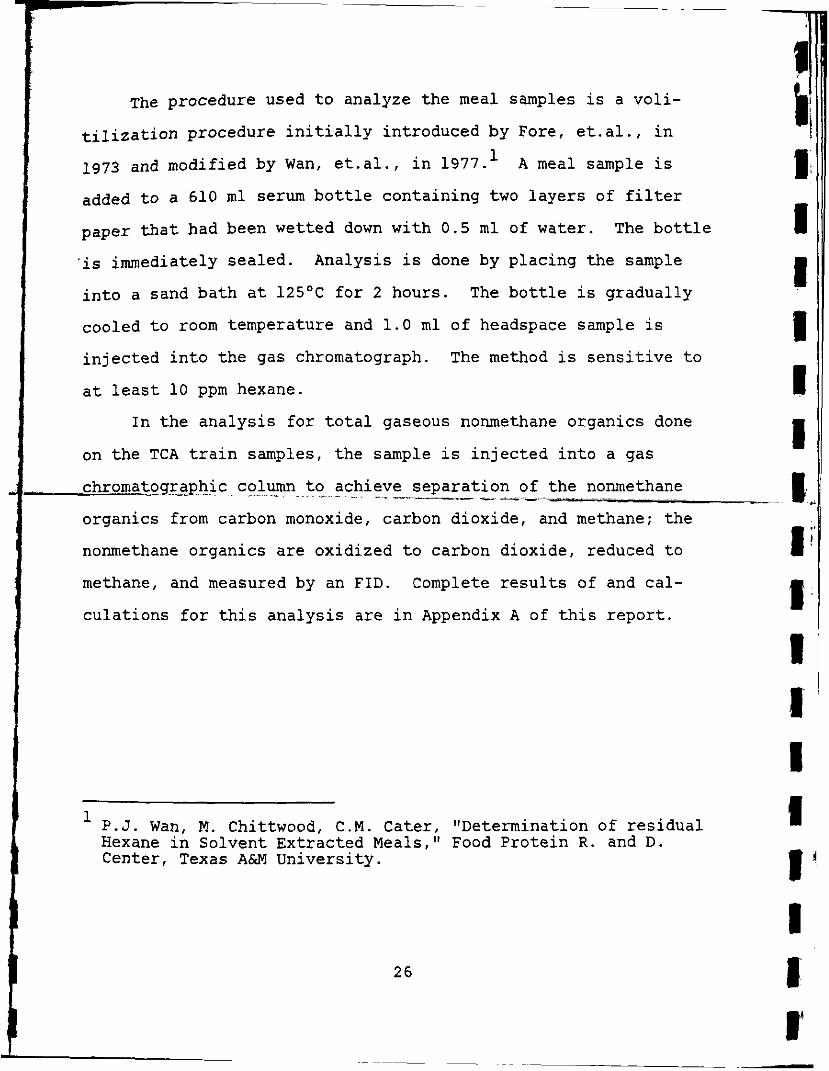
The procedure used t o analyze t h e meal Samples i s a vo l i -
t i l i z a t i o n procedure i n i t i a l l y introduced by Fore, e t . a l . , i n
1973 and modified by Wan, e t . a l . , i n 1977.l A meal sample i s
added t o a 610 m l serum b o t t l e containing t w o l a y e r s of f i l t e r
paper t h a t had been wetted down with 0 .5 m l o f water.
' is immediately sea led . Analysis is done by p lac ing the sample
i n t o a sand ba th a t 125'C f o r 2 hours. The b o t t l e i s gradual ly
cooled t o room temperature and 1 . 0 m l of headspace sample i s
i n j e c t e d i n t o t h e gas chromatograph.
a t l e a s t 1 0 ppm hexane.
The b o t t l e
The method i s s e n s i t i v e t o
In t h e ana lys i s f o r t o t a l gaseous nonmethane organics done
on t h e TCA t r a i n samples, t he sample i s i n j e c t e d i n t o a gas
chromatogy_phic column t o achieve sepa ra t ion of t h e nonmethane
organics from carbon monoxide, carbon dioxide, and methane; t he
nonmethane organics a r e oxidized t o carbon dioxide, reduced t o
methane, and measured by an FID. Complete r e s u l t s of and ca l -
cu la t ions f o r t h i s ana lys i s a r e i n Appendix A of t h i s r e p o r t .
- - I - -_ -____-
T 1 1 I
P. J. Wan, M. Chittwood, C . M . Cater, IIDetermination of r e s idua l I Hexane i n Solvent Extracted Meals," Food P ro te in R. and D . Center, Texas A&M Universi ty .
2 6

I I I I I 1 I I' d 1E I I I 1 4
' I 1 S 1
APPENDIX A
ANALYTICAL DATA

I I IE I I I I I I 1 E I I
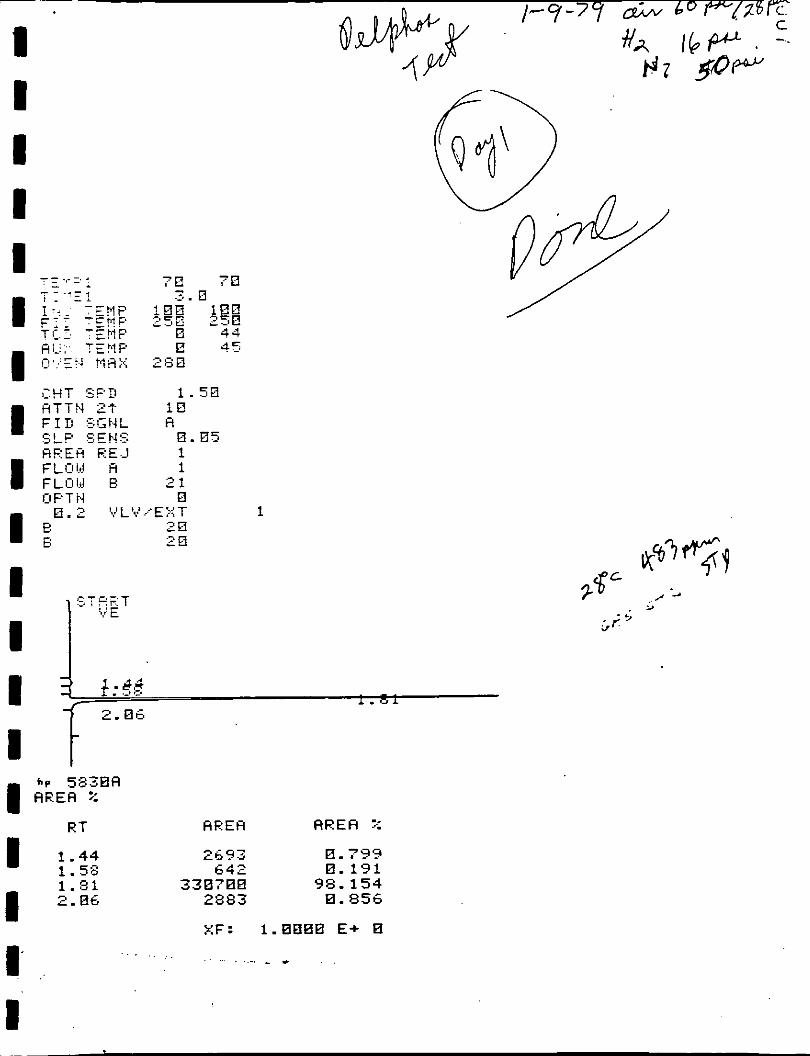
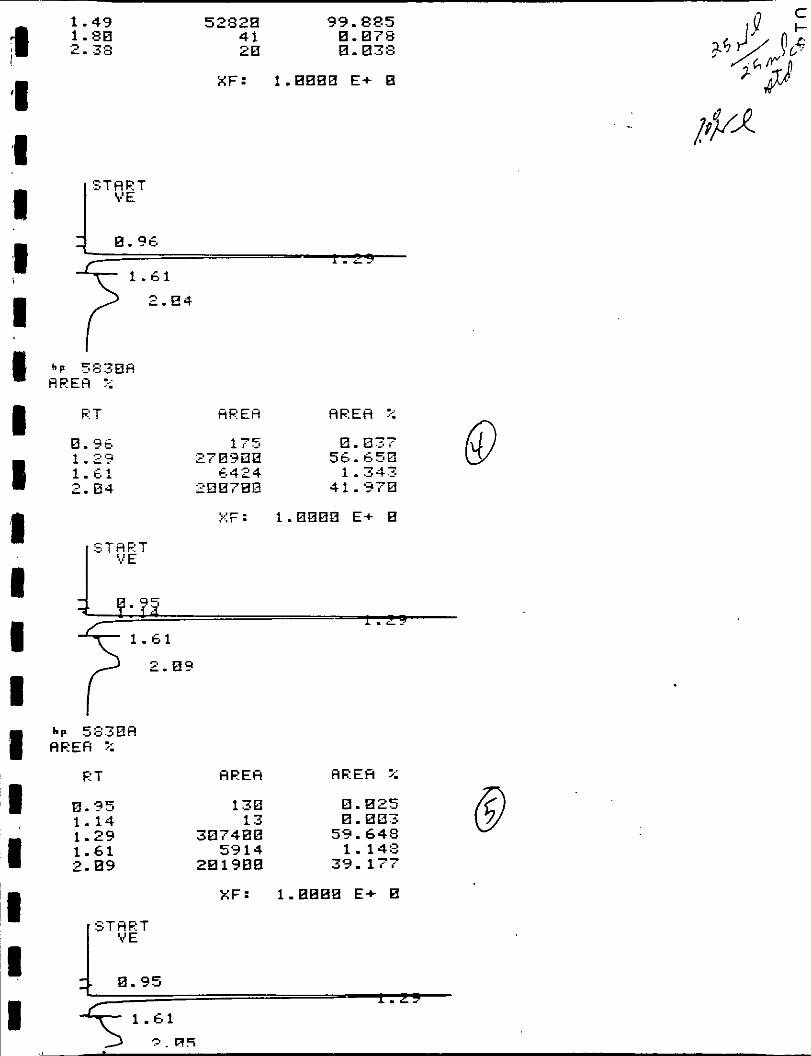
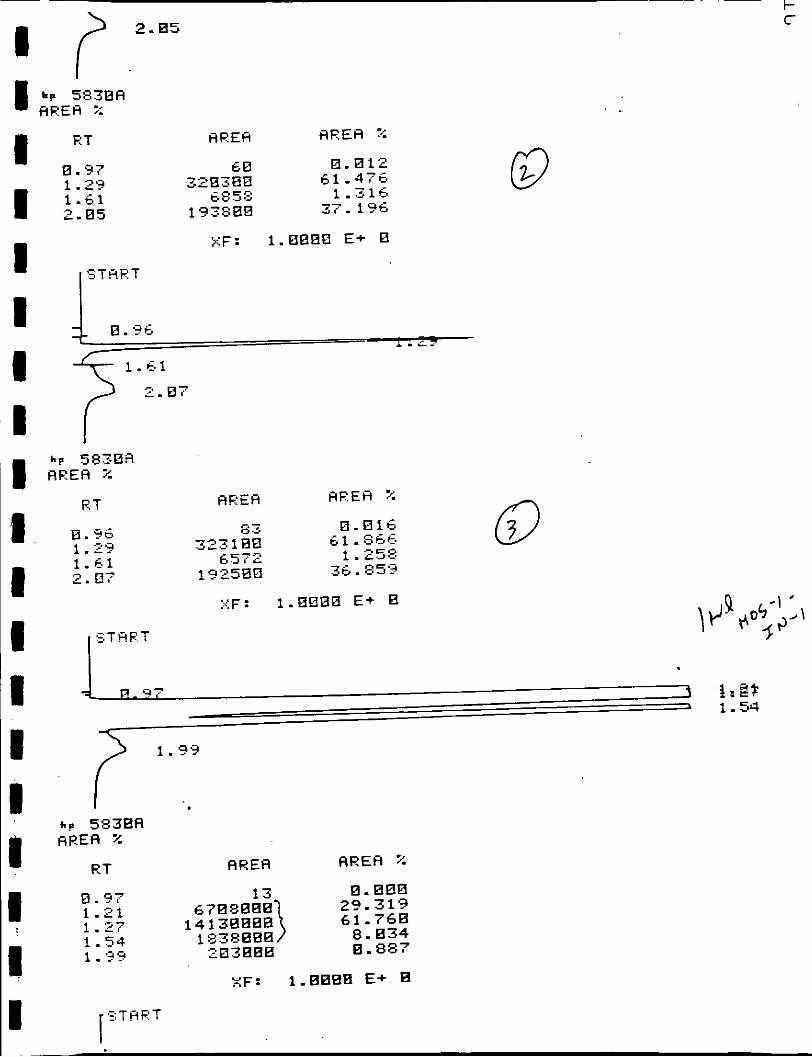
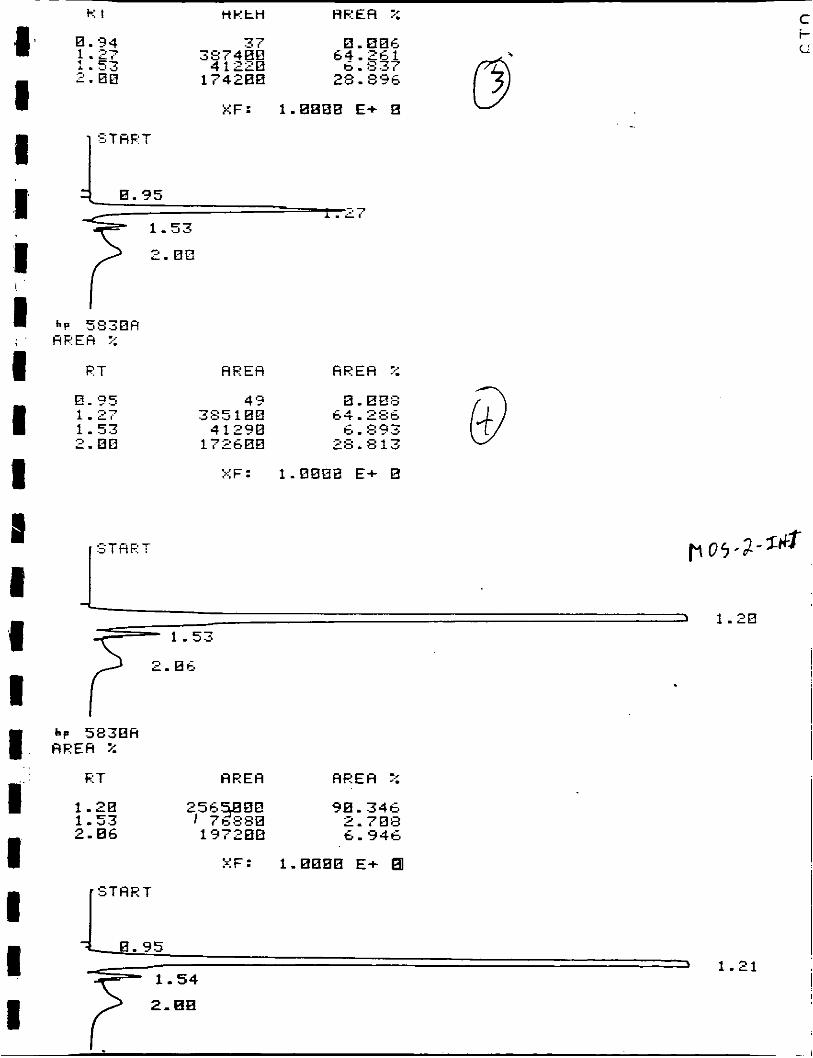
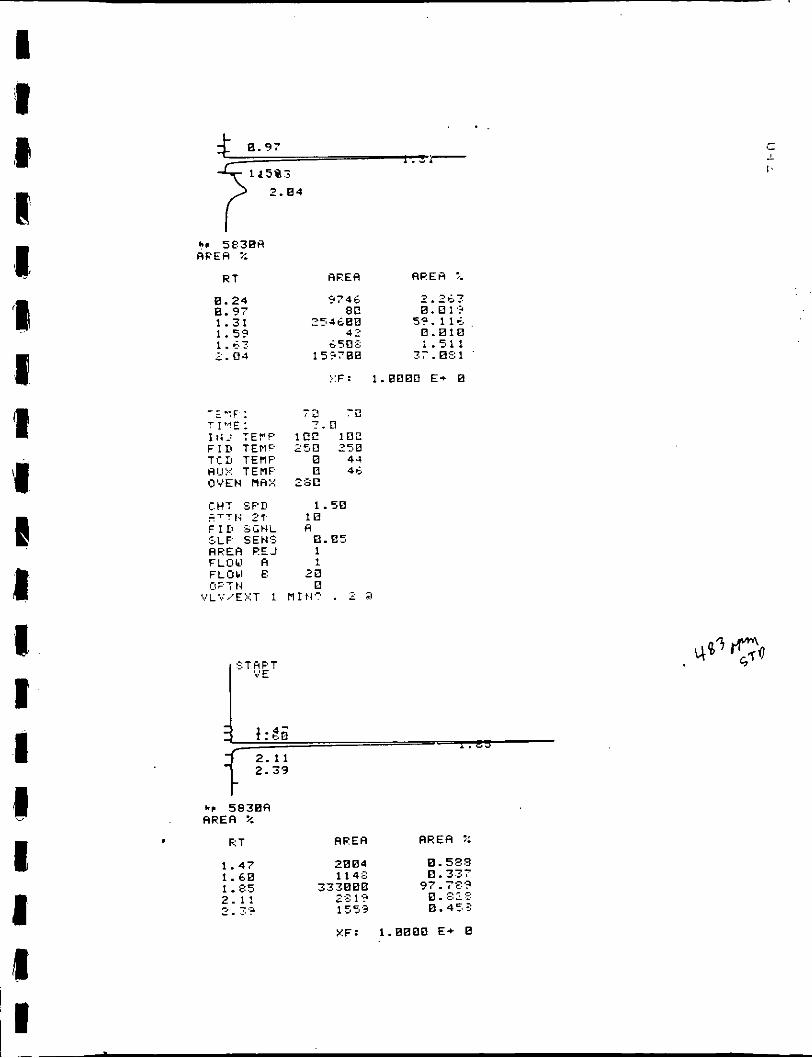
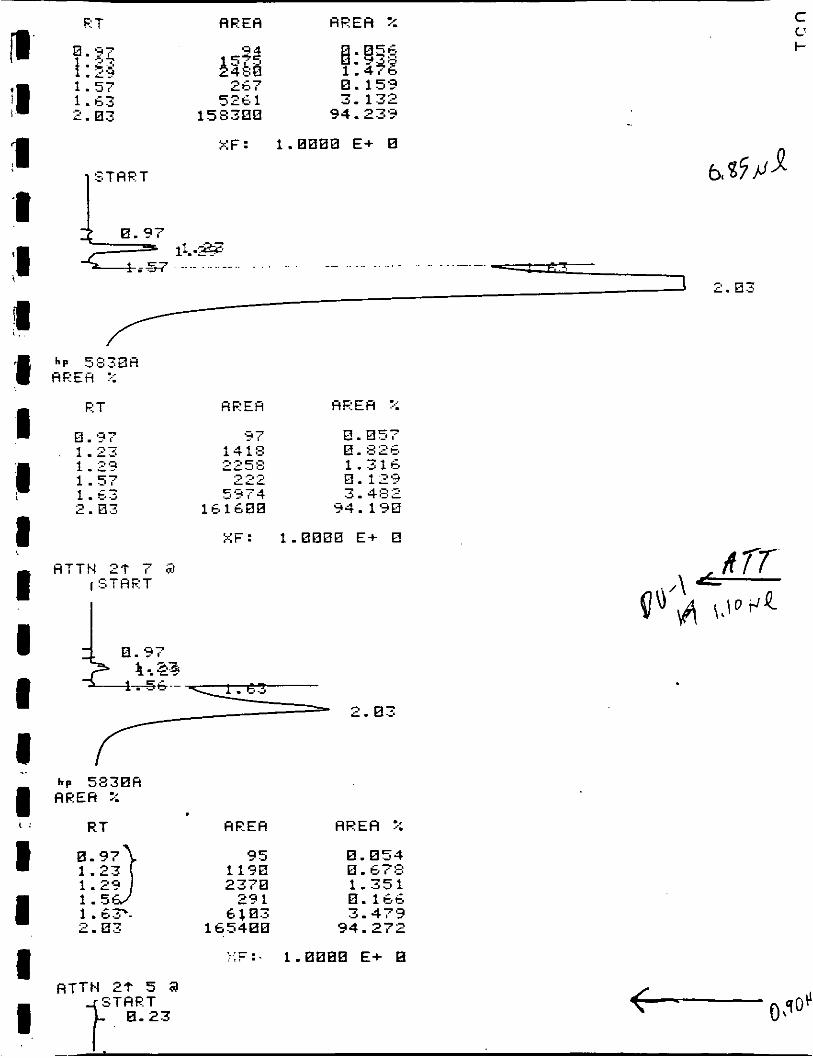
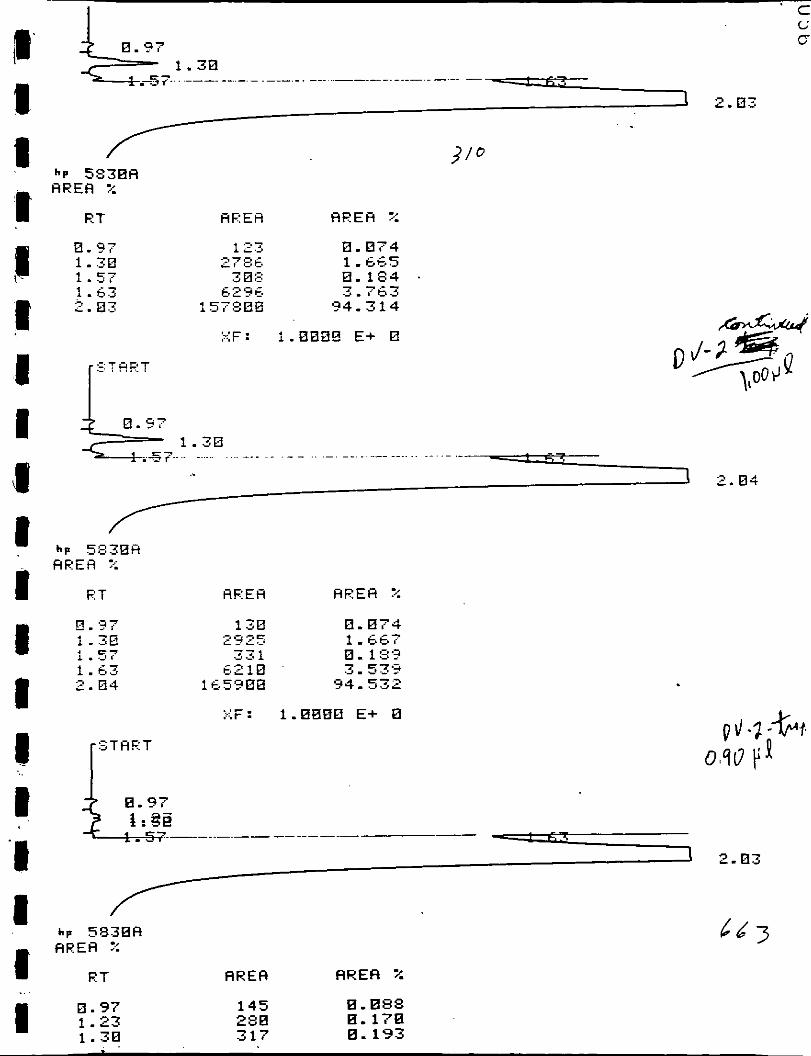
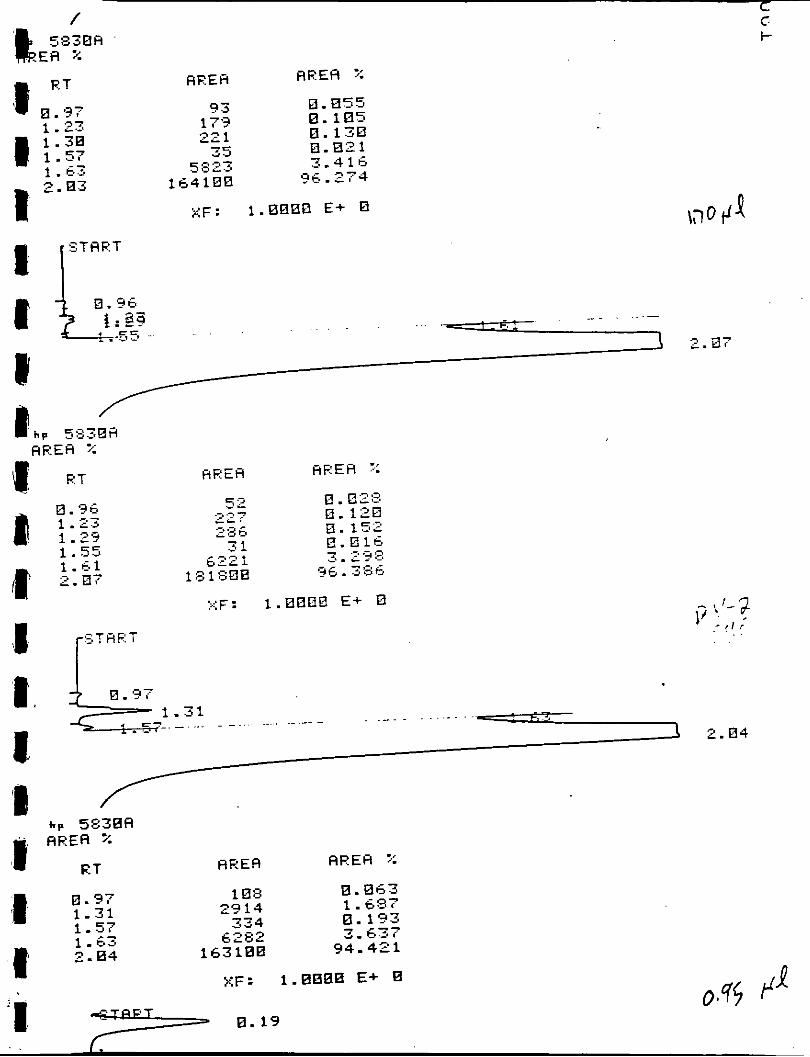
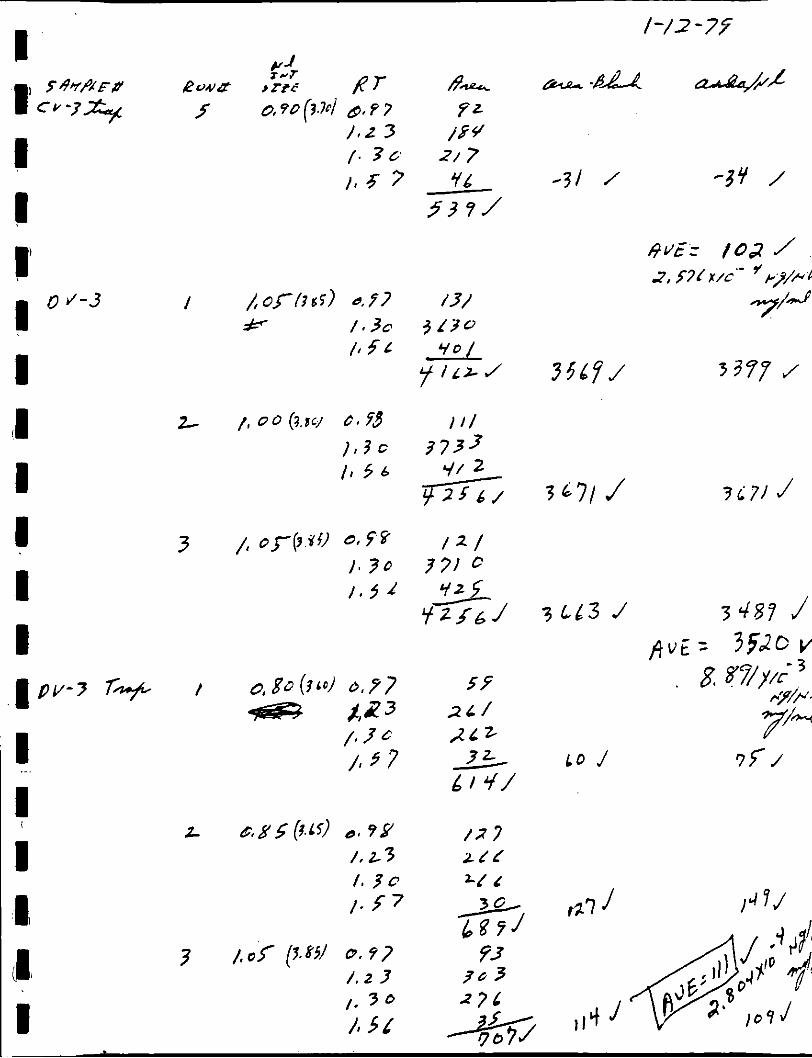
1. GAS CHROMATOGRAPH P R I N T O U T S - ON S I T E A N A L Y S I S
CS2 M I D G E T BUBBLER TRAIN

483 ppm
Run No.
1
2
3
4
5
VEGETABLE OIL DELPHOS / / 9 / 7 9
STD n-hexane Press 29.56 in Hg temp = 28OC
R.T. Area
1.81 330,700
1.81 320,500
1.80 331,600
1.81 333,000
334,700 1,650,500 AVE = 330,100
1.81
592 ppm in trap bag
54.2 ppm in trap bag
21.1 ppm in trap bag
- Area - MOS-~-IN-~ AVE = 404,935
MOS-2-IN-1 37,056
MOS-2-OUT-1 14,410
- - - -
u m
ug 2.12 mg hexane
1 at 2OoC 760 mm Hg
592 ppm (u1/1) x 86.17 ug mole 1 mg = 1000 ug 24.055 u1
pg mole
lJ9 0.194 mg hexane 1 mg =
1 at 2OoC 760 mm Hg
54.2 p W x 86.17 ug mole 24.055 p 1 1000 ug
pg mole
u9 = 0.0756 mg/l at 20°C l m 21.1 ul/l x 86.17 ug mole
24.055 u 1 760 mm Hg pq mole

Sample No.
MC:S-~-IN-~
MOS-I-IN-1
MOS-1-IN-1 MOS-1-111-1
MOS-~-IN-~ MOS-~-IN-~ MOS-1-IN-1 MOS-1-IN-1
MOS-2-IN-1 MOS-2-IN-1 MOS-2-IN-1 MOS- 2 -IN- 1 MOS-2-IN-1
MOS-2-IN-1 MOS- 2- IN- 1 MOS-2-IN-1 MOS-2-IN-1 MOS-2-IN-1
MOS- 2-OUT- 1 MOS-2-OUT-1 MOS-2-OUT-1 MOS-2-OUT-1 MOS-2-OUT-1
TRAP BAGS
Run No. R.T.
1 1.49 1 1.73 1 1.90 1 2.06
TOTAL
2 1.50 2 1.73 2 1.91 2 2.06
TOTAL
1 1.49 1 1.66 1 1.73 1 1.90 1 2.06
TOTAL
1.49 1.66 1.73 1.90 2.06
TOTAL
1 1.50 1 1.62 1 1.73 1 1.91 1 2.07
TOTAL
?ired
1,366 367,400 11,240 3,580 _-
- r 0 403,586 ppm= > j
1,338 390,000 11,310 3,636 -
1,327 8,894 26,140
621 114
37, 096 ppm = 5 Y L
1,251 8,828 26,180
64 1 116
37,016 ppm = Sif I
1,661 5,852 7,156
157 39
14,865 ppm = > 1.7

Sample No. Run No. R.T.
MOS-2-OUT-1 2 1.50 MOS -2 -OUT- 1 2 1.62 MOS-2-OUT-1 2 1.73 MOS -2-OUT-1 2 1.91
TOTAL
MOS-2-OUT-1 MOS - 2 -OUT- 1 MOS-2-OUT-1 MOS -2 -OUT- 1
3 1.50 3 1.62 3 1.73 3 1.91
TOTAL
Area
1,690 5,830 6,626
133
14,279 ppm = 2 i f . 4
1,678 5,799 6,478
131
14,086 ppm = 2.C. 6
I I I 1 I I I I I I I I I I I 1 I I I

I I I I I I I I I I I I I I I I I II I
-
L I Q U I D STD 251.11 n-hexane/24.42 ml CS2 0.676 (3)
1.11 Run No. R.T. inj. size ug
1 1.29 1.00 0.676 2 1.29 1.00 0.676 3 1.29 1.00 0.676
4 1.29 1.00 0.676 5 1.29 1.00 0.676 6 1.29 1.00 0.676 7 1.29 1.00 0.676
6 9 10
1.29 1.00 1.29 1.00 1.29 1.00
0.676 0.676 0.676
w/area Area Unit
322,400 320,300 323,100
965,800
270,900 307,400 294,100 264,800
2,123,000
266,700 266,400 243,200
2,699,300
289,930 2,3316 x
~~
I I I I I I I I I I I I I I I I I I I
Area !J1
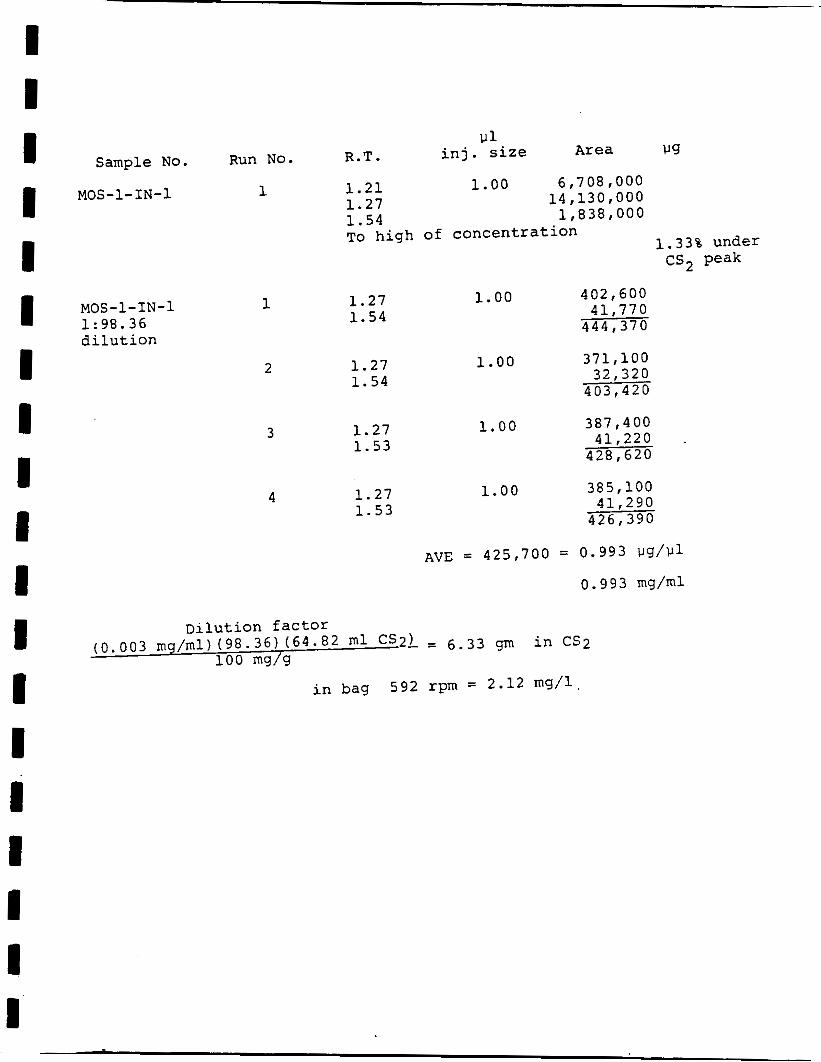
R.T. inj. size Sample No. Run No. 1 1.21 1.00 6,708,000
14,130,000 1.27 1.54 1,838,000 T~ high of concentration
M O S - ~ - I N - ~
MOS-I-IN-~ 1:98.36 dilution
1
2
1.27 1.54
1.27 1.54
3 1.27 1.53
4 1.27 1.53
1.00 402,600 41,770 444,370
1.00 371,100 32,320
403,420
ug
1.33% under cs2 peak
1.00 387,400
428,620 41,220 .
1.00 385,100 41,290 426,390
A"E = 425,700 = 0.993 114/lJ1
0.993 mg/ml
in bag 592 rpm = 2.12 mg/l

I I I I I I I I 1 I I I I I I I I I I
1.00 1,944 t 000 58,370
2,002 I 370 2 1.21
1.54
3 1.21 1.54
1.00 2,043,000 61,980
2,104,980
AVE = 2,012,463 4.692 lJg/lJl 4,692 mg/ml
MOS-2-OUT-1 1 1.21 1.54
2 1.21 1.54
3 1.21
1.00 605,200 1.00 40,330
645,530
1.00 673,000 51,340
724,340
1.00 625,400 42,260 667,660
I I
1
2693 0.799 642 0.191
1 1.44 1.58 1-81 330708 48.154
2883 E. 856
XF: 1.0BB0 E+ E I 2-06
_ c . . . . . ~
. .

'I I I I I I I I I I 1 I I I I I I I
1.4: ..
2. 86 Y l
L P 5838A RREFI %
RPEa R P E H 2 R T 154 8 .848
0 - 8 3 9 125 - z 99.868 2. - 8588
_ . I >-7- _ I s 8 .846
1.18 1.47 1 . 8 1 3.86
XF: : .BE80 E+ 8
I."
XF: 1.8888 E+ €3
*s 583Bfl riCEa 7.
RRER RREA Z P T 1327 1.865
1.49 8894 7.157 28.97'5 1 . 6 6 26 140
8 .49s 8.851
621 1 .73 1 . '38
114 2.06;J 25550 28 .581
49.733 2 . 3 4 1 . 4 1 . 61988
XF: 1.8888 E+ E

1 'I 1 1 :I I I I I I I 1 I I I I I I I
t
3.15 l88E 8 . 7?5 1 . 4 9 1251 8.987 1 .&e Fj ::. > - :. .? 6.364 1-73 26 180 28.651 1.98 6 3 1 0 . 5 0 5 , 2 . 0 6 I 1 E. 0.b?2
21.179 2 . 3 4 i D _I L
2.41 <,198O 48.327 -. .os-
i r : 1.8880 E + 8 . .
:XF: 1.8888 E + 8
R T T N 2t 1 C .3
, T i F . T ESCHF'E
i! E
P T RPER AREA 2
1 .50 1738 8.269 1. 7 3 J?RBEO 78.324 1.91 1 L??! 2 .271 2 . 0 6 &U< 8.738
2 . 4 2 C,.JC88 12.998 2 - 7 2 26.973- 5 . 4 1 6
li E . - 1.8888 E + E

-1 I I :
S T 5 F T Y E
A R E A AREA z
1661 1.533 5.423 6.632 0.145 0 . "36

I I I I I I 1 I I I I I I I
J .4 '1 -. c
JTdZT E. 83
24.851 61.354
h
W
I - -42

;1 1 I I I I I n I 1 I I I I I 1 I I I
-
1.50 1954 1.748 1.62 6038 5.402 1 . 7 3 6371, 5.700 1 . 9 1 1 1 6 E. 184
23.414 3 .33 r e . 1 7 0 6 C d i i .z. E 53.247 2 4 .:. .-, .-
- i
* &#W
XF: 1.8808 €+ E
- - . j .. ., 2. -rL
A R E A A I? E H X
3417
XF: 1.0088 €+ 8
AREA
47 . C
AREA %
8 .814 n nn4
1.49 52828 99.885 1.88 41 0.078 2. J 8 28 E. E38
X F : 1.8888 E+ 0
11 c
+ 1.61
ET
0.95 1.14 1.29 1.61 2.89
H R E H HREH X
130 0 . 8 2 5 13 0. E03
5E7480 59.648 5914 1.148
28 1900 39.177
X F : 1.8880 E+ 8

1 I t I I I I I I 1 I I I I I I I 1 I
I ET
0.95 1-29 1.61 2.85
A R E A a i x H x 45 8. 809
294 108 53.988 .1.190
191888 3:3.901
X F : 1.0088 E+ 8
c .-. a043
0.89 R . 9 &
247: -- i .f
DELETE T I R E TBL S T A R T
1.61 7 2 - 0 1 b? 5830A
AREA X
R T
0.96 1.15 1.29 1.61 2.01
A R E H AREA ::
113 8. 823 12 8.802
322408 61.866 6294 1.28:3
192Z88 36.981
XF: 1.0880 E+ 0
START
e . 97
G
0-
c
I I I 1 I I I 1 I 1 I C I I I 1 I
ET
0.97 1.2'3 1.61 2.05 143808
STRE7
x ~ : 1.0000 E+
I START
1-29 2 I RT m z a A R E A %
8.000 29.319 61.760 8.034 0.887
6709000 1 4 130008 1438000
8.97 1.21 1 - 2 7 1.54 1 - 9 5 203080
I ~ T A E T

I 1 I I I 1 I I 1 I l I I I I I 1 1- I
b p 5830A AREH %
R T A R E A
0.95 9 1.27 ~a-100ER 1.55 3082080 1.84 82188 1.97 38 1 9e 2.08 183088
7 = 3
AREH %
0.80'8 91.4 1:s
X F : 1.8880 E+ B

I 1 1 I
_. I- C:
i
1.83 7 4 5 6 B 8.185 1.97 137288 8.341
XF: 1.8088 E+ 0
STHET
0.95 1.27 1-54
2-83
2.78
,RE E T%
I I I
STHRT
f ' 0 . 9 4 k=-- . c i
K l
t
H K t H HKEA ::
XF: 1.0080 E+ E
0. 35 1 27 1.53 2 . a8
I XF: 1.0888 E+ 8
R T
1.20 1.53 2.86
1 I
A R E A H R E A :-:
X F : 1.0808 E+

0.95 1-21 1.54 2.00
I I
113
57040 176508
1,s 7 3.8 00 0.085
2.788 E.378
88 . 989
:XF: 1.8088 E+ 0
L 0 . 9 5 I I 1-21
I. R T
I 1
! ET AREA A R E A z 0.95 48 8.88'
I 1 . 5 4 c 1 988 2.718 2. BE 175388 7.687
XF: 1.0080 E+ 8
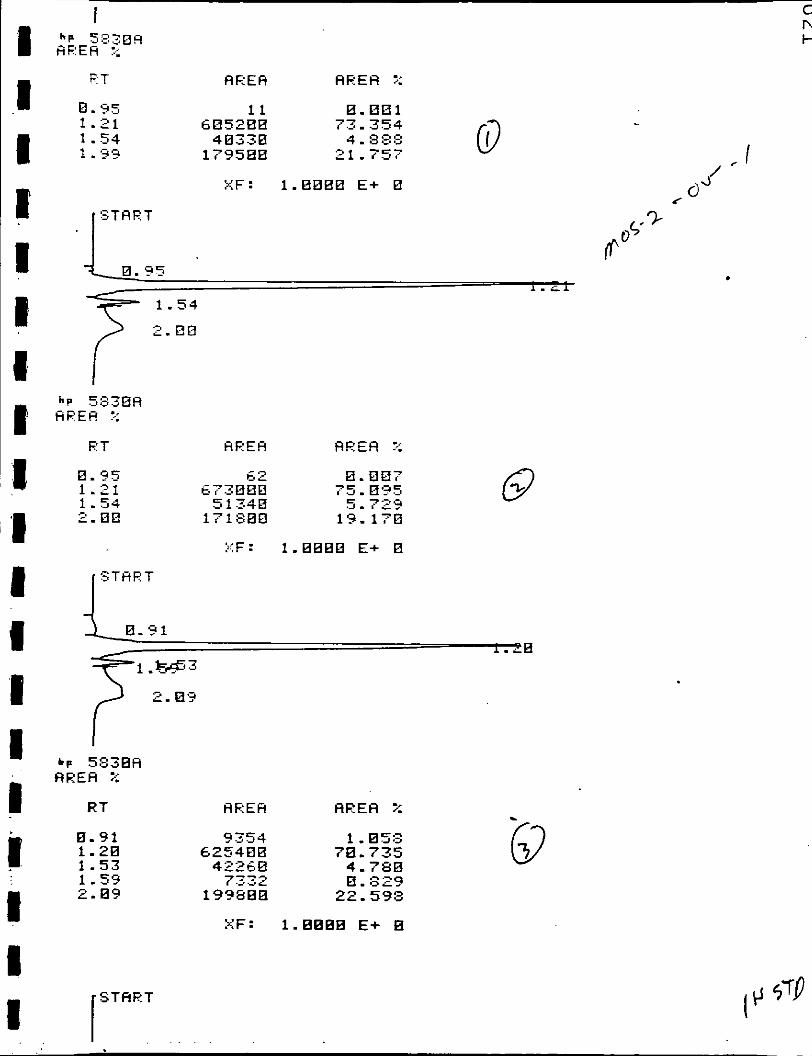
1.21 2847800 59.593
1 S T A R T
C
C r
A
I I 1.54
1 .99 . .- I .
I
CT AREA AREA ?:
.95 1 1 8.881
.21 685200 73.354
. 5 4 40330 4 88:s . ?9 179580 21 -757
XF: 1.8800 E+ 0
START I
R T AREA ARER r.: 0.95 6 2 0.887 1-21 673008 75.0'35 1.54 5 1340 d. I -7 2.88 171808 13.178
c 7 '1. -
START J
R T
8.91 1.20 1.53 1.59 2.04
START I
AREA AREA %
9354 1.058 625400 78.735
C n I-
c / /
/ d3
.
XF: 1.8808 E+ B

XF: 1.0088 E+ 0
RT 1 0.21
1.3- 1.47
I AREA A R E A 7:
XF: 1.0000 E+ E
1 R T
1-99
I
AREA A R E A x
48 0.011 243200 57. 898
6602 1.572 170300 40.519
X F : 1.0000 E+

I I I I
I 4 .I I I 4 I I I I I I I C
CENTRAL SOYA - DELPHOS f /,.0/74
lJg Liquid Std. - 25 ~1 hexane/24.42 ml CS2 - 0.676 - lJ1
Concentration, ml Area - lJg w/ml injected R.T. unit AU
0.676 0.8 0.29 210,700 2.57 x 101; 0.676 1.0 1.30 253,900 2.66 x 0.676 1.0 1.29 243,700 2.77 x 0.676 0.85 1.30 218,700 2.63 x 10
-6 lf4 Avg . 2.66 x 10 AU
Sample - MOS-I-IN-2 !J1 Area Concentration
injected unit lJq/lJl
1-00 73,324 0.195
0.90 70,778 0.209
1.00 65,464 0.174
0.90 71,494 0.211
1.00 71,554 0.190
Avg
100.85 ml CS2
m4 19.58 ml x 100.85 r n l CS2 =
gm lo3 %
Dilution Actual - lJg Factor Concentration u l
lJ9 z 2
1:lOO 19.5
: l o o 20.9
17.4
21.1
19.0 lJ9 19.58 - lJ1
19.58
lJ9
lJ9 iiii
975 gm hexane

I I I 1 I 1 I I I 1 I I I 1 I I I I I
Sample MOS-2-IN-2
Concen- l J 1 Area tration Dilution Actual El
injected unit !Jg/lJI factor concentration, p 1
1.00 1,107,004 2.945 1:l 2.945 1.00 1,067,812 2,840 1:l 2.840
Avg . 2.893 - lJg l J 1
ml CS2 soln. 109.00 ml = 2.893 m4 ml
0.315 gm hexane collected
Sample MOS-2-OUT-2
Concen- Actual lJ1 Area tration Dilution concentration,
injected unit lJg/lJl factor lJg/!J1
0.8 253,660 0.843 1:l 0.843 0.9 250,604 0.741 1:l 0.741 0.9 248,005 0.733 1:l 0.733 1.0 255,730 0.680 1:l 0.680
Avg . 0.749
106.43 ml CS2 soln. 0.080 gm hexane collected
Sample MOS-1-IN-3
concen- Actual l J 1 Area tration Dilution concentration,
injected unit lJg/lJ1 factor vg/lJl
0.90 42,064 0.1243 1:lOO 12.43 0.90 52,966 0.1565 1:lOO 15.65 1.05 55,553 0.1407 1: 100 14.07
Avg . 14.05 3 100.13 ml CS2 soh.
1.407 gm hexane collected
14.05 2
I I I I I I I I I I I I I I I I' I I I
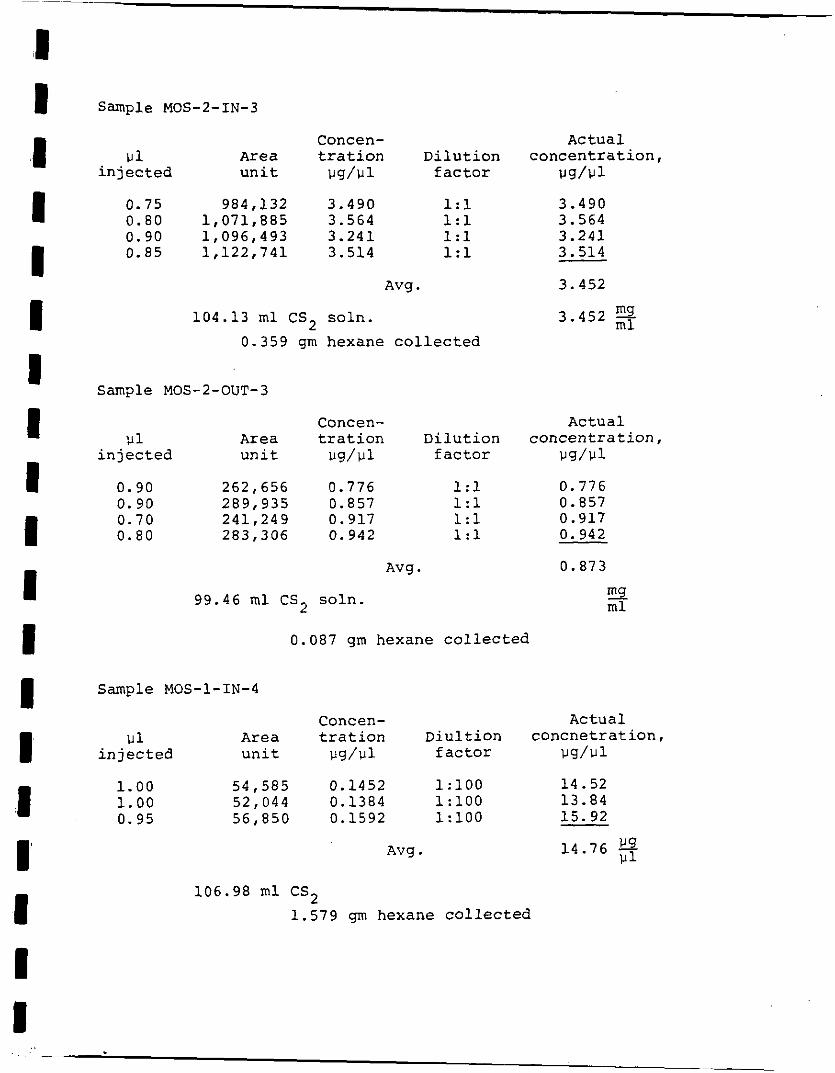
Sample MOS-2-IN-3
Concen- u1 Area tra t ion Di 1 ut ion
injected unit w/ul factor
0.75 984,132 3.490 1:l 0.80 1,071,885 3.564 1:l 0.90 1,096,493 3.241 1:l 0.85 1,122,741 3.514 1:l
AVg . 104.13 ml CS2 soh.
0.359 gm hexane collected
Actual concentration,
us/!Jl
3.490 3.564 3.241 3.514
3.452
3.452 3
Sample MOS-2-OUT-3
lJ1 injected
0.90 0.90 0.70 0.80
Concen- Actual Area tr at ion Dilution concentration, unit ug/ul factor W/lJ1
262,656 0.776 1:l 0.776 289,935 0.857 1:l 0.857 241,249 0.917 1:l 0.917 283,306 0.942 1:l 0.942
Avg . 0.873
99.46 ml CS2 soh. 3 ml
0.087 gm hexane collected
Sample MOS-1-IN-4
Concen- Actual U1 Area tration Diultion concnetration,
injected unit W/Ul factor ?Jg/ul
1.00 54,585 0.1452 1:lOO 14.52 1.00 52,044 0.1384 1:lOO 13.84 0.95 56,850 0.1592 1:lOO 15.92
AVg . 106.98 ml CS2
1.579 gm hexane collected
IJg 14.16 - ul

~-
I I I I I I I I I I I I I I I I I I i
Sample MOS-2-IN-4
Concen- Actual U1 Area tration Dilution Concentration,
injected unit W / U l factor !Jg/d
0.95 860,231 2.409 1:l 2.409 0.90 91 0,145 2.69 1:l 2.69 0.80 834,138 2.77 1:l 2.77 0.90 840,984 2.49 1:l 2.49
108.81 ml CS2 soln. Avq . 2.59
0.282 gm hexane collected 2.59 3
Sample MOS-2-OUT-4
Concen- Actual Area tration Dilution concentration, 1;l
injected unit VS/!Jl factor W / U l
0.80 178,178 0.592 1:1 0.592 0.85 192,734 0.513 1:l 0.513 0.90 194,4 04 0.575 1:l 0.575
AVg . 0.560 5 0.560 3 114.55 ml CS2 soln.
0.064 qm hexane collected
r

I I I
I I I

2 I I I
I I
I I I I I
~
2c3 3 r Y 5 3 5

I I I I I I I I I I I 'I I
~
I I I I I I
I-------
,. , . . . - . F I D SLNL SLF SEN5 a. 85 HEEA R E J 1 FLOW A 1 F L 111 id E 20 OFTN 0
TCD TEHF 0 4 3 ACIX TERF a 44
CHT SPD 1.58 ATTH 2?' 18
SLP SENS a. El5 HEEA REJ 1 FLOW 13 1 FLOU B 21 OFTN 0 E 21 E 19
OVEN MHX 280
FID SGNL A
STAET I 4 - 8 . 9 8
C n ci

r I I I <
I i
I I I 1 I I 1 1 I I
I I I
I
2.21 <
STHRT
E. 97 i - r 9
2 - 2 8 I A R E A AREFi 7:
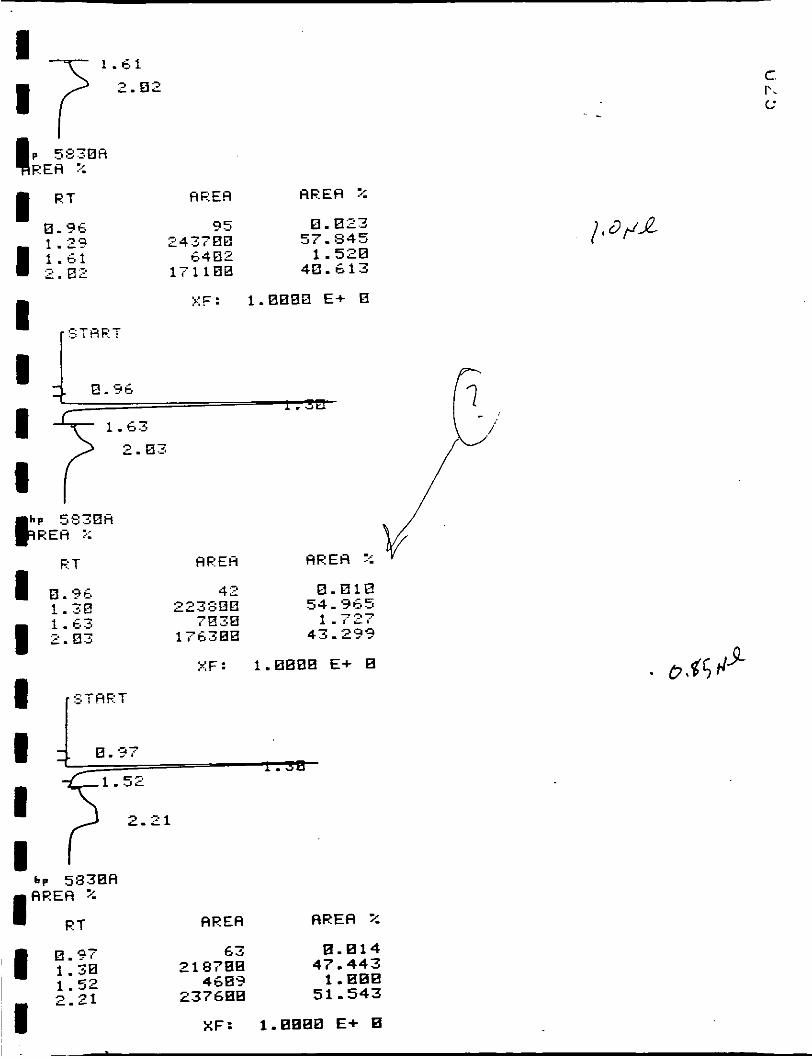
0.812 210708 41'. . 384 243500 53.604
XF: 1.0888 €+ E
rr d .-T
1 .63
2.03 T hp 5238A HEEH %
R T
0. 36 1-30 1.62 3 . 0 3
/ i'
f ' ,/ -
I
i
C
-I r
0.013 253900 58.882
7262 1.661 175S0D 40.239
7 ,q ( >
XF: 1.8088 E+ 0
' L v - 0.96
I L . b 3
C. P. c
AREA A R E A %
0.Q7 63 8 . 8 1 4
4689 1 .888 I I 1.38
51.543 1.52 2.21 237688
xF: 1.8080 E+ B
2 1 8788 47.443
I I
I I n I I 1 1 I
I
S T A R T I
* c 5838A AREA Z
R T AREA AREA 7.
X F : 1.008Q E + 0
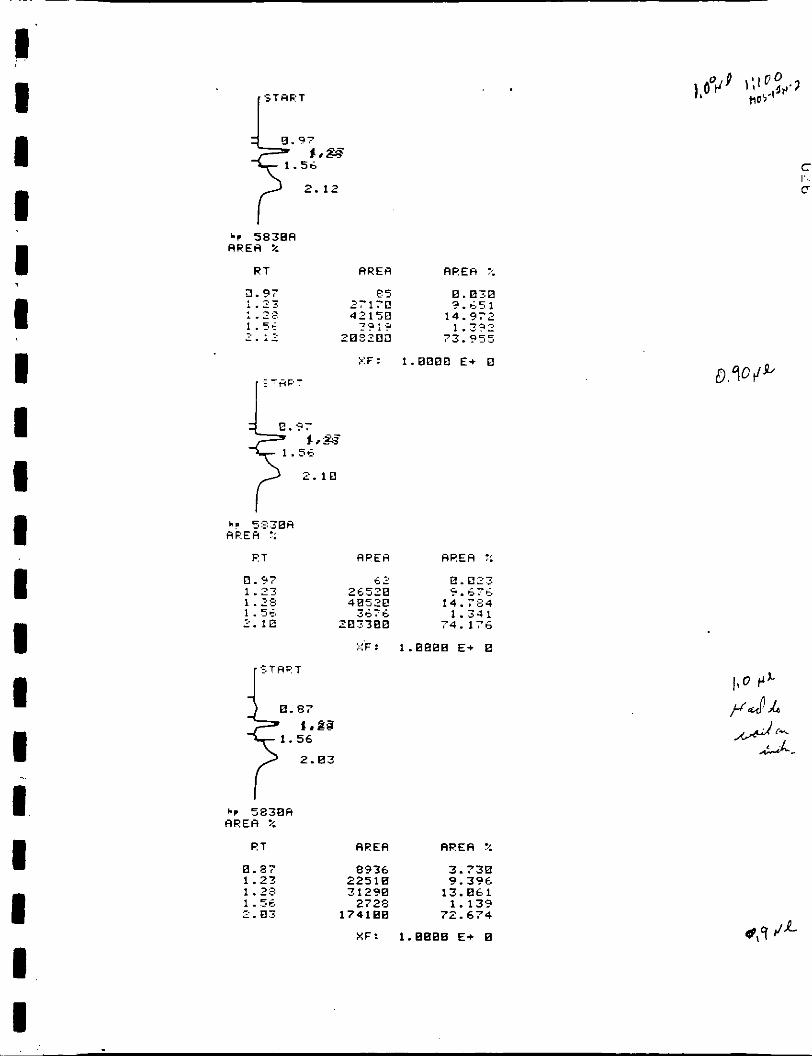
0 . 9 7 1.23 1.28 1.5.J 2.111
S T A F T 1 2 - 8 3 i
APEA R P E H T.
0 2 8 . Q 2 7 26528 9.676 48528 1 4 . 7 8 4
3670 1.341 287380 74.176
::F: 1.8888 E+ e
h. 5 8 3 8 A AREA %
E T
8. e: 1.23 1 . 2 2 1.56 2 . 8 3
AREA R P E R 2
8936 3.738 225 1 8 9.396 31298 13.061 2728 1.139
174188 72.674
XF: 1.8888 E+ E

h P 5 8 3 8 H
AEEH ARE H :-: I AREA
R T
A R E A A R E A %

, !START
0.821 54.871 4.311
40.797
90 2351a07 18478
174808
1.23 1.57
2.13
c-.
. . hp l b 3 8 A ApEa x

I I
I I
XF: 1.8800 E+ B
S T A E T I 1.23
2. 83
HEEH HEEH X
S T A R T
1.23
2. E3
A R E A AREA x 8.46 1.23 1.55 2.83
18B 2 3 E. 3 08 18658 174808
0 .042 55.025 4.332
40.601
X F : 1.0888 E+ 0
C n C'

~ ~
ET AREA AREA ::
0.33 18578 2 .463 8.95 68 a .016
1-62 6718 1.564 1.3B 239580 55.888
I 2.83 173388 48.143
C ' G C
>;F: 1.8880 E+ B I
RT HEEA H E E A 7-z
# I 1 1 I 1
1.15 19 0. BO4 1.30 25 890 8 58.035
1.244 1.62 .:. I I
2.03 175988 40.687 c-77
XF: 1.8080 E+
STRET I 1.23
2. B3 2
RT AREA AREA 2
I I I I I
a. 97 1.23
92 0.808 934888 EB. E42 ~ ~~~ ~~ ~ ~
1.38 19428 1 - 679 1.57 29828 2 .579 2 .83 172288 14.892
X F : 1.aB88 E+ B
I ST 4 8. 97 1.23
1.56
. . .:. 5 - 7 . . . . _ _ - _ . _ _ _ _ ~

I P 5S30A REH X
ET
8.97 1.23 1.56 1 2.83
AREA . AREA :<
135 8 .018
C c I-
- 3 rJ/
?f I
XF: 1.0008 E+ 8
I I I 1 I
RT A R E A AREH X
0.97 93 0 . En7 1.23 1063008 83.538
2 . 0 5 176100 13.838 1.57 33400 3.625
XF: 1.0008 E+ 8
STHET I 1.13
2.04 > AREA A R E A 2
a. 97 81 0 . a ~ ~ 1888000 83.812
34668 2.670 1 1.23
1.57 2.84 175400 13.512 - I xF: 1.0808 E+ ' I START
Q.4b@ I

I I I I I m I I 1 I I I il I I I c 1 I
1.31
2.84
R T RRER RREA Z
0.97 121 E.E57 1.23 15780 7.37: 1.29 239 1 8 11.175 1.57 22sz 1. 853 2.04 171988 80.341
SF: 1.8808 E + 8
S T H Y T
0 .7 '3
1,8? 1.57
2.17 < h, 5438A AREA Z
R T AYEA AREA :<
8.79 93qi. 3.522 1 - 2 3 14968 5.68% 1 -39 26158 9.803 1-57 2468 8.922 2.17 213888 BE. 145
XF: 1.08E0 E+ 8
S T H Y T I
bv 5838R A R E A Z
R T ARER R R E R Z
E. 97 1.23 1.29 1.57 1.63 2. E5
61
29488 2756 5456
178388
1 7 8 ~ 8.827 7.881
13.853 1.228 2.416
75.483
XF: 1.0808 E* E

I 0 I I I 1 I I I I I I 1 I 1 I c 1 I
\
5. I t IFT
. .
2.84 < b n 5838R HPER X
R T AREA RRER Z
8.97 127 0.083 1.23 1358888 35 .631
1.5: 234i80 6. I S 2 1 . Z'? 2036888 53 .737
2 . 8 4 168188 4 .437
XF: 1.0088 E + E
E. T a F: T c
ARER RRER Z
E . ? ; 15: 8 .884 1.23 1487808 34 .786 1.28 2358888 55.162 1.56 265388 6.286 2.84 164288 3 .841
X F : 1.088E E+ E
S T R R l 1
. I 2-84 b? 5838R RRER %
R T AREA AREA %
0.?7 1 84 8.883
53 .729 1.29 2852888 1.23 1358888 35.557
I .-- . -7

I I I I I @ I 1
I
I d I I I I I'
e
a
L 2 . 0 L " O P . I 4 5 172988 4.527
I . . , ,
2.84
xF: 1.8888 E+ E
8. 22 YT
b v 5838A AREA %
R T ARE@ AREA X
8-22 11950 2.675
1.27 1 17888J 26 .371 E . 9 c i r l 8.015
27.154 1.38 1.5: 2 .04 1-21E8 38.527
c -5 - . 1;;; ; ;) 4. i ,,>
xF: 1.8088 E+ E
ST!3PT I . p g :
2.83
R T AREH R P E H Z
1 I5 E . 825 124780 27. 877 134200 38.236
25920 5 .62 :s 178688 37. 044
xF: l.RE88 E+ 8
STRPT } 0.21
bp 5838R A R E A Z
AREA RRER % R T
8 . 2 1 999:
185% 26.926
21648 5 .128 48.555
1 13888 1.57 2. 83 171488
XF: 1.8888 E* E
C CI
c 6. U

SI I ‘1 I I
1 I B I 1 I 5 I I I I 1 I
b. 5838R AREA X
R T R E A % RRER
XF: 1 . 8 0 8 C E + E
2.85 i E T
RRER AF:ER X
185 8.881
5.74i 2.124
8 . 4 7 2ES7’8EE 36.3?5 1.2: 55.77: : .5: 455800
44218EC 1.2s
2.85 168588
X F : 1 . 8 E E 0 E+ E 0.90P 9
Imp 58JEA RRER Z
R T RREA AREA Z
74 8.888 67 148888 188.88B 8.30
2.84

hr 5838R AREA 3:
F: T
8.97 1.2: 1.28 1.5' 2.81
AEER APEa X
XF: 1.8808 E+ E
hp 5830R RFEFl ?
ET RCEh RPER %
O. '? ' 116 1 . c . 7 - > 24970EE 1.23 3738088 1.5' 39 1488 2 .05 163688
X F : 1.
5 T B F l I
8 .002 36.774 55.851
5.764 2.489
,8888 E+

I c il I' I B I B
I 1 I I I P I I I I
2.E4 t 1 1 4 8.882 8 .97
1.23 1740800 38 .223 2395800 52 .347 1.28
1.56 2023118 2.84 1i.8588 3 - 6 3 ?
5.733
j:F: 1.8888 E+ 8
I"""
C c, -
2.04 ? 0 . 9 : E l 9.802 1-23 15c1180H 37.184 1.2F 2277800 53 .216
2.04 166980 3 .981 1.5: 2438011 5 .698
XF: 1.8888 E+ E
I STaET
b r 5 8 3 8 R RPER 2
R T FIRER RRER 2
E. 96 142 8.883 1.23 1558888 36 .412 1.27 2389888 53 .963 1.56 243588 5.6?1 2.84 -1682B8 3 .931
XF: 1.8888 E+ E
T E l l P l 7 8 78 ... . . .

C i l J H Y t STAFT
8 .97
1.57 1.m
2 . 8 4
h , 5838A A R E A Z
RT A R E A AREA Z
E . 97 153 8 .868 1.23 21128 9 . 4 4 2 1.28 38648 13.693 1.57 2672 1.19: 2 . 0 4 169188 75.597
XF: 1.8008 E+ E
'E. T a F: T
8 . 9 7
1.57 102s
2 .84
P T RPEA
0 .97 167 1.23 28598 1.28 28728 1 .57 2571 2.84 167188
XF:
START I 8 . 97
1 1523 2. 87
FT AREA
E. 97 149 ! 27 1 eo?!! 1 .28 28658 1.57 2465 1.67 6686 2 .87 169988
AREA X
8.874 9.396
13. 186 1.173
76.251
-8888 E* 8
RREA Z
8 . 866 a 7-47
12.635 1.887 2.949
74.928
0.15P.p
C L I .

I 'E ib 1 I I r I
II c a I
START 8 .38
h t 5838R AREA Z
R T AREA AREA Z
8.38 9692 8.948 8.96. io: 8.810 1.23 818588 78.6J4 1.37 1<.538 1 .642 1.9i. 2)<.90 2.281 2.83 178988 16.574
XF: 1.8808 E + E
'STAFT
8 . 37 1 2.83 i
F'T HEEH APEH 2
8 . 3 7 1 80?8 E . 938 8.47 1 4 5 8 . R 1 3 1.23 867488 79.5s: 1 . 3 8 18180 1.663 1 .57 24588 2.258 2. E3 164608 15.17s
X F : 1.8888 E + 8
I S T A R T
E. 97 1 . L J I O /
1.57
2.84
L C 583817 AREA Z
R T AREA AREA Z
8.97 178 8.818 1.23 81 1888 88.958 1.57 22168 2.218 2.84 168688 16.814
XF: I .ARWD = - P

I I i *I 5838A
AREA 2
R T AREA AREA ::
>:F: 1.8880 E + E
‘5 T i F 1 I
P i RPEH AREA Z
8.98 9:3 E. 818 1.23 ii,:3ae 47.394 1.57 12788 3.664 2.04 178688 48.914
X F : 1.8880 E+ 8
STGET
8. 82
1.23 +- 4 .. x.3
*I 5 8 3 E A AREA %
R T AREA AREA ::
E. 8 1 9864 2 . 5 5 8 164288 46.883
12378 3.532 7188 2 . 827 1 .63
- . E 4 157588 44.978
; : 3
I .

ST AF:T 0.21
1 .23
2 . 0 4
e... *.. E . . 1.8800 E+ 0
HEEA ~ i ; ET
0.97 199 0 . E47 6 0 . 49% 255980 1.31 62.3 1 1.487 1.63 16068E 37 968
I 1 2.84
I Q . ..
2. E 4 t 5. 5 8 3 E H AREA Z
R T
E. 24 E. 97 1.31 1 . 5 s 1.63 2 . 0 4
i ,F : T I Y E : I r i i TEPP F I D TENC' T C D TEPIF' A U X T E I I F OVEN PIAX
CCIT SFD ; r T l j 31- F I D SGNL 5 L F SEW? AREH P E J FLOW A FL0I.I E n 7 T t4
C' L 'V i E X T 1
AREA APEA ;. 9'46 2.267
8C E . O l i 354iE0 5 ? . 116
4 2 0 .818 ~
6508 i.511 15 3780 3:. Bc; 1
','F: . . 1.8000 E+ E
t *r 583EA AREA Z
F: T AREA AREA 7:
1 .47 2804 0.528
1.85 2.11
1. CE 1 1 4 8 0.337 333080 97. ;e?
n :. 1 '3 0.E;:; 9 7 ,? 1553 8 . 4 5 3 -.
X F : 1 . 8 8 0 0 E + E

I c I
15
1
3
'c. T f! F T C .I: c,
Y E
- 1.01
4:R
1. 1. 1. 1. -
RRER ARER Z
98 8 .877 44 8.813 - ,e 8 . 8 8 3 23 8.087
331188 98.891 352'0 1.1354
X F : 1.8808 E+ E
R T A R E A RPER Z
X F : 1.8880 E+ E
HTTN zt 7 a STRPT
VE
*r 5838R RRER 2
PT ARER ARER %
1.51 255 8.293 1.69 395 8 .454 1.7? 7144 8.217 l.?5 152 8 . 175' 2.11 85 8.898 2.39 23958 27.547 2.47 54968 63.215
. .-

nr: 1.8888 E+ E
* c 5838R RRER Z
R T RCEA APEH
.. 25160 13.12: 49Q?8 6.4.634
::F: 1.8888 E+ E
hp 5838H APEA %
FT AREA AFEH 2
1.51 1.67 1.7: 1.95 2 . 4 0 2 . 4 7
265 778 576
43 24?38 49288
8 . 3 4 ? 1.015 8 . 7 5 9 8.857
32.S.jl 6 4 . 9 5 8
XF: 1.8888 E+ 8
1 . 5 1 1 .67 1 .77 1. e5 2 . 4 E 2 .47
AREA
263 768 575
48 24988 49498
AREA Z
8 . 3 4 6 1 . 8 1 8 8 . 7 5 6 8 . 0 6 3
32 .744 65 .881

X F : 1.8088 E+ E
T I M E 1 3. I? I N J TEMF 1EO lCC F I D TEmF 250 2'58 TCD TEMP Q 44 RCIX TEMP 0 4i. OVEN MRX 288
CHT SPD R T T N 2t F I D SGNL E. L F' S E t i S l i F E H P E J FL!2bl h FLOC1 B OPT14
8 .2 V L V
1.58 10 A
E. E 5 1 2
20 0
'E::T 1
I

F-.1& -I J
d
I i!
I I
,

I I I 'I I I I I I I I I I I I I I
t
3
PT- J
I’

... . ...
/ I 85 ( J . L 5) 0. Y r /#23 /' 2 9 / I 55
.-
. . . .
. . . . . . . . -. __ ,I ... .... .2
. . . . . . . .
. .
. . . .-
. .
3
I
2
I SU/Y&f &Y
I I I I I I I
..
1 .I
/

i d 1 1 I 1 I I I I I I I I I I 1 I I I
,.
1
0 3 7

m 'I 'I 1 'i 1 1 I I I I 1 I 1 I 1 I I I
' 0 -0 ? E M F 1 T I W E 1 +. c : N J TEMP 100 lea =!D T E n F 250 25.C T C D TEWP 0 4: 3 1-1 :? T E W F 0 4 4 ' : : v ~ t ( PIA!.: 2 8 0
-
I :-&;:
:?F: : .0000 E+ 0
'E - F F. T
I
APEH AREA Z
5 g : 8 a 2.121
2 5 4 ? i d 9118
166488 38 - 785
X F : I -""" -.. "
1-1)- 79
.

. . Y Y U O t’ Y
START
E . 95
1.52 1.83
2 .34
R T AREA A R E A 7:
8 .95 8 7 8 2 2.880 1.52 243688 57.693
2.121 1.33 L. . J c. 2.24 1&8?80 3s. 107
c. ,a r -
XF: 1.8888 E+ E
ZTAF.1
8.9’3
E T AREA AREA %
B . ? ? 18Z 8.823 1.31 209880 61 -338 1.5, 2 R 1 n.n40 1. GI3 19 8.884 1 . 6 4 7898 1.616 2 . 0 3 162288 36.988
Y F : 1.E888 E+ 8
START I
h C 5838A A R E A Z
R T
8.97 1.31 1.56 1.63 2.83
c
A R E A RREA ::
75 8 . 8 1 8 249888 59 .556
198 8 .845 7328 1.753
161588 38.628
“T. . ---- F A n

RT
3. '3'
I RT AREH AREH x
, (s:5pi
J - . -
I I

I I
I I I I I I B 1 I 1 I I I I i I I I
\
-iN c 5
U
R T A R E A HEEH Z i
8.97 51 0. 012
1.56 210 0. 848 1.31 274608 6 2 . 183
1-60 1-64 2-84
15
2 . 04 r ET
0.97 1.31 1.56 1.59 1.63 2.84
.. nF: 1.000E E+ B
0.23 8.96 1.30 4
AREA
9698 63
283788 7c.
A R E A ::
2.078 8.814

. I ... . .
'I I
3 E I II
1 I I I
I I
2.03 166380 35.638
>;F: 1.0008 E+ B
hP 5830A A R E A X
R l
0 1 1 1 1
561 6 3
2 . 0 3
0.97 L
X F : 1.000B E+ 0
2.03 2
0.97
i .57 1.63 2.0;
.-. 7 1'5.6 . i 0. 159 3.133 94.239
xF: 1.8000 E+ 0
START
1: . c z * - -. - .sJ . .... . . . .. . - r. 1. __ .. ... .. ... . .. . .
I 2.03
XF: 1.0000 E+ 0
bp 5830H A R E A x
R T AREA HREA :: 8.97) 1.23
95 1190 2370
29 1
165400 E. $03
0.054
94.272
ATTH 2?' 5 a _r START

h P 583HA AEEH 2
RT
8.32 8.97
105 0.861 8 . 866 0 .842 0.6;30 1 377 8.16.3 2.347 94.315
I I
HEEH A R E A X
I I
D. 043 0.r jZQ 1.395 8.174 2.945 94.913
XF: 1.000B E+ B
I
I
0.97 138 8.881 1.24 1175 8.692

__
I I I I I 1 i I I I I I I b
1 I I I
1 I
:<F: 1.0000 E+ 0
. . . . . . - . . . . -.
C C'
HREH HEEH :-:
c. 7 -1.
Q
155500
0.019 0. E 0 2
ij3.79r; El. 047 1.420
35.716
X F : l.BB00 E+ E

1 '1 I
R T ~. A R E A A P, E a :-;
149 8. E34 61.138
0.849
XF: 1.0000 E+ E
I STAET
1 1 E.98 1 - 3 1

E. 98 98 0 .021 1 .31 26j62" 6 1 - 5 0 0 1.55 194 0 .045
1.470 1 . t,; b .:. t. 1 2 .84 160088 3 t r . 965
* - - - <
- r
XF: 1.0808 E+ 0
STAPT
Q 8.97
C c: u
1 0.97 184 a. 118 1-31 2650 1.589
.. . 2 .57 2-36 0 .177 1.63 6380 3.825 1 2-83 157388 94 .. 299 331
I ' C
0.97 1 1.23 1.30
145 288 317
AREA %
E. E58 E. 178 0.193

1 I
3 I
1
1 i
~
I -
c
113
ii 1 .> <, ,q 35
631 1 156400
7- 4 I
.-, .-.
i - .-
XF: 1.8000 E+ 0

E T
C u
I 0.97
B 1.61
1 - 2 3 1.30 1.55
2.85
STHF'T
i
-c J .A
c1- . i-.r - 1.0000 E+ 0
12330 4.163 1-83 71580 24.16s 1-09 I 1388 3.815
4.382 1.22 13980
8.611 5.497
1810 1.27 1-39
57.364 1.57 16280 2.85 1cwaa

~
C c U
I 1.11
1 t c
A R E A HF:EH 7: RT
XF: 1.0080 E+ 0
I I bp 5 8 3 0 A
AREA
RT
0.97 .c_
2. 03

...... 35 0. 022 I
3.948 I
1.56 1-63 6332 2.83 153488 35.640
XF: 1.8888 E+ 0
h? 5833A HREH r:
ET
E?. 43 0.97 1 - 2 3 1.30 1.57 1.63 3. E4
HREH HE E H :.:
e . 97
...... . . . . . . . . . . . . . . . . . . . . . . ...... .... F,. .
,I::: -. I 2.E4
RT HEEH HEEH ::
8.37 1 1 7 0.071 1.23 195 E. 1 1 8 1-30 226 8.137 1 . 5 7 41 8 . 0 2 5 1.63 = .-I - 3 -4 3.599 2.84 158188 -96.843 - XF: 1.8088 E+ &--- I /
STHRT
0.97
- - h, .- $:a
2.83
-. -
4 0.97 0.055 0.105 0.130 0.021 3.416

A - a L C I-- (I
P, . . . . . . . . . . . . . . . . . . . . . . . . . . . . . . . . . . . . .
2.02
0.19 0.97 1.31 1.57 1.64 2-83
:;;F : 1.0000 E+ 0
A R E A
'9 5 385 1 j d 3 6470
157480
-7
AREH X
1.0000 E+ 8 X F
7212 4.283 0 . E63 8 . 2 0 8 8.471
I86 35 1 744 .~ 79
6.1 87

- - - . . . P
i
-. . . j - --. .... : .. 2 , -

I - - . - . . . . . . . . ._ . . . . . . -
. - . . _ - . . . . . . -. . -
P - 1 - _ _.
.. - . . .

.. -
. _ - . .. . .. . . . . - - . . . . .
. . . - . . - -
- .. . . . .. - .
_ I . . - - - . . L _ .
i n
. .. - . . .
... - . .. - -
. - . I

r t

B-P 11-1 E Iz,
/
2
I I 1 I .-
p I
z*37 4 7 f 3 7 7 3 4

c ")'
I I I' !
II I
I i I I) I
A d € -

I I I I I I 1 C U - 3
I I I i I, t l
I’
J
4 V E = 154 J

I I I I I I I 1, i ' I
I
5
I
R
3
4
L / P J / t773
I I r I 0y-3 I
i
2c I I I
7 0 I 1

1 t
1 I I
I I I I I I I I I I I I i I I
1 i
\
- "
79 -. / 2 - f
0.9;
- n ;- t .- . 's; . . . . . .
0.93 1 -22 1.30 1.56 1-62 2.03
c. / c
P 5830A 0. b R E A %
1' I I 1
ET
.
A E E R
X F : 1.
bp 5 8 3 0 A AREA ::
A R E A A R E A X F: T 87 0.849 0.97
0.421 1 - 23 0.843 1.30
7216 4.088 1.63 168488 95.216 2-82
337 n. 191 745
i 6
X F : 1.0080 E+ a

hREFl Flew x 9298 4.979
98 0.048
I I I I I I
ET
8.97 1.30 1.57 1 .62 2.83
a E E a FlF:EFl X
0.058 0.753 0.042 3 - 8 1 ? 95.338
XF: 1.0000 E+ 0
2.83 m h? 583EA
AREA AREH z I z
'1 8.97 135 0 .888
RT
1.23 27 1 E. 161 1.30 6E3 E. 4137
4

r I I
I I I I 1
I I I I I I I I I I I 1 i
I
1 . Jr, a4 k l . k I 5 k l
2.03 168388 95.431 1.63 6503 3.871
X F : 1.0808 E+ R
C -
AREA AREH X
0.056
1 7 1 1aa
8.056 0.303 0.450 0 . 8 4 6 3.835 95.394
XF: 1 .0808 E+ 0
STHET i 2.03 .z
k? 5830H AREA Z
RT
0.97 1.23 1.30 1.56 1.63 2.03
AREA
89 2'46 22.3 40
6575 170600
XF:
AREA X
0 . 8 5 0 0.135 0.139 0 . 032 3.700
95. SCE
1.0800 E+ E

ET
0.97 i -32. 1.30 1.57 1-63 2.03
-
START
3 0.97
AREH
XF: 1.8000 E+ 0
HREA H F: E A '.. 92 0.055
0.174 L $0 - * 3 44 r 0.180 54 0.032
.n c
3.945 95.612
2.03 3 bP 5838A AREA %
ET AEEH AEEH z 0.47 1.33
I
140 0.084 287 0.172
6 2 5993
160388
0.165 8.037 3.587 95 - 955
X F : 1.8888 E+ B
-START

1 I
XF: 1.0000 E+ 0
hP 5830H. H R E A z
R T
0.37 1 - 3 1 1.56 1.63 L. 0.2 m -
HEEA :<
0.016 60.052 0.E47 1.3*34
3.3. 4 9 1 - .-. XF: 1.0000 E+ E
r S T H R T * 0.46 J
h p 5838H AR E A %
RT AREH AEEH 2
0.46 0.98 1.31 1.56 1 * 6.3
9686 122
244880 1 is
6630 B. 841 1.598
C
I\ -
2 . 0 3
1.m
2.83
0.40
1.31
2.83

r I I I I 1 I I
I
i i i i 1 I i i
I I
XF: 1.8008 E+ L
J 2.03
RT AREA AEEH Y:
XF: 1.000E E+ E
T I M E l 5 3
TEMP 1 70 70 T I M E l 5.0 I N J TERP 1 0 E 1EB
TCD TEPlF 0 43 HUX TERP E 45
F I D T E R F 258 250
c) '.:EN RA:=I 2 :3 0
CHT SPD 1 58 ATTN 2r 5 F I D SGNL A SLP S E H S E.05 AREA R E J 1 FLOld A 1 F L c) I)! E 2e
1

1 4 .8&
- 4
I
VE
I S E E l
I
i
. .
\
h? 5830A AREA ::
ET FtEEA HEEH %
1.47 1.68 1 -84 2 - 1 1 2.34 4 - 8 6
1282 161
8 . 507 0 .116
98 .11 1 8.824
SF: 1.8088 E+ 8
4-
R T AEEA AEEH %

4.87
hp 5Y3BA A R E A 2
R T
1.58 1.55 1.6.7 1.84 L. 10 4.57 -
bP 5838A A R E A 2
E T
1.51 I. 67 1.83 2.18 2.45
S T A E T VE
RF:ER AREH 2
5 . 7 ' 3 7 8.848
2545 7 1 . 2 6 9 446 12.490 343 9.605
XF: 1.0008 E+ E
\ - -

h P 5830A HREA :i
FtT
1.51 1. $7 1.E3 2.18 5.45
1.51 -- - L . ..a - 2.10
3 7 - & . . d l
h p 5 8 3 0 H HEEA %
R T
1.51 1.83 2.lE 2.37 3.67 5.05
I ST%T
AEEH A E E A %
"\ 1.51

5.07 i I-
RT A R E A A R E H 7:
TEMP 1 70 70 E S C A P E
STHRT v E
- i . 5 5 - 2.11 5 1.84
b r 5 8 3 R A A R E A %
R T A R E A A R E A ::
1.51 1.55 - 1.84 3223E0
B . E i l 2 8.885 99.887
2.11 3179 8.977
X F : i.00a~1 E+ R
I I
Q I I R 1 I
i t i I
I I
i I 8 1 I
c t I
,
I
i
ET
1.51 1.55 1.E4 2.11
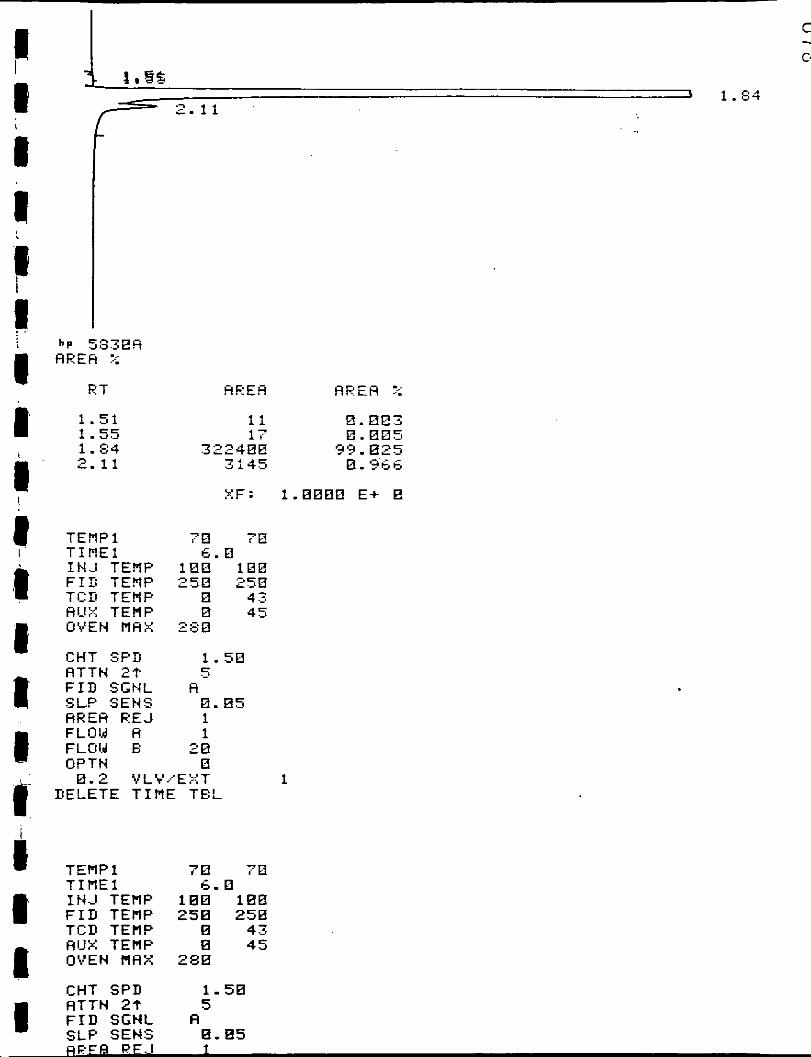
TEMP1 T I M E 1 I N J TEMP
TCD TEMP A 1-1 X T E p1 P Ok'EN M A X
FID TEIlP
CHT SPD ATTN 2t F I D SGb4L SLP SEHS HEEH EEJ FLOld A FLOlr l E OPTN
A 0 . 8 5 1 1
20 0
1
TEMP 1 70 70 T I M E 1 6.0 I N J TENP 188 1 8 B F I D TENP 258 258 TCD TERP E 43 AIJX TEMP 8 45 OVEN R A X 288
CHT SPD 1.58 ATTN 2 t 5 FID SGHL A SLP SENS 8 .85

HEEA %
R T
0 .97 1.31 1. S6 1.63 2.03
TIMEi 3
I ST
XF: 1.0080 E+ E
a
I
I 2. 83
br 5538A AREA Z
RT
0. S i 1.30 1.5s 1.62 2.83
AREA A R E A 7:
118 262588
28 1 580 1
1136288
8.827 60.378
8.846 1.334
38.223
X F : 1.8888 E+ 8
=TART

1. (F
i
I R 4
@ I t I 8 i I I' I
.- . . . . ,, ____ .. . . .. 3 1.38
2.83
=-.I.. ..FT.,. .. _.. . __
0.97 1 . m
8.852 1.412
39.33s
t 0.98 b 1.31
. . .. .. . - . -. - --__ . c I & . b
I 2 . 0 3
hP 5830H A R E H Z
R T A R E A A R E H Z
0.820 62.793 0.058 1.262
35.875
C '0
C
$$@-
kP 5830A AREA %
BT AREA
131 3638
AREA 2
8.876 2. E99
i.56 1.62
R -
40 1 6187
*,-?<""
8.232 3.577
n l " . r

- . . .
c I I I 1 p 1 I
:b.
C;THET I C XF: 1.0080 E+ 8
b y 5530A A F E A ::
R T AREH AREH %
XF: 1.8880 !E+ 0
STAFT
1.38
i 2.03
AREA AREA %
131 0.870 3718 2.161
8.248 6309 3.675
161188 93.546
X F : 1.0888 E+ 0
1 --.c v i -J
by 5 8 3 B A AREA z

0.97 1-23 1.50 1 - 5 7 1.63 2.03
5750 159400
0.836 0.157 0.158 0.819
C C ?
X F : 1.0000. E+ B I
STAET 0.19
I 2.03
j- h P 583EA HREA 7:
R T
0.19 0.98 1 - 2 2 1.38 1.57 1.63 2 - 0 3
I 3.03
93 303 376
35 6576
lSG000
L .
8.048 0.157 a . 143 0.01% 3.402 96.232
I t ' 0.98 \ 1.31

C C c
R T AEEA AREH 2
70 7E - T E I l P l T I M E ? s . 8
CHT SFI! 1.50 ATTN 2T 5 - FID SGNL a S L P SENS 8 . 0 5 A R E A R E J 1 FLOW a 1 F L O M 8 20 OFTN 0
TEMP1 0 GJ
FII! TEMP E a I N J TEMP E a

c:
? ,(I
.. 1
:, .
I
I a
C c
I..

t
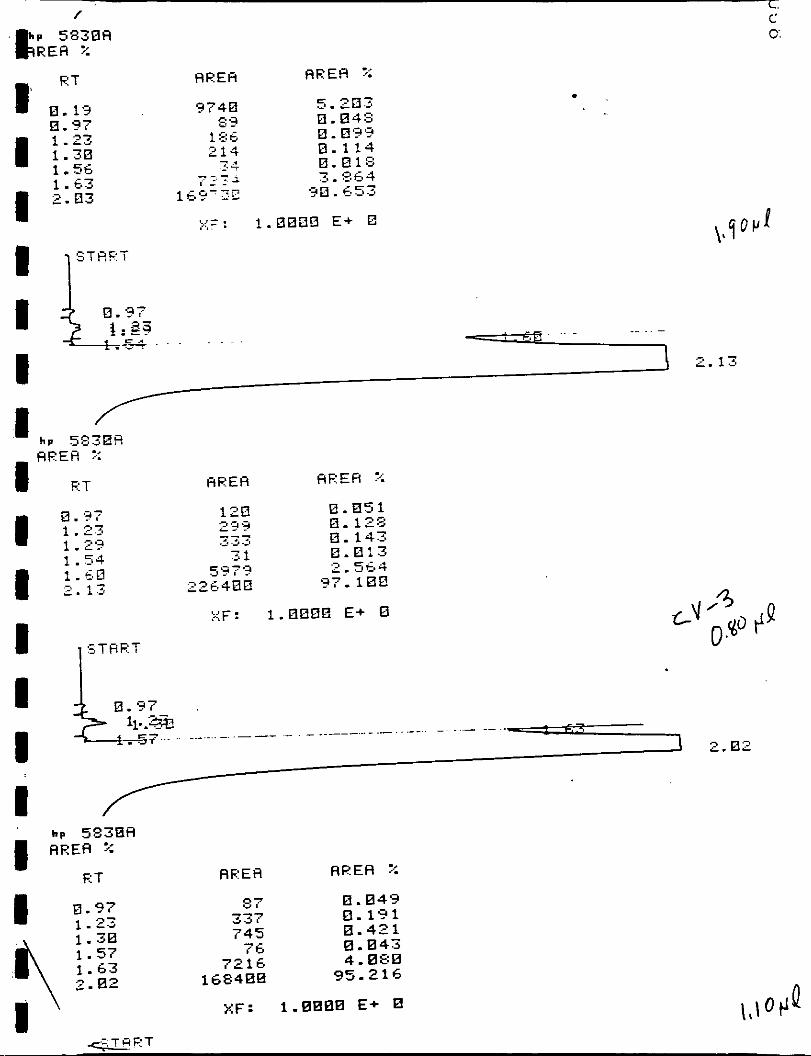
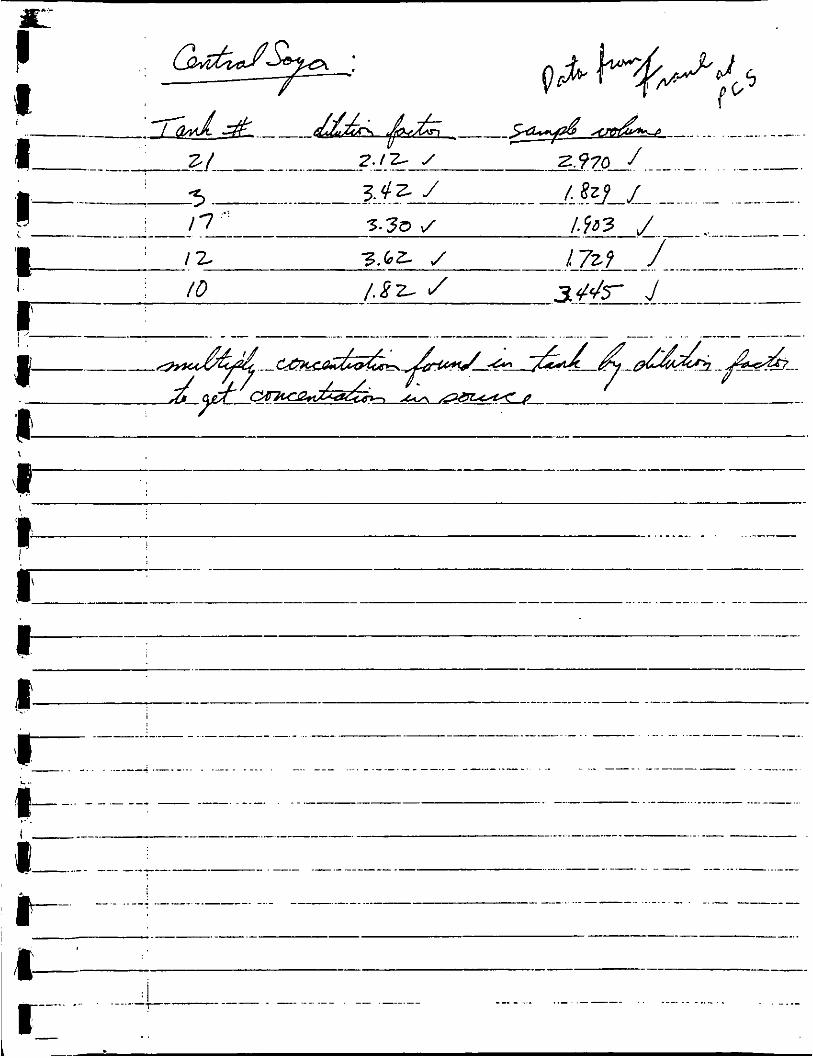
Sample no.
DV- 5
cv-5
MOS-2-OUT-4
MOS-2-IN-4
MOS-1-IN-4
- - Tank no.
17
21
10
12
3
-
- -
Average Conc. of Dilution Conc. in area tank ppm factor source ppm
2302 5.87 3.30 19.4
1116 2.84 2.12 6.02
97145 248 1.82 451
110638 282 3.62 1020
1,005,928 2563 3.42 8770
Y r'

4 Y93.&- m
/, 05 1. //
/W,? 45 J


a
3
3
3s-
l7CS-J -3AJ- 4

3 1. ! P
; /-.-. ..... ... ........ . . . . . . . . . . . . . . . . . . . .
/ P
L..
- .......... - ........... , .. .___ . - ..... ............... .. I p ... .... _. .. ._ . I - - ..
...... __ .. .... ___ . ._ ... ._ .. .- ___ __.-- 8 ............ .... .... P-
. .... . . - ... . . . ......... . . . . . . . . . . . .- - .- - -_ -. ..-. . . . . . . : I
c - ..

I
,4 H E
TEMPI E s c AP E
B A A B A B B
I .
n 45

/ '

s P
t b f a t
r I e I l! R I 8 1 i i E c 1
T I Y E i 3 XI
A R E A H R E A :.:

,

TIME1 3 ;:I
TIME1 1 0 3
..

F I 1 9 c s 1 I I I 8 1 I E I L -
I
I.
. - . . -.-.-. . . . *.-._. .. . . . . . . .

H K t H ;;
/(I \
I' I I
d 1 I I 'I' I I I I I I I'
11 I I
il I I I
-
ET HREH A R E A %
XF: 1.EEEE E+ E
T I N E 1 3 HTTN 2t 1 2 a
t

(4 \
I' I I
(1 I I I
I
I I
'I
I I I I
I I I'
I I I' 4 I I I
-
1
t
e. a :3
START '.:E
F: T AREA AREA x
.. !
.

i (4 I' 11 I1 I r I 'I' I I i
I !
I c
I i I!
I I
I 'I I I I
9'"' aj'" ,7-p t
I . 50 10 H 0. E5 1
i

c I I
(I I I 1
I 'I I
2. CERTIFICATION OF GAS STANDARDS USED
'I I
i
'I I I I'

I
I I
I I
I 'I I I I I il
I
i I
I
Gentlemen:
Thank you for choosing Scott for your Specialty Gas needs. The analyses for the gases ordered, as reported by our laboratory, are listed below. Results are in volume percent, unless otherwise indicated.
ANALYTICAL REPORT
Analytical Cyl. No. A - 1 2 7 1 2 Accuracy* ComDonent Concentration
~~~
HEXANE 483 DDm
HYDROCARBON FREE A I R BALANCE
Analytical Cyl. No. xL-423 Accuracy* Component Concentration
E 1 4 5 0 nnm
HYDROCARBON FREE AIR BALANCE
.- . . .. . .
Analytical Cyl. No. Accuracy- Component Concentralion
Analytical Accuracy-
Concentration
S'
3. .I *.
\
Analyst Approved By Fr
lk oaly Ihblllty 01 Lhlr Cornpamy Im lu ..bleb I& to wmpb ria tbb &la Ih.u b. tODIym.nl (hU.Of by (ht C0mP.W r l t h O V t Son
A C U B L E N D ~ CALIBRATION & SPECIALTY GAS MIXTURES PURE GASES ACCESSORY PRODUCTS m CUSTOM ANALYTICAL SERVICES

. ..
I I I I I
'I
I I I I I ..
I I
3. TCA TRAIN ANALYTICAL DATA
I

u I 1 I
I
Account #/Nome 92-004
POLLUTION CONTROL SCIENCE, INC. Sornple 6015 Manning Road, Miamisburg, Ohio 45342 (51318664SZX 5908
PCS #:
Dote Rec’d:
-l r M R . WILLIAM G. DeWEES PEDCo ENVIRONMENTAL, INC. 11499 CHESTER ROAD CINCINNATI, on 45246
Client ’s P.O. #:
Report Date: 1/31/79
Analyst’s Note
c J Page 1 of 2
SUMMARY O F TCA DATA FROM CENTRAL SOYA-DELPHOS 1/31/79
Source
MTNERAL OIL XRUBBER #1
MlmRATA OIL scxm3Ex #2
COOLER
DRYER
Sample 2 3 4
2 3 4
2 3 4
2 3 4 5
2 3 4 5
tank sanple lost1 240 135000 ( t r a p only) 2.319 189.0 230700 64.43 181.0 272700
tank samle lost 50.00 29230 6.590 7.090
4.381 6.296 6.009
0.034 0.325 NDL 0.299
2.425 0.387
NDL NDL
47.70 21.91
0.530 4.226 14.33
0.325 0.384 0.3362
trap sample lost
1.454 1.069 0.1332
trap sample lost
91420 34140
3060 11280 12020
476 876 216 -
7980 1160 47 0 -
m L - No Detectable Level.
The infarmstion crrntnined herein is the confidrnfisl property of our clients. Disclosurr of such data. statement or conclusion requires . . ~ . ~~ ~~

I I I I I I I I I I I I 1 I ..
4 1 I I I
,...
Account #/Name 92-004
Sample Summary of T 6015 Manning Road, Miamisburg. Ohio 35342 (513)8662= 5908 Central Soya - De
POLLUTION CONTROL SCIENCE, INC.
r PEDCo
-l
PCS #:
Date Rec'd: . '
Client 's P.O. #:
Report Dote: 1/31/7
Analyst's Note:
A Data From phos
c J
Dirt and/or dried grain had gotten lodged in the tank quick connect, and the sample was contaminated.
These samples were taken by PEDCo. personnel. The trap samples were not refrigerated. Nuts on traps from Dryer 5 and Cooler 5 were loose.
NOTE: Due to the extremely high concentrations of hexane and/or water in the traps, analysis of the trap samples from Mineral Oil Scrubber #1 was difficult.
The inlormation contained herein is the confidential properly of our clienlr. Disclosurr or such data. *Latemen1 or conclusion requires

TCA SAMPLE ANALYTICAL .SHEET
Std.Conc. ( P ? d
At tn . Std. Area A t t n . Sample Backf 1 ush
LOOP Area
I I
CVO sampFL konc. p pm
I I I @ I I I I
1
CLIENT ( Z r m l L Sova -?ebb. DATE TRAP ANALYSIS PROJECT NO. 9% -00 DATE TANK ANALYSIS /, 7 / . 7 4
‘i e TRAP NO. L/r TANK NO. 7 TEST NO. //7/7? f l b l / - id47 t ANALYST fi F: !(-. /-I
7d m H g P T ( l I n i t i a l Vacuum
(Pre- Tes t )
TANK FINAL
pB(2) Hg
P T ( ~ ) 25- 3 PT(2) / 4 ,”, IllnI Hg - Post-Test Vacuum
mm Hg - F i n a l Pressure
T 7 4 O F
SAMPLE VOLUME
rpB(2) - ‘T(2$ - F B ( 1 ) - ‘T(l\Cl (T + 460) X 0.299 vs =
5 _- ppm as C02 - sample CVOC(2 1 MASS OF CARBON I N TANK
‘VOC(3) - ‘VOC(2) - X 4.996 X = -.-- mg/l (68”F, 760 Hg)
mg Carbon in Tank __-.---- - x vs = Mn VOC(1) - ‘VOC(3)
ove r 1

4 1 I I I
I I I I 1 I 1
I 1
I 1
u ..
I -
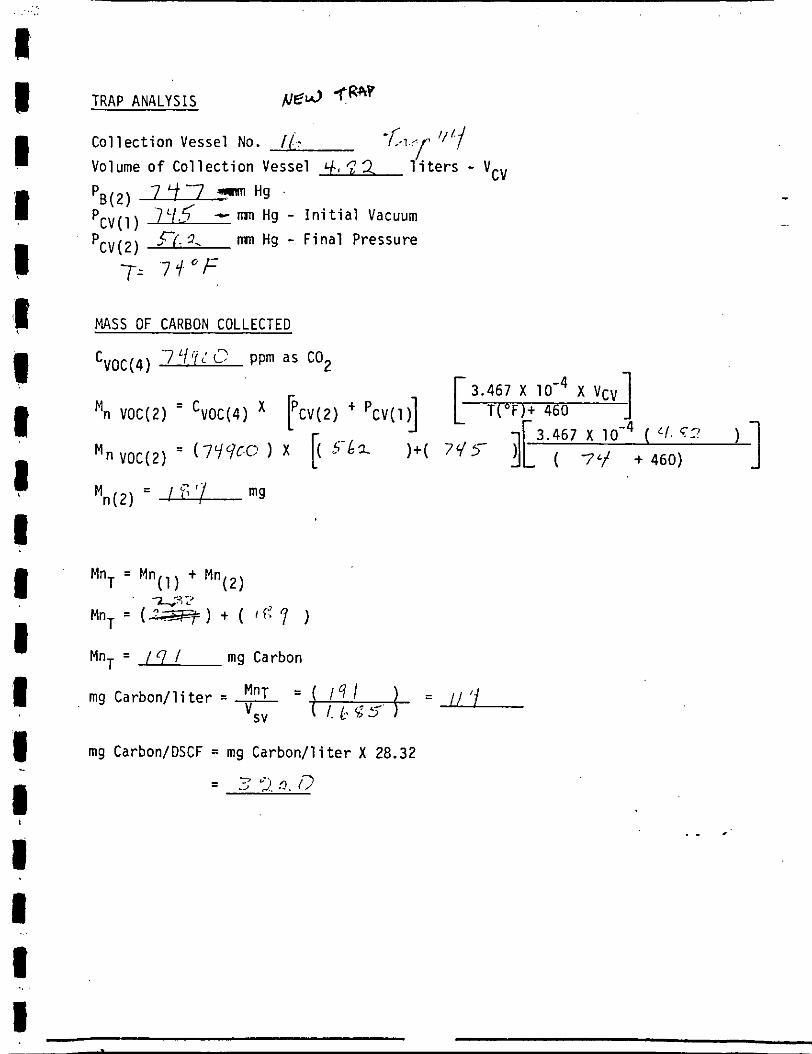
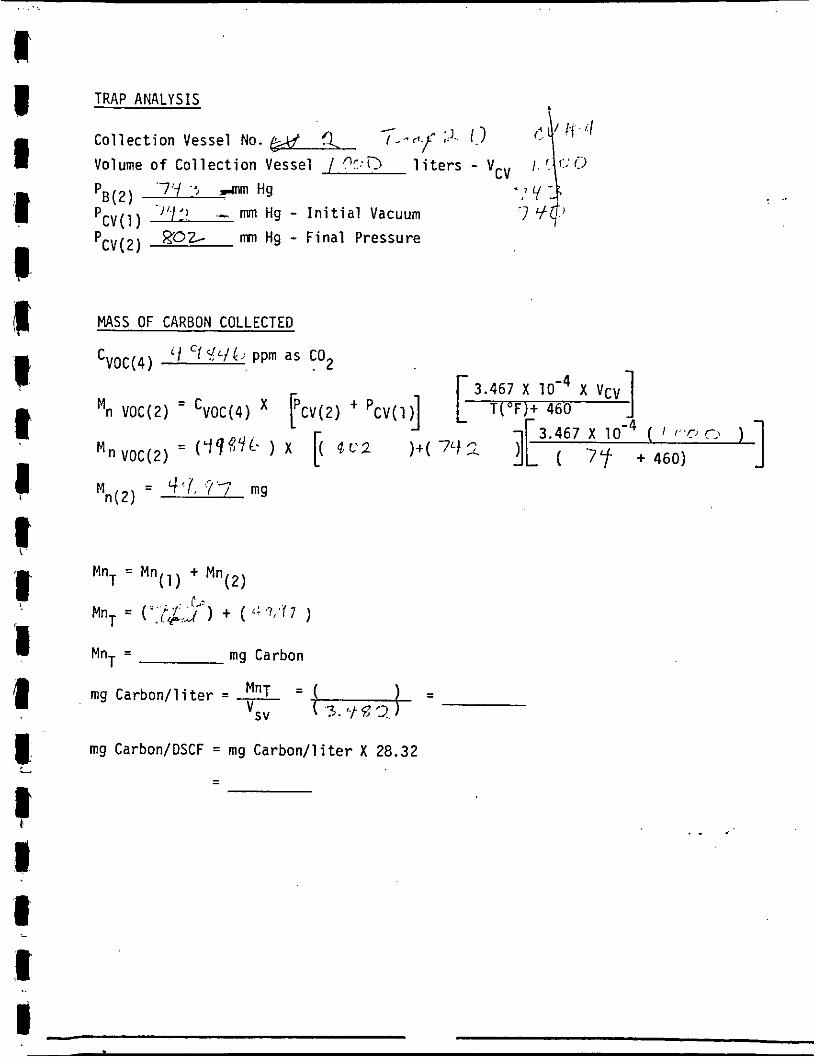
TRAP ANALYSIS
C o l l e c t i o n Vessel NO. L ’ V - I I Volume o f C o l l e c t i o n Vessel ~ F L l i t e r s - vCv P .,7/ 7 9mn Hg
2 *nm Hg - I n i t i a l Vacuum P P
, . , B(2) .-,./e-
CV(1) . - ;‘ ,// c p ( l-+.
CV(2) .3.3; (7 1 - ,7
mn Hg - F i n a l Pressure <..-
J Fif *
MUS OF CARBON COLLECTED
Cvoc(4) ’-/ $:,<-‘(!3 ppm as C O ~
Mn VOC(2) - ‘VOC(4) r C V ( 2 ) + ‘ C V ( I ( [ T(OF)+ 460 ,? ’ i
3.467 X X V C V -
3.467 X ( ‘-I. I - - .
M n VOC(2)
mg Carbon/DSCF = mg C a r b o n / l i t e r X 28.32
= /k..)O
. . r

TCA SAMPLE ANALYTICAL SHEET
DATE TRAP ANALYSIS DATE TANK ANALYSIS
CLIENT lerJr,?.aL - I%-&. PROJECT NO. G2 -004 TEST NO. f l d s -I ~ ZdLEr 3 ANALYST
TRAP NO. I /J TANK NO. bZ .b _-
TANK IN IT IAL -.
pBL1) 756 mm Hg
p T ( l ] n i . t i a l 729 Vacuum H9 (P re -Tes t )
TANK FINAL
pB(2) Zmm Hg
P T ( ~ ) I + L { ~ ? mm Hg - Pos t -Tes t Vacuum pT(3) 2.5-Z. mm Hg - F i n a l P r e s s u r e
T 7'f OF
SAMPLE VOLUME
rpB(2) - 'T(2J - F B ( 1 ) - 'T(1J (T + 460) X 0.299 vs =
vS = /, 1. q.C sample volume - l i t e r s
TANK ANALYSIS Sampl e B a c k f l ush Std.Conc. C V O
SampFi ' konc. p pm
( P P 1 Attn. Std. Area A t t n . Loop Area
/ ,.I /;: 9 r 203 'I -_ /:>. 4 72-00 2 1 I 3 .,Y)-T 0 3 I 0
cvoc
cvoc
7 . 5 - 2 ppm as C02 - measured 1)
r -I
CVOC(1) - lp~ ( 3 + 'B( 2 ) l
2, -[ 'B(2) - 'T(21 - [ IPB(l) - 'T(1)l
= 4 '7Aj-O
- X 4.996 X l o m 4 = 1. mg/l (68"F, 760 mm Hg)
ppm as C02 - sample CVOC(2) -- MASS OF CARBON I N TANK
'VOC(3) - 'VOC(2) X Vs = 2.31% mg Carbon i n Tank -
Mn VOC(1) - 'VOC(3)
TRAP ANALYSIS
Collection Vessel NO. I ( - Volume o f Collection Vessel 4, n 2. liters - Vcv
*LT ' / ' f P 7 9-7 nnm Hg
L / , $
,r[. 3.
- mn Hg - Initial Vacuum mn Hg - Final Pressure
B(2) pcv(l) ' PCV ( 2 )
0 - 7: 7 J f-
MASS OF CARBON COLLECTED
'VOC(4) '7 ' / i f / L? ppm as C O ~
1 3.467 X X V C V T('F)+ 460
'I 3.467 X ( c / . c:'
= 1 ",/ mg Mn(2)
MnT
MnT
MnT
I C 7 )
Carbon
mg Carbon/liter = __
mg Carbon/DSCF = mg Carbon/liter X 28.32 - - - .I 3. n. (3

T C A SAMPLE ANALYTICAL SHEET
Std.Conc. Attn. ( P V )
3 !; 7 c; /> q 5 0 X y J 3 Q=@O l o b 3
Std. Area At tn . Sample Backf 1 ush
Loop Area
I
DATE TANK CLIENT CEmeCl' so,, - P O L DATE TRAP ANALYSIS
PROJECT NO. @ - O d TEST NO. ~ l d s I - TJLbr 4 ANALYST
.a TRAP NO. 3 TANK NO. 3 .- TANK INITIAL TANK FINAL
' B l l ) 7-56 nun Hg PB(2) - 2 t L n u n Hg PT(2) % J 2 mm ~g - Post-Test Vacuum
Z-Tz T 7? O F
mm Hg - F i n a l Pressure p T ( l ] . 7zg nun Hg
n i t i a l Vacuum 'T(3) (Pre-Test)
SAMPLE VOLUME
C V O SampFL konc.
ppm ,2 Bll f i l
IpB(2) - ' T ( 2 j - [PB(1) - 'T(1J (T + 460) X 0.299 vs =
CvOc(,) !! 1- ['I (9 ppm as C02 - measured
CVoc(2) = 7 0 FYI a MASS OF CARBON I N TANK
'VOC(3) - 'VOC(2)
Mn VOC(1) - 'VOC(3)
ppm as C O ~ - sample
'7 /, z 3 2-J
- X 4.996 X = .- mg/l (68"F, 760 mm Hg)
x vS = I. q- , '/ 7 mg Carbon i n Tank -
o v e r

.. .
TRAP ANALYSIS
Co l l ec t i on Vessel NO. I 8' T&",? 3 0
Volume of C o l l e c t i o n Vessel 4.83 l i t e r s - v,-" -. 747 m H g
'B(2) TF- m Hg - I n i t i a l Vacuum
2.Yd mn Hg - F ina l Pressure P
CV(1) PCV( 2)
MASS OF CARBON COLLECTED
'VOC(4) i
Mn VOC(2) - 'VOC(4)
Mfl VOC(2) 7'L: t 460)
T 4! ( I C ? ppm as C02 , 113.467 x 10⁻⁴ x vcv ] T(OF)+ 460 -
[pCV(2) ' 'CV(1) 3.467 X l o e 4 ( ' '?
= / r : l mg Mn(2)
mg Carbon/DSCF = mg C a r b o n / l i t e r X 28.32
= 3 g ; : o o
. . .

TCA SAMPLE ANALYTICAL SHEET
Sample Loop
CLIENT (gdrafiL S-4 -fEbCD DATE TRAP ANALYSIS L I 2 PROJECT NO. 97, - 0 4 DATE TANK ANALYSIS
TEST NO. floj 2 LET 2- ciq) ANALYST - LM
- * TRAP NO. 20 TANK NO. z - TANK INIT IAL TANK FINAL
pB(l ) 75 / mm Hg pB(2) nnn Hg
P T ( l I n i t i a l Vacuum PT(3) A > ? mm Hg - F i n a l Pressure, f i n , / : -
PT(2) / b y mm Hg - Post-Test Vacuum 724 mm ~g
(Pre-Test ) T 7y O F LA <I SAMPLE VOLUME
Std.Conc. CVO A t tn . ( p w ) sampFL konc.
Std. Area A t t n .’ Backf 1 us h
Area ppm
. -
rpB ( 2 ) - ‘T( 2 d - F B ( 1 ) - ’T(1J ( T + 460) X 0.299 v = S
I I I I I I I I
ppm as C02 - measured CVOC(1)
CVOC(1) - LpT ( 3 + %(*)I
cv0c(2) - [‘B(2) - ‘T(21 -[‘B(l) - ‘T(l)l
- ppm as C02 - sample - CVOC( 2)
MASS OF CARBON I N TANK
‘VOC(3) = ‘VOC(2)
Mn VOC(1) - ‘VOC(3)
X 4.996 X = mg/l (68”F, 760 mm Hg)
- x vs = mg Carbon i n Tank
o v e r -
. .. , .
I 1 1 I- d F
4 I I
TRAP ANALYSIS / ;.I.. / 1 ,:,\l{.d
Collection Vessel No. p& % ' .
Volume o f Collection Vessel / ?:Q liters - vCv 1 . :, 1:;
. ) ' . / : I .- nun Hg - Initial Vacuum 7 90) pB(2)
pcv(2)
'7'7 -5 . d n m Hg - 7 y -
ROZ mn Hg - Final Pressure CV(1) P
MASS OF CARBON COLLECTED
'VOC(4)
Mn VOC(2) - 'VOC(4) pCv(2) + pcv(l)l [ T("F)+ 460
'/ ' 1 J L t I ; ppm as co2
1 3.467 X X V C V -
1 3.467 X ( ''C) CJ ) ( 7T + 460) = ( - l P $ Y C . ) x c( e c 2 )+( 7'12 M n VOC(2)
= q'/ , 7.7 mg n(2)
M
mg Carbon/liter = __ VS"
mg Carbon/OSCF = mg Carbon/liter X 28.32 - - -
t 1
I
. ..

s I
Sample Loop
3 -
T C A SAMPLE ANALYTICAL SHEET
Std.Conc. $0 Attn. ( P ? d sampFL konc.
Std. Area A t tn . Backf 1 ush
Area p pm
I I <:! /:. i ; j j ~ I , /7 2, q.: y C ) 2 i l 3 .z. If >, I //
CLIENT CEAJrnL & 4 - EbG. DATE TRAP ANALYSIS
TEST NO. 8 0 s 2 - ha-3 ANALYST f i r . i - / I d. TRAP NO. 49 TANK NO. 21-
PROJECT NO. 42-004 ' DATE TANK ANALYSIS i /, 7 /?(! ,
TANK INITIAL - 'BL1) 75% mm Hg
724 nun Hg n i t i a l Vacuum .
(Pre-Test)
TANK FINAL
pB(2) Hg C i - 2 7- mm Hg - Post-Test Vacuum
pT(3) 5-7 nun Hg - F i n a l Pressure T 7 y OF
PT(2)
SAMPLE VOLUME
I'B(2) - 'T(2d - FB(1 ) - 'T(1J ( T + 460) X 0.299 vs =
CvOc(2) = l p q 2 0
MASS OF CARBON I N TANK
'VOC(3) - 'VOC(2)
ppm as co2 - sample
3.'fh - X 4.996 x = m m g / l (6SoF, 760 nun Hg)
- X Vs = mg Carbon i n Tank Mn VOC(1) - 'VOC(3) 6. b@
o v e r

TRAP ANALYSIS
/ Collection Vessel No. I 3 , ~ 1 I ' f ' I Volume o f Collection Vessel 4.@2 liters - V,,
I.
7 q 7 mm Hg D" q< mn Hg - Initial Vacuum
mn Hg - Final Pressure
'B(2)
MASS OF CARBON COLLECTED
3.467 X X Vcv ] - Mn VOC(2) - 'VOC(4) rCV(2) + pCV(l)l [ T(°F)+ 460 'I 3.467 X ( ' - i . c r A M n VOC(2)
Mn = Mn T
mg Carbon/liter = - = Y ' i . 7 "S"
mg Carbon/DSCF = mg Carbon/liter X 28.32

T C A SAMPLE ANALYTICAL SHEET
Std.Conc. Attn. ( P?m )
- 3 1 .? _I .7,,/?., (I : \7.‘+/.:. :9?0 ;.)/ <
Std. Area A t tn . Sample Backf 1 ush
Loop Area
,I L . ~ /I
/1 S e R - Pet43 PROJECT NO. ‘- -00 4 DATE TANK ANALYSIS , //7 / 7 /
TEST NO. M C 2 -Lu-=r J ANALYST Cf i /,-/-I TRAP NO. / / TANK NO. 12-
P
TANK INITIAL ~ TANK FINAL
pBL1) 7% mm Hg p ~ ( 2 ) 7 L f 7 mTI Hg PT(2) Y I I J mm Hg - Post-Test Vacuum mm Hg
mm Hg - F i n a l Pressure 729
n i t i a l Vacuum PT(3) T5y? T 7-f OF (Pre-Test)
SAMPLE VOLUME
Cvo 1 sampFi konc.
p pm , ‘7 ,i A _._ l: I-
- FPB(2) - ‘T(2 j - k B ( 1 ) - ‘T(1J vs - (T + 460) X 0.299
Vs = 1.7$? sample volume - l i t e r s
C V O C ( 1 ) - P T ( 3 ) + ’B(2
cv0c(2) - [‘B(2) - ‘T(2)I -[ ‘B(l) - ‘T(1J
- - y?-/ 12 ppm as co2 - sample CVOC(2)
MASS OF CARBON I N TANK
‘VOC(3) - ‘VOC(2)
Mn V O C ( 1 ) - ‘VOC(3)
X 4.996 X = 4, pa mg/l (68’F, 760 mm Hg) -
X V s = 7, []swr! mg Carbon i n Tank -
o v e r P n t i l l T l n N w r c INP

Mn = Mn(l) + Mn(2)
MnT = ('2 i7&) + ( ~ . l . ~ l )
MnT = 2 9 mg Carbon
T
mg Carbon/DSCF = mg Carbon/liter X 28.32
= 9 7 ;

T C A SAMPLE ANALYTICAL S H E E T
Std.Conc. ( P P I
Attn. Std. Area A t tn . Sample Back f lush
Loop Area
A- - :cn- t* q*D [ m o 3 ; F~! .I?. !, : j 3 0 I F ; ( / . ; $ 1 \I(-) ’2 / 7 4-
CLIENT C E ~ ~ W A L & d -3bCn DATE TRAP ANALYSIS
PROJECT NO. q Z - 0 4 DATE TANK ANALYSIS I / I 7 /7q TEST NO. mdp. 2 ( ~ n ~ r ) ANALYST D fl /i ti
TRAP NO. J/d TANK NO. k; j
TANK INITIAL TANK FINAL
pB[1) 7s/ Hg ’B(2) 747 m H g
P T ( ~ ) ,2U,/ PT(3) zG-3
mm Hg - Post-Test Vacuum
mm Hg - F i n a l Pressure 7a mm Hg . n i t i a l Vacuum
T 74 OF (Pre-Test)
SAMPLE VOLUME
C V O samp(iL konc.
ppm
+ee i / f ! (.>
- ‘ T ( 2 j (T + 460) X 0.299
vs = rpB(2) - k B ( 1 ) - ‘T(1)I
~
vs = [( 7y 46 ’ j x 0.299
’
vS = 3 .163 sample volume - l i t e r s
CVOC(1) - P T ( 3 ) + ‘B(2 r]
- [( 2 5- 3 1 + ( -7+ 7 ,3 [ ( - I 4 7 ) - ( a-0 I )] - [( 7 5 - I ) - ( 7 2 6 ,I
cv0c(2) -[’B(2) - ‘T(2)I - L P B ( l ) - ‘T(1)l
x ( / Y P O 1 - CVOC(2)
Cvoc(2) = ~ - ~ ’ ~ 5 C p p m as C O ~ - sample
MASS OF CARBON I N TANK
‘VOC(3) - ‘VOC(2) X 4.996 X = I ‘39flh mg/l (68”F, 760 nun Hg) -
X Vs = v . .?/s&mg Carbon i n Tank - Mn V O C ( 1 ) - ‘VOC(3)

11:
TRAP ANALYSIS /
Collection Vessel NO. P i 7, / ! I k. Volume of Collection Vessel / c'f:!o liters - Vcv
'B(2) %n Hg Pcv(l) - I t / 3 nun Hg - Initial Vacuum
7 y L- mn Hg - Final Pressure 7
PCV(2) - r/- -7q"F
MASS OF CARBON COLLECTED .- 'VOC(4) 1.x 2. ppm as C02
Mn VOC(2) - 'VOC(4) [pCV(2)
+ 460)
I 3.467 X X Vcv
$3.;6;
T('F)+ 460 ( I f - ~ c
-
= ( ? 3 2 ) x )+( 7 q 3 M n VOC(2)
= C . 5 3 ~ ' rng n(2)
M
Mn = Mn(l) + Mn(2) T MnT = ( i f . 7 q b ) + (L.<?,c?)
MnT = lf mg Carbon I .-/ /,d I
mg Carbon/liter = __ "S"
mg Carbon/DSCF = mg Carbon/liter X 28.32
= .M L I Z . 7
. .
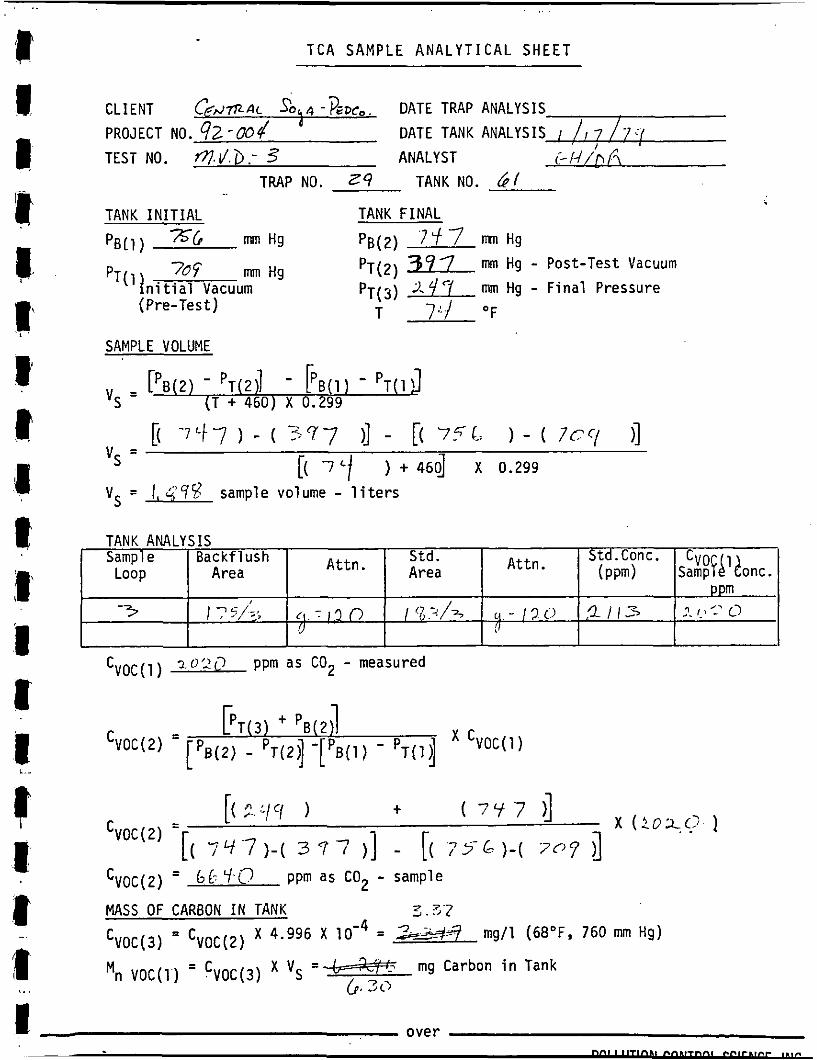
T C A SAMPLE ANALYTICAL SHEET
Std. Area A t t n . Sample Back f l ush
Loop Area
-3 J 75, /7 , C I 7 1.9 0 I ‘6 =/3 /J
CLIENT CfdflAc SO,^ -?EDC, DATE TRAP ANALYSIS DATE TANK ANALYSIS /, 7 / 7 . /
‘ I PROJECT NO. 92-004 TEST NO. f l . d b: 3 ANALYST i- u/n A
TRAP NO. 29 TANK NO. d l
TANK INITIAL TANK FINAL
pBL1) x 6 m m H g ‘B(2) 7 J 7 mn Hg
PT(2) 3 7 7 IMI Hg - Post-Test VaCUUm 709 mm Hg pT(3) a mm Hg - F i n a l Pressure PT( l f . n i t i a l Vacuum
(Pre-Test) T 7.’/ OF
SAMPLE VOLUME
Std.Conc. CVO , p pm
At tn . ( P F ) SampFL konc.
‘1 - / 2 (1 ‘q I I3 2. I.‘ v 0 IJ
rp8(2) - ‘T(2d - FB(1 ) - ‘T(l!I (T t 460) X 0.299 vs =
CVOC( 1 ) L‘T(~) ’ ‘B(2)I
cv0c(2) =[’B(2) - ‘T(2)I -[‘B(l) - ‘ T ( 1 j
x ( i o 1 0 1 t - - . . cvoc (2 )
[( 74-7 ) - ( 3 7 7 ) ] - [( . 7 5 6 ) - ( 7 0 7 ;1 cvoc (2) = 6L: 7-$ MASS OF CARBON I N TANK 5 . 3 . z
‘VOC(3) ‘VOC(2)
Mn VOC(1’) - cVOC(3)
ppm as C02 - sample
X 4.996 X = mg/l (68”F, 760 mm Hg)
- X Vs =* mg Carbon i n Tank 6.3i,
1 o v e r

. .
P TRAP ANALYSIS
Collection Vessel NO. 4 -j,7,<7/' ' I y Volume o f Collection Vessel / &'PO liters - Vcv
PCV(1) 'B(2) 'Lf 4 "g
7Lf .q mn Hg - Initial Vacuum Pcv(21 1 / [ 7 3 mn Hg - Final Pressure E
, I I I
.- I 7 c J c'$L-
MRSS OF CARBON COLLECTED
'VOC(4) *' ' - Mn VOC(2) - 'VOC(4) [pCV(2) + 'CV(1g [ T(OF)+ 460
'n VDC(2)
r 7-2 pprn as C02
I 3.467 X X Vcv - P r
t
3.467 X (
( '7 cT; + 460) = ( < 7 3 2 ) x Y C " L )+( 7 9 2
= +. 2.:) I- rng g Mn(2)
rng Carbon/liter = __ "S"
rng Carbon/DSCF = mg Carbon/liter X 28.32
= ' 5 - 7
pni I I ~ I ~ ~ N F M t

TCA SAMPLE ANALYTICAL SHEET
Std.Conc. (PW) Attn. Std.
Area Attn. Sample Backf 1 ush Loop Area
, . , q , / . .7, C J l 7, , 7 / /..,; 4: /27J c7 1 3 0 ‘7
-7
I
DATE TRAP ANALYSIS & /7 *T n CLIENT G n I 7 Z 4 L 30,n -Ea
TEST NO. f l I/,a -4 ANALYST PL, / (- DATE TANK ANALYSIS I / / -,7 / - r ‘ 1
I PROJECT NO. 42-00{
TRAP NO. ./7 TANK NO. /d TANK INITIAL TANK FINAL PBLl ) 7 s-6 Hg pB(2) am Hg
pT(li mm Hg nitial Vacuum
PT(2) 170 m Hg - Post-Test Vacuum PT(3) 25-2- mm Hg - Final Pressure
(Pre-Test) T 7‘! OF
> SAMPLE VOLUME
CVO SampFL konc. ppm
/ c/ ‘2 2
rpB(2) - ‘T(2J - pB(l 1 - ‘T(1 !I (T + 460) X 0.299 vs =
vS = 3 . y f 5 sample volume - liters
1.1’3 2 ppm as C02 - measured CVOC(1)
r
MASS OF CARBON IN TANK
‘VOC(3) - ‘VOC(2) Mn VOC(1) = ‘VOC(3)
1.74 - X 4.996 X lom4 = & mg/l (6BoF, 760 mm Hg)
x Vs = mg Carbon in Tank b.0 I

TRAP ANALYSIS
Tr,.*. 2 I v'-l 7
C o l l e c t i o n Vessel No. ,:)
Volume o f C o l l e c t i o n Vessel / [',rjt.! i t e r s - Vcv
'B(2)
Pcv(2) :(/
mm Hg ;</
73%. m Hg - I n i t i a l Vacuum mn Hg - F i n a l Pressure
I , [b: PCV( 1)
_ - f .. 75 - ,F
@ I ' '
E
MASS OF CARBON COLLECTED
MnT = Mn(l) + Mn(2)
5 ( W ) + (,9.3:3 MnT b . C l )
MnT = 2C.3 '-/ mg Carbon
1 Cvoc(4 ) I 3 - 3 ~ ~f ppm as C02
3.467 X lo-' X Vc\i Mn VOC(2) - - 'VOC(4) rCV(2) + p C V ( l ) l 1 T ( ' F P 460
= ( I 5 8 C . $ ) X n V O C ( 2)
mg Carbon/DSCF = mg C a r b o n / l i t e r X 28.32
= / & a
. . .
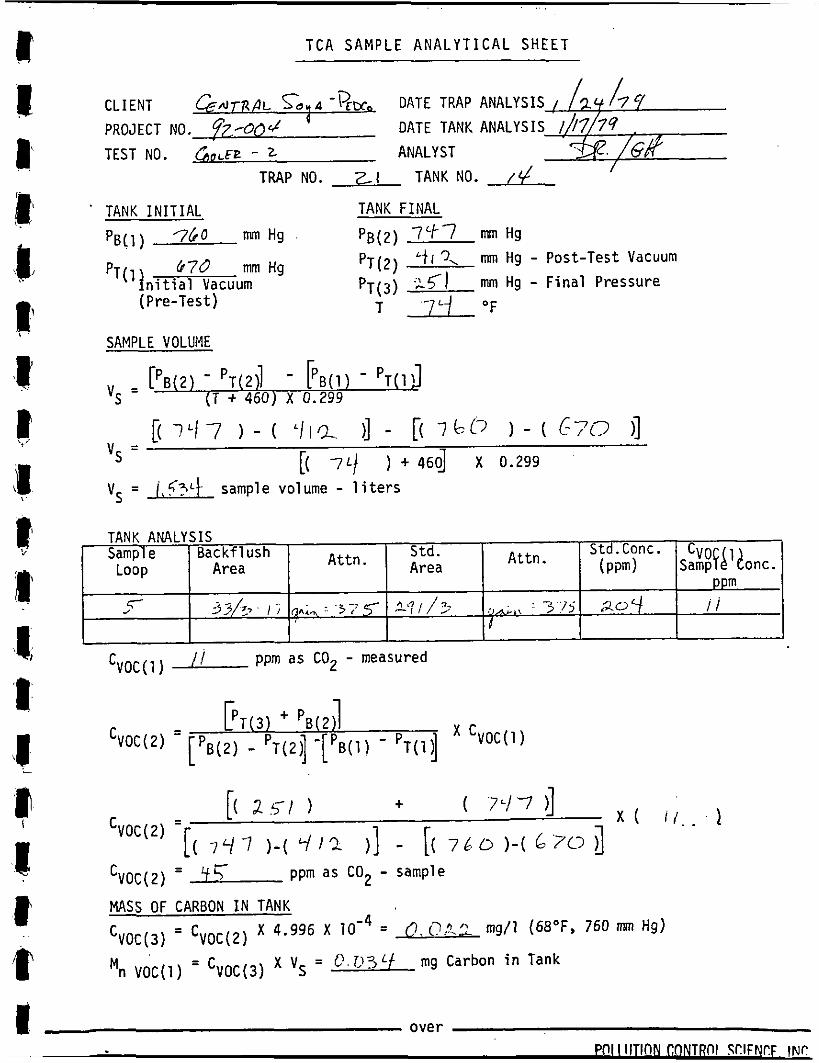
T C A SAMPLE ANALYTICAL SHEET
Std.Conc. A t tn . ( P P I
Std. Area A t t n . ‘ Sampl e Backf 1 ush
Loop Area
, c- ;i? 5, . / i ( p , : ’ 3 ; ’ S - 1 4 0 [ / 3 ; I ~ r , :yyj 20 d
4 DATE TANK
CLIENT -/JJrR,L? L Ye,a -&c, DATE TRAP ANALYSIS
TEST NO. c&‘EE - 2 ANALYST PROJECT NO. 77- -00 4
TRAP NO. 21 TANK NO. / #
CVO sampFL konc.
ppm
i i
TANK INITIAL TANK FINAL
p B L l ) 7 L 0 mm Hg P B ( ~ ) 7 ‘ / 7 Hg
’ S I 3,
T 7‘1 O F
rnm Hg - Post-Test Vacuum
mm Hg - F i n a l Pressure 670 mm Hg ‘T(2)
’T(3) ‘ T ( l # . n i t i a l Vacuum
(Pre-Test)
SAMPLE VOLUME
LpB(2) - ‘T(29 - p B ( 1 ) - ‘T(1J ( T + 460) X 0.299 vs =
vs =
vS = i , 53~) - sample volume - I i t e r s
[( 7 L / ) + 46d X 0.299
r 1
CVOC( 2) = 47 ppm as C02 - sample
MASS OF CARBON I N TANK
‘VOC(3) = ‘VOC(2) X 4.996 X = 0. (3$.2 mg/l (68OF, 760 mm Hg)
. . - x vs = 1 9 . 7 ) 3 L f rng Carbon i n Tank
Mn VOC(1) - ‘VOC(3)
ove r POI I IlTlON CONTROI SfYFNCF. IN!
I

TRAP ANALYSIS
C o l l e c t i o n Vessel NO. k. L' I Volume o f C o l l e c t i o n Vessel : 9 0 0 P
Pcv(1) - pcv(2)
d' I ,
l i t e r s - Vcv :'J (:I mm Hg
7 3 ~ : nun Hg - I n i t i a l Vacuum 7 i.(~ mn Hg - F i n a l Pressure
B(2)
MASS OF CARBON COLLECTED
'VOC(4)
Mn VOC(2) - 'VOC(4) lCV(2 ) + 'CV(1)I [ 9.17 -1 ppm as co2
3.467 X X Vcv T("F)+ 460 -
'3 3.467 X ( / ~ " ' "
][ ( 7'/ + 460) = ( a 1 1 7 x qb-r? )+( 7-39
M n VOC(2)
Mn(2) = 3.325 mg $
MnT = Mn(l) + Mn(2)
Mn !: ?;,f7
= ( 0.[>7L/) + ( -3)
= H 0 3 5 d \ mg Carbon
T
MnT
mg Carbon/l i t e r = - MnT = I. 5 I 35.4 ' = 6 . 2 .,y vs" /.:;'3y )
mg Carbon/DSCF = mg C a r b o n / l i t e r X 28.32
- - b'::.-7
. . r
POLLUTION CONTROL SCIENCE, IN? I

T C A SAMPLE ANALYTICAL S H E E T
Std.Conc. A t tn . ( P i d
5- I[ 7;: i.:; 9 5 3 7 c .. ? 1 > / / - . - 7-37.r af
Std. Area Attn. Sample Back f l ush
Loop Area
I
&dreAL-Sov4 -3~bc~. DATE TRAP I
. CLIENT PROJECT NO. ~ Z - O O l ( TEST NO. 3 ANALYST
n
TRAP NO. 27 TANK NO. .5-
TANK INITIAL TANK FINAL
p B l l ) 76_0 mm Hg pB(2) a Hg
PT(2) P T ( ~ )
5 mm Hg - Post-Test Vacuum mm Hg 25-?-- mm Hg - F i n a l Pressure
7'3 n i t i a l Vacuum
(Pre-Test) T 7</ O F
SAMPLE VOLUME
C V O , SampFi konc.
ppm
rpB(2) - 'T(29 - FB(1 ) - 'T(1d (T + 460) X 0.299 vs =
i :
Cvoc(,) /c.:'/ ppm as C02 - measured
CVOC(2) = - 3 7 5 ppm as C02 - sample
MASS OF CARBON I N TANK
'VDC( 3) = 'VOC( 2 )
Mn VOC(1) - 'VOC(3)
X 4.996 X = 0. /'\.7 mg/ l (68'F, 760 mm Hg)
- x Vs = 3. 3 2 5 mg Carbon i n Tank
over

TRAP ANALYSIS
Collection Vessel NO. g/ 1 /,ty':j 7 Volume o f Collection VessLl O B B ~ liters - vCv B(2)
pcv(l) -" --
m m m Hg 726 i"'
3 m Hg - Initial Vacuum Pcv(2) 2 9 7 mn Hg - Final Pressure
P
. . r

I E
Sample Loop
5
TCA SAMPLE A N A L Y T I C A L SHEET
Std.Conc. CVO , p pin
A t t n . ( P ? d SampFi konc. S td . Area A t t n . Backf 1 u s h
Area
-l .? 7 y- :7 /-7 4: I 5 0 / , / A =150 20+ I / /
0 9
CLIENT C F f l R L & A -k:= DATE TRAP ANALYSIS
TEST NO. ~ R V E R Z ANALYST PROJECT NO. 92-004 DATE TANK
TRAP NO. 5/ TANK NO. / p TANK INITIAL TANK FINAL pBll ) 7L76 mm Hg p ~ ( 2 ) 7 4 7 nun Hg
73 4 mmHg pT(2) 5-l.s mm Hg - Post-Test Vacuum n i t i a l Vacuum PT(3) k5 @ mm Hg - Final Pressure P T ( l ]
T 7'; O F (Pre-Tes t )
SAMPLE VOLUME
IpB(2) - 'T (2 j - FB(1) - 'T(1J (T + 460) X 0.299 vs =
CvOc(,.) 7, 7 7 ppm a s C02 - measured
CVOC(1) F T ( 3 ) + 'B(2J
cv0c(2) =['B(2) - 'T(21 -['B(1) - 'T(11
X ( 7 7 j 1 t - - cvoc ( 2)
cvoc ( 2 )
[ c 77 7 I - ( 5-b 3 11 - [( 7 6 0 )-(737! ,I V ' 1 , l Q ppm a s C02 - sample - -
MASS OF CARBON IN TANK
'VOC(3) - 'VOC(2)
Mn VOC(1) - 'VOC(3)
- X 4.996 X = 2 4 s@ mg/l (6B°F, 760 nun Hg)
X Vs = 3 7; K mg Carbon i n Tank -
o v e r
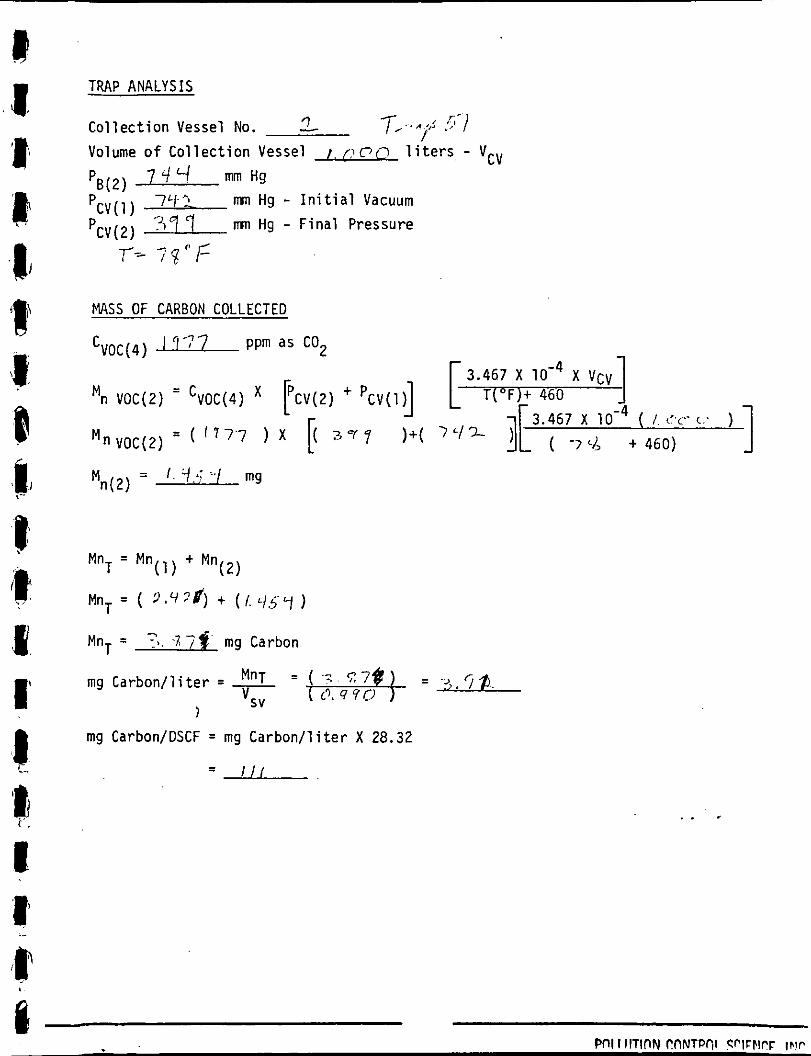
TRAP ANALYSIS
7 Collection Vessel No. - Volume o f Collection Vessel 1 . f , ioy, liters - Vcv
7 '/ 4 mm Hg 7Y I mn Hg - Initial Vacuum
'B(2)
y3y 7 mn Hg - Final Pressure
4 /, '"7 I .I ID-]
PCV(1) PCV(2)
?--% T f y
MASS OF CARBON COLLECTED
Cvoc(4) 1777 P P ~ as CO2
I ?'-- c: 3.467 X ( 1 3.467 X X Vcv
( -7 ./, + 460) = / . f ' y z . / mg
Mn(2)
mg Carbon/DSCF = mg Carbon/liter X 28.32
1 1 1 =
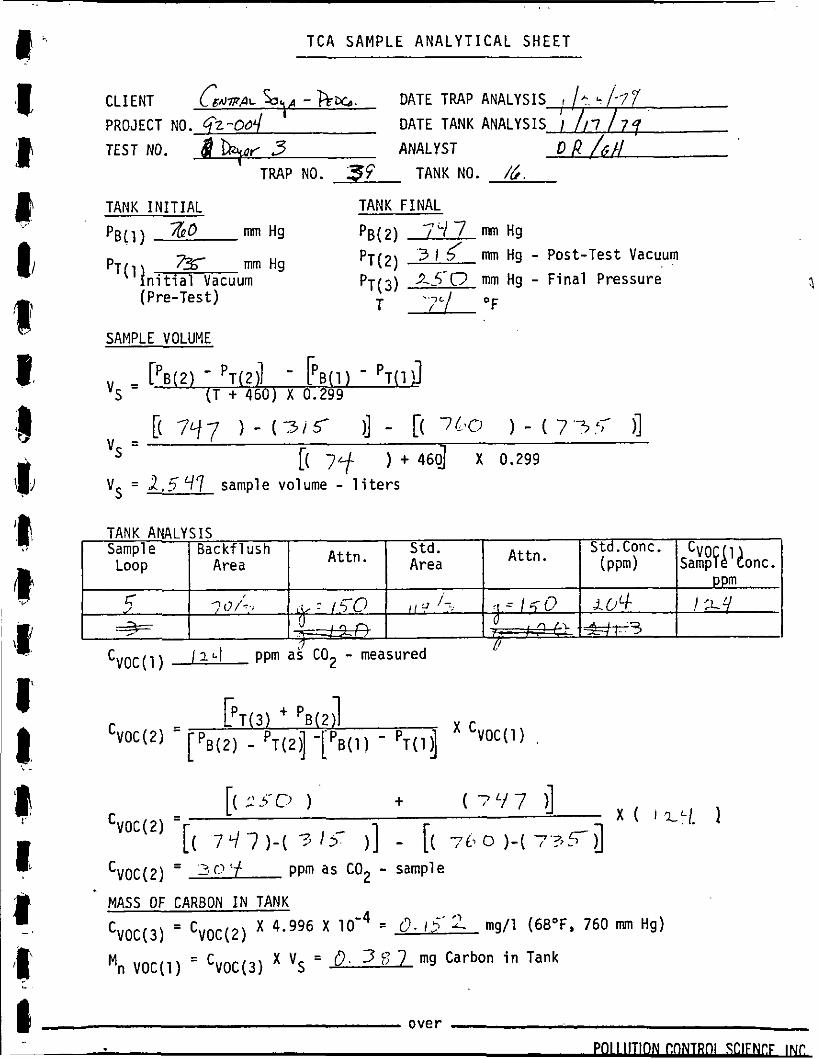
TCA SAMPLE A N A L Y T I C A L SHEET
CLIENT cyJ7Pp~ - hi%. DATE TRAP ANALYSIS ; i;f;; PROJECT NO. @.-OO{ DATE TANK ANALYSIS
TEST NO. 81% fl3 ANALYST D /? /GI/ TRAP NO. 3 9 TANK NO. /b.
TANK I N I T I A L TANK FINAL
p B L l ) m nun Hg PB(2) 7L-17 Hg 3 I f f mm Hg - P o s t - T e s t Vacuum %’-_s-c7 mm Hg - F i n a l P r e s s u r e
mm Hg PT(2) P T ( l ] ’T( 3)
. n i t i a l Vacuum
(Pre-Tes t ) T .7L/ O F
SAMPLE VOLUME
rpB(2 ) - ‘T(2$ - k B ( 1 ) - ‘T(1J (T + 460) X 0.299 vs =
TANK ANALYSIS Sampl e B a c k f 1 ush Std.Conc. C V O ,
ppm A t t n . ( P ? 4 SampFi konc.
S t d . A rea A t t n . Loop Area
c ~ o / ~ . j Lb : I q@ ,, 7 /-. ,[=/qo L& t2-q fJ
1 A, 7. ,! .? I- . * T 3 I C I 0
P L .. +-
I 2 LI ppm a? C02 - measured CVOC (1 )
C V O C ( 1 ) k T ( 3 ) “B(2)I
‘T(21] - L p B ( l ) - ‘T(1$
ppm a s C02 - sample
X 4.996 X 10- 4 = (3.15- 2
Cvoc(2) = z ri :f MASS OF CARBON I N TANK
- ‘VOC(3) - ‘VOC(2)
mg/ l (6B0F, 760 nun Hg)
- X Vs = 0. 3 f; 7 mg Carbon i n Tank Mn VOC(1) - ‘VOC(3)

MASS OF CARBON COLLECTED
7.5-7 ppm as co2,, -+pp~~ 57C.'
L . c c ;,- ,I.,,.
cV0C(4) C b l 3.467 X X V C V -
Mn VOC(2) - 'VOC(4) pCV(2) tpCV(l)l [ T ( O F ) + 460
M n VOC(2) - ( 75.7 I + ( 7 jL3.467 X ( ~
( 7 / . + 460) < ?C) -
mg Carbon/DSCF = mg Carbon/liter X 28.32
- - ,,gl,.x.'+ 1 1- , i f$,
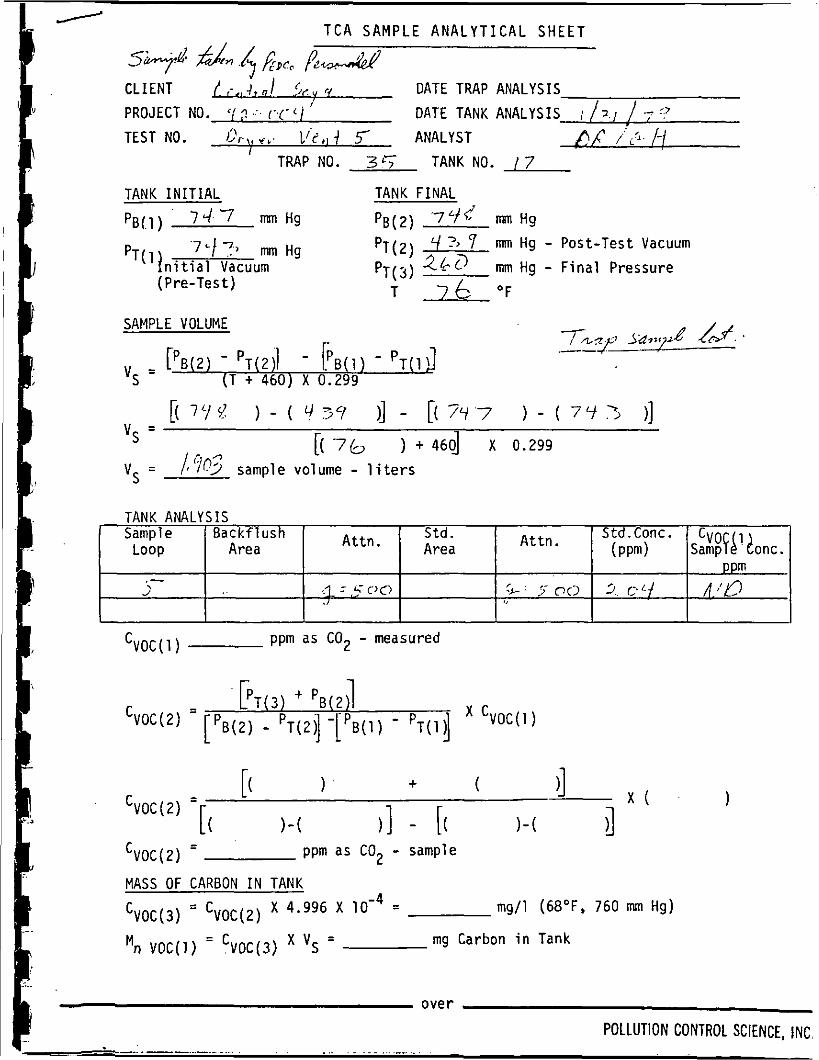
T C A SAMPLE ANALYTICAL SHEET
-5+d &7l .L$ &., fi.& CLIENT 1 ,-,, 4, ,I .sc y DATE TRAP ANALYSIS PROJECT NO. ',! 9 .'. (y- 1 DATE TANK ANALYSIS TEST NO.
1 /..I / _- , r.7
ANALYST A/ ,: , G . -1 Lr.,,r.,' 'I llL',,i 5 I
TRAP NO. 3'; TANK NO. / 7
TANK INITIAL TANK FINAL
p B l l 1 7 4 . 7 ~IUII Hg 'B(2) '7?d m Hg P T ( ~ ) '/ ?, 7 imn Hg - Post-Test Vacuum
mm Hg .J ~f 7.) 263
T 7 & O F
mm Hg - F i n a l Pressure PT(3) pT(l I n i t i a l i icuum
( Pre- Tes t )
SAMPLE VOLUME
I'B(2) - 'T(2)1 - F B ( 1 ) - 'T(1)I ( T + 460) X 0.299 vs =
TANK ANALYSIS Sample 5td.Conc. CVO
A t tn . ( PPm 1 SampFh konc. Std. Area At tn . Bac k f 1 us h
Loop Area p pm
A./O ,- 2 .q = 6- 00 L > @C3 f, C f f
I
ppm as C02 - measured CVOC(1)
CVOC(1) - k T ( 3
cv0c(2) - ['B(2) -
1 + ( - - [( I - ( 1 3 - [( 1-
cvoc(2)
CVOC(2) - ppm as C02 - sample -
MASS OF CARBON I N TANK
'VOC(3) = 'VOC(2) X 4.996 X lo-' = mg/l (68'F, 760 mm Hg)
rng Carbon i n Tank - Mn VOC(1) - cVOC(3) 'S
I
over
POLLUTION CONTROL SCIENCE, INC

TRAP ANALYSIS
Collection Vessel NO. (p Volume o f Collection Vessel /.O~O liters - vCv 'B(2) 72(pm Hg Pcv(,) 72s mn Hg - Initial Vacuum
2qr mn Hg - Final Pressure
mg Carbon/DSCF = mg Carbon/liter X 28.32
= I P . ' / ( i
POLLUTION CONTROL SCIENCE, INC.

DATE TRAP ANALYSIS ;/;;,(;'T - 7 0 PROJECT NO. ? 1 - c'c' L! DATE TANK ANALYSIS
TEST NO. ANALYST , P A ,.,'..I L l L+.i?,,r<,. l'<'; t f . ' TRAP NO. 1.4- TANK NO. /
TANK INITIAL TANK FINAL
PB(1) 7q-1 Hg 'B(2)
P T ( ~ )
7;f d mn Hg %z-/ mm Hg - Post-Test Vacuum
T 71- "F
7q7 mmHg n i t i a l Vacuum P T ( ~ ) 2 mm Hg - F i n a l Pressure
( Pre- Te s t )
-- SAMPLE VOLUME I .'
vs =
TANK ANALYSIS Sample Backf lush Std.Conc. C V O
A t tn . ( P P d sampFL konc. Std. Area At tn . LOOP Area
ppm
5 f a= 5 o a Q-,'3-00 a09 dB
CVOC(1)
0 1 3 : ' ~ ppm as C02 - measured
- - ,J aC- ppm as C02 - sample C V O C ( 2 )
MASS OF CARBON I N TANK
'VOC(3) - 'VOC(2)
Mn VOC(1) - 'VOC(3) S
- X 4.996 X = dbL- mg/l (6B°F, 760 nm Hg)
X V = . A.) 3L. mg Carbon i n Tank -
over
POLLUTION CONTROL SCIENCE, IN[

\ T C A SAMPLE ANALYTICAL SHEET :-“+ %JL k;s L(o pGwoL L
?. t; -7y + CLIENT C ~ f l A l - &4 - b o . DATE TRAP ANALYSIS PROJECT NO. 92 -004 DATE TANK ANALYSIS
F3;- ANALYST p r̂ /; !.j TEST NO. l o d g e I)F r / TRAP NO. 3 TANK NO. (0 ’
I
TANK INIT IAL TANK FINAL
Ga&; ;; P T ( l ] n i t i a l . . Vacuum
(Pre-Test )
PB(2) 7 L t q mn H9
pT(2) PT(3) .+ mm Hg - F i n a l Pressure 23 mm Hg - Post-Test Vacuum
T ‘7(? OF
SAMPLE VOLUME
Std.Conc. Attn. ( PPm 1
Std. Area Attn. Sample B a c k f l u s h
LOOP Area
5- I J > . :; QrJ : .i r @ 2 0 J
- ‘ T ( 2 j ( T + 460) X 0.299
vs = iPB(2) - [ b B ( l ) - ‘ T ( l J
CVO sampF4 konc.
ppm
AjI3 L
- CVOC(2) -
ppm as C02 - sample - - _._.-.. - CVOC(2)
MASS OF CARBON I N TANK
‘VOC(3) - ‘VOC(2)
Mn VOC(1) - ‘VOC(3)
mg/ l (68OF, 760 nun Hg) -- X 4.996 X = -
.------ mg Carbon i n Tank - ‘S =
o v e r
POLLUTION CONTROL SCIENCE, INC.

TCA SAMPLE ANALYTICAL SHEET C;(pmy& -&.km Ai kQG &+m-.-.,d / __
DATE TRAP ANALYSIS i; j , CLIENT ( < . O + . . G I . i’,.q - ( p
TEST NO. C,, / y - k l’i.,:t 5” ANALYST ,,I,( ,j &: /.I . I. . DATE TANK ANALYSIS /?,/ / ? ,7 PROJECT NO. ‘{ ’1 - L p / ‘
TRAP NO. I 3 TANK NO. 2. j
TANK INITIAL TANK FINAL
pB(.l) mm “9 p ~ ( 2 ) 7 ‘ / .’’ m Hg
i ’
P T ( ~ ) 22c. mm Hg - Post-Test Vacuum mm Hg - F i n a l Pressure
‘7vJ mm ~g 1LC
T 7 47 OF
PT(1) . n i t i a l Vacuum PT(3)
(Pre-Test)
A t tn .
- ‘7 Zd. 2 < i -. .5- C’C PI. 7 , L , : L; C’C.,
Std. Area A t tn . Sample Back f l ush
Loop Area
I
SAMPLE VOLUME
Std.Conc. C V O , ppm
( P P d sampF4 konc.
_ - < . l r 2 (:q / .J
rPB(2) - ‘T(2)I - k B ( 1 ) - ‘ T ( l d (T t 460) X 0.299 vs =
C V O C ( 2 ) = 201 ppm a s C02 - sample
MASS OF CARBON I N TANK
‘VOC(3) - ‘VOC(2)
Mn VOC(1) - ‘VOC(3)
- X 4.996 x = c ? . I O i mg/l (68OF, 760 mm Hg)
X Vs = O.Z.qq rng Carbon i n Tank -
o v e r
POLLUTION CONTROL SCIENCE, INC.

I'
,i
TRAP ANALYSIS d3 5
- vcv Volume o f C o l l e c t i o n Vessel /.OOO l i t e r s
'B(2)
PCV(2)
26 m H g 7 2 5 mn Hg - I n i t i a l Vacuum
mn Hg - F i n a l Pressure
<$ 7b0f6
Mn = Mn(l) t Mn(2) T
mg Carbon/DSCF = mg C a r b o n / l i t e r X 28.32
- 17 j , cr7 I. -
POLLUTION CONTROL SCIENCE, INC.

r I I I I I
I' I I I I I I I i
I
i I I
4 . LAB ANALYSIS HEXANE IN CS2 AND MEAL
PEDCo ENVIRONMENTAL, INC.
TO: Mr. .I 'I SUBJECT:
MEMORANDUM
Dale Hershey J Analytical Results of Hexane in FROM: Julianne M. Biqner
DATE: March 2 , 1979
1 FILE:
Carbon Disulfide and Soybean Meal
CC: Bill DeWees Gregg Fusaro Tom Wagner
Attached are the analytical results of the analyses performed i.n our laboratory for hexane in samples collected at Central Soya, Delphos, Ohio. The results include hexane levels in soybean meal samples, hexane levels in carbon disulfide and gross weights for CS2 bottles. A water sample is currently being analyzed for hexane content and this data will be reported to you within the next week. A suitable method for the detection of hexane in mineral oil has not yet been found. A l l procedures reviewed,to date, involve either extensive modification of instrumentation or the purchase of new equipment.
I I
i
I

r ( 1 5
I I
I \
I <
I i
I' I I I< I I I I 1 I I
I
__
i .
.I'
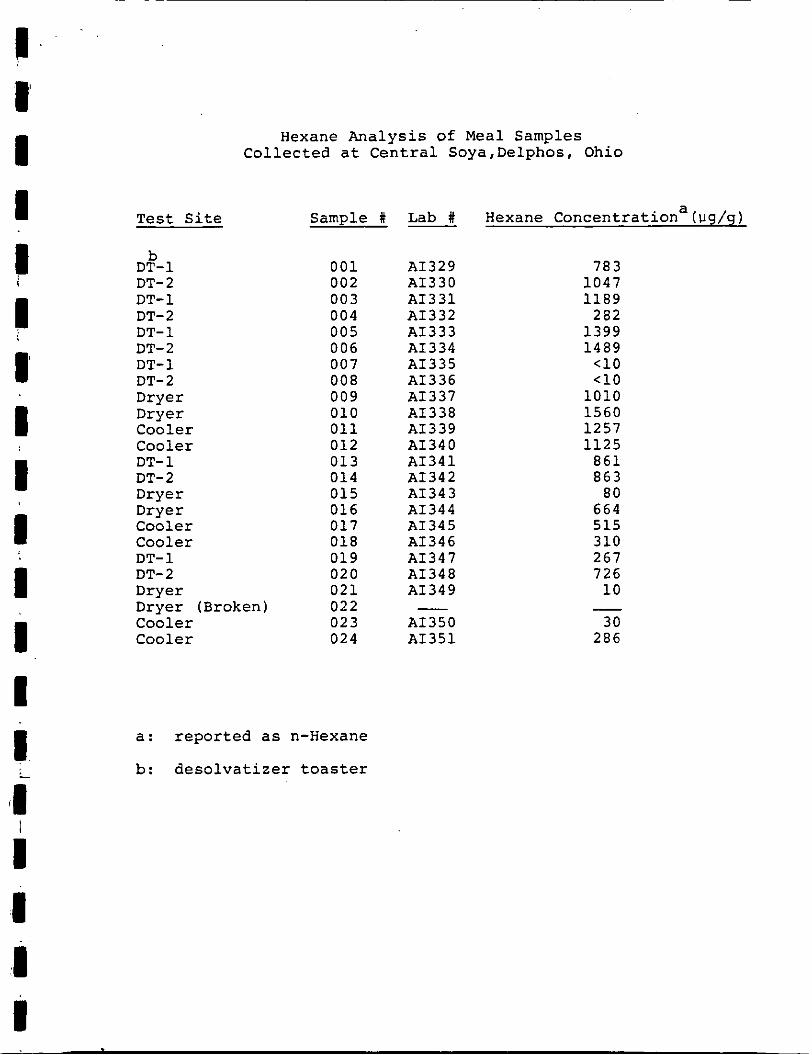
I' I I
I I I
Test Site
b DT-1 DT- 2 DT- 1 DT-2 DT- 1 DT- 2 DT-1 DT- 2 Dryer Dryer Cooler Cooler DT- 1
Hexane Analysis of Meal Samples Collected at Central Soya,Delphos, Ohio
DT- 2 Dryer Dryer Cooler Cooler DT-1 DT- 2 Dryer Dryer (Broken) Cooler Cooler
Sample #
0 0 1 002 003 004 005 006 007 008 009 010 0 1 1 012 013 014 015 016 017 018 019 020 0 2 1 022 023 024
a: reported as n-Hexane
b: desolvatizer toaster
Lab #
A1329 A1330 A 1 3 3 1 A1332 A1333 A1334 A1335 A1336 A1337 A1338 A1339 A1340 A 1 3 4 1 A1342 A1343 A1344 A1345 A1346 A1347 A1348 A1349
A1350 A 1 3 5 1
a Hexane Concentration (uq /q )
783 1047 1189
282 1399 1489 <10 <10
1010 1560 1257 1 1 2 5
8 6 1 863
80 664 515 310 267 726
1 0
30 286
-
i

Analysis Results of Hexane in Carbon Disulfide Samples Collected at Central Soya - Delphos, Ohio
1 Test Site
M. 0. S . b-l (Diluted 1 to 100 M.0.S.-1
M.O. S. -1 Diluted 1 to 100 M.0.S.-1
M.0.S.-2 M.O. S. -2 'I
I M.O. s. -2 M.O.S. -2 M.O. S. -1
' Diluted 1 to 100 M.0.S.-1 M.0.S.-1
[Diluted 1 to 100 M.0.S.-1 - i M.O.S. -2
I
I I I I
M.O. S. -2 M.O.S.-2 M.O. S. -2 D.V. C.V. D.V. D .V. dTrap C.V. C.V. Trap D.V. D.V. Trap C.V. C.V. Trap D.V. D.V. Trap C.V. C.V. Trap D.V. D.V. Trap C.V.
C
Flush CS2 Rinse CS ICs,, for D.V. and C.4..
L Run 4 & 5
Run 4 & 5 I C s 2 fo r C.V. and C.V.,
!..
i
Sample No.
I N - 1 I N - 1 I N - 2 I N - 2 IN-1 I N - 2 out-1 out-2 I N - 3 IN - 3 IN -4 IN -4 I N - 3 IN-4 Out-3 Out-4 1
2 2 2 2 3 3 3 3 4 4 4 4 5 5 5
1
2
-- Lab No.
A I 9 0 0 A1306 A I 9 0 1 A1907 A1902 A1903 A1904 A1905 A I 9 0 8 A I 9 0 9 A I 9 1 0 A I 9 1 1 A1912 A1913 A1914 A1915 A1916 A1917 A I 9 1 8 A I 9 1 9 A1920 A1921 A1922 A1923 A1924 A1925 A1926 A1927 A I 9 2 8 A1929 A1930 A 1 9 3 1 A1932 A1933 A1934
A1935
A1936
a. reported as n-Hexane
b. .Mineral oil scrubber
c. Dryer
d. Cooler
Hexane Concentration"(!Jg/!Ji)
91.2 1.1
1 9 . 6 0 .2 6.5 4.9 1.9 0.8
11.5 0 . 1
12.5 0 .2 2.9 2.6 0 . 8 0.5
c0.01 c0.01 <0.01 <0.01 <0.01 <0.01 c0.01 <o. 01 c0.01 <0.01
0.03 0.01
<o. 0 1 <o. 0 1
0.08 0.02
<o. 0 1 c0.01 <0.01
c0.01
<0.01

Gross Weights of Carbon Disulfide Bottles Collected at Central Soya - Delphos, Ohio
1 Test Site
14.0. S . b-l (Diluted 1 to 100 M.0.S.-1
M.0.S.-1 Diluted 1 to 100 M.0.S.-1
M.0.S.-2 M.0.S.-2 M.O.S. -2 M.0.S.-2 M.O. s. -1
Diluted 1 to 100 M.0.S.-1 M.O. s. -1
(Diluted 1 to 100 M.0.S.-1 M.0.S.-2
i
M. O.S. -2 M.O.S.-2 M.O.S.-2 D.V. C.V. D.V. C
D.V. Trap d C.V. C.V. Trap D.V. D.V. Trap C.V. C.V. Trap D.V. D.V. Trap C.V. C.V. Trap D.V. D.V. Trap C.V.
Flush CS2 Rinse CS for D.V. and C . 6 . ,
for D.V. and C.V., Run 4 & 5
R u n 4 & 5
Sample No.
IN-1 IN-1 IN-2 IN-2 IN-1 IN-2 Out-1 out-2 IN-3 IN-3 IN-4 IN-4 IN-3 IN-4 Out-3 Out-4 1 1 2 2 2 L 3 3 3 3 4 4 4 4 5 5 5
1
2
a. reported
Lab No.
AI900 A1906 AI901 A1907 A1902 A1903 A1904 A1905 AI908 AI909 AI910 AI911 A1912 A1913 A1914 A1915 A1916 A1917 AI918 AI919 A1920 A1921 A1922 A1923 A1924 A1925 A1926 A1927 AI928 A1929 A1930 A1931 A1932 A1933 A1934
Bottle, Gross Weight (9)
189.29 234.86 237.89
232.70 244.95 205.80 245.64 234.85 224.45 244.05 224.14 241.69
233.08 256.40 262.58 246.09 254.96 170.25 252.29 176.79 267.45 170.13
171.00 235.59 165.04 269.40 150.77 225.95 174.05 258.22 111.98 113.09
242.62 ..
248.00
248.58
A1935 121.90
A1936 116.94
as n-Hexane
b. Mineral oil scrubber
c. Dryer
d. Cooler
I
I C

I
I
t
I I
! 5 . WASTE WATER ANALYSIS
I
i

R T &REA AREA X
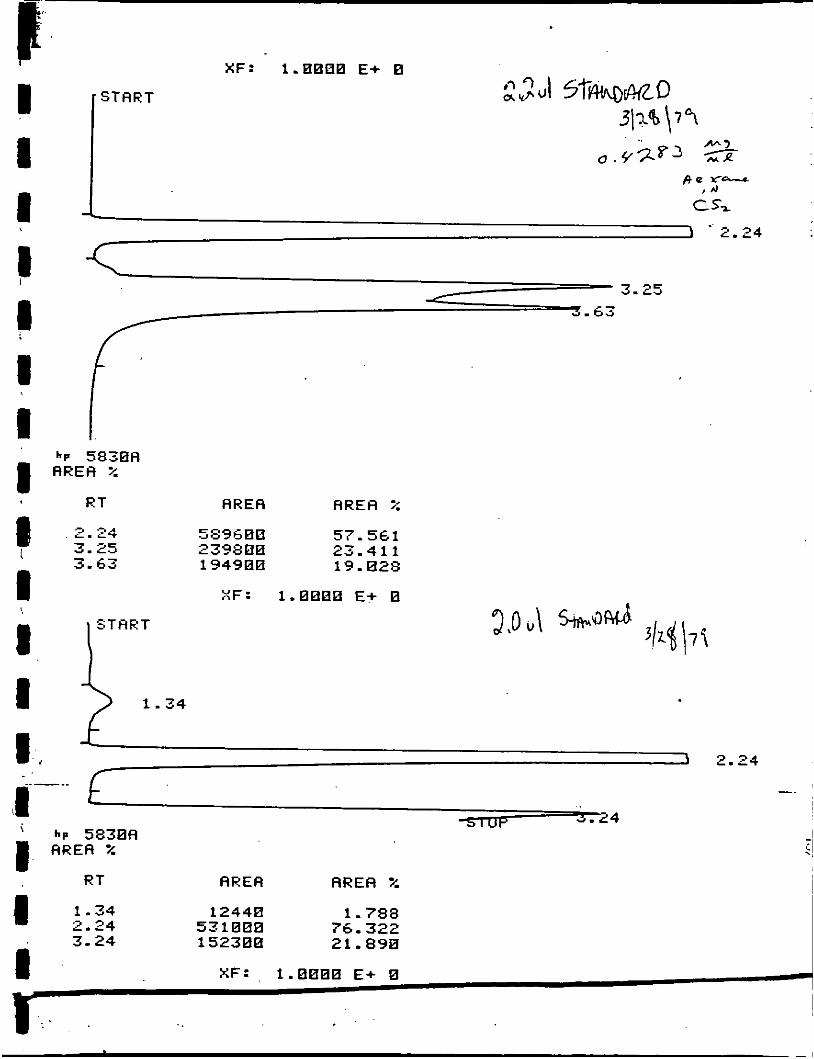
I I I 1 i
I
R T A R E A AREA ::
2.24 3.25 3.63
START I 589688 57.561 239800 23.411 194900 19.828
XF: 1.0000 E+ 0
I, I 2.34
\ I I %
-5--.4 h~ 5830A i
AREA AREA 2 R T
I 1.34 2.24
12440 1.788 531008 76.322
3.24 152300 21.890
I XF: , 1.000B E+ 0
._

I
L
I .
Sample U1 I.D. injected
Wastewater 2.9 1/11/79
3.9
I I B !
4 . 0
WASTE
R.T.
2.17
2.59 2.07
2.17 2.60
2.07 2.18 2.61
WATER ANALYSIS
Area unit
16,800
6,008 5,173
27,981
269,600 7,712
277,312
3,910 18,960 7,220
30,090
Response concen- factor, tration, Pg/AV W / U 1
1.62 x
0.0156
0.0173
0.0122
Average 0.015
I

XF: 1.EEED E+ E
~ 1 ISTART I !
I
. : S T A R T
1 bp 583813 AREA %
I?T
1-69 I
--
AREA A R E A Z
185 188.888
R T
.g 1.85
AREA A R E A Z
367 188.088
.,r - a ---- c. I
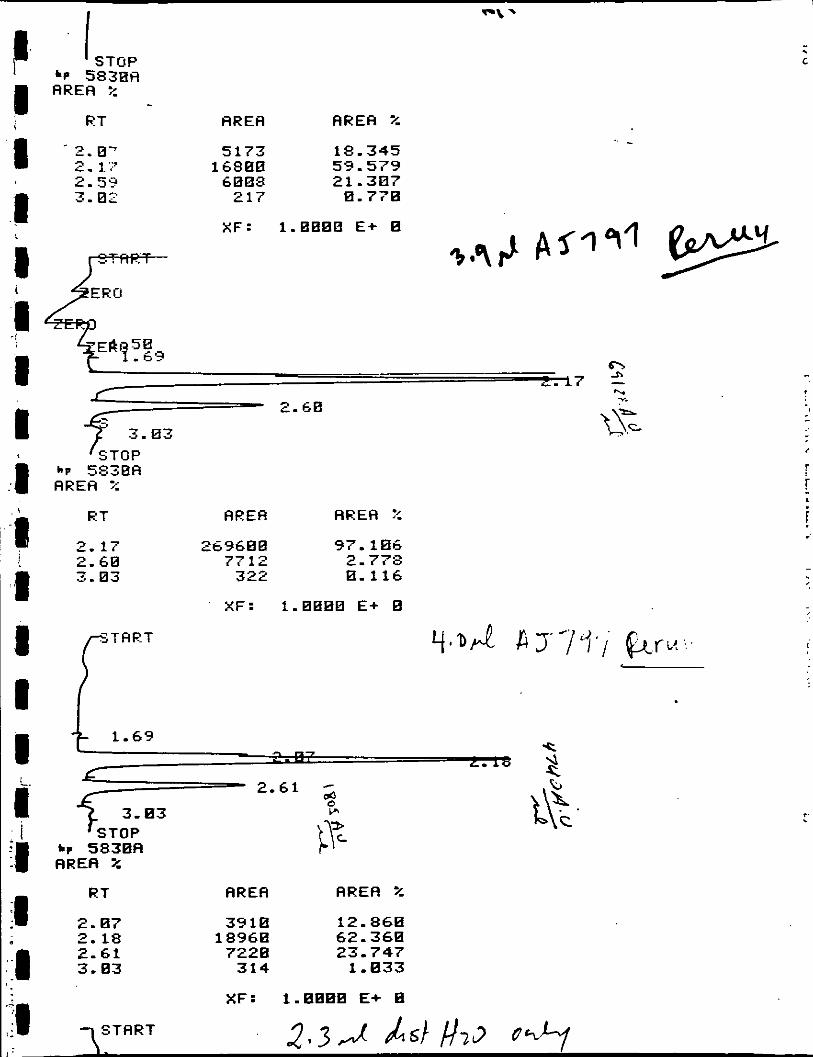
I -\ .
- ~ 2.0' 5173 18.345
2.1 .' 16880 5s. 579 2.59 6B08 21.307 3 . 0 2 217 8.778
X F : 1.8880 E+ E
1 I
- . c
1 I i 4 4 d I I i I I I II
I
fi n r . 7 -
'STOP kF 5 8 3 0 A AREA 7:
RT AREA A E E R :<
2.17 269688 97.186 2.6E 7712 2.778 3.03 322 8.116
X F : 1.8880 E+ B
PTRRT
/ 1.69 I
r L. I
2.61 - %
bt 5 8 3 E A AREA z
R T AREA A R E A z
2.87 3918 12.868 2.18 18968 62.368 2- 61 7228 23.747 3. 83 314 1.033
XF: 1.0808 E+ 0
TSTART
r
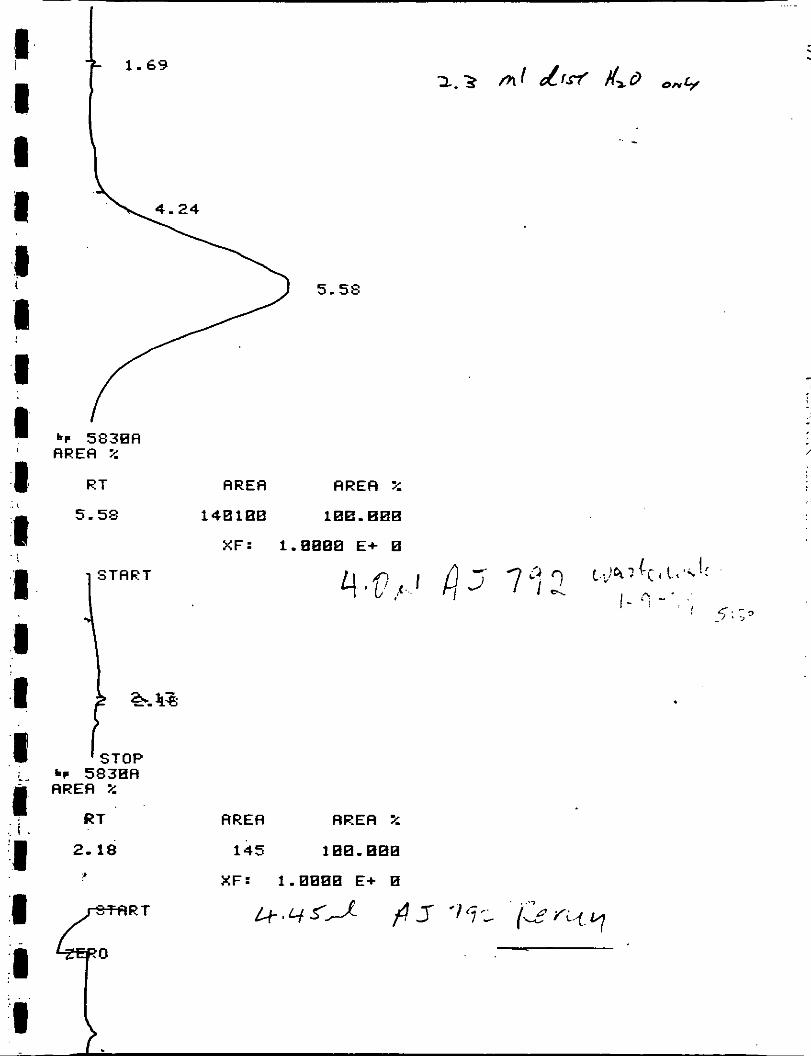
I P
1 I
br 533RA AREA X
RT
5 .53
AREA A R E A %
140188 1 RB. BEE
XF: 1.0000 E+ B
STAPT
a k33
AREA A R E A %
2.18 145 108. E88
AREA .F lop 5 5 3 R A %
RT
XF: 1.8880 E+ E
1:
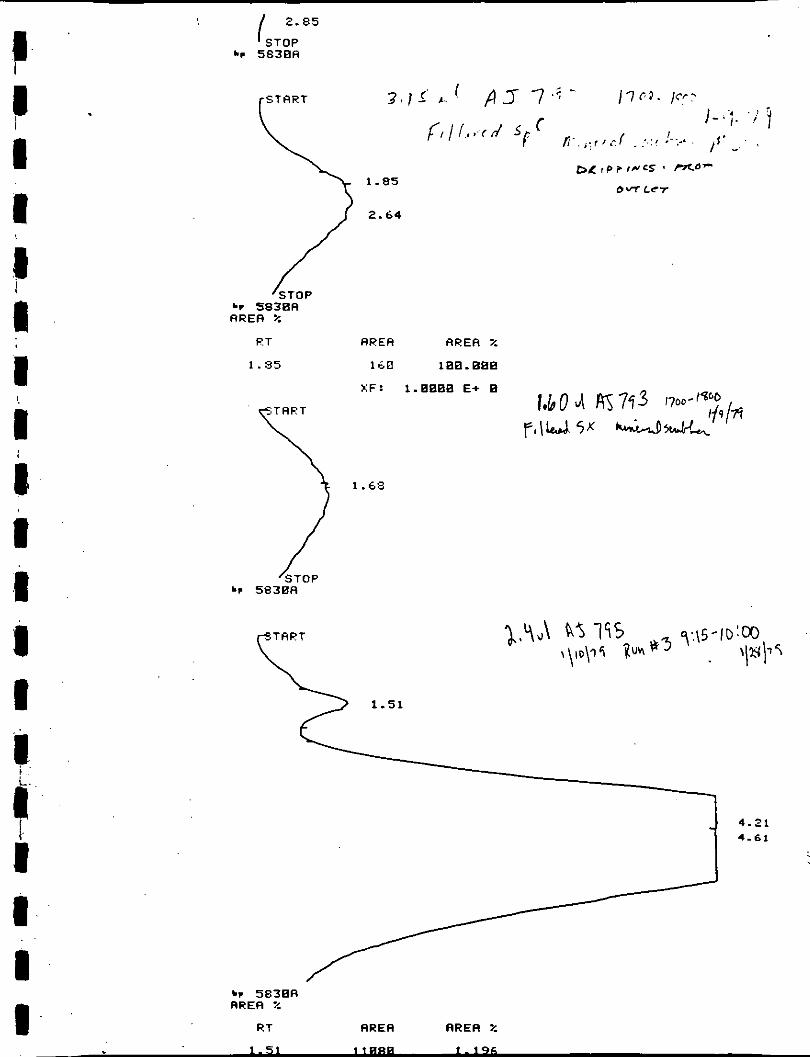
2 . 8 5
k r 5838A
PT
1 .85
f i TAPT
AREA AREA %
1 i iD 188.888
1.68
k r 5 8 3 8 R AREA %
R T RRER RRER Z
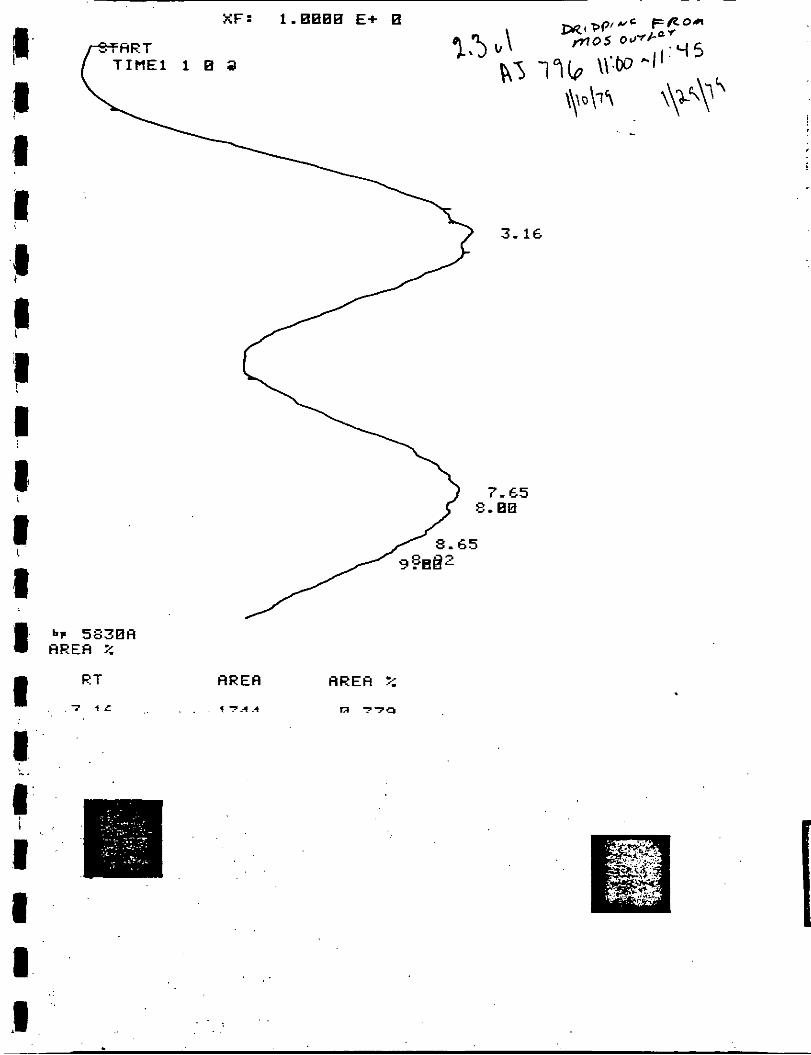
I I
XF: 1.0088 E+ B
p 1 1 0 Z !
br 5 8 3 0 A AREH %
RT
7 i L
i
A R E A
t 7.4 A
, .
. . . .

APPENDIX B
RAW FIELD DATA
I i
1 i

!
I' 0 1
I I !
i i
1. CS2 BUBBLER TRAIN DATA SHEETS

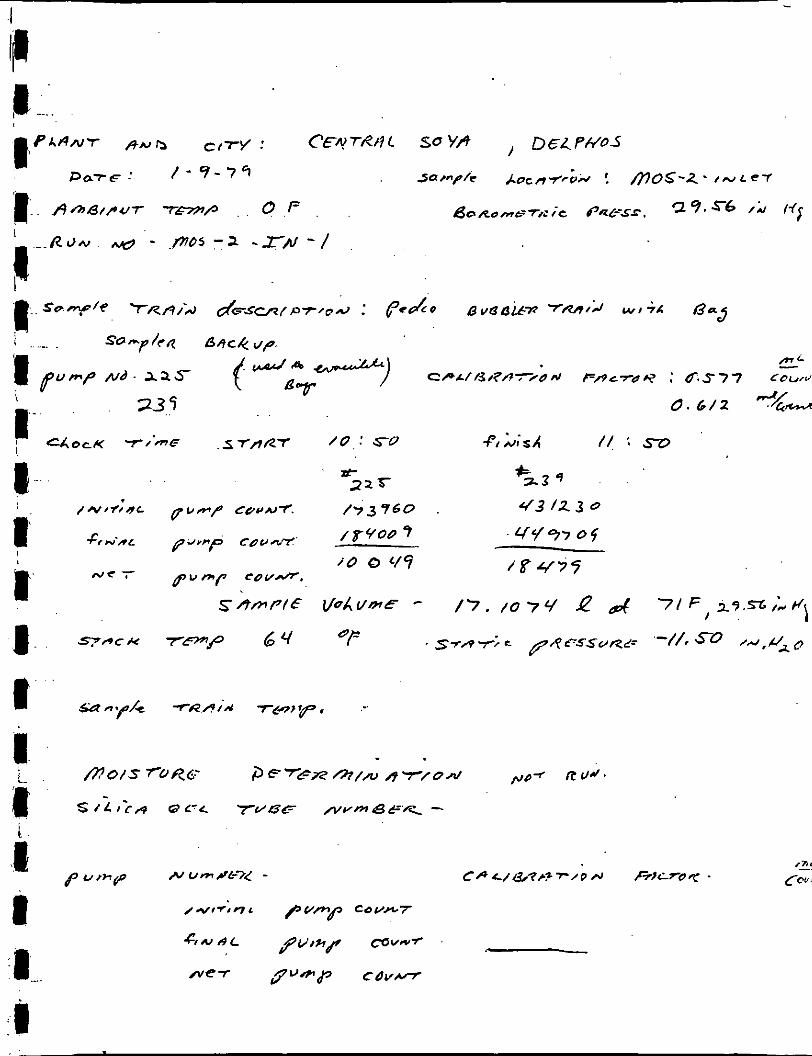
I
'P , C ' .
%3 9

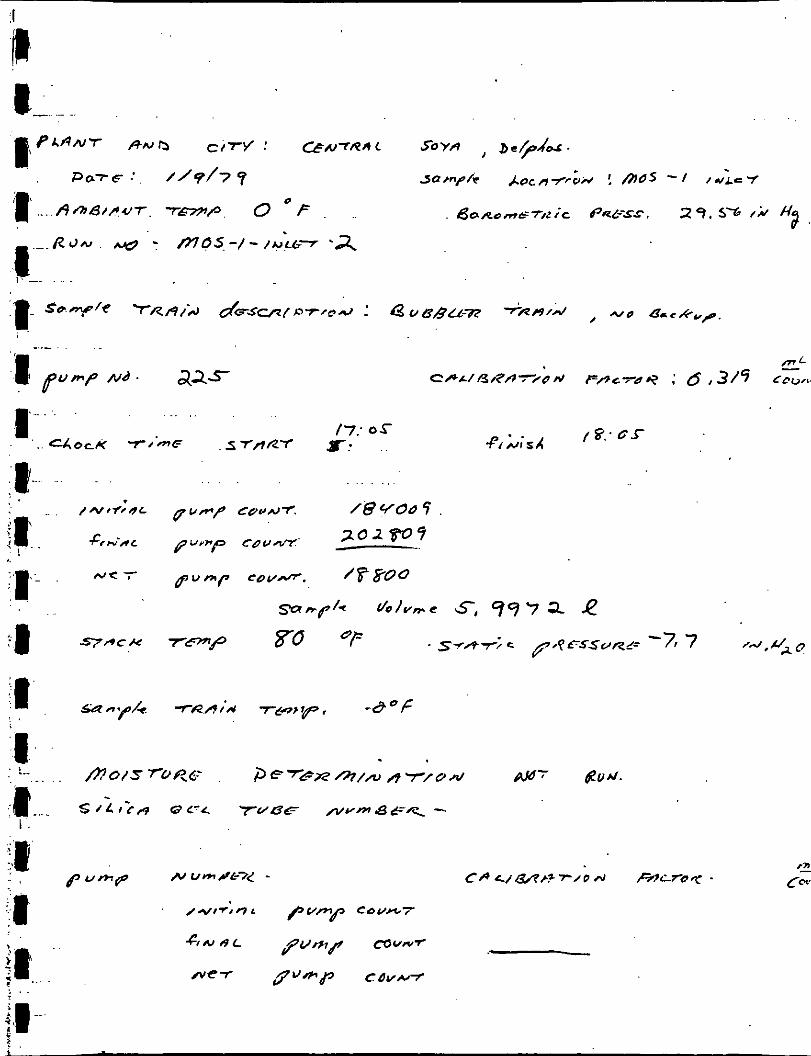
. . . .
$8 i i . . .

. . - - .- . . . .
239
.


:% ....... .
. . .
4: 10
..


a23
. . . . . . . . . . .
;,@ ....

',R'
. . . . . . . . . . . . . . . . . .- . . . . . . . . . . . . . . . . . . . . . , - . . . . . . . . . . . . . . . . . . . . . . . . :&-:aic& - i 7 ; m a ..s-rtvz7 ' ~ I I , .LO 0 . . . +=,>;SA / / :.vr ....... . . . . . . . . . . . . . . . . . . . . . . . . . . . . . . .. -.. - ... . . . -
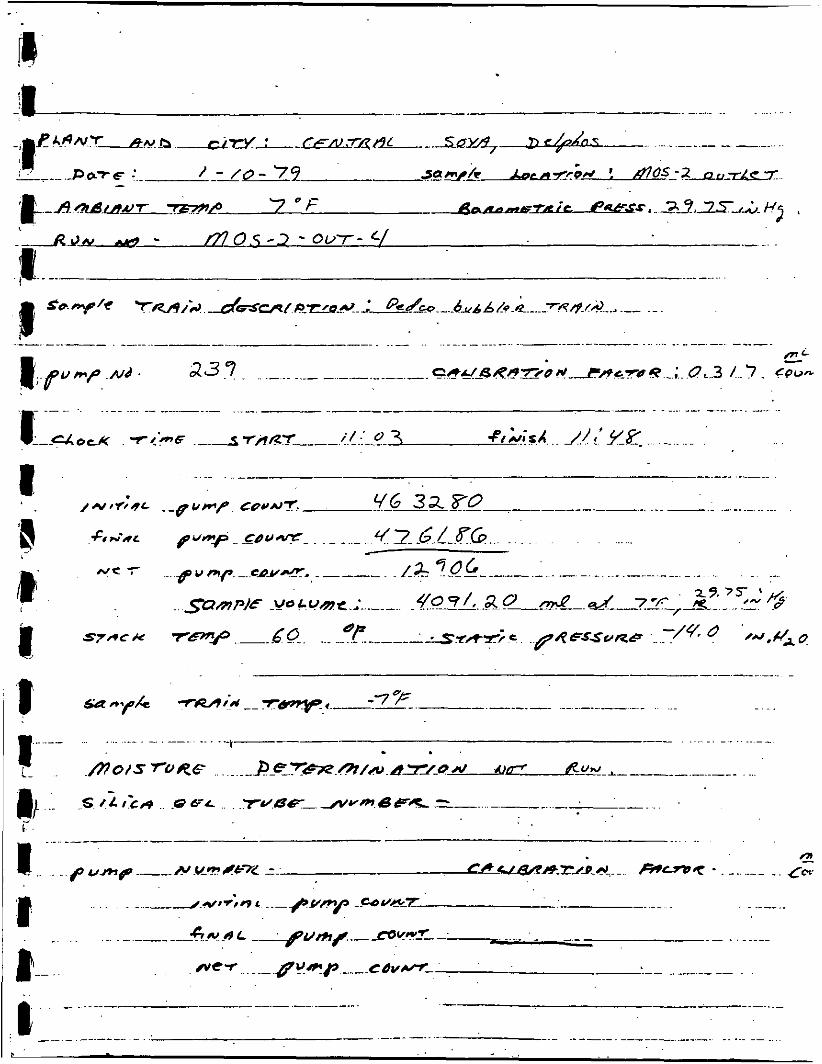
.. .- . .
....
.......... -_i ......... .- -
___ ....... . . . . . . . . . . . . . . . . . . . . ........................... ....
. . ~ . ,
c
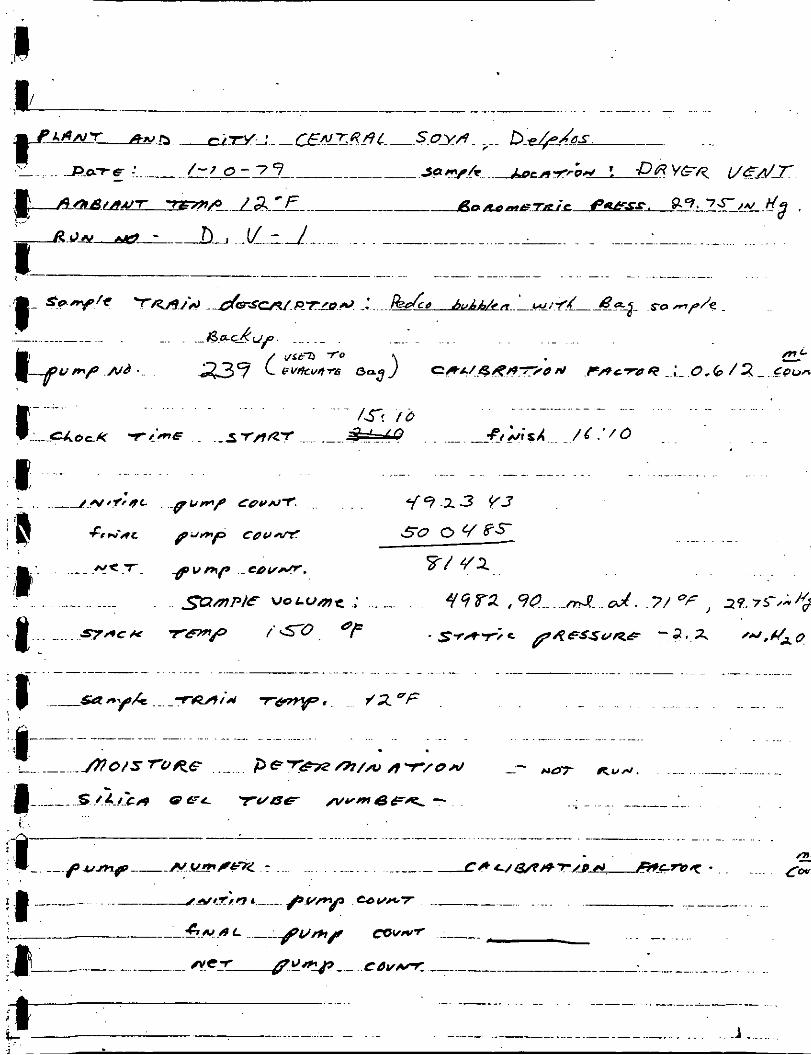
__ __ ... ............. -. .......
,l . . . . . ......
. . . . . . . . .
... ....... ................ ..... ..... .........
... . . . . _ -~a -yA _YRA;~ 7 ~ . /Z uF . - . . . . . . . . . . . . . . . . . .
.. ..... ......... ............. . . . . . . . . . . . . .. ........... . . . . . -
L-. / n o / s rou6- e/& 4 7 / 0 n / - - N o 7 a”&. . _.:
. . A ....... ... . . . . . . . ....
........... ........ ..-__ . . . . . . . A ......

... . . . . . . . . . . . . . . . . .. ................... ..........
. . eF -add -?-<.+!E .-TAR7 i 0 ,:30. P f I ! S X . .... .... L/J5 ... ...
. . . . .
....... . . . . . . . . . . . . . . . . . . . . . . . . . . . . . . . . . . . . . . . .. . - .... .
. ../N*TfleL . tpuwp Coud7. s o / / f72 1. I
...... 5-/2 /e$ ................... j & -
- . . ~
. . . . . . .- ...... -. ...

. .......... -_ ... . .... __._ ........ .
. . . ,. ....... ......... . . . . . . . . . . . . ._
... . . . . . . . . . . . . . . . . . . . . . . . . . . . . . . . . . .
. . ~~ ..... - .- .. . . . . . . . . . . . . . . ... - .
........ '0 . . ..... sa--+ '7#& T 6 . 7 q - n : i l OF . . . .
. . .
. .

- -. -.
1 ... . ..... .... ... . . . . . . .
95.3 32.7 94/ 9 Y 2
__ - .......
. . . . . . . _. ... - ..... - . . . . . . . . . . - . -. ..... -. - - .. - ... - . -_ .. . . . . . . . . . .
. . . . - . . . . . - ...... 4an.yA -e/?;& TW. .. / y o}:
i
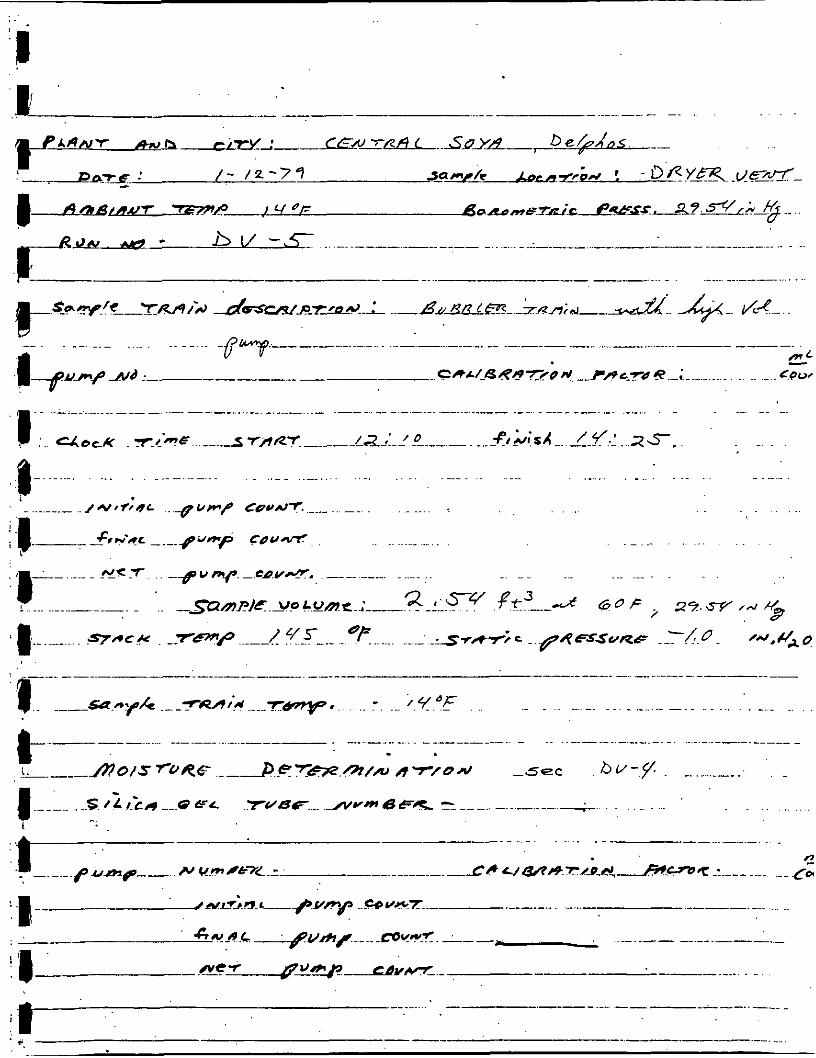
-. ................ -. .. -. .. ......... -. . . . . . . ,:a -_ . . . . . .- . . . . . . . . .
........
. . . . .
. . . . .
.. . . ~.
.~ -_ ........ -
_____.__-- ........ 'i
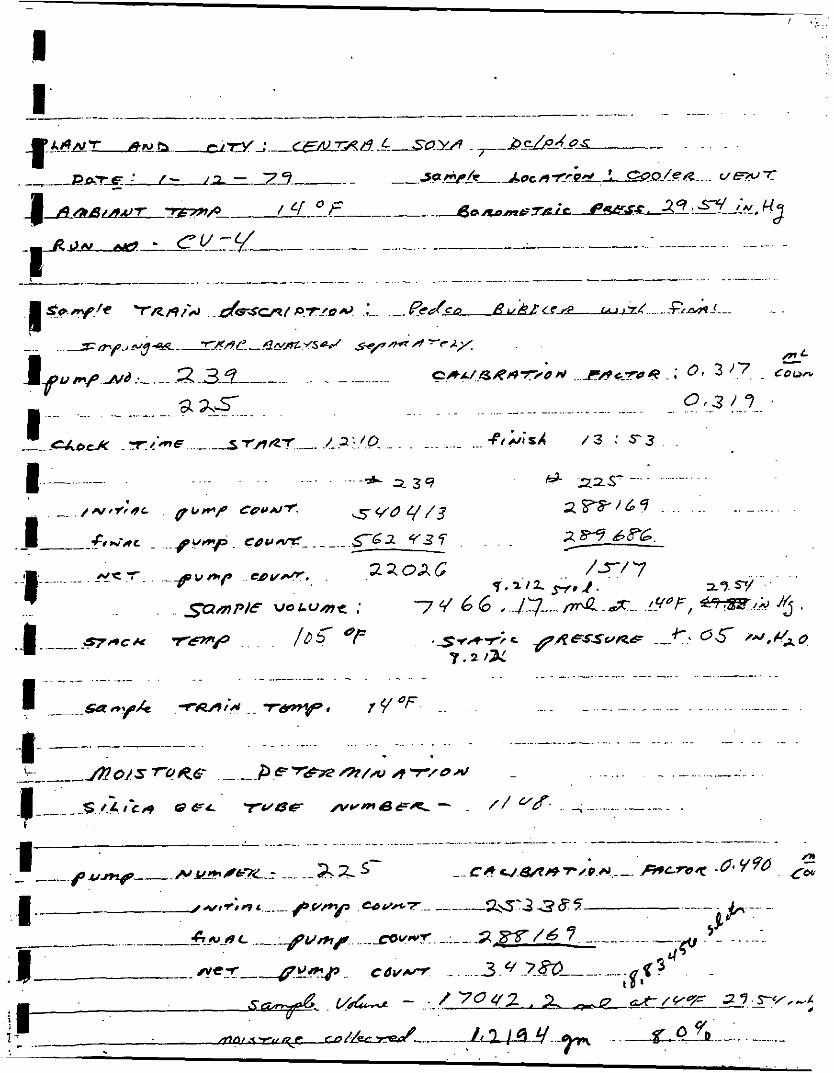
0 . 3 1 9 Y . . . . . . . . . . . . . ._ .. . . . . . . . . . . . ~- ...... ......... - .... a . . I . .
- . . ~ . c ~ o r ~ . y 4 . m ~ 7nr~7.---. .C.Z :.w .............. 41 / 3 S- 3 . .
. -. .. I'
... -. . ....... . . . . . . . ....
. . . . . . . . . . . . . . . . . . . . . . . . . . . . . . . . . . . . .

I
. . . . . .- .- . . . . . . . . . . . . . . . . . . . . . . .

.......... .- - _____ . ~ 1
....... . . . . . ......... - ... .......
I .:. - ! o C K r i m e . s 7ne7 . ~ . .&..:'. 0. * . ,
. . . . . .
f=,>;sx /6 .' 2 .s-.
__ - - ........ -. . . . . . . . . . . . . . . ... .......... - -. . . _ _ - - . . . . .......... .

. .
-- ._ .. . . . _. . . . . . . . . . . . . . . . . _ _ _ __ ...............
. . . ...... . . . . .. .. ___
. . . . . . . - . . . . . . . . . . . .... . . ....
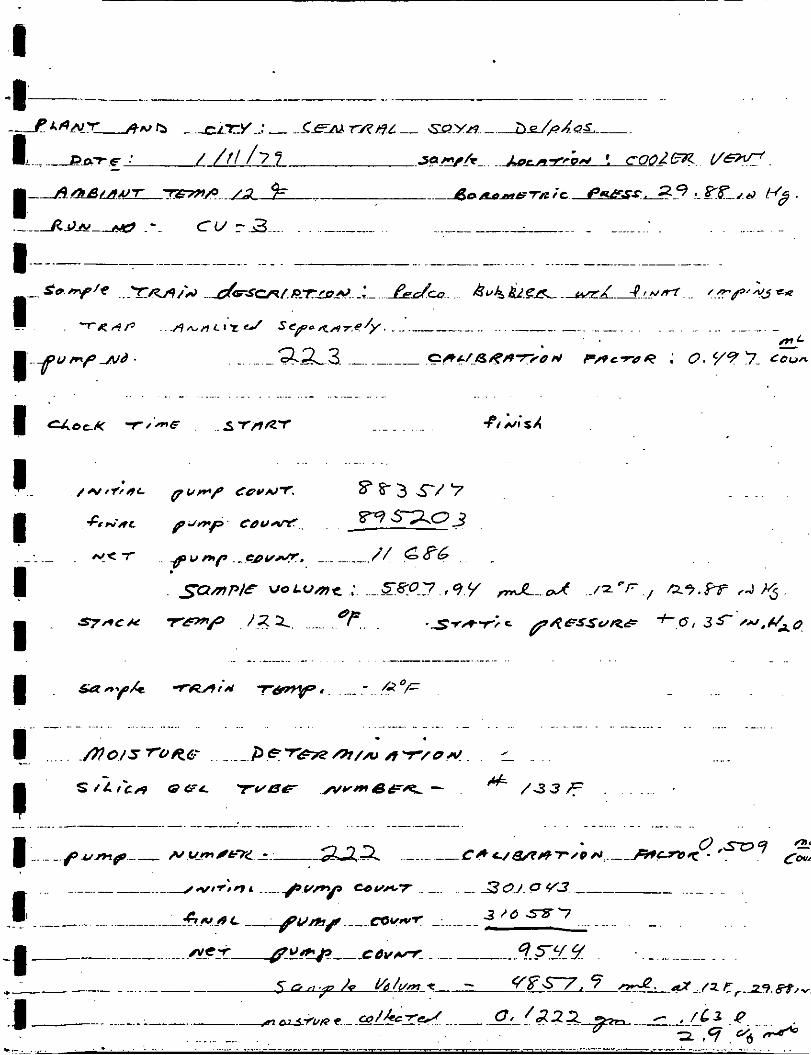
. . . . . - . . . . . . . . . . . . . . . . . . .- ... .....
I cXocK 7 d ' m F . .S-?-HR-f ...
...
4 , ; / ; s x
... -. . . . . - . . . . .
I . sa-.//& TW.. ..__:..!J0F
I
.. . . . . . . . . . . . . . . . . . . . . . . . . . . . . . . . . .... ....... - . . . . , ... .- . . . . . -. ... . I -- ..... .#7o/s ~ ~ U C . . ?.e7-/31/m n7/OA!. . L . . . .
s , i r k d QGL 7 ~ s ~ ./vvrn6&=% - A= / 3 3 F . . . . . .
. . . . . . .
-. . . . . . . . . . . . . . . . . . . . . . . -. .- _. ...... .-
. . ............... - ............. . . . . . ........ . . A,. ...,.. _-__. - .......

I I I, I I I I I i I I I I I -..
I I I I I
0
2. TCA SAMPLE TRAIN DATA SHEETS

Date
Tank Trap
'i . l . J ? . - ? l j Run Number f77(3'/ / E J LET ,2 J, I , r
Number 7 Barometric Pressure 3 S C , Number tic: Temperature / Y F
Sample IO Number Stack Temperature k l dF
Leak Rate: Pretest c?I r Post Test
Tank Vacuum (inch Hg): Pretest (manometer) J $ , I- (gauge) a w
Tank Pressure: (manometer.inch Hg)
Post Test (manometer) (gauge) 1
(gauge,psi 1
Comments

1:' I I I I I i I I I I I I I
I I ' 1 . - I
..-.< .... r . .
. ...
I
. . . .
%
+
. .. ,:- I . -..
VOLATILE ORGANIC, CARBON
Tank Number 6 2 Barometric Pressure 2 v. 7 G Trap Number L/L/ Temperature - 7 ,'r- Sample ID Number stack Temperature k/ r-
Leak Rate: Pretest r ? C 5 "/& / 5 0 7 , & Post Test
Tank Vacuum (inch Hg): Pretest (manometer) 38.7 (gauge) 2 2 c Post Test (manometer) (gauge)
Tank Pressure: (manometer,inch Hg)
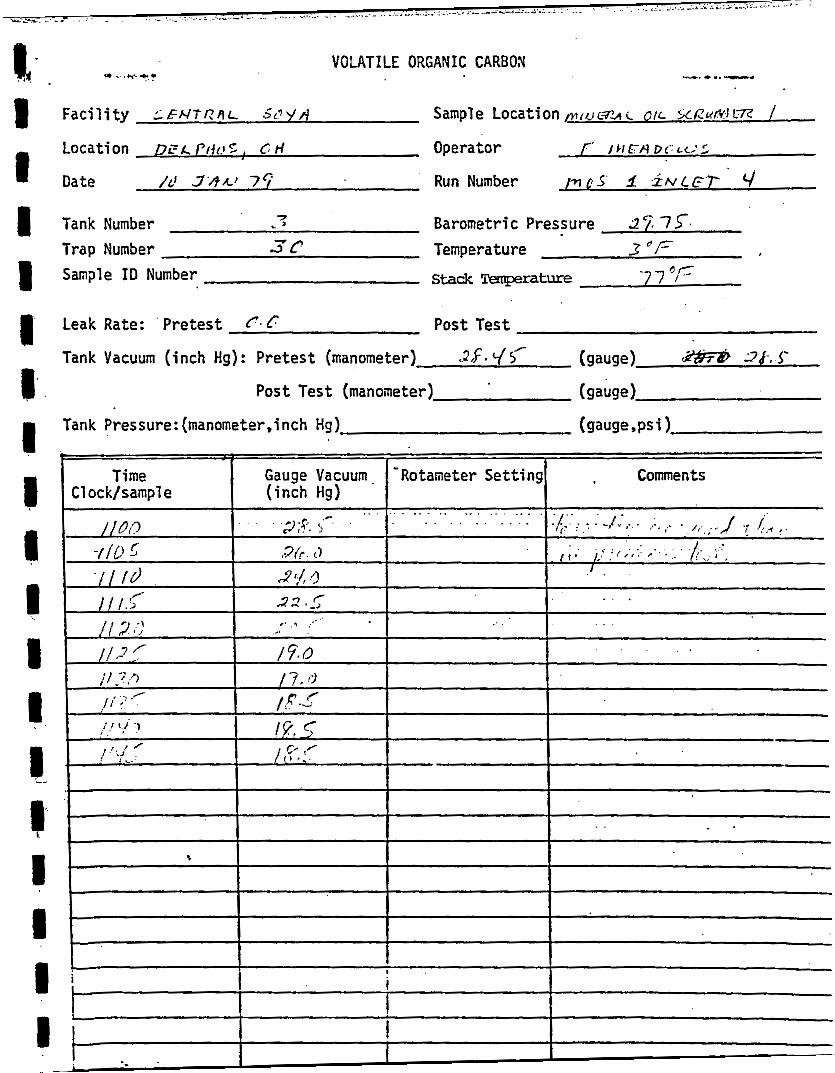
1 t
I I I
I L
I I I I
0 . '*."'f? VOLATILE ORGANIC CARBON
Tank Number .?
Trap Number 3 e Sample ID Number
Leak Rate: Pretest C. L:
.-. * .. -*
Sample Location / n / U C ? 4 i OIL X.CRMVJLZ /
Operator r /tlL7.-H D C L L ' Z
Run Number J ~ C S . i 2 N L F . r ' ~l
Barometric Pressure 3'j. 7-f.
Temperature 3 dF Stack m r a t u r e '7, 0,rr
Post Test
Tank Vacuum (inch Hg): Pretest (manometer) 36. q~' (gauge) ,- 36. . J-
Post Test (manometer) (gauge)
Tank Pressure: (manometer,inch Hg) (gauge,psi 1

. . .i .A=&" :. . ... : ' . . .. , .,. .. . , . . .. .
VOLATILE ORGANIC CARBON
, .I rl I.. 7 </ Run Number mlps 2 T- l u ~ ~ - ~ .-A -I Date 1 1 1 , ,
Tank Number 2 Barometric Pressure ,09,.!!6
Trap Number 2 i Temperature 1s ',r Sample ID Number Stack Teqxature I.s-"i=
Leak Rate: Pretest f. e ''/Is/Lmtcf Post Test
Tank Vacuum (inch Hg): Pretest (manometer) Z F , <- (gauge) as. c! Post Test (manometer) (gauge)
Tank Pressure: (manometer.inch Hg) (gauge,psi 1
I i I I

1. 1 1 I I I I I 1 1 1 I I I t
1 I
I I I ,I
Tank Number "?x Barometric Pressure J7.7, Trap Number L/ <; Temperature 7 .,- Sample ID Number Stack Temperature /TT - - -
I Leak Rate: Pretest e, / Post Test
Tank Vacuum (inch Hg): Pretest (manometer) 2- (gauge) j r & i-
I Post Test (manometer) (gauge)
! Tank Pressure: (manometer.inch Hg) (gauge,psi) 1,
I
~

....... ~- ............
Location bELp,+t 5 bd Operator F / 2 1 R 4 1 ) 0 ( c . ' c '
Date / u 3 4 * l 77 Run Number /)IC< '1 L h l L F 7 - q
Trap Number / / Temperature 7 * ; -
Sample ID Number stack F&lnp3zature ,- I -
Tank Number / 2. Barometric Pressure 2 ?,75-
II , I
Leak Rate: Pretest r. / Post Test
Tank Vacuum (inch Hg): Pretest (manometer) 26,76 (gauge) 2 7 . 5
Tank Pressure: (manometerpinch Hg)
Post Test (manorieter) (gauge)
(gaugeppsi 1
Time Gauge Vacuum. -Rotameter Sett ing Comments I Clock/sample (inch Hg) . . . . . . . . . . . . . . . . . . . . . . . . I 1
. . . . . . . . . . . . . . ...... . . . . . . I / I .- ,{<;.. .: ; ~, * .: , I f ' !' . . . ' . 7. :7, < ' ' . - - 1 r, (I
. . . . . . . . . . . . /!('> '/ I 75,o I ,. . . i . . , . . ' . , - 1:
i 8 t i 5- . . I
* . . .
I
I I

VOLATILE ORGANIC CARaON
Facility LZNTUAA 5cv14 Sample Location ~ a & * a7 ra C,C H ~ C . G- - Location PP12d@5 . , 0 H Operator 1-8 lvlL--jY D<ILC~Z
Date '; .T N A I -1 ' I Run Number ~ V I ~ I L L ' : 'ca-* i Q I ~ C ~ ~ I ~ i~ 2
Tank Number L- ,3 Barometric Pressure 29,'J-h / I '
Trap Number 4 G Temperature /3-= F Sample ID Number stack Tmprature 5-9
Leak Rate: Pretest ,9,6 "/I* / Z r n t , u Post Test C Tank Vacuum (inch Hg): Pretest (manometer) 28' c- (gauge) 27,s'
Tank Pressure: (manometer,inch Hg)
Post Test (manometer) (gauge)
(gauge .psi 1
I I I I I I I
~

VOLATILE ORGANIC CAR3ON
Facility c , s h / ~ ' / i t i ~ ~ 609/A Sample Location m p h r/tarr- D ~ X HAEC-E-
Location p i ? ~ . t ' i ~ ~ . e i i Operator 17 11.l~/+nc;LC;-:
Date /I? S 4 h ' 77 Run Number flitifh' .L?&7 f i ls( H W F < >
Tank Number G./ Barometric Pressure. 2 ' i ,3 5-
Sample ID Number stack T€fqx5ature
7
r? * ,- Trap Number 27 Temperature rr ' F
Leak Rate: Pretest fl. C S ''/+ /5 ~712 Post Test
Tank Vacuum (inch Hg): Pretest (manometer) .? 7. 5 0 (gauge) 2 F , l'
Tank Pressure: (manometer,inch Hg) (gaugemi)
Post Test (manometer) (gauge)
Gauge Vacuum, I (inch Hg) I- Comments I I
'Rotameter Setting
. . . . . . . . . . . . . . . . . . . . . . . . . . . . :,>'.,Q. ,.7 . . . . . . . . . . . . . . . . . . . . . . . . . d ? / /
. . . . . . . . . . . . .
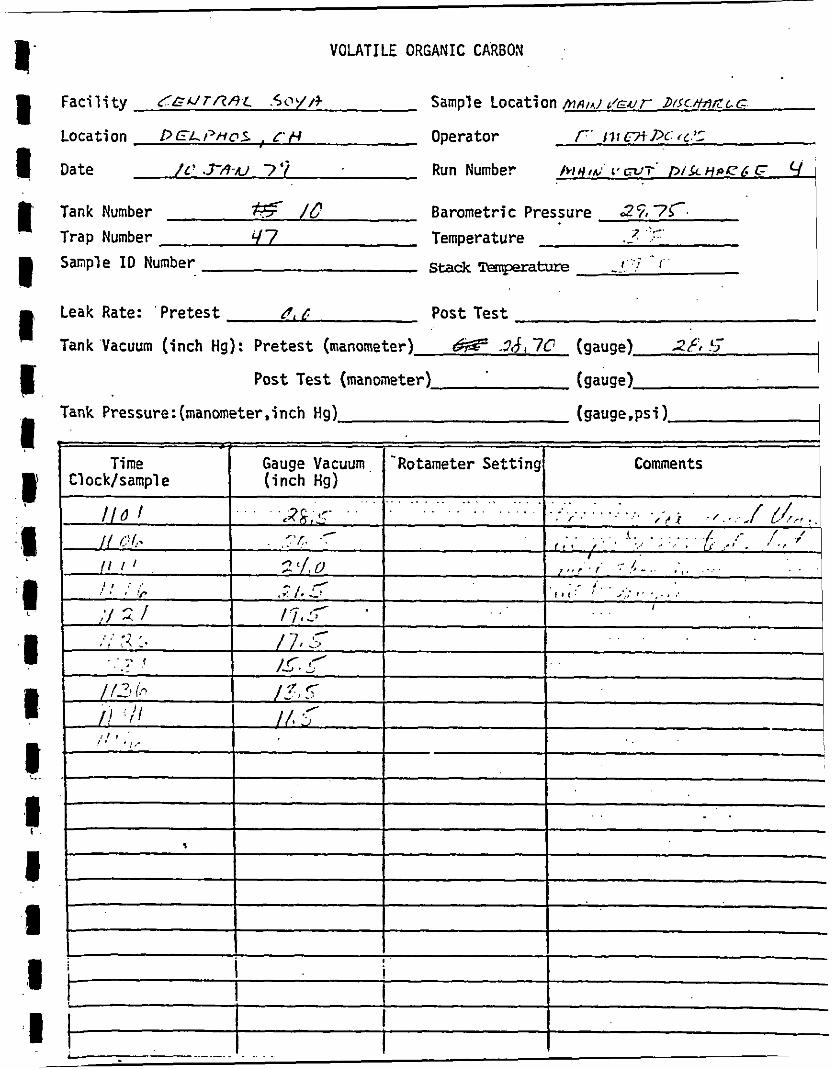
VOLATILE ORGANIC CARBON
Facility / .GLJTRAC .5c>y/F
Location DELt'fioS , rfl
Date IC .J-A-AJ 77
Tank Number 7% /c Trap Number L/7 Sample ID Number
Leak Rate: Pretest rr, 6 Tank Vacuum (inch Hg): Pretest (manometer)- W .?J, 70
Post Test (manoneter) (gauge)
Tank Pressure: (manometer,inch Hg)
i i i I I I I - . . .. . .

.. . . VOLATILE ORGANIC CARBON
Facility ( ~ ~ t r - / f ~ 5 l v / f Sample Location COOLL=T
Location ik=LPffrl5 , @I-/ Operator /r / ) I r n P C ’ c c ~ 5
Date I / 3 r ) E J 7 7 Run Number LcwLeX a Tank Number x / 4 Barometric Pressure $7 7%
Sample ID Number stack Temperature I 2 2 ?=
I
- P Trap Number Temperature
Post Test .I Leak Rate: Pretest . I
Tank Vacuum (inch Hg): Pretest ( r n a n o m e t e r ) Z W ~ (gauge) .e- al&J
Tank Pressure: (manometer,inch Hg)
Post Test (manometer) (gauge)
(gauge,psi 1
I 1 i I
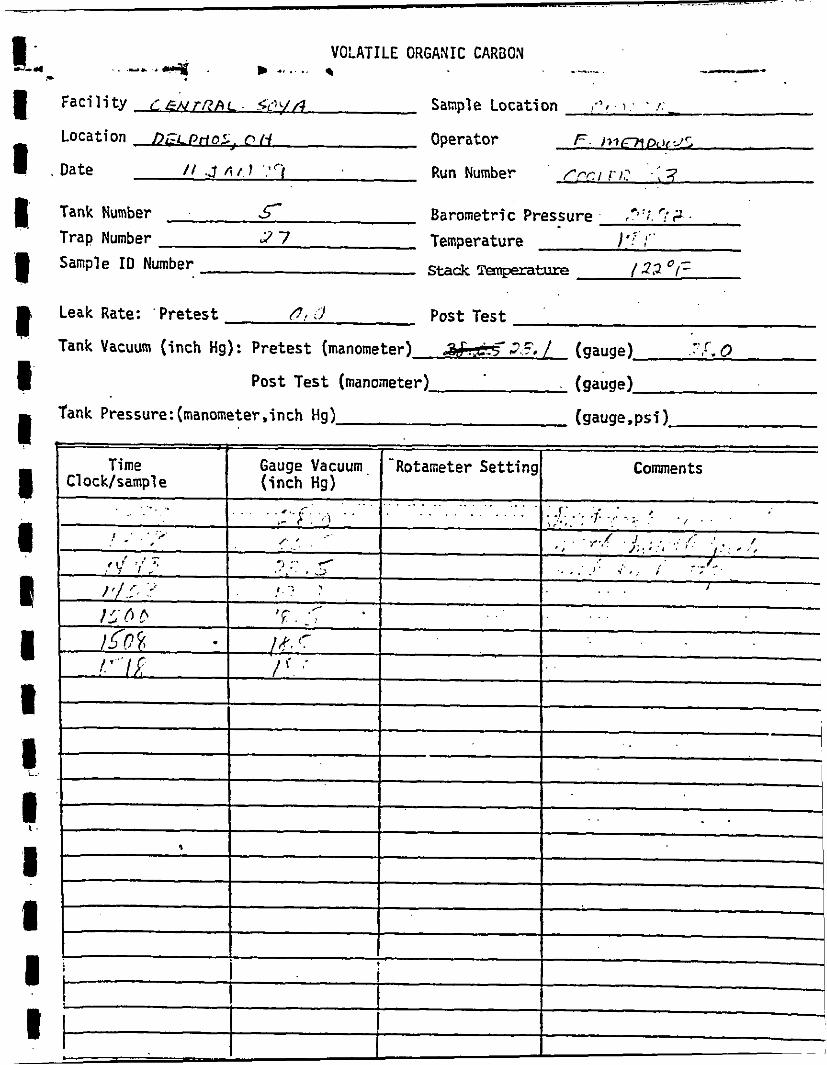
... ~ . .. . .. .. .
Date / / J A t I "i Run Number rrci I' I? 7
6 2 ' ; ?$ Tank Number 5 Barometric Pressure , Trap Number 27 Temperature I , . : ;
Sample ID Number stack "emper- 122 01'
Leak Rate: Pretest 0, .I Post Test -. Tank Vacuum (inch Hg): Pretest (manometer) w- . - C . ' . I C (gauge) ' r . 0
Post Test (manoineter) (gauge) Tank Pressure: (manometer,inch Hg) (gaugemi 1
Comments
. . ' . . .
- . . . .
- 1
I 1 1 I
i i
I
1 '
P I t I

_- . ._: :. . . . .- . . . . . - l'-* .; _... . . .
VOLATILE ORGANIC CARaON
Facility L G W T R A L 5 D yfl Sample Location C o c L t r ?
Location Dc=.LP/fzIs , CH Operator I, / i - ~ x S f t t L / I
Date I / / 2 / Y i Run Number U C ' L €/z Vw7-4
Tank Number 6 Barometric Pressure 33 J s/ Trap Number J 7 Temperature /./*F- Sample ID Number Stack Temperabye /&Lor;
Leak Rate: Pretest c7.0 Post Test
Tank Vacuum (inch Hg): Pretest (manometer) 2&00 (gauge) 23. d
Post Test (manometer) (gauge)
Tank Pressure: (manometer,inch Hg) (gauge,psi 1
otameter Setting Commen ts

VOLATILE ORGANIC CARaON
Faci 1 i ty L € X ' T Z 4-t Sample Location CCOL E?Z &zJT
Location D t 2 P H 0 5 Opera tor t? / 4 € z S / t M
Date / / f 2/7 7 Run Number LOO L kYL . V & V T r Tank Number 21 Barometric Pressure 3?.5-.c/ Trap Number 13 Temperature /{ */= Sample ID Number stack Temperature /05 p
lank Vacuum (inch Hg): Pretest (manometer) 26. v (gauge) 2% c
0 -
Leak Rate: Pretest 8.0 Post Test
Post Test (manometer) (gauge) Tank Pressure: (manometer.inch Hg) (gauge.psi 1
I
. . . .
,
1
I I I
I i i
I I I
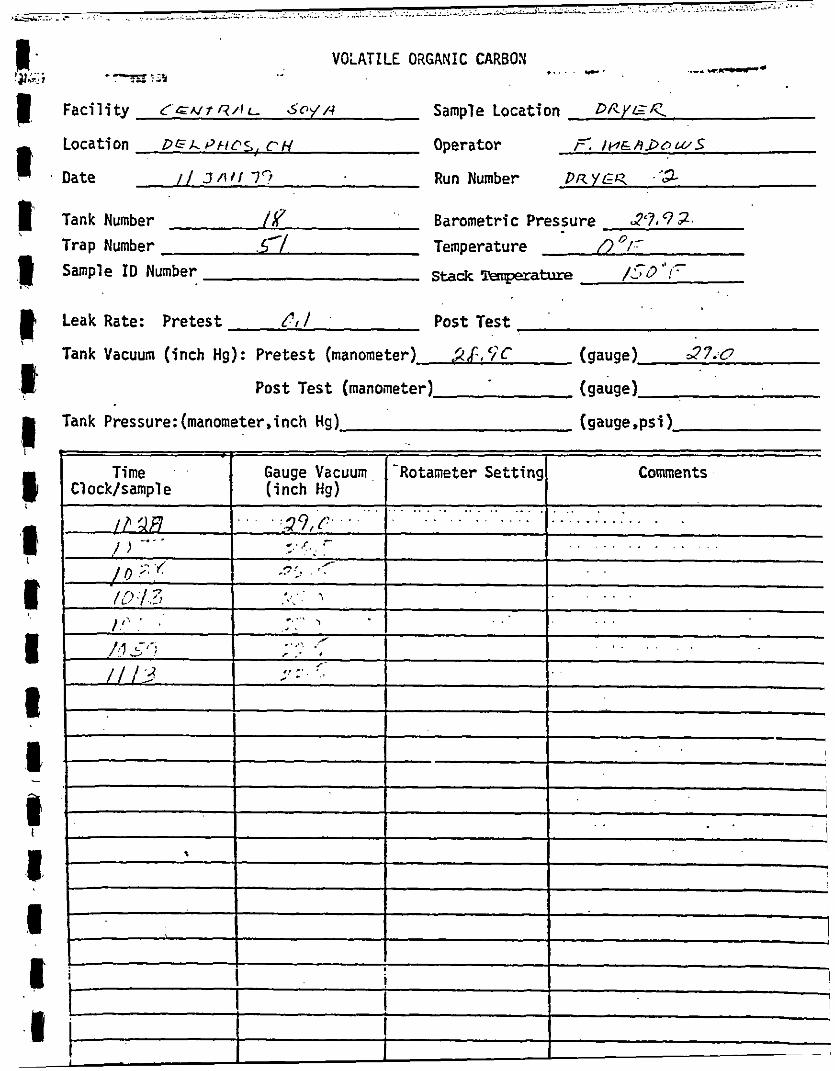
c .-. .c-- VOLATILE ORGANIC CARBON +--?z-3
Facility C . c u f / i A L Sample Location D f f y c C
Location D E x ? k i c s , c~ Operator r'; I v t & H P @ W S
Date I / 3 A l l 7 9 Run Number D R Y G ~ '3
Tank Number I f Barometric Pressure 27,v 2 Trap Number Temperature n I- D /
Sample ID Number stack Temperature /CY(? .' ! 7
Leak Rate: Pretest Pt / Post Test
Tank Vacuum (inch Hg): Pretest (manometer) AJ,?C (gauge) 27.0
Tank Pressure: (manometer,inch Hg) (gaugemi)
Post Test (manometer) (gauge)
- 1 -
. . . . J .
I I
. I - i I i I i
I I ~1
I

VOLATILE ORGANIC CARBON
I
Facility ;,, t !',.: /r r ' ' ; I Sample Location $0 I/ ::;'*-
Date ! I :r I'. J Run Number b/Zi{Ct'<' .:?
Tank Number /G Trap Number 3 7 Temperature I .. ,
Sample ID Number stack Temperature i c e 'F
Tank Vacuum (inch Hg): Pretest (manometer) -'-f ,? < (gauge) ,?.9: 0
Location ]>KL I .' :' 3 .; . ,q H Operator )- I I 1 C.'?! :v>'':...3J , -. I I
Barometric Pressure - ? : , . ' > ,'",
Leak Rate: 'Pretest Ur 0 Post Test
Post Test (manometer) (gauge)
Tank Pressure: (manometer,inch Hg) (gauw,psi)
Time Gauge Vacuum. 'Rotameter Setting Comments Clock/sampl e (inch Hg)
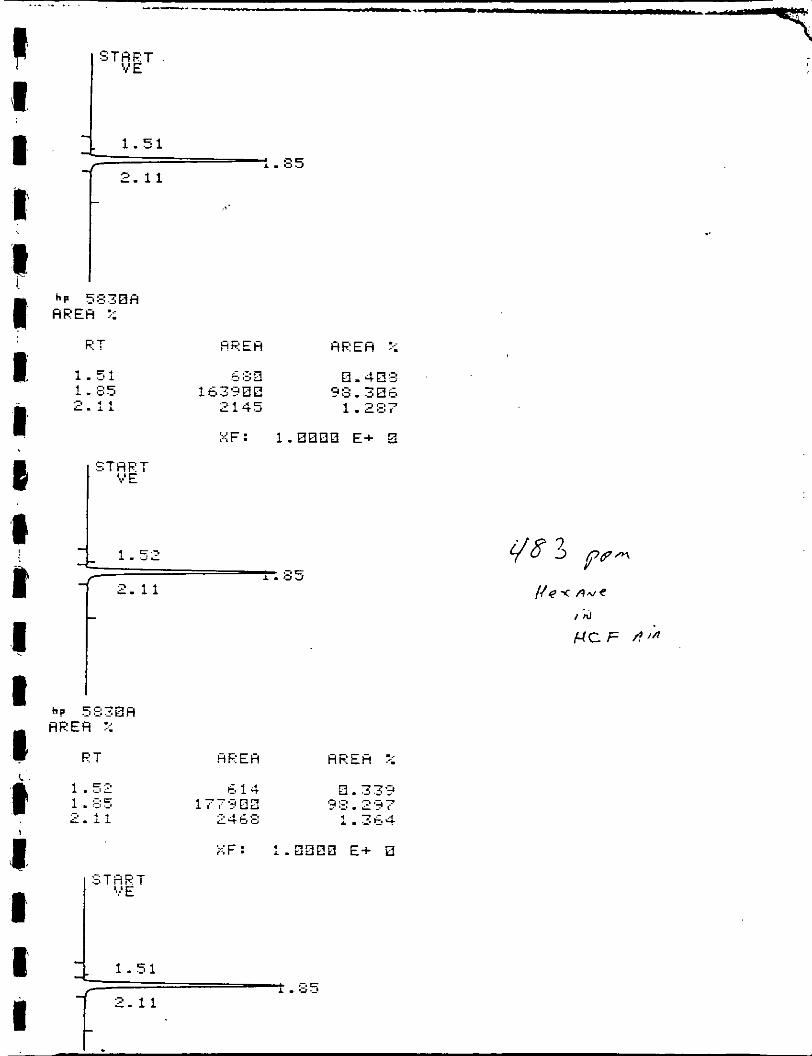
7 .-- . . . . . . .
R T

RT
1-51 1.85 2. 1 1 0
1.51 i * 25
2.11
I I .
!
c-
0

I ... ..-
t

ET HRER
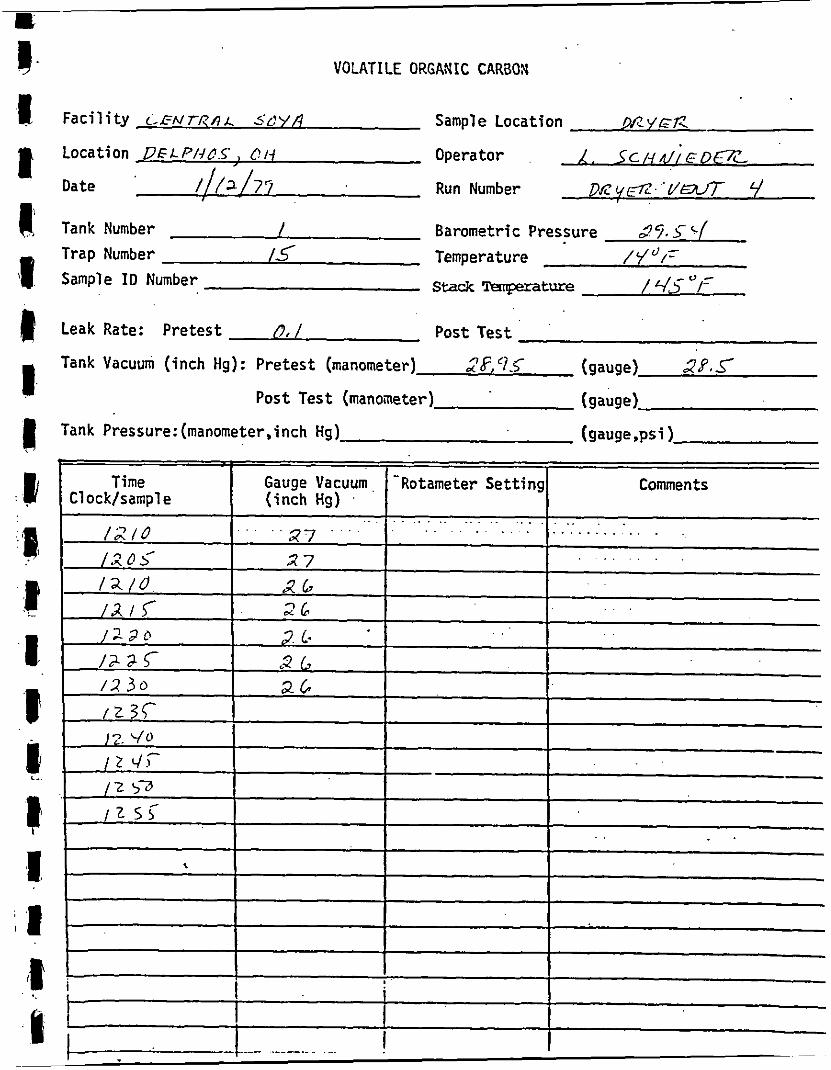
1$. VOLATILE ORGANIC CARaON
It Facility c-m.,r'/3dL sL?y,j Sample Location DR YGK
t @ Tank Number / Barometric Pressure e / 9 =, 5- q
1 Sample ID Number Stack Temperature ,4 - */
Location D E L P N C S , , @ t i Operator A . 5 c 1-4 d/ 6 D E r L
Date / / / a 1 7 7 Run Number Dflc/@z U M t'
Trap Number /s Temperature / c/ d/-
1 Leak Rate: Pretest 0, / Post Test
Tank Vacuum (inch Hg): Pretest (manometer) 2 F , <?.?s (gauge) 2f. r
Tank Pressure: (manometer,inch Hg)
Post Test (manoseter) (gauge) I. I (gauge& 1
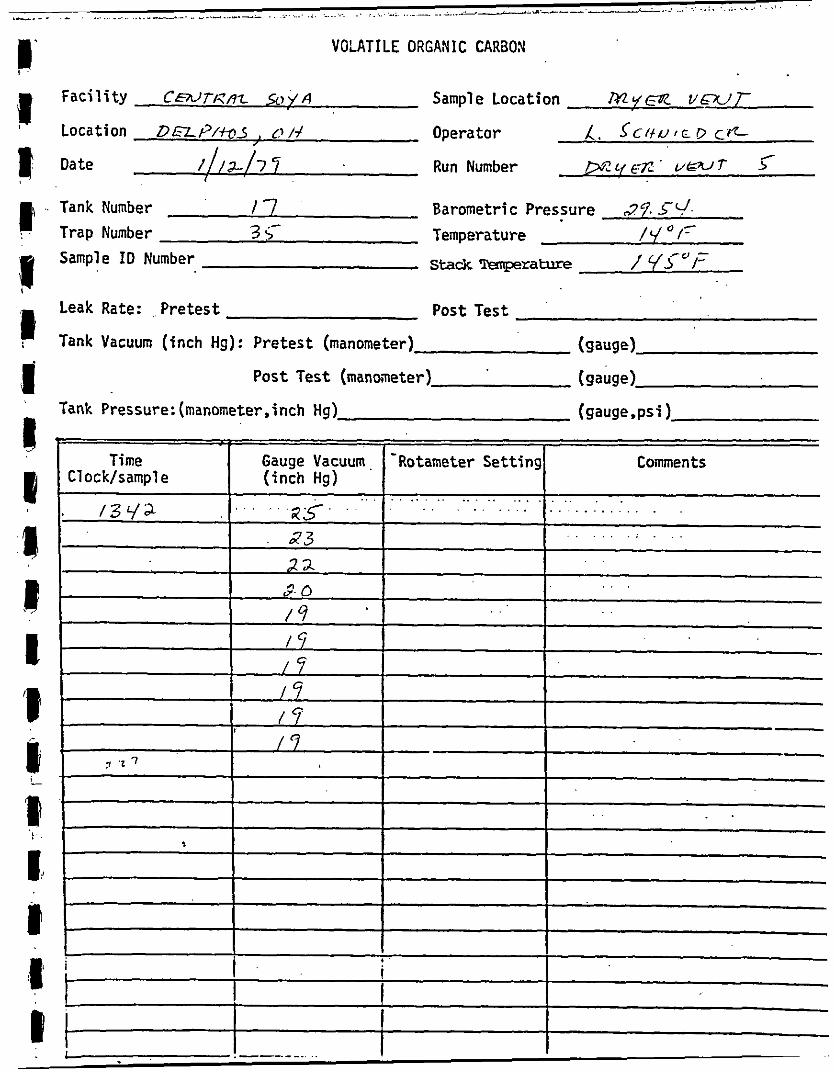
VOLATILE ORGANIC CARBON
Faci 1 i ty C w r m r 5) y a Sample Location m y m v m j -
Location D&z?/~3 , Operator L. S c i t u I c D c% , Date A / 7 7- Run Number p 4 ? L { @ ; . ' U r V T : Tank Number I7 Barometric Pressure 27. Ss/ Trap Number 3 >- Temperature / q d F Sample ID Number Stack Temperature 1 Y J Y F
Leak Rate: Pretest Post Test
Tank Vacuum (inch Hg): Pretest (manometer) (gauge)
Post Test (manometer) (gauge) Tank Pressure: (manometer,inch Hg)
. . . . . .
- -
2 '1 7
. . . .
I
i i I
i

1
i
'b i.
3 . VELOCITY DATA - COOLER AND DRYER SITES

&i&3) T R A V E R S E POINT L O C A T I O N F O R CIRCULAR DUCTS
INSIDE OF FAR WALL TO OUTSIDE OF NIPPLE, (DISTANCE A)
INSIDE OF NEAR WALL TO OUTSIDE OF NIPPLE, (DISTANCE BI
STACK IO., (DISTANCE A . DISTANCE BI NEAREn UPSTREAM DISTURBANCE NEAREST ODWNSTREAM DISTURBANCE CALCULATOR
- - - J B i A l .
SCHEMATIC OF SAMPLING LOCATION
TRAVERSE POINT LOCATION
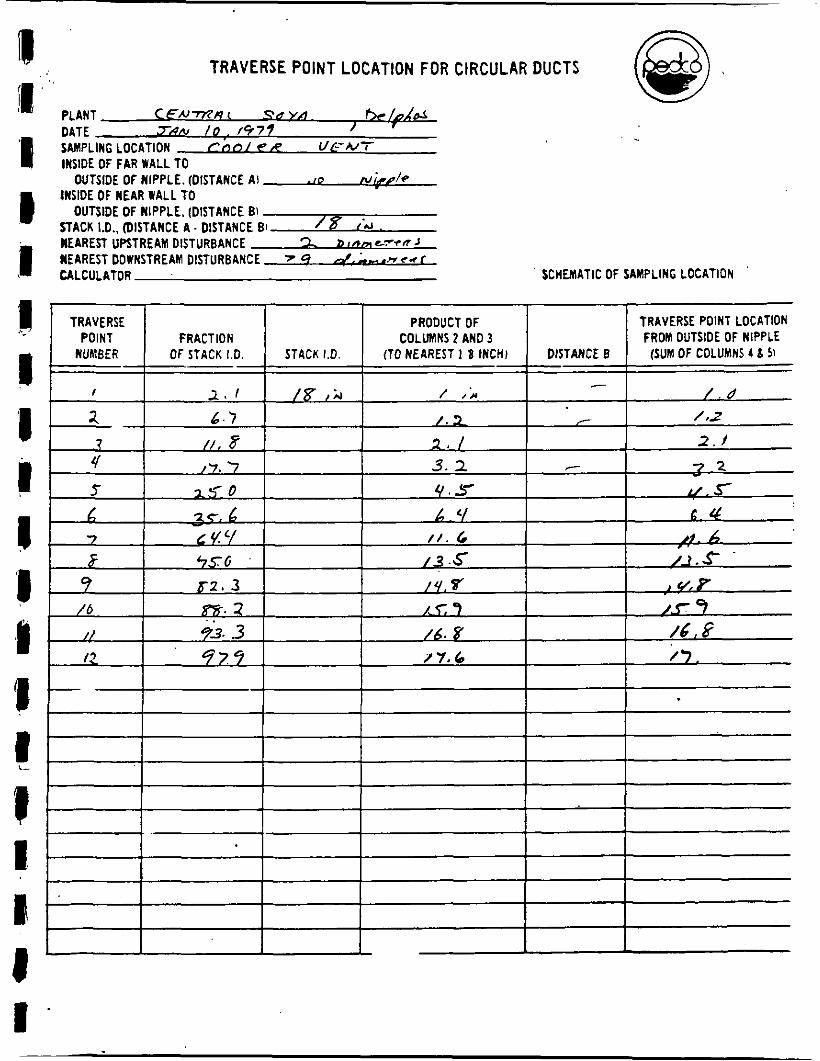
63 TRAVERSE POINT LOCATION FOR CIRCULAR DUCTS
PLANT CtTN-mr? c Sa YA he* d DATE T a m l o . 147? I SAMPLING LOCATION r n n / eR U&-.UT INSIDE OF FAR WALL TO
JNSlDE OF NEAR WALL TO OUTSIDE OF NIPPLE. (DISTANCE AI to N;R&
OUTSIDE OF NIPPLE. (DISTANCE BI STACK 1.0.. (DISTANCE A . DISTANCE BI /s {.AI.
NEAREST UPSTREAM DISTURBANCE T Drnmc.7*f lJ NEAREST DOWNSTREAM DISTURBANCE 7 9 4- n c r f
CALCULATOR
.
SCHEMATIC OF SAMPLING LOCATION
COLUMNS 2 AN0 3 TRAVERSE POINT LOCATION FROM OUTSIDE OF NIPPLE
(SUM OF COLUMNS 1 & 51
/ . d / *z -.,
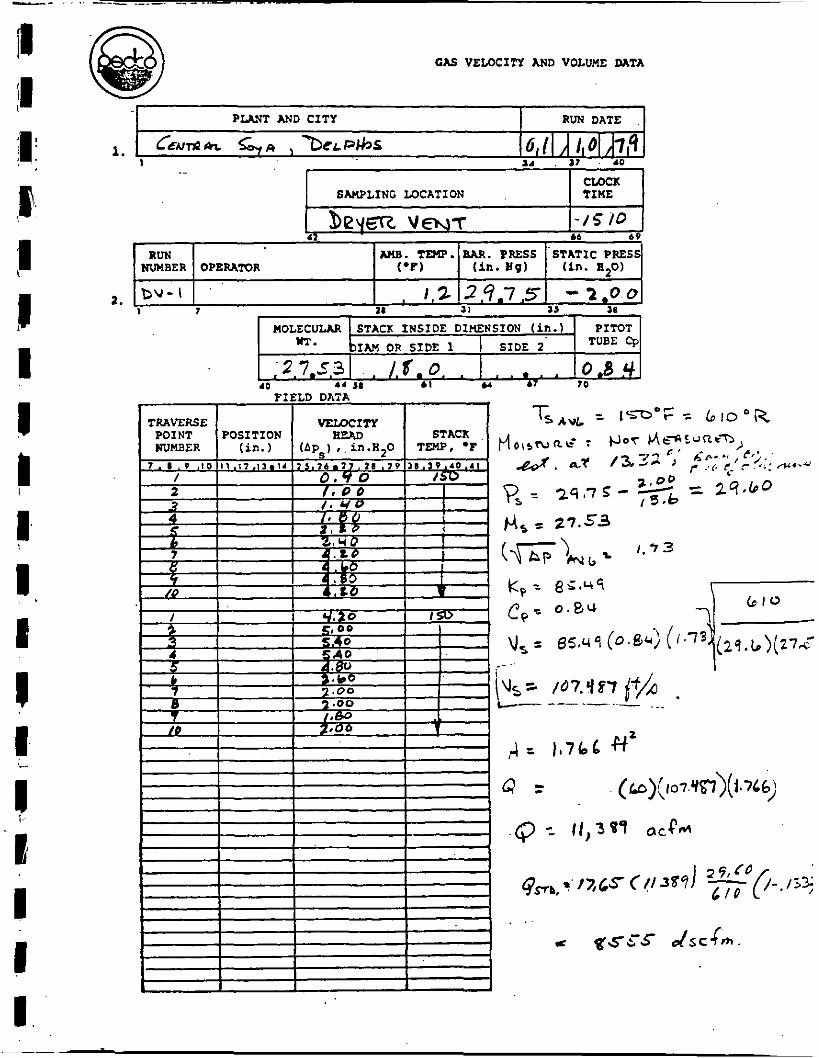
C W VELOCITY AND VOLUME DATA
PLANT AND CITY RUN DATE
1. C€NWch a , % C L P C ~ S 16, [ I /1 I , 01 h,9 24 a7 40 ._ I
I CLQCX SAMPLING LOCATION TIME
.. .D
I RUN AILB. me. BAR. PRESS .STATXC PRESS NUMBER OPERATOR (09) (in. tlg) (in. 8,O)
MOLECULAR STACK INSIDE DIMENSION (in.) PITOT TUBE Cp DIAM OR SIDE 1 I SIDE 2 m.
;2,7,s,3 . . / , 4 , 0 . . I , , , , , 0.8 40 4 4 S I * I 6 4 6? 70

1 1 I\
I I
I' r I' ,I f
I I
v I I I I' I 1
I I I l \ l
1:
MOLECULAR UT.
.2.7. '1.0
w
STACK I N S I D E DIHENSION (in.)- PITOT TUBE Cp DIM OR S I D E 1 1 SIDE 2
0.8 3, ,1.8.0. . 1 . . . . .
CAS VELOCITY AND VOLUHE M T A

3 3 3 3 6
1 RUN DATE. P L W T AND CITY
I
1. ~ r Etv73?# c S O Y 8 D m PW, r I' I\ ; I I'
SAMPLING LOCATION
I'
M C X TIHE
i I
RUN NUneER
I \
I M E . TEKP. BAR. PRESS STATIC PRESS OPERATOR ( O F ) ( i n . !I91 (in. 8,O)
I
MOLECULAR UT.
;227y
I ._
STACK INSIDE DIMENSION (in.) PITOT TUBE Cp DXAM OR SIDE 1 I SIDE 2
, / # f , O , , I , , . , , , ,e.4
!. I
h ? $ R ) GAS VELOCXTY AND VOLUW MTA
W 9 a L

GAS VELOCITY AND V O L W DATA
P L V T NJD CITY I RUN DATE .
I I I I
t I I I I' I I I 1 I
1 I I I
1 1
I I I

il I S' I
I 1' 1 I' I I I I I I 1 -.
I I I 1 I'
1.
w P W V T AND CITY RUN DATE I
Cmvw Z A l A , 14/lh,/I/i7l9 P Q P W S
CAS VELOCITY AND VOLUME DATA
I SAMPLING LOCATION CmCK TIUE
RUN AMB. TEKP. M R . P W S NUMBER OPERILlOR ('PI (in. tig)
I I s
I 6.3 si as a 1
2. c v - 2 1 ,o l2,9.8 PJ I I 7 I1 1 1
I STATIC PRESS (in. R,O)
U O L E C W UT.
,'2.8,6 5
\ 5%%
STACK INSIDE DIHENSION f i n . ) PITOT TUBE Cp 31AM OR SIDE 1 I SIDE 2
0.0 4 , l.0.0. . I , , , ,

G M VELOCITY AND VOLW? 2ATA

GAS VELOCITY h N D VOLUflE DATA
PLAST A 2 D CITY RUN DATE
c I 1 r 1 p I I I
I I I I I I c
I I
I I I I
- 1. r/=/vyTAr7 L ~ Y H . nt-mviis , / I ] 1 , a [ J 7 9 1 4 2 7 4 0 I
CLOCK SAMPLINS LOCATION TlflE
C O d C R W F N I 2! XI.' - . 111:25
RUN AUB. T W . BAR. PRESS NUUBER OPERATOR (*F) ( i n . H g ) I STATIC P E S 5
( i n . H,O)
WOLECULAR STACK INSIDf D I W " I 0 N f i n . ) IAH on S I D E 1 I SIDE 2 WT.
.2@d , / r . a , I , , . , . PITOT
TUBE Cp

I
! i ! ~
I
i !
i I
j
. . ' . I !
. , 3: .n$ --
3 a! D oi . ., r a.
i i !
I > 3'3 3 I . .I..
i
. ' . 0 .? m n - ;-
i
a * = . O 3 .-
..* . .
= : . ' I
!
I I I I I
I
i ! !
j
!
i
I ! i
i
j
j
I
I !
!
~
I I
I I !
I
!
. .
i
! !
!
I
~
i
j
I ~
! I
I
I I I i

i
.o 8 I 2 Y
a
a
: . . i i
C .
?-=T i I I
i
! I
I i I
I ~
I I I
! i
I
8 ,
i
I
i I I I I I I ~
i
I I I ! I
I !
I
I i
i I I i , I I !
I
! !
1
I
I I I
I
i I
i
i
1 i
I
i
i I ~
i
I I I I I I I !
~
!
i i I
j ! i j ~
! I
I
j i
I
I
I i i
I
1
I
! ~
! i
!
i I I 1 j i
!
!
! !
I I
;
I I
! I I
i
!
. I
!
i !

. . I
'n z 2 : J
'2 2 < u
a
!
Y I Lo
!
9 r a
J J
J
, 1 J
i
> a I
3 I , J c c J
I I t
! !I
: /'I
_ _ L-..
i
-.--

I I
I I i
1
~
i !
i ! i
i
i !
!
I !
I
I
I I I I
1.
i
i
-I ! Z ! : 3
' I i
l _ l . : . - e *
-. ... . . . . , , . . . . . .. - - n .:.. e .
I
I
i I
i
~
! !
I
I
! ! !
i
I
!
I i i i I I
i
!
!
i
1 1
!
1 I
! !
i
! I I !
i
~
! I
! I
i
i
! i
!
!
I !
I I j I !
i ! !
j ! !
4
!
ii I I L
!
L
2 z
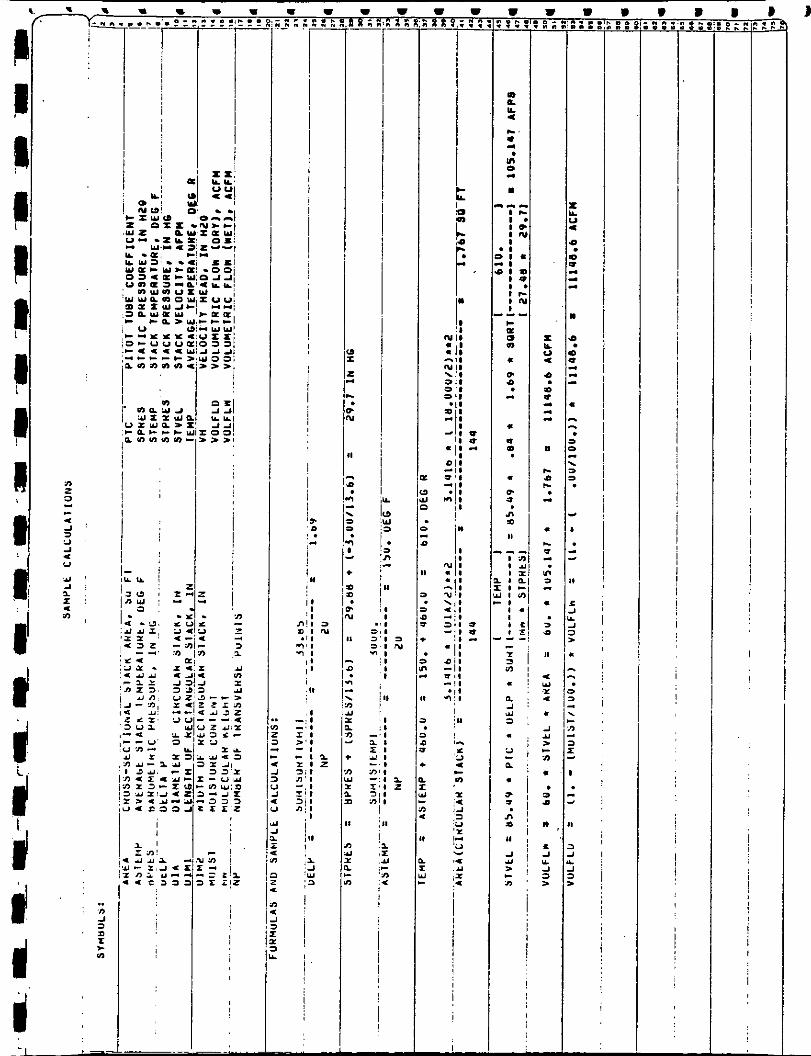
I
i I
n z 2 e a . -1
L) -1
U
a j+ 0
I . :-
. I I- in Y A I z < (o
i I I1
!

- I*. ... ._
. <
0 0 1 3 - Y 0 3 - 0 0 3 = o a o 0 1 0 0 0
I I
" . ! * . .
I I I I
I 1 I
I
i 1 !
! i
i 1
!
j ~
I I
I i
I
I ! j i
i
\ 1
!
I
i
I !
i i I !
-. . -- ? . . , . D .
I
I i I
!
i I
i i:

e;: ii; - a : -
I
3 N
I z
E 8 9 . ; : 2 : n n . n . r ... e..
I
i I i I I '
I i
I
!
IC L
0 m - c 4
'2
I
i i
I I I
I
I i !
I I
i I
! i i !
I ~II
I.
0 ' I 1 . I - - ! -
! O ' 3 , -
. i
0 1 1 1 . :
c . ; a
'I, I
w ' ,
'I u .C
n , I
< 2 3 Y I i
! u
i:
i z .<
~i i ! : I 1 ;
" m
.. I I !
I
. -. . . - . - i- -- .I .." D
.. . . . . . .I ~ . . . - , _. . _ . . r " . .. . . " ,~ .. .
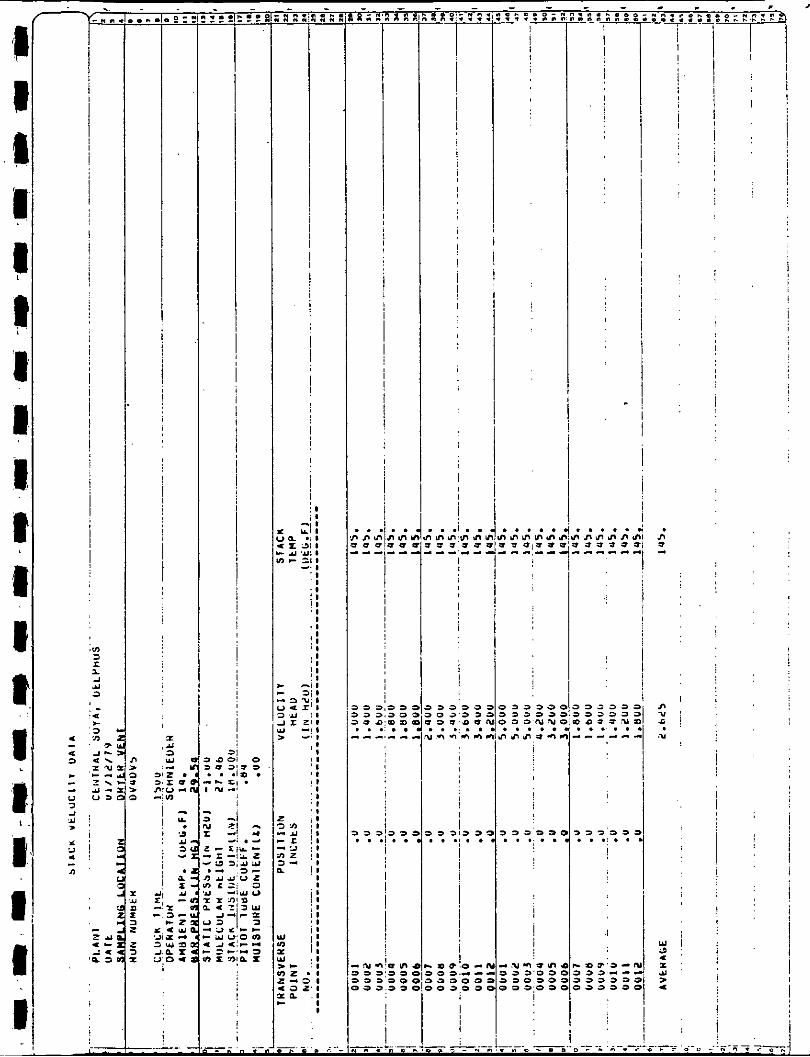

Y P a - .
I ! I
i
i
i
~
! I
I I I i
!
i
i ._-.-
m - c : ,.
L c,c m m:m
i
j
! I
I i I I i I i !
i !
. - - . . . . .
I I
I I
I !
i ! I I j
~
I
I
, ! I
i I I : i I I
i ! I
i
!
!
i
!
i
i
i i 1
j
j
1
i
!
I i
1 i
I
I !
I I i i
I i !
I

y1 J
I 1 !
! !
i I i
!
I
! i i
! I I
!
. I . . 3 - a -
D II ,
s a I
J 2 I 4 . L > - I : 3 3 > >
I
!
i

! !
1 ! I i
I
1 !
!

!
!
!
n 5
-I Y
! a
a
! !
!
I
!
!
,
a I -
2. - - -I. a:
! I --i:-ii’
! - ! I
- L
. . . .- . . . .. -. , I cI 0 . _I n .:.a?-) . . . . . - * - <

I
! I I ! ! I
! 1 i I
! 1 1
i i
i
I i I
!
!
I
h "- I P I . I P I N I I I . I I V I
I r n ,tu I
c E 3 01
: 3
-"
L Y U - N 0 0 I n
.
I
L N Y . U P - 0
0 N..)
P 0 O . W l
a m a . c a u a , - . . I
O . a - e - 'v
11
. I -1
. Y = . A
>
H .
0 3
I
NII . I
3 ' 1 3 1
-;I -51
I 1 -11 0 'I .a
. I - . 0 1 - 1 0 1 .-I . I ..I.
I
I l l . I l
I
i t
n z 2 C
.J 3 U -1 < U
Y 2
S < n
a
I
n 1:
I-
' 3 - 2 d ! . . a c
1 2 n . , W - > a c n 5 . I
. a a -
' I I- * 'd Q
Y P .
! I,
-1 I > n -
i
* I -1 s i % I Y I
I
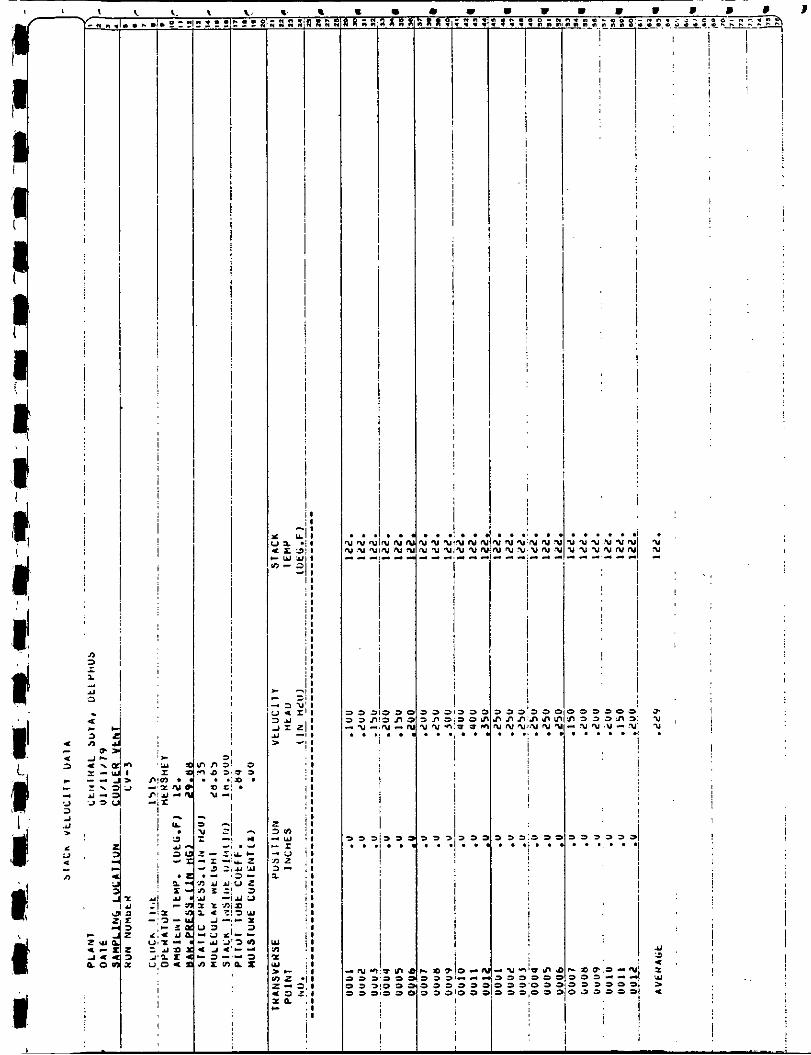
!

. . . - " -
I
! !
I
! i
I
!
i
I
! j
I -
i
~
i I i
!
i I I I
! i
~
I I
I
I i I I i i I
I ~
I
1
i
i

I \ i ! !
i I
i i
!
!
I
!
I
I
I !
! j ' i
I l i I !* c
I F c c '0
'r I 1 i i I I
I I \ I i
i I
i :
I
i
I
! !
i I
i
I
- 1
I
I* 0 - 1' + - N U
. L J
*
: i> /=
n ' a J a z . - 1 . a U.
:-E

.., -
1
I I ! I
i !
!
n Y Y L AI a
3. NU=, a - > I f 2) I . . O .
0 t' . ,3
._ ..
I
I ;
I 3 3:3 = . ^ - . - -
, a 2'3 3 :
* . . I . . I
i
I ! I i !
I ! I
I I
I ! I
~
I !
!
!
~
i
I
I i
i
!
i i I .
I
I I
i I
!
- - --

a
' f i rj
I !
I !
j
!
~
i i i
i
j !
! 1 .n ' 3 S
2 Y
a
.a . 'e
.1
i !
i
~ I
I
i i
i
i
I
I 1
I
i
i i
I !
i I 1 I
I
j .-L- . a.. h I
I
i I I I i I
I
i I
j
I I I
1
!
I I I ! ! i ! I I I ! I
I ! I
!
j ~
!
! ~
i
i I I I i
!
I
!
!
1
I i
I
i
I
~
! ~
i I
i I
i I
I i
I i ! !
!
i
I
i 1
I
1 I
I
I
I
! ! !
I !
j I I
1 ~
i
, I
i
i
I I
!
I

i
t
PITOT TUBE CALIBWLTION
The p i t o t tubes u s e d i n sampling vere constructed by
PEDCo Environmental a n d m e t a l l requirements of Method 2 ,
s e c t i o n 4 . 1 of the Federal Reg i s ter , . Therefore, a b a s e l i n e
c o e f f i c i e a t o f 0 . 8 4 v a s ass igned to e s c h p i t o t tube .
Fioures E - r and E-5 f o r alignment requirements of Method 2 .
See
E-12
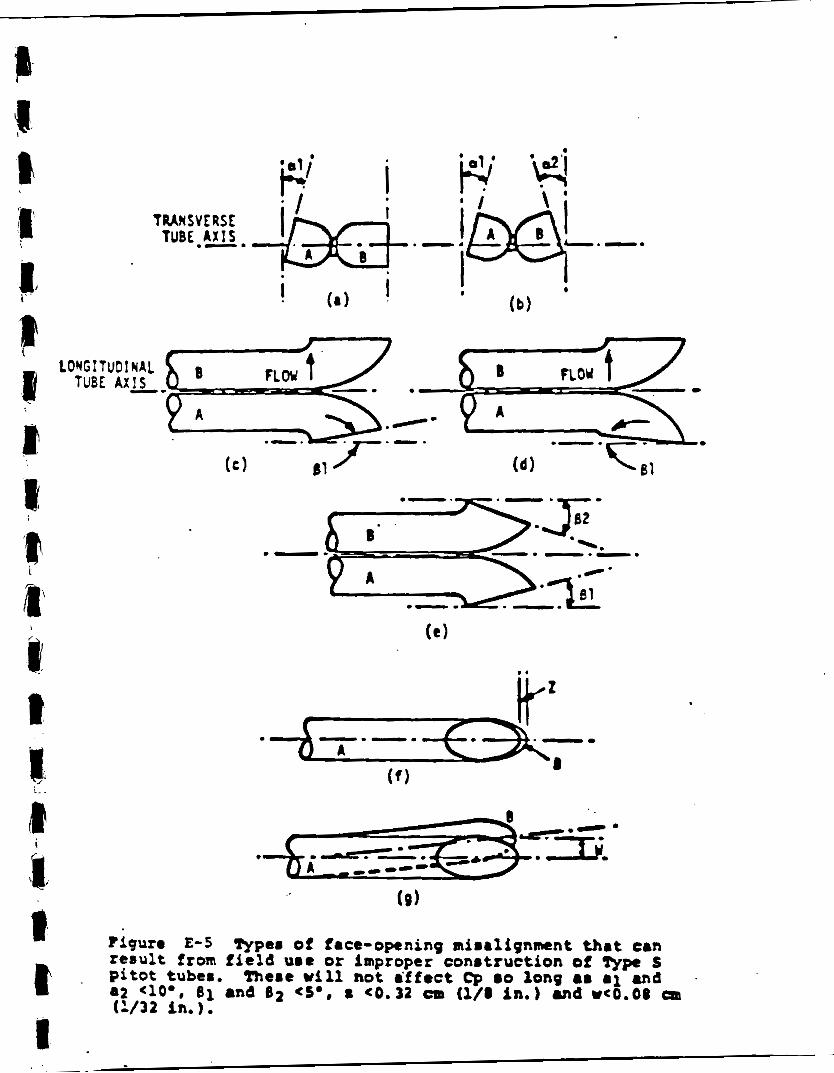
LONGITUDINAL TUBE A X I S -
?igura E-5 -per of face-owning mirrllgnmcnt that can result from f i e l d uae or improper construction of Type S P i t o t tuber. There will not .'ffect Cp 80 long as a 1 m d
W 3 2 in.). a2 <loo, 61 and 62 < S o , 8 cO.32 (1/1 in.) m d W<O.OO Qs

, I TRANS YE RS E
TUBE A X I S
A-SIDE PLANE
W u r e E-4 Properly cons truc ted n p a 8 p i t o t tub., shown lni (a) end view; f a c t optninq p l a n e s perpendicular to tranoverrc u i r ; (b) t o p vi-; face opening planer para l l e l to longi- tudinal ax is ; (c) r i d e vi-: both l e g s of equrl l ength and e e n t c r l i n e r c o i n c i d e n t , when vicved from both sides. c o e f f i c i e n t valuer of 0.04 may be assigned to p i t o t tuber constructed t h i o way.
Baselfm
E-13 . _. ._ ._- - . . . - ..
il - .

APPENDIX C
PROJECT PARTICIPANTS
I. c
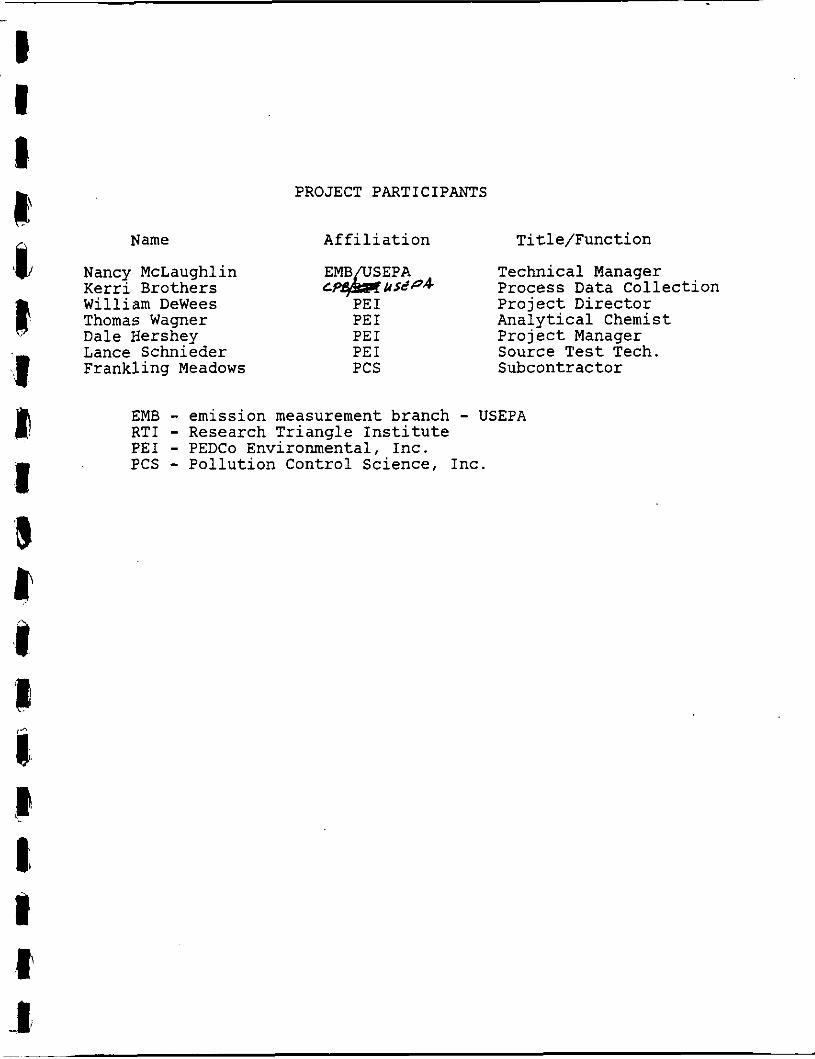
PROJECT PARTICIPANTS
Name Affiliation Title/Function
EMB SEPA Technical Manager Process Data Collection Project Director
&45s'p.4 Nancy McLaughlin Kerri Brothers LP William DeWees PE I Thomas Wagner PE I Analytical Chemist Dale Hershey PE I Project Manager Lance Schnieder PE I Source Test Tech. Frankling Meadows PCS Subcontractor
EMB - emission measurement branch - USEPA RTI - Research Triangle Institute PEI - PEDCo Environmental, Inc. PCS - Pollution Control Science, Inc.
APPENDIX D
SAMPLING LOG

Date Time - 1/8/79 13:OO-17:OO
1/9/79 8:OO-11:OO
11:oo-12:oo
12:30-13 :30
13:30-16:30
17:OO-18:OO
19:30
1/10/79 8 : 00-9 : 00
9: 00-9 :45
1o:oo-11:oo
11:OO-11:45
12:OO-15:OO
15:lO-16:lO
16:lO-17:30
SAMPLING LOG
A c t i v i t i e s
T e s t team from PEI and PCS a r r i v e s ; set up l a b and sampling equipment; make inspec t ion of t e s t s i t e s
Tes t team c a l i b r a t i n g pumps; se tup t e s t s i t e and equipment
Tes t 1 on mineral o i l scrubber sites
Lunch break
Cleaning up sample . t ra ins and s e t t i n g up f o r next t e s t
T e s t 2 a t MOS s i t e s
Test team leaves f o r day
Team a r r i v e s on s i t e and sets up f o r t e s t
T e s t 3 a t MOS
Clean up and recover samples
T e s t 4 a t MOS
Lunch, t es t recovery, set up f o r f i r s t t es t s a t cooler and dryer s i tes
T e s t 1 a t dryer and cooler s i t e s
Clean up, recover samples; leave s i t e f o r day

I .-- .. ...
SAMPLING LOG ( con t inued)
Date Time Activit ies
1/11/79 8:OO-10:30 S e t up f o r t e s t 2 a t d rye r and cooler
10:30-11:30 T e s t 2 a t d r y e r and c o o l e r , meal samples t aken a t D T ' s , d r y e r , and c o o l e r
11:30-13:OO Clean up, recover samples
13:OO-13:30 Lunch break
13:30-14:30 S e t up f o r next t e s t
14:30-15:15 T e s t 3 a t d rye r and coo le r
15:30
. P l a n t s h u t down t o r e p a i r and c l e a n cyclone a t cooler t e s t s i t e
1/12/79 8:OO-10:30 S e t up €or bag sample tes ts
10:30-11:30 Bag samples drawn a t coo le r and
12:lO-14:25 T e s t s 4 and 5 conducted simul-
d r y e r s i tes ; analyzed immediately
t aneous ly a t c o o l e r and d rye r s i tes
14:25-16:30
16:30
Recover samples, c l e a n up, pack up equipment
T e s t team l e a v e s p l a n t