Embed Size (px)
Citation preview
Revised February, 2013
Reference Guide:
Using and Understanding PRC EasyView
https://www.prceasyview.com/vanderbilt
Patient Satisfaction
Revised February, 2013 2
***IMPORTANT***
The website address to log on to PRC EasyView is
https://www.prceasyview.com/vanderbilt
This is the only web address that will allow you to log in to view Vanderbilt’s patient satisfaction data.
If you try to log in at prconline.com or prceasyview.com you will be unable to.
Vanderbilt employees do not have automatic access to the
patient satisfaction website; accounts must be manually set up by Service Measurement and Improvement.
If someone on your staff needs to be able to view
patient satisfaction data, please contact Denise, Meredith or Denise and they will create an account specifically for you.
Denise Rabalais – 66066, or- [email protected]
Meredith Speight — 66014, or-
Denise Mitten — 66067, or- [email protected]

Revised February, 2013 3
Patient Satisfaction
Reference Guide: Using and Understanding
PRC EasyView
https://www.prceasyview.com/vanderbilt
Denise Rabalais [email protected]
936-6066
Meredith Speight [email protected]
936-6014
Denise Mitten [email protected]
936-6067

Revised February, 2013 4
Table of Contents
Part I. Overview of Key Concepts About Professional Research Consultants, Inc. (PRC) ....................... 5 Methodology & Goals / Sampling & Data Roll Up ............................... 8 Key Dates & Surveys ........................................................................ 20 Part II. PRC EasyView Website Using PRC EasyView........................................................................ 37
Logging in
Your Homepage
Navigation Tips
Scorecards
Best Practices & Ideas @ Work
Key Drivers ....................................................................................... 46 Excellinks™ / EasyView To You ...................................................... 58 Snapshots ......................................................................................... 66 Reports ............................................................................................. 84 Rankings ........................................................................................... 91 Results .............................................................................................. 98 Action Planning ............................................................................... 120

Revised February, 2013 5
About Professional Research Consultants,
Inc (PRC)
Revised February, 2013 6
About PRC Professional Research Consultants, Inc.
About: PRC is based in Omaha, Nebraska and has been surveying healthcare facilities for over 30 years. PRC uses a telephone methodology to survey patients. They are staffed with over 400 telephone interviewers who go through an extensive training and monitoring program to ensure consistency and accurate surveying results. For additional information about PRC go to www.prconline.com. (Note: you cannot log on to EasyView from this address). What PRC EasyView can provide for you:
Real-time results via online reporting
Quarterly reports
Statistical calculations (key drivers)
Ability to break out data by nursing unit, clinic, specialty and patient care center
Data trending by month, quarter and fiscal year
Graphical views
Ability to save your views for future reference without having to set them up again (Excellinks™ feature)
Ability to have results emailed to you regularly based on a timeline that you specify (PRCEasyViewToYou feature)
Revised February, 2013 7
Copyright© PRC
Revised February, 2013 8
Methodology &
Goals
Sampling &
Data Roll Up

Revised February, 2013 9
Importance of Surveying and Survey Methodology
Why is Surveying Our Patients Important? Surveying our patients is important so that we can learn where we are doing well and where we need to im-prove. Healthcare is an competitive industry and patients usually have a choice in where they receive care. It is more important now than ever with the implementation of federally required surveys and value based purchasing. Our Medicare reimbursements will be partly dependent on how we perform on these surveys.
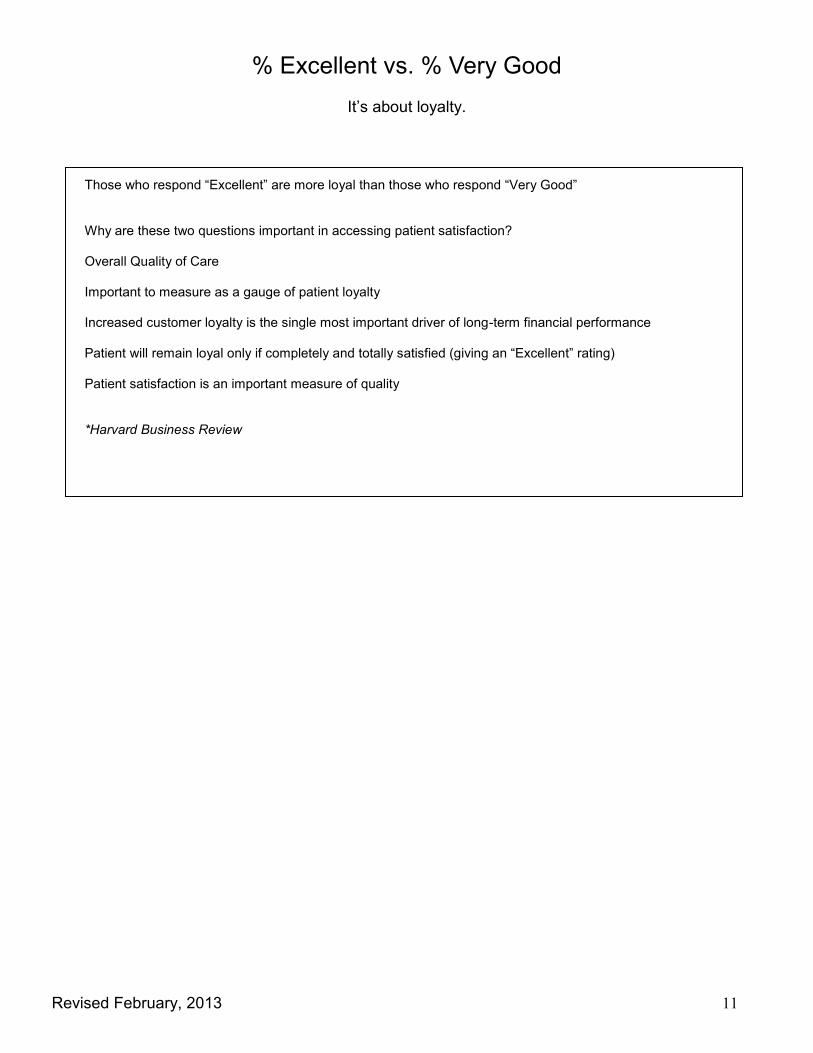
Why Focus on % Excellent? If our patients have an excellent experience at Vanderbilt, they are more likely to recommend us to their family and friends. If they rate us “very good,” they are much less likely to recommend and much more likely to switch than if they rate Vanderbilt excellent. The difference in recommending is 4 times greater than when patients rate us excellent. We can build customer loyalty by focusing on % excellent.
Methodology
Professional Research Consultants (PRC) surveys a sample of patients via telephone calls to ask them questions about their satisfaction with the care they received at VUMC. Of those reached on the phone, PRC gets a participation rate of 85-90%. Calls are made to Vanderbilt patients within one week of an outpatient clinic visit and within two weeks of an inpatient hospital stay. Results are online within 24 hours of the call completion. Vanderbilt’s focus is on the percent of excellent responses to survey questions and the improvement in % excellent is VUMC’s focus in FY12.
Revised February, 2013 10
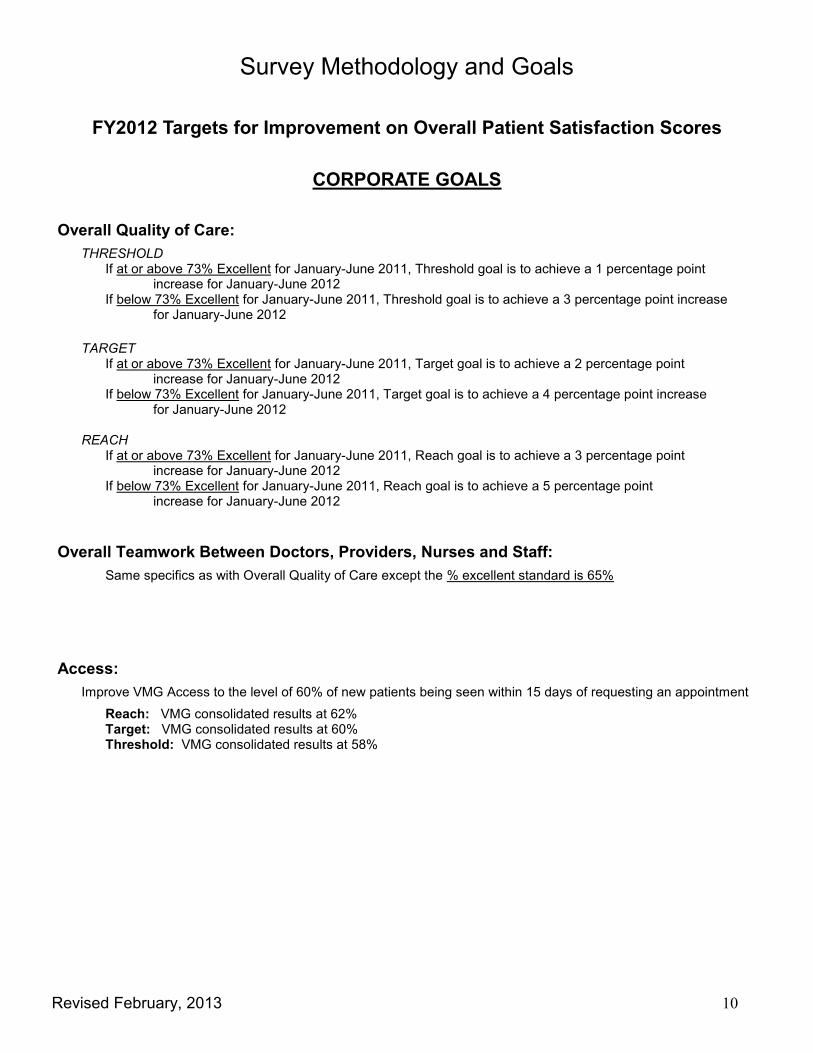
Survey Methodology and Goals
FY2012 Targets for Improvement on Overall Patient Satisfaction Scores
CORPORATE GOALS
Overall Quality of Care:
THRESHOLD If at or above 73% Excellent for January-June 2011, Threshold goal is to achieve a 1 percentage point increase for January-June 2012 If below 73% Excellent for January-June 2011, Threshold goal is to achieve a 3 percentage point increase for January-June 2012
TARGET If at or above 73% Excellent for January-June 2011, Target goal is to achieve a 2 percentage point increase for January-June 2012 If below 73% Excellent for January-June 2011, Target goal is to achieve a 4 percentage point increase for January-June 2012 REACH If at or above 73% Excellent for January-June 2011, Reach goal is to achieve a 3 percentage point increase for January-June 2012 If below 73% Excellent for January-June 2011, Reach goal is to achieve a 5 percentage point increase for January-June 2012
Overall Teamwork Between Doctors, Providers, Nurses and Staff:
Same specifics as with Overall Quality of Care except the % excellent standard is 65%
Access:
Improve VMG Access to the level of 60% of new patients being seen within 15 days of requesting an appointment
Reach: VMG consolidated results at 62% Target: VMG consolidated results at 60% Threshold: VMG consolidated results at 58%
Revised February, 2013 11
% Excellent vs. % Very Good
It’s about loyalty.
Those who respond “Excellent” are more loyal than those who respond “Very Good” Why are these two questions important in accessing patient satisfaction? Overall Quality of Care Important to measure as a gauge of patient loyalty Increased customer loyalty is the single most important driver of long-term financial performance Patient will remain loyal only if completely and totally satisfied (giving an “Excellent” rating)
Patient satisfaction is an important measure of quality *Harvard Business Review

Revised February, 2013 12
87.04
22.82
7.87
1.07 2.780.00
10.00
20.00
30.00
40.00
50.00
60.00
70.00
80.00
90.00
100.00
Excellent Very Good Good Fair Poor
Likelihood to Recommend By Overall Quality of Care

Revised February, 2013 13
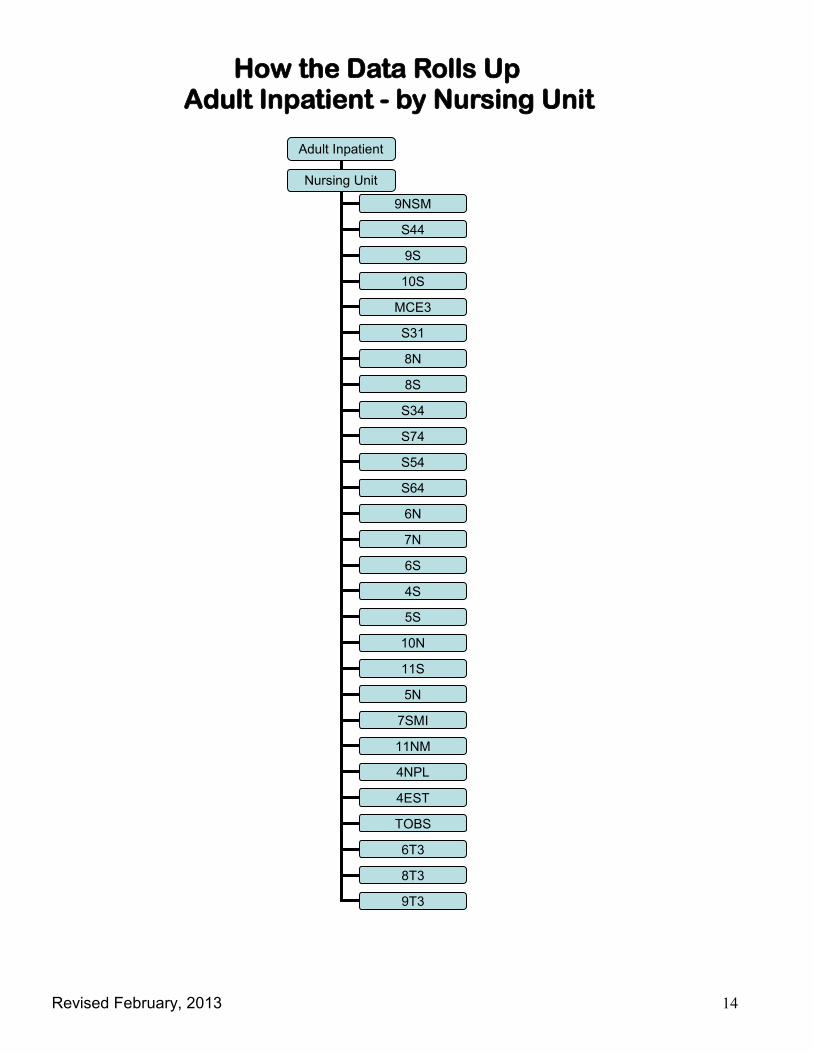
How Data Rolls Up
Revised February, 2013 14
How the Data Rolls Up Adult Inpatient - by Nursing Unit
Adult Inpatient
Nursing Unit
9NSM
S44
9S
4EST
10S
4NPL
11NM
7SMI
5N
11S
10N
5S
4S
6S
7N
6N
S64
S54
S74
S34
8S
8N
S31
MCE3
TOBS
6T3
8T3
9T3
Revised February, 2013 15
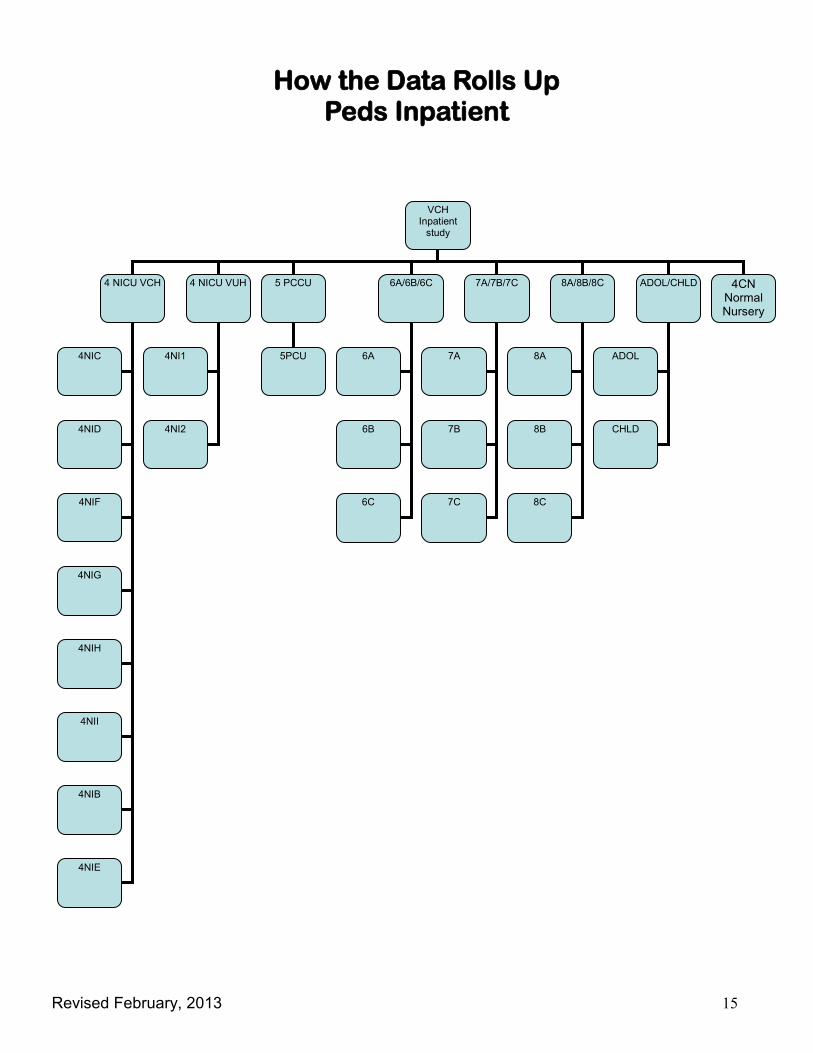
VCH Inpatient
study
4 NICU VCH 6A/6B/6C
4NIC
4NIB
4NIE
4 NICU VUH 5 PCCU 7A/7B/7C 8A/8B/8C
4NII
4NIH
4NIG
4NIF
4NID
4NI1
4NI2
5PCU 6A
6B
6C
7A
7B
7C
8A
8B
8C
ADOL/CHLD
ADOL
CHLD
4CN Normal Nursery
How the Data Rolls Up Peds Inpatient
Revised February, 2013 16
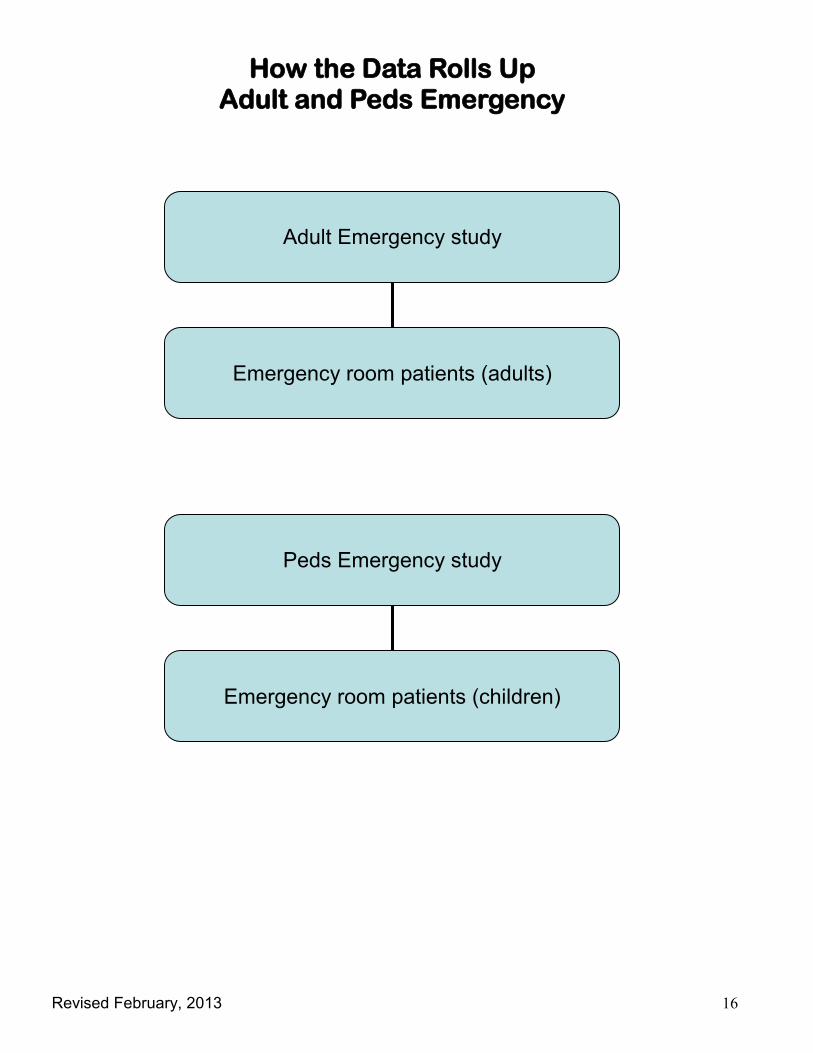
How the Data Rolls Up Adult and Peds Emergency
Adult Emergency study
Emergency room patients (adults)
Peds Emergency study
Emergency room patients (children)

Revised February, 2013 17
How the Data Rolls Up Outpatient Surgery
Department Name
Patient Care Center
Department Specialty

Revised February, 2013 18
How the Data Rolls Up Outpatient Technical
Patient Care Center
Department Specialty
Department Name

Revised February, 2013 19
How the Data Rolls Up VMG Provider and Urgent Care
Patient Care Center
Department Specialty
Department Name
Provider Name

Revised February, 2013 20
Key Dates &
Surveys
Revised February, 2013 21
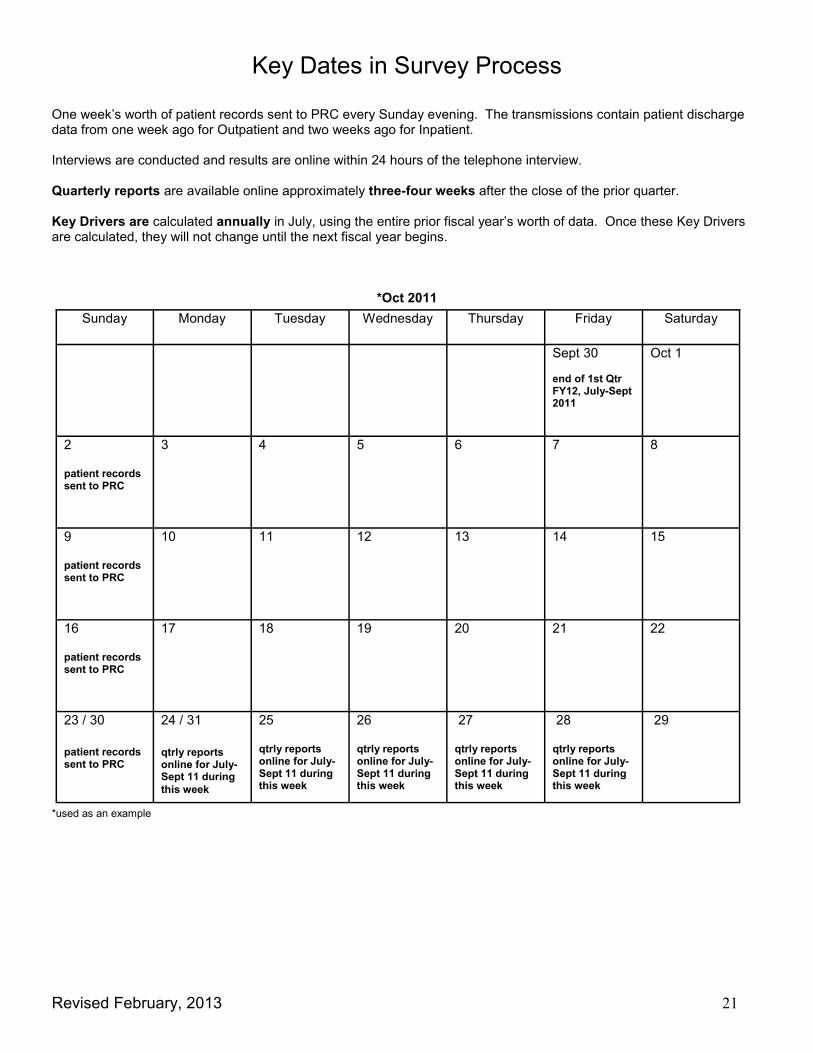
Key Dates in Survey Process
One week’s worth of patient records sent to PRC every Sunday evening. The transmissions contain patient discharge data from one week ago for Outpatient and two weeks ago for Inpatient. Interviews are conducted and results are online within 24 hours of the telephone interview. Quarterly reports are available online approximately three-four weeks after the close of the prior quarter. Key Drivers are calculated annually in July, using the entire prior fiscal year’s worth of data. Once these Key Drivers are calculated, they will not change until the next fiscal year begins.
*Oct 2011
*used as an example
Sunday Monday Tuesday Wednesday Thursday Friday Saturday
Sept 30 end of 1st Qtr FY12, July-Sept 2011
Oct 1
2 patient records sent to PRC
3 4 5 6 7 8
9 patient records sent to PRC
10 11 12 13 14 15
16 patient records sent to PRC
17
18
19
20
21
22
23 / 30 patient records sent to PRC
24 / 31
qtrly reports online for July-Sept 11 during
this week
25 qtrly reports online for July-Sept 11 during this week
26 qtrly reports online for July-Sept 11 during this week
27 qtrly reports online for July-Sept 11 during this week
28 qtrly reports online for July-Sept 11 during this week
29
Revised February, 2013 22
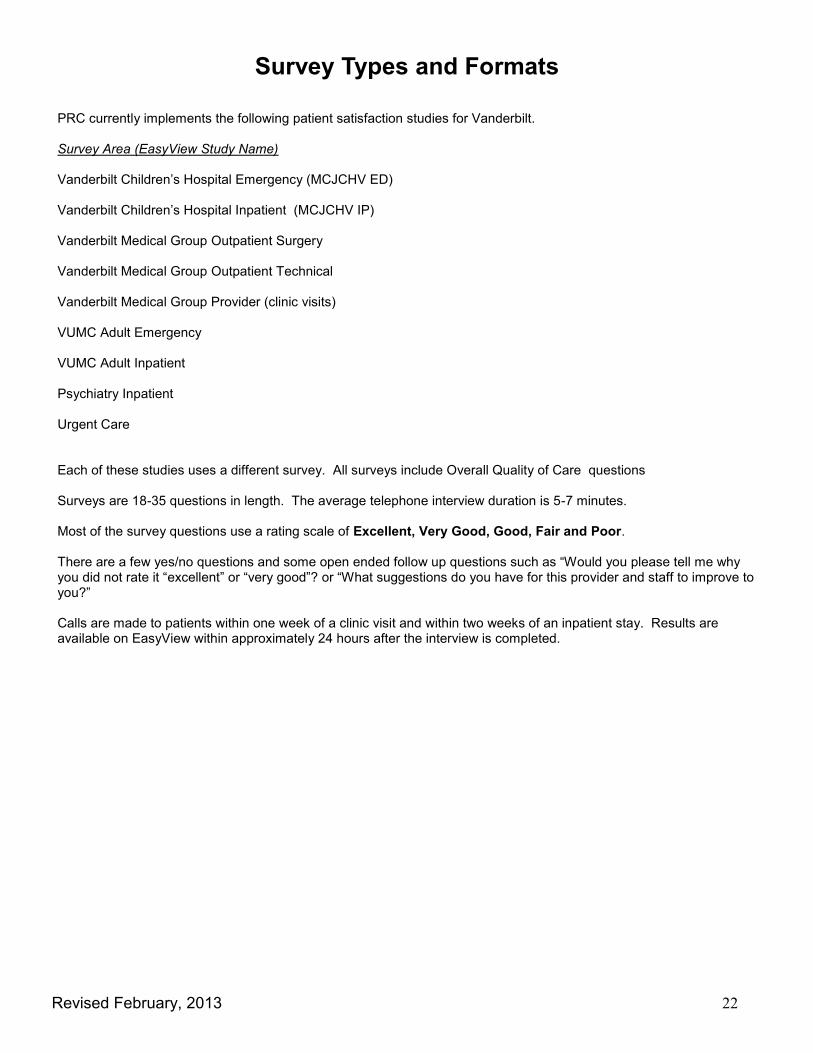
Survey Types and Formats
PRC currently implements the following patient satisfaction studies for Vanderbilt. Survey Area (EasyView Study Name) Vanderbilt Children’s Hospital Emergency (MCJCHV ED) Vanderbilt Children’s Hospital Inpatient (MCJCHV IP) Vanderbilt Medical Group Outpatient Surgery Vanderbilt Medical Group Outpatient Technical Vanderbilt Medical Group Provider (clinic visits) VUMC Adult Emergency VUMC Adult Inpatient Psychiatry Inpatient Urgent Care Each of these studies uses a different survey. All surveys include Overall Quality of Care questions Surveys are 18-35 questions in length. The average telephone interview duration is 5-7 minutes. Most of the survey questions use a rating scale of Excellent, Very Good, Good, Fair and Poor. There are a few yes/no questions and some open ended follow up questions such as “Would you please tell me why you did not rate it “excellent” or “very good”? or “What suggestions do you have for this provider and staff to improve to you?” Calls are made to patients within one week of a clinic visit and within two weeks of an inpatient stay. Results are available on EasyView within approximately 24 hours after the interview is completed.
Revised February, 2013 23
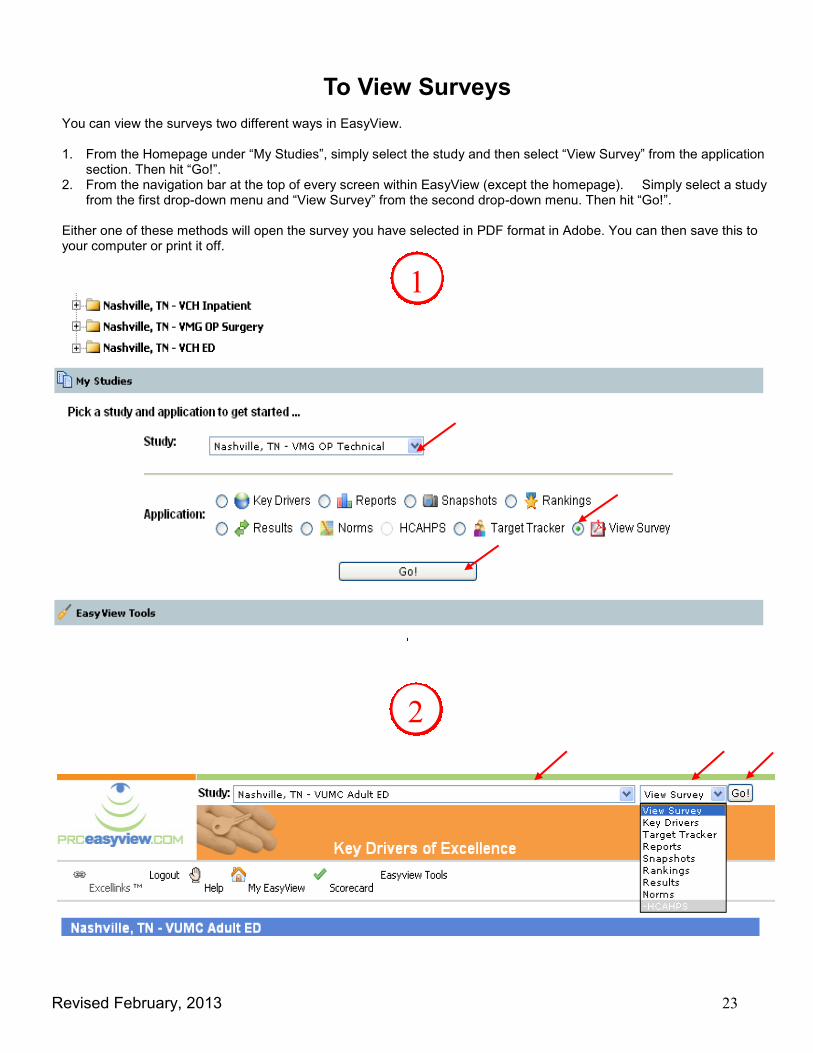
To View Surveys
You can view the surveys two different ways in EasyView. 1. From the Homepage under “My Studies”, simply select the study and then select “View Survey” from the application
section. Then hit “Go!”. 2. From the navigation bar at the top of every screen within EasyView (except the homepage). Simply select a study
from the first drop-down menu and “View Survey” from the second drop-down menu. Then hit “Go!”. Either one of these methods will open the survey you have selected in PDF format in Adobe. You can then save this to your computer or print it off.
1
2

Revised February, 2013 24
PEDIATRIC EMERGENCY
How would you rate the emergency room registration process?
Would you please tell me why you did not rate it Excellent or Very Good?
How would you rate the nurses’ understanding and caring shown toward (you/your child)?
How would you rate the nurses on explaining (you/your child’s) medical condition and treatment?
Overall, would you rate the quality of nursing care as:
Would you please tell me why you did not rate it Excellent or Very Good?
How would you rate the doctors’ understanding and caring shown toward (you/your child)?
How would you rate (your/your child’s) doctors’ explaining things in a way you could understand?
Overall, would you rate the quality of doctor care as:
Would you please tell me why you did not rate it Excellent or Very Good?
Would you rate the overall teamwork between the doctors, nurses, and staff as:
Would you please tell me why you did not rate it Excellent or Very Good?
Would you rate the management of (your/your child’s) pain by the emergency room staff as:
How would you rate the staff members on informing you about who would take their place when they were off duty?
How would you rate the cleanliness of the emergency room, including the exam room and waiting areas?
Overall, how would you rate the respect for (your/your child’s) privacy?
How would you rate the staff on informing you about any waiting or delays that (you/your child) may have experienced during this emergency room visit?
How would you rate the instructions you received about the symptoms or health problems to look out for after this emergency room visit?
Would you say the likelihood of your recommending the Vanderbilt Children's Emergency Department to friends and relatives for emergency services as:
Overall, would you rate the quality of care provided as:
What could have been done to improve this emergency room experience?
Revised February, 2013 25
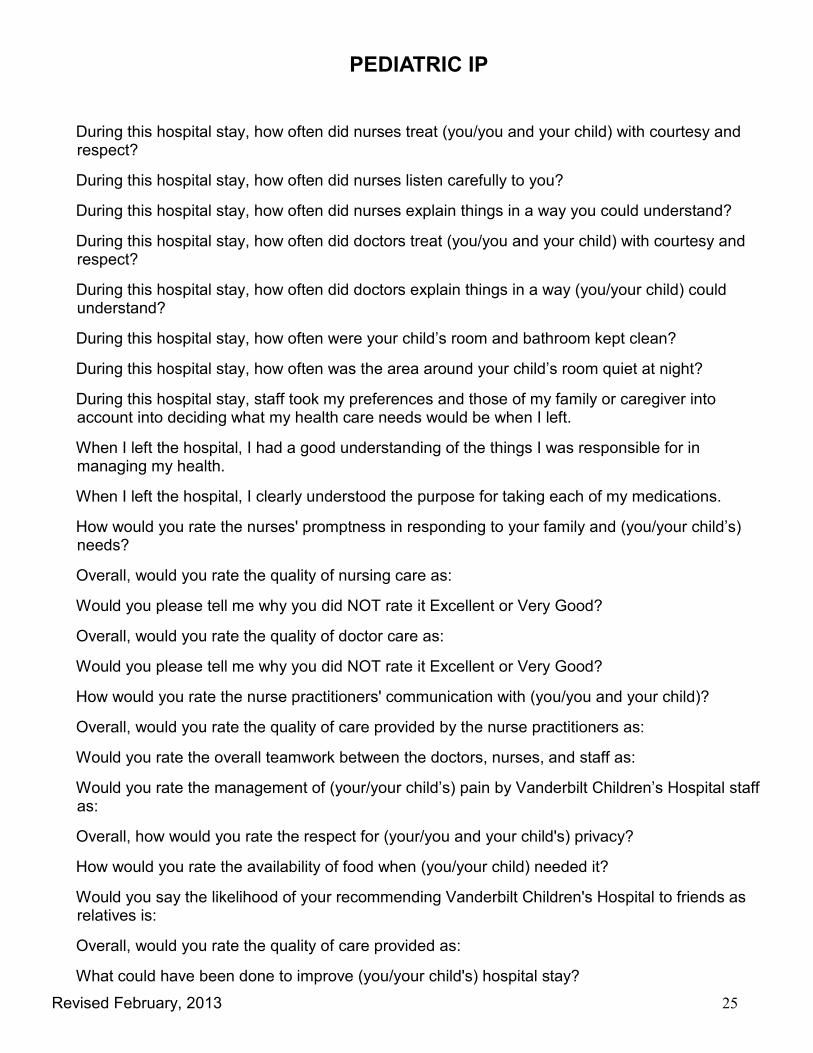
PEDIATRIC IP
During this hospital stay, how often did nurses treat (you/you and your child) with courtesy and respect?
During this hospital stay, how often did nurses listen carefully to you?
During this hospital stay, how often did nurses explain things in a way you could understand?
During this hospital stay, how often did doctors treat (you/you and your child) with courtesy and respect?
During this hospital stay, how often did doctors explain things in a way (you/your child) could understand?
During this hospital stay, how often were your child’s room and bathroom kept clean?
During this hospital stay, how often was the area around your child’s room quiet at night?
During this hospital stay, staff took my preferences and those of my family or caregiver into account into deciding what my health care needs would be when I left.
When I left the hospital, I had a good understanding of the things I was responsible for in managing my health.
When I left the hospital, I clearly understood the purpose for taking each of my medications.
How would you rate the nurses' promptness in responding to your family and (you/your child’s) needs?
Overall, would you rate the quality of nursing care as:
Would you please tell me why you did NOT rate it Excellent or Very Good?
Overall, would you rate the quality of doctor care as:
Would you please tell me why you did NOT rate it Excellent or Very Good?
How would you rate the nurse practitioners' communication with (you/you and your child)?
Overall, would you rate the quality of care provided by the nurse practitioners as:
Would you rate the overall teamwork between the doctors, nurses, and staff as:
Would you rate the management of (your/your child’s) pain by Vanderbilt Children’s Hospital staff as:
Overall, how would you rate the respect for (your/you and your child's) privacy?
How would you rate the availability of food when (you/your child) needed it?
Would you say the likelihood of your recommending Vanderbilt Children's Hospital to friends as relatives is:
Overall, would you rate the quality of care provided as:
What could have been done to improve (you/your child's) hospital stay?
Revised February, 2013 26
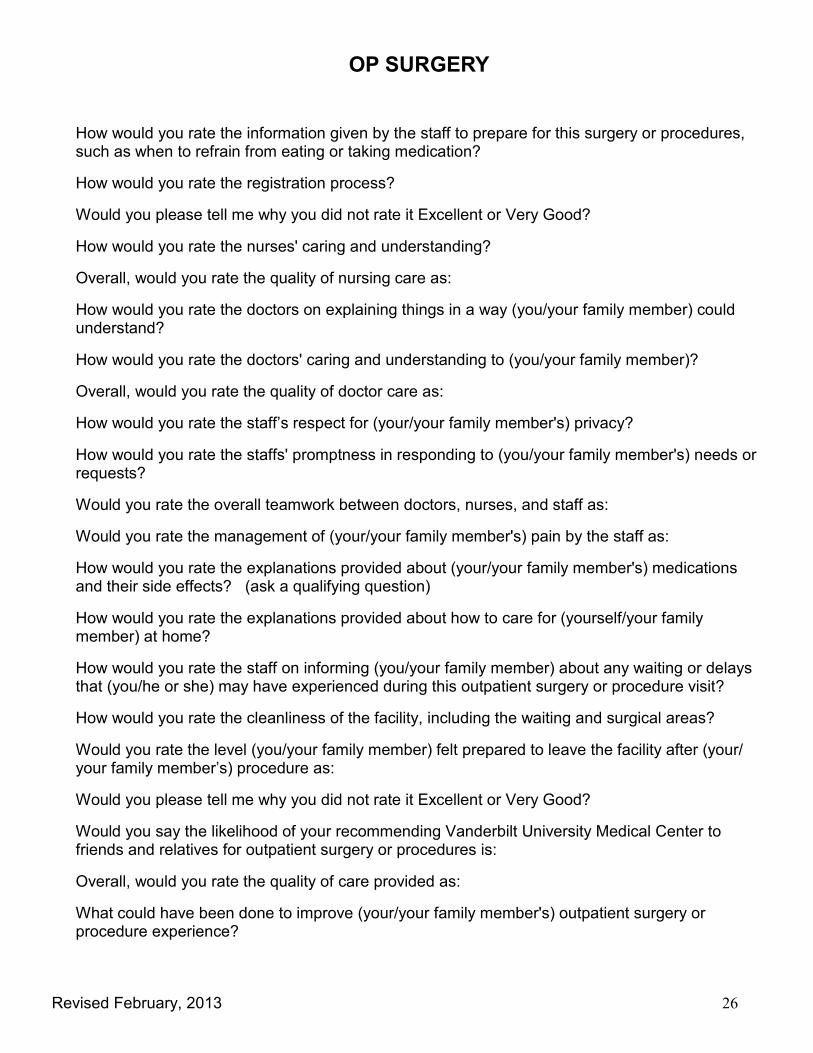
OP SURGERY
How would you rate the information given by the staff to prepare for this surgery or procedures, such as when to refrain from eating or taking medication?
How would you rate the registration process?
Would you please tell me why you did not rate it Excellent or Very Good?
How would you rate the nurses' caring and understanding?
Overall, would you rate the quality of nursing care as:
How would you rate the doctors on explaining things in a way (you/your family member) could understand?
How would you rate the doctors' caring and understanding to (you/your family member)?
Overall, would you rate the quality of doctor care as:
How would you rate the staff’s respect for (your/your family member's) privacy?
How would you rate the staffs' promptness in responding to (you/your family member's) needs or requests?
Would you rate the overall teamwork between doctors, nurses, and staff as:
Would you rate the management of (your/your family member's) pain by the staff as:
How would you rate the explanations provided about (your/your family member's) medications and their side effects? (ask a qualifying question)
How would you rate the explanations provided about how to care for (yourself/your family member) at home?
How would you rate the staff on informing (you/your family member) about any waiting or delays that (you/he or she) may have experienced during this outpatient surgery or procedure visit?
How would you rate the cleanliness of the facility, including the waiting and surgical areas?
Would you rate the level (you/your family member) felt prepared to leave the facility after (your/your family member’s) procedure as:
Would you please tell me why you did not rate it Excellent or Very Good?
Would you say the likelihood of your recommending Vanderbilt University Medical Center to friends and relatives for outpatient surgery or procedures is:
Overall, would you rate the quality of care provided as:
What could have been done to improve (your/your family member's) outpatient surgery or procedure experience?
Revised February, 2013 27
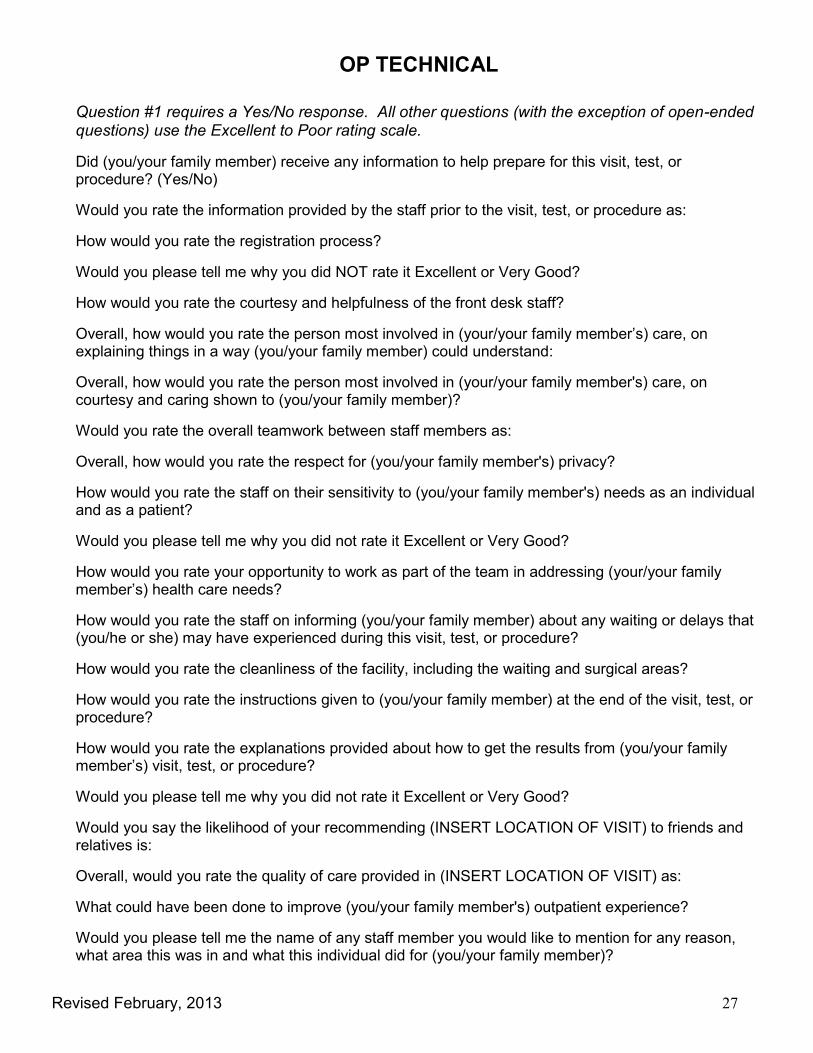
OP TECHNICAL
Question #1 requires a Yes/No response. All other questions (with the exception of open-ended questions) use the Excellent to Poor rating scale.
Did (you/your family member) receive any information to help prepare for this visit, test, or procedure? (Yes/No)
Would you rate the information provided by the staff prior to the visit, test, or procedure as:
How would you rate the registration process?
Would you please tell me why you did NOT rate it Excellent or Very Good?
How would you rate the courtesy and helpfulness of the front desk staff?
Overall, how would you rate the person most involved in (your/your family member’s) care, on explaining things in a way (you/your family member) could understand:
Overall, how would you rate the person most involved in (your/your family member's) care, on courtesy and caring shown to (you/your family member)?
Would you rate the overall teamwork between staff members as:
Overall, how would you rate the respect for (you/your family member's) privacy?
How would you rate the staff on their sensitivity to (you/your family member's) needs as an individual and as a patient?
Would you please tell me why you did not rate it Excellent or Very Good?
How would you rate your opportunity to work as part of the team in addressing (your/your family member’s) health care needs?
How would you rate the staff on informing (you/your family member) about any waiting or delays that (you/he or she) may have experienced during this visit, test, or procedure?
How would you rate the cleanliness of the facility, including the waiting and surgical areas?
How would you rate the instructions given to (you/your family member) at the end of the visit, test, or procedure?
How would you rate the explanations provided about how to get the results from (you/your family member’s) visit, test, or procedure?
Would you please tell me why you did not rate it Excellent or Very Good?
Would you say the likelihood of your recommending (INSERT LOCATION OF VISIT) to friends and relatives is:
Overall, would you rate the quality of care provided in (INSERT LOCATION OF VISIT) as:
What could have been done to improve (you/your family member's) outpatient experience?
Would you please tell me the name of any staff member you would like to mention for any reason, what area this was in and what this individual did for (you/your family member)?

Revised February, 2013 28
VMG PROVIDER
How would you rate the ease of scheduling an appointment with the doctor or medical provider in a timely manner?
How would you rate the courtesy and friendliness of the front desk staff?
How would you rate the doctor or medical provider on explaining things in a way (you/your family member) could understand?
How would you rate the doctor or medical provider on involving (you/your family member) in the decision-making process?
How would you rate this doctor or medical provider on spending time with (you/your family member) during the appointment?
How would you rate this doctor or medical provider on the courtesy and friendliness shown to (you/your family member)?
How would you rate this doctor or medical provider on the attention given to what (you/your family member) had to say?
Would you say the likelihood of your recommending this doctor or medical provider to friends or rel-atives is:
Overall, would you rate Dr.___________as:
Would you please tell me why you did NOT rate him/her as Excellent or Very Good?
Overall, how would you rate the nurses and other clinical staff on the courtesy and friendliness?
Overall, how would you rate the nurses and other clinic staff on informing (you/your family member) of test or exam results?
Overall, how would you rate the nurses and other clinical staff on the explanations provided about (your/your family member’s) medications and their side effects? (ask a qualifying question)
Would you rate the overall teamwork between the doctors, medical providers, nurses, and staff as:
Overall, how would you rate the respect for (your/your family member’s) privacy?
How would you rate the staff on informing (you/your family member) about any waiting or delays that (you/he or she) may have experienced during the visit?
How would you rate the cleanliness of the clinic, including the exam room and waiting areas?
Overall, would you rate the quality of care as:
What suggestions do you have for this provider and staff to improve their service to you?

Revised February, 2013 29
ADULT ED
How would you rate the promptness of the person who first greeted (you/your family member) and asked the reason for your visit?
How would you rate the emergency room registration process?
How would you rate the nurses’ instructions and explanations of (your/your family member’s) treatment and tests?
How would you rate the nurses’ courtesy and respect shown toward (you/your family member)?
Overall, would you rate the overall quality of nursing care as:
Would you please tell me why you did not rate it Excellent or Very Good?
How would you rate the doctor’s on listening to (your/your family member’s) concerns?
How would you rate the doctor on explaining things in a way (you/your family member) could understand?
Overall, would you rate the quality of doctor care as:
Would you please tell me why you did not rate it Excellent or Very Good?
Would you rate the overall teamwork between the doctors, nurses, and staff as:
Would you rate the management of (your/your family member’s) pain by the emergency room staff as:
Did (you/your family member) receive any radiology procedures, such as an x-ray, during this emergency room visit?
How would you rate the courtesy and professionalism of the person who provided this service?
How would you rate the cleanliness of the emergency room, including the exam room and waiting areas?
Overall, how would you rate the respect for (your/your family member’s) privacy?
How would you rate the staff on informing (you/your family member) about any waiting or delays that (you/he or she) may have experienced during this emergency room visit?
How would you rate the instructions (you/your family member) received about the symptoms or health problems to look out for after this emergency room visit?
Would you say the likelihood of your recommending Vanderbilt University Medical Center’s Adult ED to friends and relatives for emergency services is:
Overall, would you rate the quality of care provided as:
What could have been done to improve (your/your family member’s) emergency room experience?

Revised February, 2013 30
ADULT IP
During this hospital stay, how often did nurses treat (you/your family member) with courtesy and respect?
During this hospital stay, how often did nurses listen carefully to (you/your family member)?
During this hospital stay, how often did nurses explain things in a way (you/your family member) could understand?
During this hospital stay, after (you/your family member) pressed the call button, how often did (you/your family member) get help as soon as (you/he or she) wanted it?
During this hospital stay, how often did doctors treat (you/your family member) with courtesy and respect?
During this hospital stay, how often did doctors listen carefully to (you/your family member)?
During this hospital stay, how often did doctors explain things in a way (you/your family member) could understand?
During this hospital stay, how often were (your/your family member’s) room and bathroom kept clean?
During this hospital stay, how often was the area around (your/your family member’s) room quiet at night?
During this hospital stay, did (you/your family member) need help from nurses or other hospital staff in getting to the bathroom or in using a bedpan?
How often did (you/your family member) get help in getting to the bathroom or in using a bedpan as soon as (you/he or she) wanted?
During this hospital stay, did (you/your family member) need medicine for pain? (Yes/No)
During this hospital stay, how often was (your/your family member’s) pain well controlled?
During this hospital stay, how often did the hospital staff do everything they could to help (you/your family member) with (your/his or her) pain?
During this hospital stay, (were you/was your family member) given any medicine that (you/he or she) had not taken before? (Yes/No)
Before giving (you/your family member) any new medicine, how often did hospital staff tell (you/your family member) what the medicine was for?
Before giving (you/your family member) any new medicine, how often did hospital staff describe possible side effects in a way (you/your family member) could understand?
After (you/your family member) left the hospital, did (you/your family member) go directly to (your/his or her) own home, to someone else’s home, or to another health facility?

Revised February, 2013 31
ADULT IP, Continued
During this hospital stay, did doctors, nurses, or other hospital staff talk with (you/your family member) about whether (you/he or she) would have the help (you/your family member) needed when (you/he or she) left the hospital? (Yes/No)
During this hospital stay, did (you/your family member) get information in writing about what symptoms or health problems to look out for after (you/your family member) left the hospital? (Yes/No)
Using any number from 0 to 10, where 0 is the “worst hospital possible” and 10 is the “best hospital possible”, what number would you use to rate this hospital during your stay? (0-10)
Would you recommend this hospital to your friends and family? (Definitely Yes, Probably Yes, Probably No, Definitely No)
Care Transitions: Strongly Disagree, Disagree, Agree, Strongly Agree, Don’t Know/Don’t
Remember/Not Applicable
During this hospital stay, staff took my preferences and those of my family or caregiver into account in deciding what my health care needs would be when I left.
When I left the hospital, I had a good understanding of the things I was responsible for in managing my health.
Why I left the hospital, I clearly understood the purpose for taking each of my medications.
Question Scale : Excellent to Poor
How would you rate your level of confidence and trust you had in the nurses who cared for (you/your family member)?
Overall, would you rate the quality of nursing care as:
Would you please tell me why you did NOT rate it Excellent or Very Good?
How would you rate the doctor on involving (you/your family member) in decisions about (your/his or her) care?
Overall, would you rate the quality of doctor care as:
Would you please tell me why you did NOT rate it Excellent or Very Good?
Would you rate the overall teamwork between doctors, nurses, and staff as:
Overall, how would you rate the respect for (your/your family member's) privacy?
Overall, would you rate the quality of care provided as:
What could have been done to improve (your/your family member's) hospital stay?

Revised February, 2013 32
PSYCHIATRIC IP - Adult Survey
All answers are “Never/Sometimes/Usually/Always” unless otherwise noted.
Were you able to get checked into your room at the hospital in a timely manner? (Yes/No)
If you had to wait to go to your room, did someone from the hospital explain the reason for the delay? (No/Yes, somewhat/Yes, mostly/ Yes, definitely)
How organized was the admission process? (Not at all, Somewhat, Very, Completely)
How often did nurses treat you with courtesy and respect?
How often did nurses listen carefully to you?
How often did nurses explain things in a way you could understand?
When you asked for help, how often did you get help as soon as you wanted it?
How often were you able to discuss your worries or concerns with nurses? (also, Did not have worries/concerns)
How often did you have confidence and trust in the nurses treating you?
How often did doctors treat you with courtesy and respect?
How often did doctors listen carefully to you?
How often did doctors explain things in a way you could understand?
How often were you able to discuss your worries or concerns with doctors? (also, Did not have worries/concerns)
How often did you have confidence and trust in the doctors treating you?
How often did the people you saw for counseling or treatment spend enough time with you?
How often did you feel safe when you were with the people you saw for counseling or treatment?
Were you given all the information you wanted about what you could do to help manage your condition? (No/Yes, somewhat/Yes, mostly/ Yes, definitely)
Were you given all the information you wanted about different kinds of counseling, support groups or other treatments that are available? (No/Yes, somewhat/Yes, mostly/ Yes, definitely)
Were you given all the information you wanted about your rights as a patient? (No/Yes, somewhat/Yes, mostly/ Yes, definitely)
Does your language, race, religion, ethnic background or culture make any difference in the kind of counseling or treatment you need? (Yes/No)
How often was the care you received responsive to those needs?
How often did you feel you could refuse a specific type of medicine or treatment?
How often was your privacy respected?
How often were your room and bathroom kept clean?
How often was the area around your room quiet at night?
Were you given any medicine that you had not taken before? (Yes/No)
Before giving you any new medicine, how often did hospital staff tell you what the medicine was for?
Revised February, 2013 33
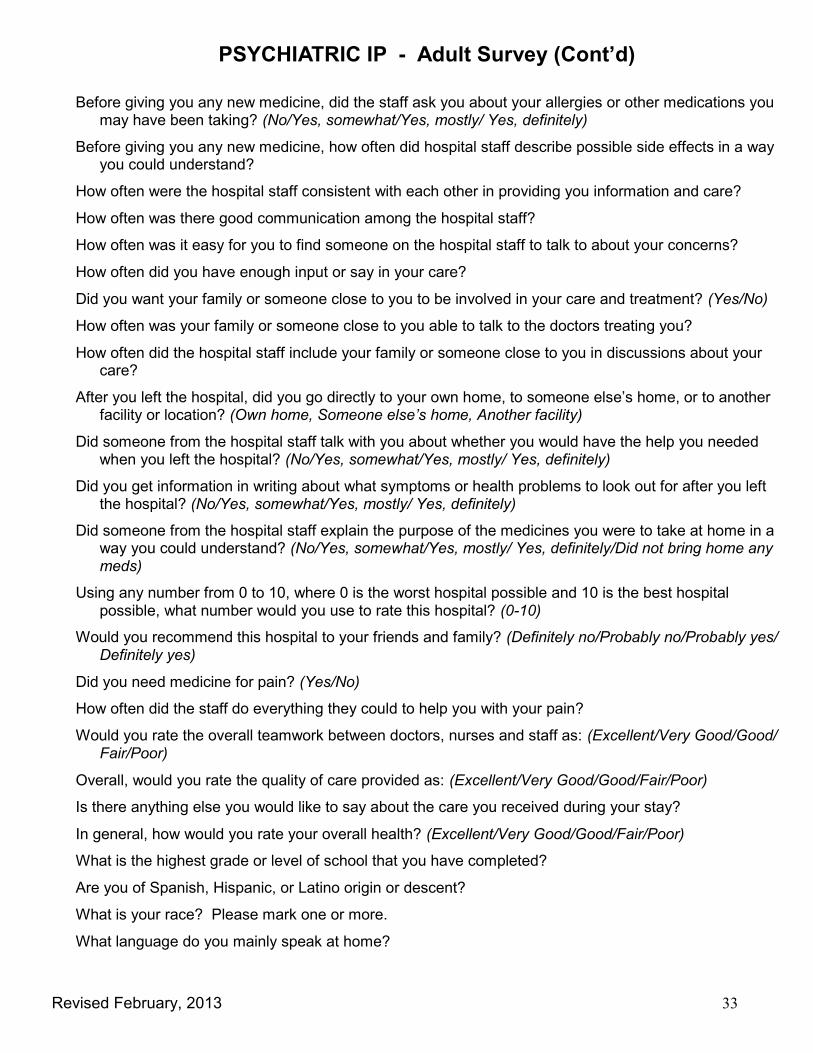
PSYCHIATRIC IP - Adult Survey (Cont’d)
Before giving you any new medicine, did the staff ask you about your allergies or other medications you may have been taking? (No/Yes, somewhat/Yes, mostly/ Yes, definitely)
Before giving you any new medicine, how often did hospital staff describe possible side effects in a way you could understand?
How often were the hospital staff consistent with each other in providing you information and care?
How often was there good communication among the hospital staff?
How often was it easy for you to find someone on the hospital staff to talk to about your concerns?
How often did you have enough input or say in your care?
Did you want your family or someone close to you to be involved in your care and treatment? (Yes/No)
How often was your family or someone close to you able to talk to the doctors treating you?
How often did the hospital staff include your family or someone close to you in discussions about your care?
After you left the hospital, did you go directly to your own home, to someone else’s home, or to another facility or location? (Own home, Someone else’s home, Another facility)
Did someone from the hospital staff talk with you about whether you would have the help you needed when you left the hospital? (No/Yes, somewhat/Yes, mostly/ Yes, definitely)
Did you get information in writing about what symptoms or health problems to look out for after you left the hospital? (No/Yes, somewhat/Yes, mostly/ Yes, definitely)
Did someone from the hospital staff explain the purpose of the medicines you were to take at home in a way you could understand? (No/Yes, somewhat/Yes, mostly/ Yes, definitely/Did not bring home any meds)
Using any number from 0 to 10, where 0 is the worst hospital possible and 10 is the best hospital possible, what number would you use to rate this hospital? (0-10)
Would you recommend this hospital to your friends and family? (Definitely no/Probably no/Probably yes/ Definitely yes)
Did you need medicine for pain? (Yes/No)
How often did the staff do everything they could to help you with your pain?
Would you rate the overall teamwork between doctors, nurses and staff as: (Excellent/Very Good/Good/Fair/Poor)
Overall, would you rate the quality of care provided as: (Excellent/Very Good/Good/Fair/Poor)
Is there anything else you would like to say about the care you received during your stay?
In general, how would you rate your overall health? (Excellent/Very Good/Good/Fair/Poor)
What is the highest grade or level of school that you have completed?
Are you of Spanish, Hispanic, or Latino origin or descent?
What is your race? Please mark one or more.
What language do you mainly speak at home?
Revised February, 2013 34
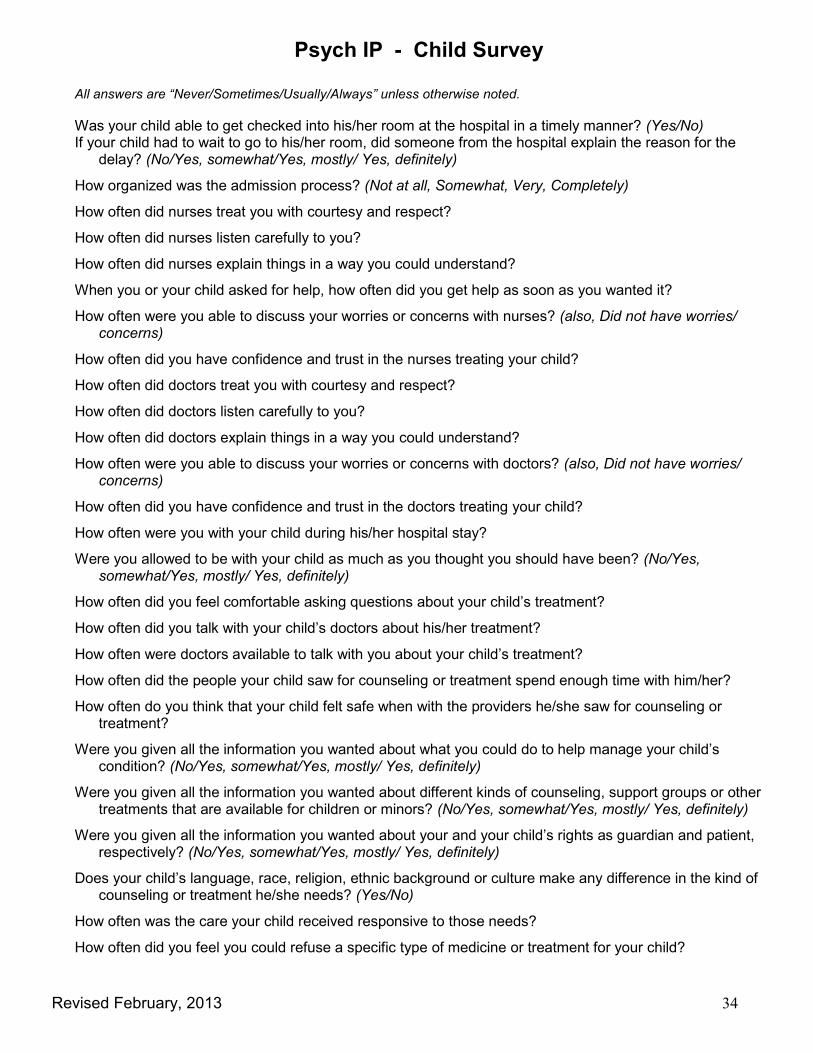
Psych IP - Child Survey
All answers are “Never/Sometimes/Usually/Always” unless otherwise noted.
Was your child able to get checked into his/her room at the hospital in a timely manner? (Yes/No) If your child had to wait to go to his/her room, did someone from the hospital explain the reason for the
delay? (No/Yes, somewhat/Yes, mostly/ Yes, definitely)
How organized was the admission process? (Not at all, Somewhat, Very, Completely)
How often did nurses treat you with courtesy and respect?
How often did nurses listen carefully to you?
How often did nurses explain things in a way you could understand?
When you or your child asked for help, how often did you get help as soon as you wanted it?
How often were you able to discuss your worries or concerns with nurses? (also, Did not have worries/concerns)
How often did you have confidence and trust in the nurses treating your child?
How often did doctors treat you with courtesy and respect?
How often did doctors listen carefully to you?
How often did doctors explain things in a way you could understand?
How often were you able to discuss your worries or concerns with doctors? (also, Did not have worries/concerns)
How often did you have confidence and trust in the doctors treating your child?
How often were you with your child during his/her hospital stay?
Were you allowed to be with your child as much as you thought you should have been? (No/Yes, somewhat/Yes, mostly/ Yes, definitely)
How often did you feel comfortable asking questions about your child’s treatment?
How often did you talk with your child’s doctors about his/her treatment?
How often were doctors available to talk with you about your child’s treatment?
How often did the people your child saw for counseling or treatment spend enough time with him/her?
How often do you think that your child felt safe when with the providers he/she saw for counseling or treatment?
Were you given all the information you wanted about what you could do to help manage your child’s condition? (No/Yes, somewhat/Yes, mostly/ Yes, definitely)
Were you given all the information you wanted about different kinds of counseling, support groups or other treatments that are available for children or minors? (No/Yes, somewhat/Yes, mostly/ Yes, definitely)
Were you given all the information you wanted about your and your child’s rights as guardian and patient, respectively? (No/Yes, somewhat/Yes, mostly/ Yes, definitely)
Does your child’s language, race, religion, ethnic background or culture make any difference in the kind of counseling or treatment he/she needs? (Yes/No)
How often was the care your child received responsive to those needs?
How often did you feel you could refuse a specific type of medicine or treatment for your child?
Revised February, 2013 35
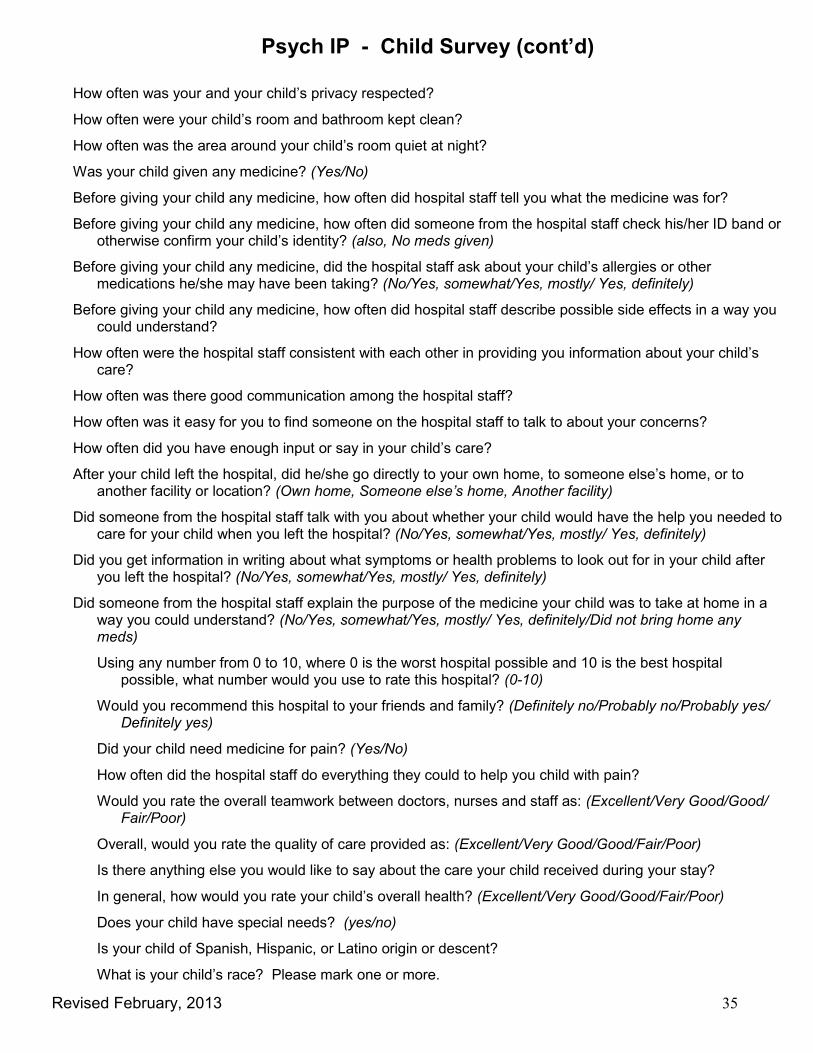
Psych IP - Child Survey (cont’d)
How often was your and your child’s privacy respected?
How often were your child’s room and bathroom kept clean?
How often was the area around your child’s room quiet at night?
Was your child given any medicine? (Yes/No)
Before giving your child any medicine, how often did hospital staff tell you what the medicine was for?
Before giving your child any medicine, how often did someone from the hospital staff check his/her ID band or otherwise confirm your child’s identity? (also, No meds given)
Before giving your child any medicine, did the hospital staff ask about your child’s allergies or other medications he/she may have been taking? (No/Yes, somewhat/Yes, mostly/ Yes, definitely)
Before giving your child any medicine, how often did hospital staff describe possible side effects in a way you could understand?
How often were the hospital staff consistent with each other in providing you information about your child’s care?
How often was there good communication among the hospital staff?
How often was it easy for you to find someone on the hospital staff to talk to about your concerns?
How often did you have enough input or say in your child’s care?
After your child left the hospital, did he/she go directly to your own home, to someone else’s home, or to another facility or location? (Own home, Someone else’s home, Another facility)
Did someone from the hospital staff talk with you about whether your child would have the help you needed to care for your child when you left the hospital? (No/Yes, somewhat/Yes, mostly/ Yes, definitely)
Did you get information in writing about what symptoms or health problems to look out for in your child after you left the hospital? (No/Yes, somewhat/Yes, mostly/ Yes, definitely)
Did someone from the hospital staff explain the purpose of the medicine your child was to take at home in a way you could understand? (No/Yes, somewhat/Yes, mostly/ Yes, definitely/Did not bring home any meds)
Using any number from 0 to 10, where 0 is the worst hospital possible and 10 is the best hospital possible, what number would you use to rate this hospital? (0-10)
Would you recommend this hospital to your friends and family? (Definitely no/Probably no/Probably yes/ Definitely yes)
Did your child need medicine for pain? (Yes/No)
How often did the hospital staff do everything they could to help you child with pain?
Would you rate the overall teamwork between doctors, nurses and staff as: (Excellent/Very Good/Good/Fair/Poor)
Overall, would you rate the quality of care provided as: (Excellent/Very Good/Good/Fair/Poor)
Is there anything else you would like to say about the care your child received during your stay?
In general, how would you rate your child’s overall health? (Excellent/Very Good/Good/Fair/Poor)
Does your child have special needs? (yes/no)
Is your child of Spanish, Hispanic, or Latino origin or descent?
What is your child’s race? Please mark one or more.

Revised February, 2013 36
URGENT CARE
How would you rate the registration process?
How would you rate this doctor or medical provider on explaining things in a way you could understand?
Overall, would you rate the doctor or medical provider as:
Would you please tell me why you did not rate him/her as Excellent or Very Good?
Overall, would you rate the quality of nursing care as:
Would you please tell me why you did not rate it Excellent or Very Good?
Would you rate the overall teamwork between the doctors, medical providers, nurses, and staff as:
How would you rate the explanations provided about (your/your family member’s) medications and their side effects? (ask a qualifying question)
How would you rate the cleanliness of the clinic, including the exam room and waiting areas?
Overall, how would you rate the respect for (you/your family member's) privacy?
How would you rate the staff on informing (you/your family member) about any waiting or delays that (you/he or she) may have experienced during the visit?
How would you rate the instructions (you/your family member) received about the symptoms or health problems to look out for after this visit?
Would you say the likelihood of your recommending this clinic to (faculty and staff) or (friends or relatives) is:
Overall, would you rate the quality of care provided as:
Would you please tell me why you did not rate it Excellent or Very Good?
What could have been done to improve (your/your family member's) experience?
Revised February, 2013 37
Using PRC EasyView: Getting Started
Logging In Your Homepage Navigation Tips
Scorecards Best Practices Ideas @ Work
Revised February, 2013 38
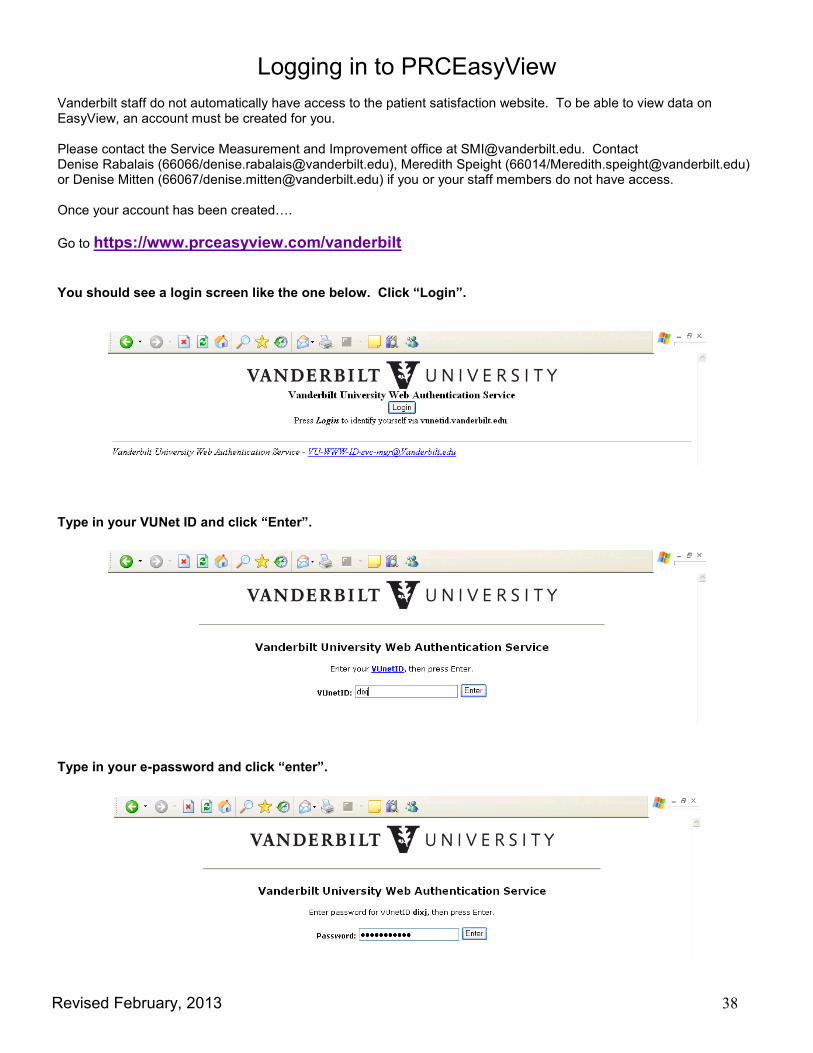
Logging in to PRCEasyView
Vanderbilt staff do not automatically have access to the patient satisfaction website. To be able to view data on EasyView, an account must be created for you. Please contact the Service Measurement and Improvement office at [email protected]. Contact Denise Rabalais (66066/[email protected]), Meredith Speight (66014/[email protected]) or Denise Mitten (66067/[email protected]) if you or your staff members do not have access. Once your account has been created….
Go to https://www.prceasyview.com/vanderbilt You should see a login screen like the one below. Click “Login”. Type in your VUNet ID and click “Enter”. Type in your e-password and click “enter”.
Revised February, 2013 39
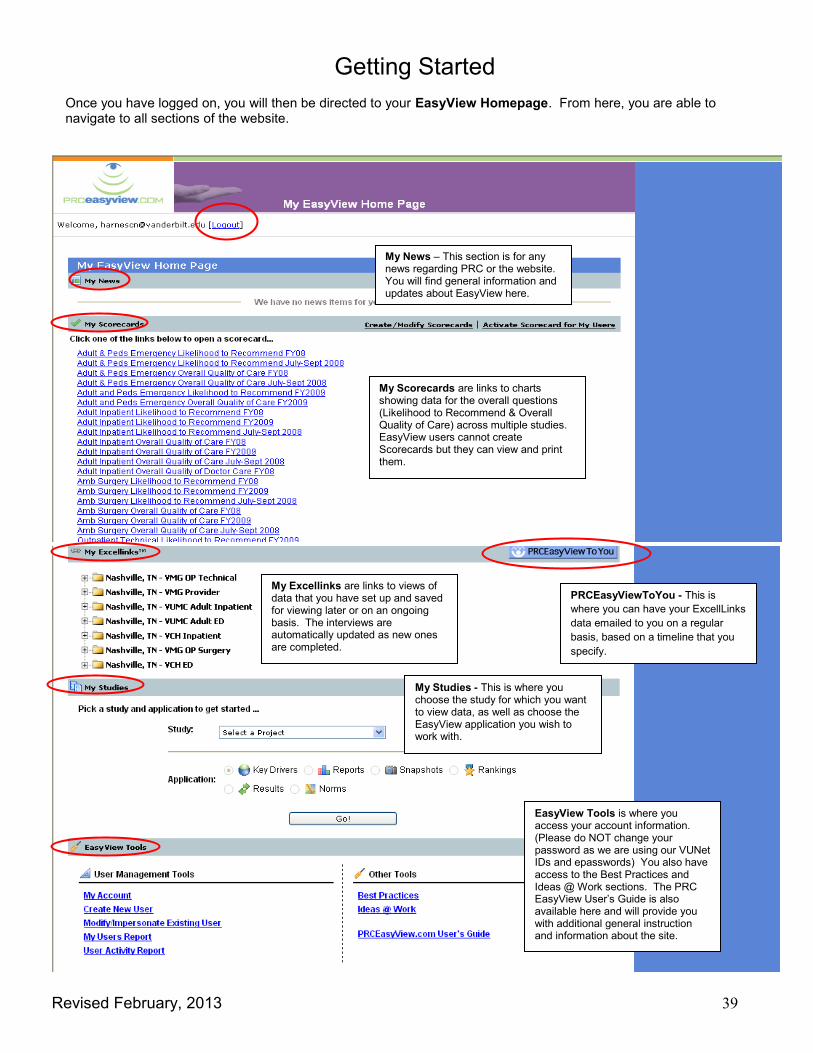
Getting Started Once you have logged on, you will then be directed to your EasyView Homepage. From here, you are able to navigate to all sections of the website.
My News – This section is for any news regarding PRC or the website. You will find general information and updates about EasyView here.
My Scorecards are links to charts showing data for the overall questions (Likelihood to Recommend & Overall Quality of Care) across multiple studies. EasyView users cannot create Scorecards but they can view and print them.
My Excellinks are links to views of data that you have set up and saved for viewing later or on an ongoing basis. The interviews are automatically updated as new ones are completed.
My Studies - This is where you choose the study for which you want to view data, as well as choose the EasyView application you wish to work with.
EasyView Tools is where you access your account information. (Please do NOT change your password as we are using our VUNet IDs and epasswords) You also have access to the Best Practices and Ideas @ Work sections. The PRC EasyView User’s Guide is also available here and will provide you with additional general instruction and information about the site.
PRCEasyViewToYou - This is
where you can have your ExcellLinks
data emailed to you on a regular
basis, based on a timeline that you
specify.
Revised February, 2013 40
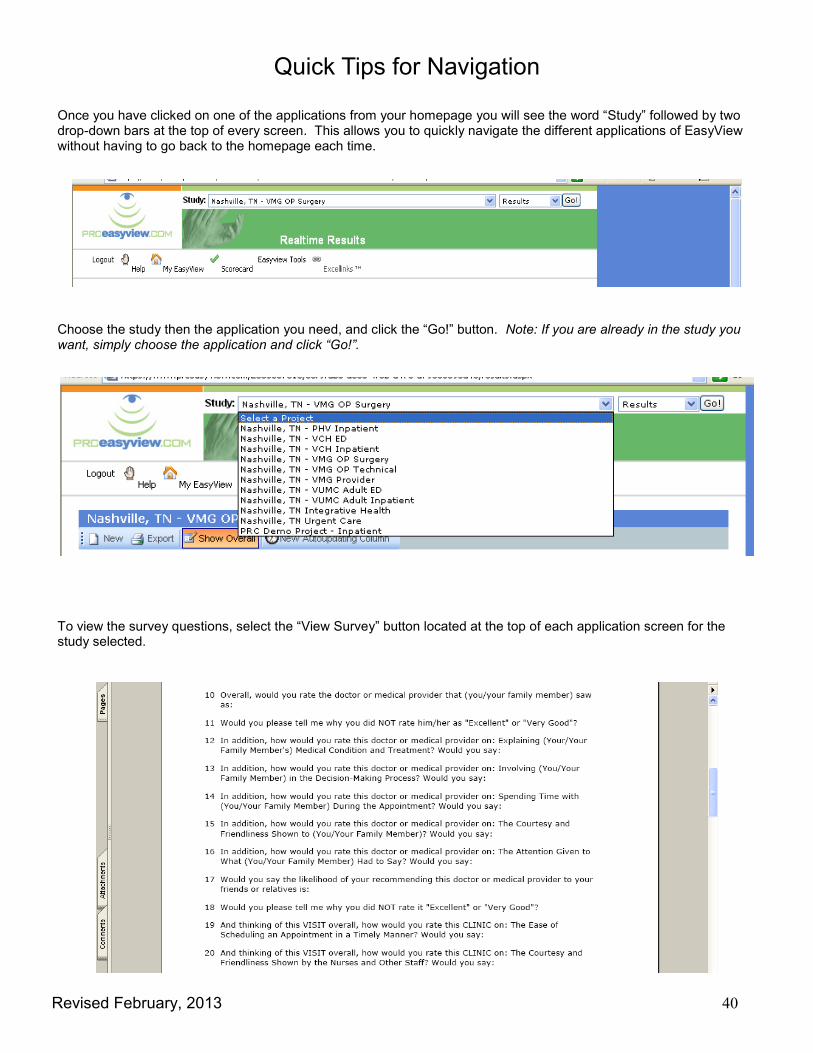
Quick Tips for Navigation Once you have clicked on one of the applications from your homepage you will see the word “Study” followed by two drop-down bars at the top of every screen. This allows you to quickly navigate the different applications of EasyView without having to go back to the homepage each time.
Choose the study then the application you need, and click the “Go!” button. Note: If you are already in the study you want, simply choose the application and click “Go!”.
To view the survey questions, select the “View Survey” button located at the top of each application screen for the study selected.

Revised February, 2013 41
Quick Tips for Navigation
Beneath the “Study Drop-Down Menu Box”, there is an additional menu bar with several options.
Open, Add or Manage your Excellinks. You can remove an Excellink if you are currently in one. To do this, click on “Remove” and the screen will flash. You will no longer see that Excellink in your list.
End your EasyView session and log out of the system.
Access the User’s Guide, and takes you to a form where you may request help directly from PRC.
Will return you to your EasyView homepage
Give you links to all the Scorecards available
Gives you access to the various tools available for your account. These are the same tools that are located at the bottom of you homepage under EasyView Tools.

Revised February, 2013 42
Scorecards
Scorecards allow users to view satisfaction results of all nursing units and clinics within the same or between different studies, on the same graph. Every scorecard has the same bar chart format. This section is updated with the latest quarter or fiscal year’s data for quick and easy reference. Only administrative users and PRC can create scorecards. Once they are created, everyone can view them and/or print them.
Some common abbreviations you may see in the Scorecards section and perhaps in other areas of the website: OQC = Overall Quality of Care OQDC = Overall Quality of Doctor Care OT = Overall Teamwork
Revised February, 2013 43
Scorecards
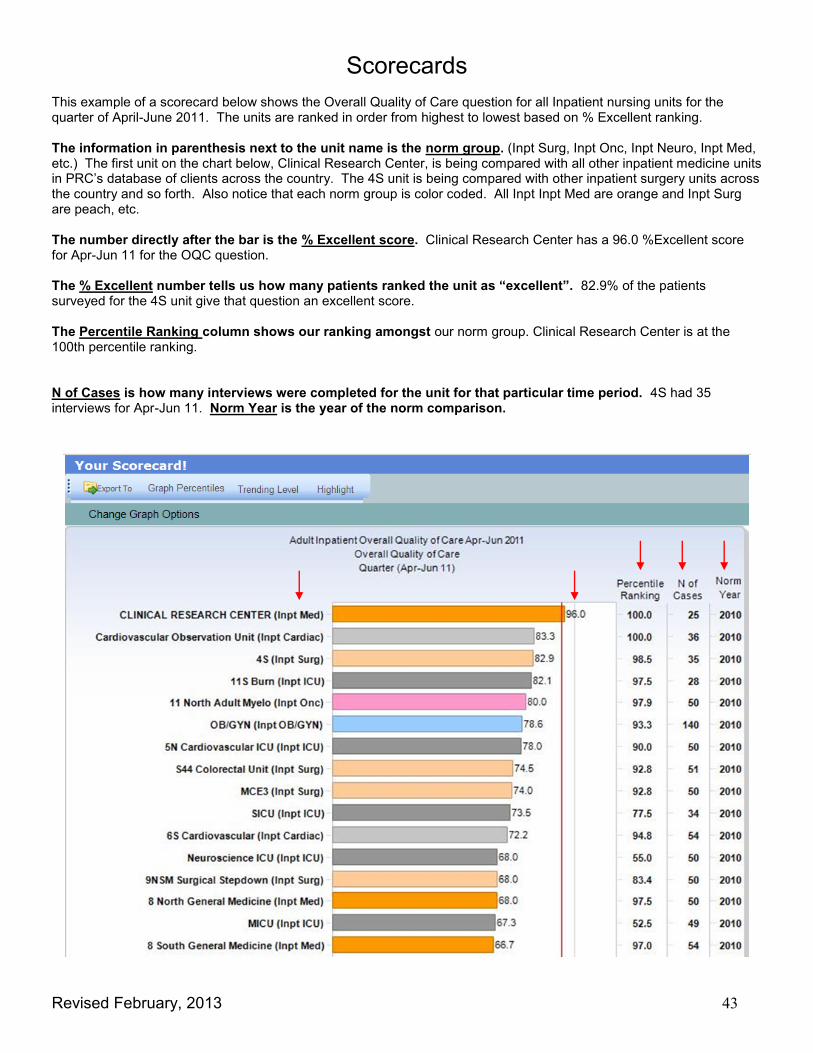
This example of a scorecard below shows the Overall Quality of Care question for all Inpatient nursing units for the quarter of April-June 2011. The units are ranked in order from highest to lowest based on % Excellent ranking. The information in parenthesis next to the unit name is the norm group. (Inpt Surg, Inpt Onc, Inpt Neuro, Inpt Med, etc.) The first unit on the chart below, Clinical Research Center, is being compared with all other inpatient medicine units in PRC’s database of clients across the country. The 4S unit is being compared with other inpatient surgery units across the country and so forth. Also notice that each norm group is color coded. All Inpt Inpt Med are orange and Inpt Surg are peach, etc. The number directly after the bar is the % Excellent score. Clinical Research Center has a 96.0 %Excellent score for Apr-Jun 11 for the OQC question. The % Excellent number tells us how many patients ranked the unit as “excellent”. 82.9% of the patients surveyed for the 4S unit give that question an excellent score. The Percentile Ranking column shows our ranking amongst our norm group. Clinical Research Center is at the 100th percentile ranking. N of Cases is how many interviews were completed for the unit for that particular time period. 4S had 35 interviews for Apr-Jun 11. Norm Year is the year of the norm comparison.

Revised February, 2013 44
Best Practices At the bottom of your home page screen you will see a link for “Best Practices”.
Clicking on this “Best Practices” link will take you to a screen with a list of some of PRC’s award winning healthcare clients, as well as their contact information. These clients have scored well on the Overall Quality of Care question. This is meant to be a resource for you if you would like to contact any of the hospitals on this list and speak to them about particular things they are doing at their facilities to score highly on the Overall Quality of Care question. Notice the “Category” drop down menu on the left of the screen. Here you can narrow down the list of hospitals to areas similar to your own.

Revised February, 2013 45
Ideas @ Work At the bottom of your home page screen directly under “Best Practices”, you will see a link for “Ideas @ Work”.
This application lists PRC’s top performing hospitals, their contact information and case studies for different survey categories. You can choose a category you are interested in from the “Idea Category” drop down menu and read about the action plans of various organizations. You may also contact the person listed at that facility if you have questions or would like more information.

Revised February, 2013 46
Key Drivers

Revised February, 2013 47
Key Drivers
Key Drivers are statistically calculated by PRC at the beginning of each fiscal year and are the survey questions that are most influential in how patients evaluate Overall Quality of Care. Usually there will be three Key Drivers, sometimes only two. They give you an idea of how to prioritize your improvement efforts. As scores for the Key Driver questions im-prove, the Overall Quality of Care question scores also increase. Key Drivers are available at the Total, PCC, Specialty, Clinic, Nursing Unit and Provider levels depending on which study you are looking at. For more information on Key Drivers, go to the “Interpreting and Using Key Drivers: FAQ” information at the end of this section of the manual. To access Key Drivers, select the study you are interested in, click in the circle next to “Key Drivers” and click on the “Go!” button.
To access the “Key Drivers” section if you are already within the website, go to the top of the screen and click on “Key Drivers”. Make sure you have selected the correct study name in the “Study” drop down menu.
Revised February, 2013 48
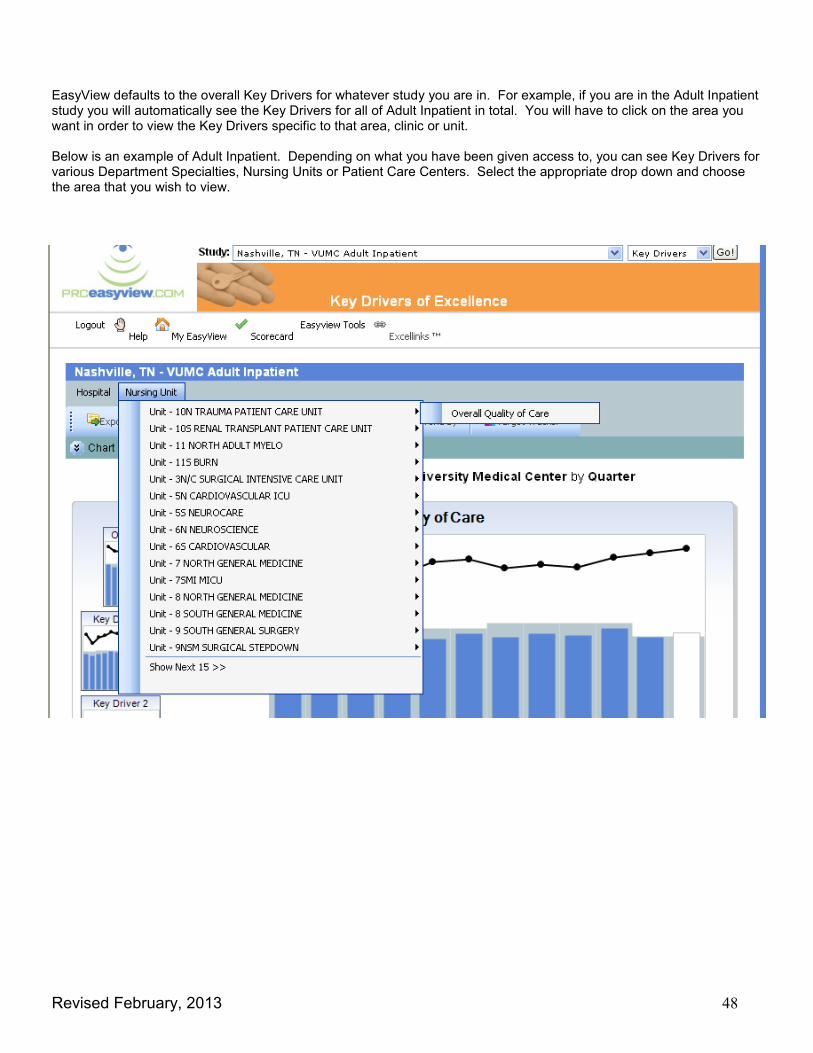
EasyView defaults to the overall Key Drivers for whatever study you are in. For example, if you are in the Adult Inpatient study you will automatically see the Key Drivers for all of Adult Inpatient in total. You will have to click on the area you want in order to view the Key Drivers specific to that area, clinic or unit. Below is an example of Adult Inpatient. Depending on what you have been given access to, you can see Key Drivers for various Department Specialties, Nursing Units or Patient Care Centers. Select the appropriate drop down and choose the area that you wish to view.
Revised February, 2013 49
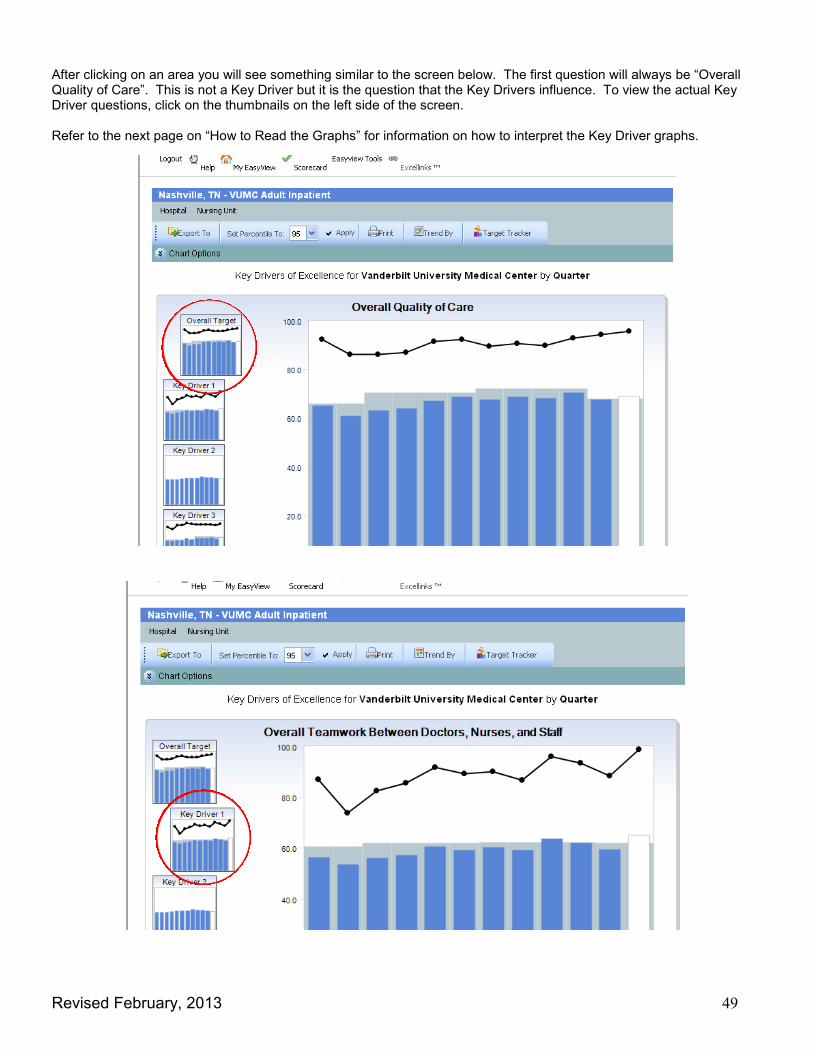
After clicking on an area you will see something similar to the screen below. The first question will always be “Overall Quality of Care”. This is not a Key Driver but it is the question that the Key Drivers influence. To view the actual Key Driver questions, click on the thumbnails on the left side of the screen. Refer to the next page on “How to Read the Graphs” for information on how to interpret the Key Driver graphs.
Revised February, 2013 50
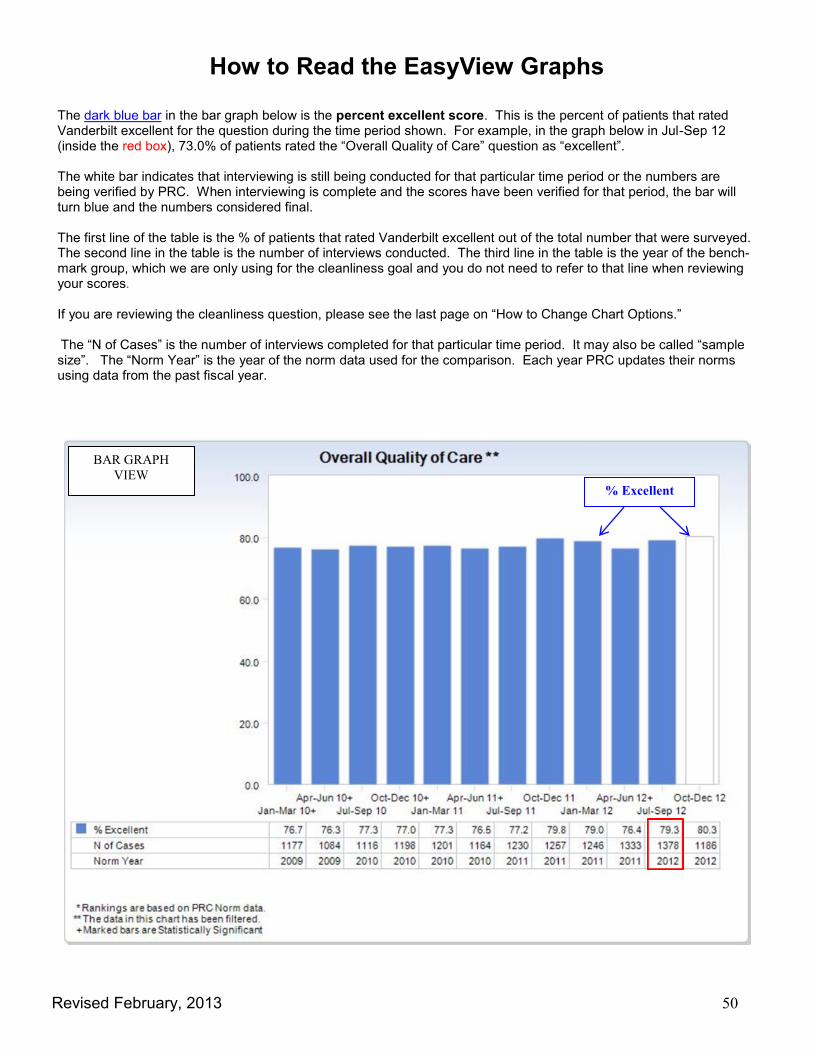
How to Read the EasyView Graphs The dark blue bar in the bar graph below is the percent excellent score. This is the percent of patients that rated Vanderbilt excellent for the question during the time period shown. For example, in the graph below in Jul-Sep 12 (inside the red box), 73.0% of patients rated the “Overall Quality of Care” question as “excellent”. The white bar indicates that interviewing is still being conducted for that particular time period or the numbers are being verified by PRC. When interviewing is complete and the scores have been verified for that period, the bar will turn blue and the numbers considered final. The first line of the table is the % of patients that rated Vanderbilt excellent out of the total number that were surveyed. The second line in the table is the number of interviews conducted. The third line in the table is the year of the bench-mark group, which we are only using for the cleanliness goal and you do not need to refer to that line when reviewing your scores. If you are reviewing the cleanliness question, please see the last page on “How to Change Chart Options.” The “N of Cases” is the number of interviews completed for that particular time period. It may also be called “sample size”. The “Norm Year” is the year of the norm data used for the comparison. Each year PRC updates their norms using data from the past fiscal year.
BAR GRAPH
VIEW
% Excellent
Revised February, 2013 51
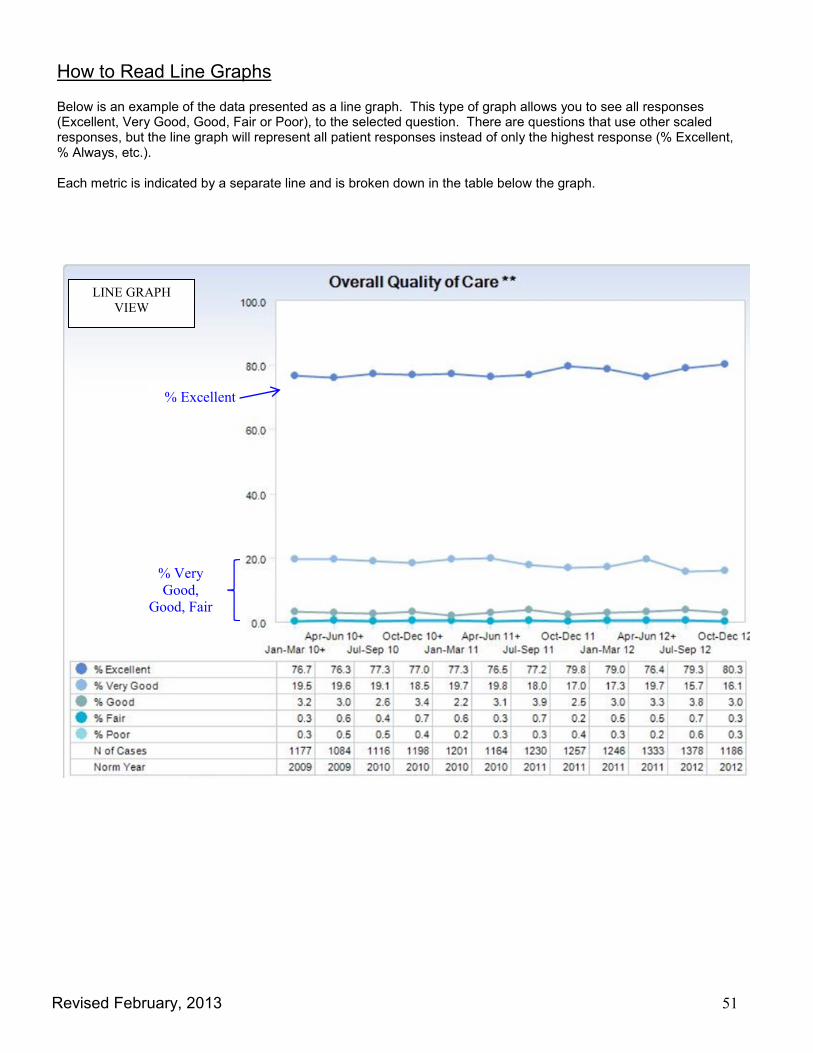
How to Read Line Graphs Below is an example of the data presented as a line graph. This type of graph allows you to see all responses (Excellent, Very Good, Good, Fair or Poor), to the selected question. There are questions that use other scaled responses, but the line graph will represent all patient responses instead of only the highest response (% Excellent, % Always, etc.). Each metric is indicated by a separate line and is broken down in the table below the graph.
LINE GRAPH
VIEW
% Excellent
% Very
Good,
Good, Fair
Revised February, 2013 52
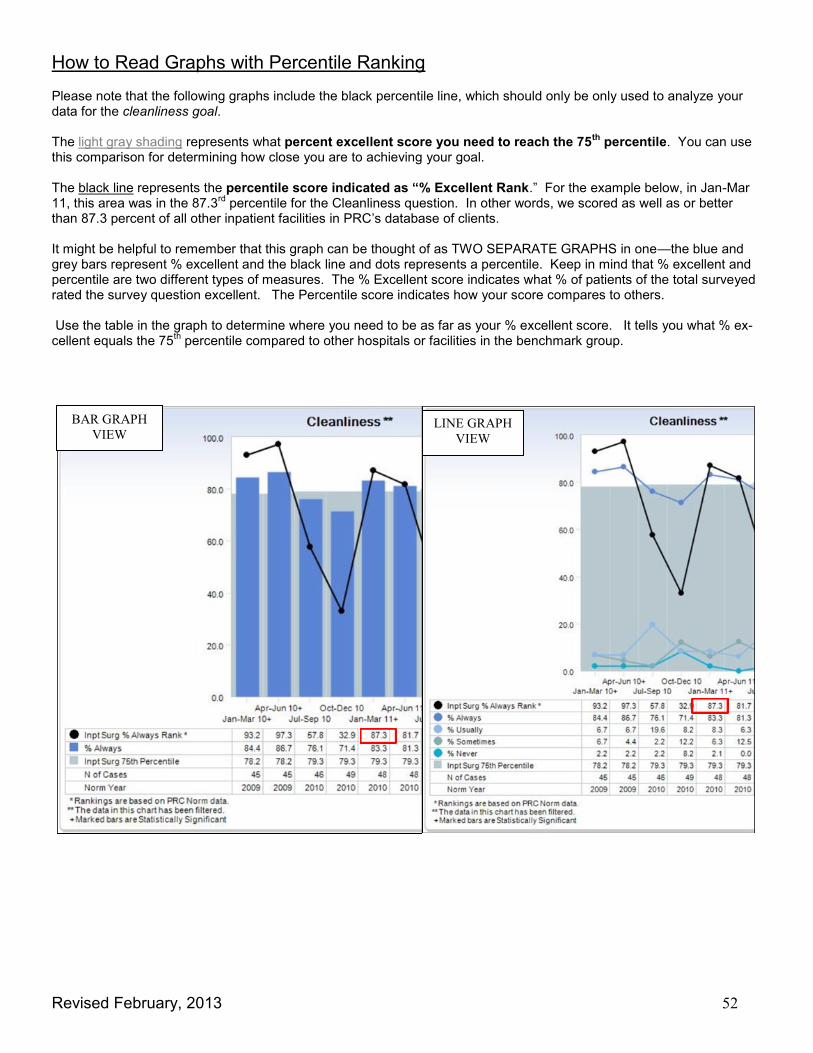
How to Read Graphs with Percentile Ranking Please note that the following graphs include the black percentile line, which should only be only used to analyze your data for the cleanliness goal. The light gray shading represents what percent excellent score you need to reach the 75
th percentile. You can use
this comparison for determining how close you are to achieving your goal. The black line represents the percentile score indicated as “% Excellent Rank.” For the example below, in Jan-Mar 11, this area was in the 87.3
rd percentile for the Cleanliness question. In other words, we scored as well as or better
than 87.3 percent of all other inpatient facilities in PRC’s database of clients. It might be helpful to remember that this graph can be thought of as TWO SEPARATE GRAPHS in one—the blue and grey bars represent % excellent and the black line and dots represents a percentile. Keep in mind that % excellent and percentile are two different types of measures. The % Excellent score indicates what % of patients of the total surveyed rated the survey question excellent. The Percentile score indicates how your score compares to others. Use the table in the graph to determine where you need to be as far as your % excellent score. It tells you what % ex-cellent equals the 75
th percentile compared to other hospitals or facilities in the benchmark group.
BAR GRAPH
VIEW LINE GRAPH
VIEW

Revised February, 2013 53
How to Change the Chart Options To view the chart options, click on the button next to “Chart Options.” To remove the black percentile line from your graphs, uncheck “Draw % Top Box Ranking.” To remove the gray shading, uncheck “Draw Goal Line”. Click “Apply Options”. If you want to view the data in a line graph format, check “Draw Lines Instead of Bars”. These changes will affect the data in both the graph and table. See below for examples of the charts with these options.
Revised February, 2013 54
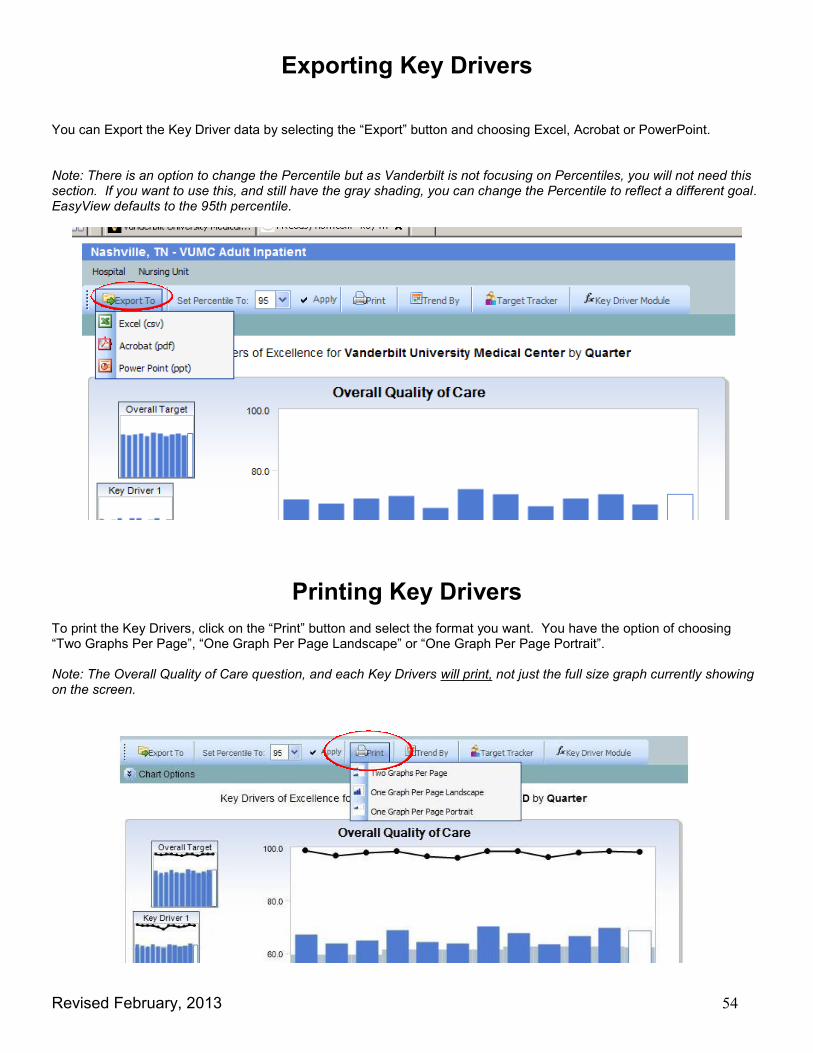
Exporting Key Drivers
You can Export the Key Driver data by selecting the “Export” button and choosing Excel, Acrobat or PowerPoint. Note: There is an option to change the Percentile but as Vanderbilt is not focusing on Percentiles, you will not need this section. If you want to use this, and still have the gray shading, you can change the Percentile to reflect a different goal. EasyView defaults to the 95th percentile.
Printing Key Drivers
To print the Key Drivers, click on the “Print” button and select the format you want. You have the option of choosing “Two Graphs Per Page”, “One Graph Per Page Landscape” or “One Graph Per Page Portrait”. Note: The Overall Quality of Care question, and each Key Drivers will print, not just the full size graph currently showing on the screen.
Revised February, 2013 55
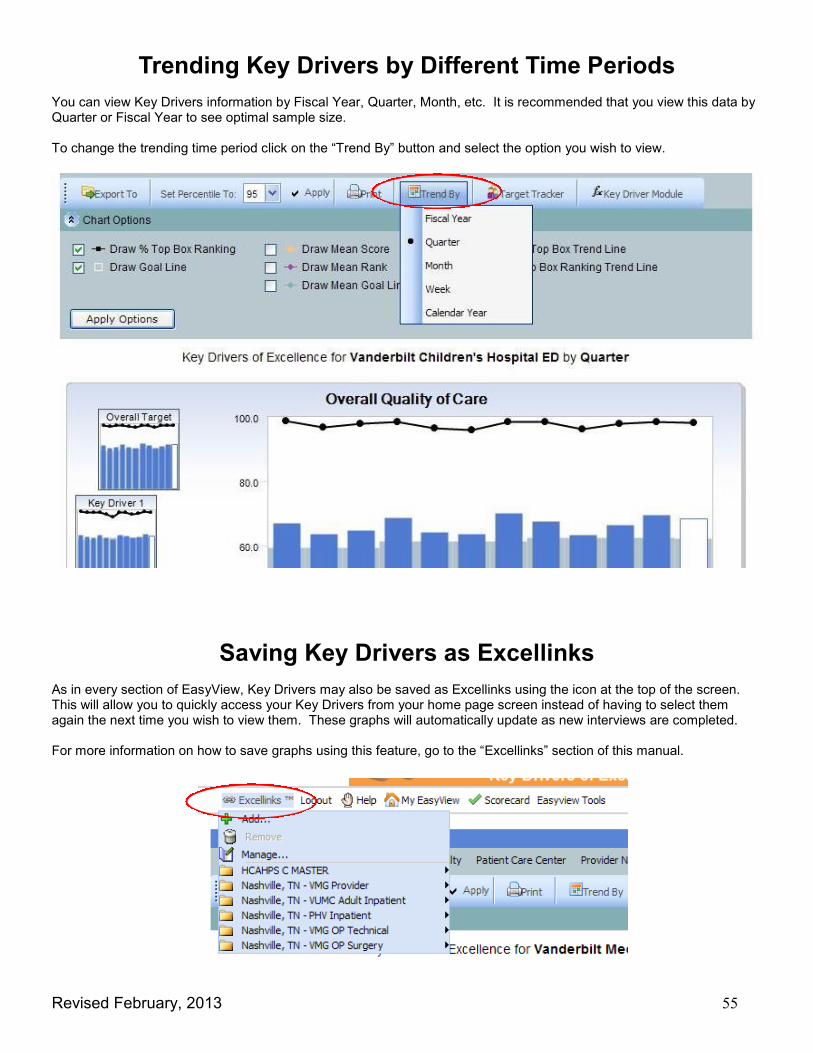
Trending Key Drivers by Different Time Periods You can view Key Drivers information by Fiscal Year, Quarter, Month, etc. It is recommended that you view this data by Quarter or Fiscal Year to see optimal sample size. To change the trending time period click on the “Trend By” button and select the option you wish to view.
Saving Key Drivers as Excellinks As in every section of EasyView, Key Drivers may also be saved as Excellinks using the icon at the top of the screen. This will allow you to quickly access your Key Drivers from your home page screen instead of having to select them again the next time you wish to view them. These graphs will automatically update as new interviews are completed. For more information on how to save graphs using this feature, go to the “Excellinks” section of this manual.
Revised February, 2013 56
One of the most useful tools for prioritizing your customer service activities is a Key Driver Analysis. Your key drivers are displayed as graphs located on PRC’s web site, https://www.PRCEasyView.com/vanderbilt. The following are frequently asked questions on how to interpret and use key drivers. 1. What is the purpose of key drivers? PRC provides Key Drivers to help you prioritize your activities. Managers want to increase satisfaction scores, but often do not know where to start. A typical patient satisfaction survey has 25 – 30 questions, and not every issue can be the top priority. The Key Drivers help you know which key issues asked on the questionnaire, most strong-ly predict, or “drive” how your patients will respond to the Overall Quality of Care question. Another way to think about it, is to say, key drivers tell you what is most influential in your patients’ perception of overall quality…. Key drivers represent HOW patients evaluate quality of care in your area. 2. How does PRC determine my key drivers? Key Drivers are derived using one of two statistical analyses called Stepwise Multiple Regression, or Discriminant Analysis. In both analyses, we use the Overall Quality of Care question as the “dependent” variable. All of the oth-er questions that are asked on our survey are “independent” variables. In the analysis, we are able to tell which in-dependent variables (that is, which survey questions) are most predictive of responses for the “dependent” varia-ble, Overall Quality of Care. 3. How often do you re-analyze key drivers? We typically provide Key Drivers annually, based on the calendar year or fiscal year (depending on the preference of the client). For our new clients, we do an initial key driver analysis using the first quarter of data so they have a set of priorities with which to work; initial Key Drivers are analyzed using the Stepwise Multiple Regression meth-od. When we repeat the analysis every year thereafter, we primarily use the Discriminant Analysis. 4. What is the difference between the Stepwise Multiple Regression and Discriminant Analysis for analyzing Key Drivers? The outcome, which is a list of priorities for understanding what “drives” your patients’ perception of quality, is exactly the same. With both analyses, the manager learns what issue(s) is most predictive of how their patients an-swered the Overall Quality of Care question. The Stepwise Multiple Regression uses the mean score for the analy-sis, and is conducted after the first quarter so the maximum number of patient records can be used. The Discrimi-nant Analysis focuses on the patients who answered “excellent,” and identifies which issue(s) is most influential in their answer. 5. Does every unit get a Discriminant Analysis annually? Only units or segments of the research that have an adequate number of responses in their sample can use the Dis-criminant Analysis. Units or segments that do not have a large enough sample will still receive annual Key Drivers, but the analysis will be based on mean score. The information received in a Key Driver analysis, regardless of the method of analysis, is still the same, and should be used the same way.

Revised February, 2013 57
6. Why don’t we get new key drivers each quarter? One of the primary reasons you do not see key drivers changing every quarter is that typically, managers use key drivers to set their annual goals/objectives. It would be very hard to focus nurses and staff members on a new pri-ority every quarter. Also, our clients tell us that it typically takes six months to a year to completely change underly-ing problems that affect an issue, by the time you identify the root causes, construct solutions, test the solutions, and then implement the solutions on a wider scale. Finally, because nursing units typically have 50 interviews per quarter, the regression analysis based on a quarter is not as strong a statistical model as the 200 interviews at the end of the year. 7. Does the order of key drivers matter? Yes. Key driver #1 is listed first for a reason. In the statistical analysis, the first key driver is the issue that is most highly correlated to Overall Quality of Care; therefore, it has the greatest potential to impact Overall Quality of Care perceptions. 8. What if I’d rather work on key driver #3 than spend time on key driver #1? Key drivers #2 and #3 do not, by themselves, have as much of an impact on Overall Quality of Care as key driver #1. This is because a regression does not simply list the top three correlated questions. Rather, it lists those three questions, which when improved in tandem, have the greatest statistical impact on Overall Quality of Care. The affect of key drivers 2 and 3 are “cumulative,” that is to say, they have impact on overall quality of care only when altered in conjunction with the first key driver. A way to understand this cumulative relationship among variables it to think about health status issues that have been statistically proven to be predictors of a heart attack. A patient may have hypertension, which may be his greatest predictor of the heart attack. That would be like key driver #1. However, if the patient is obese, that se-cond condition compounds the first, and increases the potential to predict a heart attack. Then, if the patient also has lots of stress in his life, the cumulative effect of these variables causes the patient to be at even greater risk. If the patient only addressed issue #3 (stress), but didn’t pay attention to treating his hypertension or losing weight, he most likely has not reduced the likelihood of a heart attack by much at all. Your key drivers work the same way. If you do not pay attention to key driver #1, you won’t get much return for your efforts on the Overall Quality of Care question. 9. Several questions that I would have thought were important do not show up as key drivers – Why? This question is related to the issue discussed above. When a regression analysis is done, every question is analyzed for its correlation with every other question; that is, they are “inter-correlated.” Therefore, when the statistical analysis process identifies key driver #1 as the question most important to the patient’s perception of Overall Quality of Care, it also has identified which other questions are highly correlated to key driver #1. Because of this strong correlation, these other issues typically are affected by changes in the scores of key driver #1. One way to think about this is to imagine these other issues riding on the “coat-tails” of key driver #1. So, since the analysis is to find those things, which when addressed in order of importance, most affect Overall Quality of Care, some of those other questions are left out because, by addressing key driver #1, you most likely address related issues, too. Another way to think about this is to see key driver #1 as representative of a tier of issues, key driver #2 repre-senting a second tier, etc. This emphasizes the importance of turning your attentions first, toward key driver #1.
Revised February, 2013 58
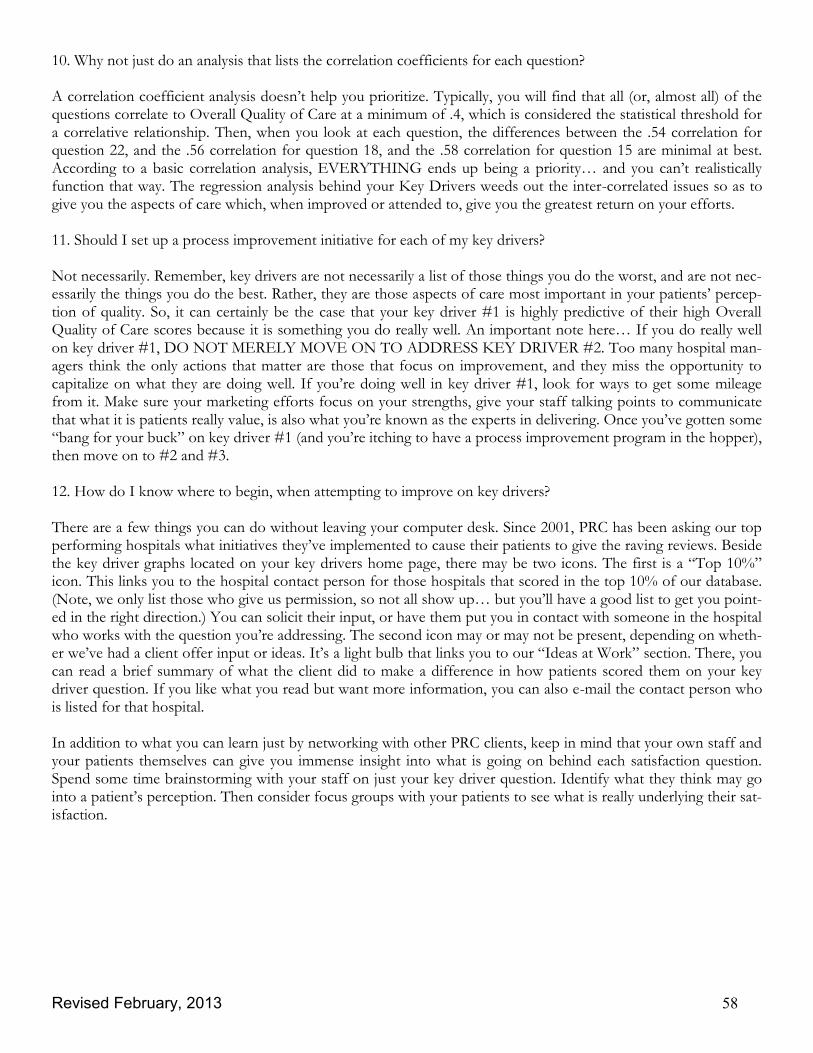
10. Why not just do an analysis that lists the correlation coefficients for each question? A correlation coefficient analysis doesn’t help you prioritize. Typically, you will find that all (or, almost all) of the questions correlate to Overall Quality of Care at a minimum of .4, which is considered the statistical threshold for a correlative relationship. Then, when you look at each question, the differences between the .54 correlation for question 22, and the .56 correlation for question 18, and the .58 correlation for question 15 are minimal at best. According to a basic correlation analysis, EVERYTHING ends up being a priority… and you can’t realistically function that way. The regression analysis behind your Key Drivers weeds out the inter-correlated issues so as to give you the aspects of care which, when improved or attended to, give you the greatest return on your efforts. 11. Should I set up a process improvement initiative for each of my key drivers? Not necessarily. Remember, key drivers are not necessarily a list of those things you do the worst, and are not nec-essarily the things you do the best. Rather, they are those aspects of care most important in your patients’ percep-tion of quality. So, it can certainly be the case that your key driver #1 is highly predictive of their high Overall Quality of Care scores because it is something you do really well. An important note here… If you do really well on key driver #1, DO NOT MERELY MOVE ON TO ADDRESS KEY DRIVER #2. Too many hospital man-agers think the only actions that matter are those that focus on improvement, and they miss the opportunity to capitalize on what they are doing well. If you’re doing well in key driver #1, look for ways to get some mileage from it. Make sure your marketing efforts focus on your strengths, give your staff talking points to communicate that what it is patients really value, is also what you’re known as the experts in delivering. Once you’ve gotten some “bang for your buck” on key driver #1 (and you’re itching to have a process improvement program in the hopper), then move on to #2 and #3. 12. How do I know where to begin, when attempting to improve on key drivers? There are a few things you can do without leaving your computer desk. Since 2001, PRC has been asking our top performing hospitals what initiatives they’ve implemented to cause their patients to give the raving reviews. Beside the key driver graphs located on your key drivers home page, there may be two icons. The first is a “Top 10%” icon. This links you to the hospital contact person for those hospitals that scored in the top 10% of our database. (Note, we only list those who give us permission, so not all show up… but you’ll have a good list to get you point-ed in the right direction.) You can solicit their input, or have them put you in contact with someone in the hospital who works with the question you’re addressing. The second icon may or may not be present, depending on wheth-er we’ve had a client offer input or ideas. It’s a light bulb that links you to our “Ideas at Work” section. There, you can read a brief summary of what the client did to make a difference in how patients scored them on your key driver question. If you like what you read but want more information, you can also e-mail the contact person who is listed for that hospital. In addition to what you can learn just by networking with other PRC clients, keep in mind that your own staff and your patients themselves can give you immense insight into what is going on behind each satisfaction question. Spend some time brainstorming with your staff on just your key driver question. Identify what they think may go into a patient’s perception. Then consider focus groups with your patients to see what is really underlying their sat-isfaction.
Revised February, 2013 59
13. Why is it that the scores for my key drivers no longer follow the same trend as my Overall Quality of Care score? The regression analysis can only be done using data that is already in place, that is, 2002’s key drivers are derived using 2001 data. For a while, as your internal processes continue to look like they did in 2001, the movement of key driver #1 scores and Overall Quality of Care scores should be very similar. But, as processes begin to change throughout the year, (a new manager comes on, a sour-apple employee leaves, you’ve gotten a new call bell system that has revolutionized things, etc.) the processes you are now measuring may no longer work with the regression model in place. When you inform us of these cases, we re-run the regression after a full quarter’s worth of data is gathered under the new atmosphere or system, and provide a fresh model. If, however, there is only one quarter left in the year, we typically recommend waiting for the end of the year so we can re-do your key drivers at the nor-mal time, and so your staff doesn’t get too many changes in key driver priorities throughout the year; hence mak-ing them quite frustrated with those “moving targets.” 14. Are key driver questions the only things that affect Overall Quality of Care scores? If they were, wouldn’t our jobs be much easier? Unfortunately, there are many factors NOT measured by the pa-tient satisfaction survey that play into their perception of quality of care. It may be how the patient’s mother was treated while visiting (although the patient felt like they got good care), it may be a recent public relations crisis that affects their perception, etc. The top three key drivers typically represent about 50–60% of the variation in how patients answer Overall Quality of Care. Currently, the entire survey typically represents about 70-80% in the variation of the answers found in the Overall Quality of Care question. The other 20-30% of the variation cannot be attributed to anything asked in the survey. 15. Why are my key drivers different from those from another part of the hospital? When we do a key driver analysis, we take each of the segments that your hospital has identified for us (each nurs-ing unit, outpatient clinic, emergency track, etc.), and conduct individual analyses on each. Obviously, an OB/Gyn patient’s experience is quite different from that of an orthopedic patient… and the processes in place in each re-spective nursing unit are vastly different. For this reason, each area’s manager is given his or her own, unique set of priorities. 16. It would be easier to undergo a hospital-wide improvement initiative focusing on one thing… Why don’t we just have one set of key drivers for the whole hospital? A motivated manager can make a lot of positive changes at the grass roots level that may never happen if he or she waited for the hospital-wide committee to agree on a strategy and implement. Health care happens at the bedside, and that’s where changes should start, too. This is why it is important that patient segment have its own set of key drivers. Then, the manager over each area can work on those things unique to his or her setting that can affect Overall Quality of Care perceptions. When each unit does this, it should maximize the potential for increasing the hospitals’ Overall Quality of Care score, hospital-wide. 17. I have some special questions asked only of a select group of patients… Why do these questions not show up as key drivers?
Most likely, these questions are just asked of a small group of the patients (like intensive care questions, for
example). The regression is run in such a way that at least 80% of the patients had to answer the question for it
to be included in the equation for the analysis. If you only have 30% of the patients answering the question, it
would have been excluded.

Revised February, 2013 60
ExcellinksTM

Revised February, 2013 61
Excellinks™
The Excellinks™ section is where you save views that you set up in other sections of the website. For example, you can save your particular nursing unit’s key drivers, certain clinic’s snapshots, a set of norms you’re interested in and so forth. Once you’ve created your views and saved them in the Excellinks™ section, you don’t have to go any further than your homepage and click on the link to be taken directly to your information. Information saved in Excellinks™ is automatically updated with new interviews daily. The links are organized by study and then applications within each study. Until you or an administrative user creates one or more Excellinks™ for you, this section will be blank.

Revised February, 2013 62
Creating Excellinks™ Creating Excellinks™ is very simple and quick. Let’s say that you want to save a particular area’s Key Drivers to the Excellinks™ section. You would pull the particular set of Key Drivers that you are interested in and go through the fol-lowing steps. Once you’ve set up the view that you want to save, click on the Excellinks™ icon at the top of the screen and then click “Add”.
Name the Excellink and click “ok”.

Revised February, 2013 63
The screen will flash. This means the Excellink is saved. Please note: It may take a moment for the screen to reload and bring you back to your charts. It is very important that you wait for the screen to flash or your Excellink will not be saved. Go back to your homepage (by clicking on “My EasyView” at the top of the screen) and go to the My Excellinks section. You should see the Excellink that you just saved. Click on the link and you will be taken back to the view that you saved. The latest data will be automatically updated for the parameters that you specified when you originally set up the Excellink. Be aware that if you set up an Excellink in Snapshots to pull data for a particular month or quarter, the interviews will automatically update until interviewing for the selected month or quarter is completed and then stop. You will need to update the Excellink with the following month or quarter for it to continuously update through that time period.

Revised February, 2013 64
Managing Excellinks
You have the option to manage your Excellinks from within EasyView. Click on the “Excellinks” button once you are within the website (and past the homepage screen). Choose “Manage”.
From here you can select an Excellink and Rename or Delete it.

Revised February, 2013 65
PRCEasyView to You PRCEasyView to You allows you to email reports to your inbox that you have saved in your Excellinks or that are in your Scorecards. This feature can be found on your homepage on the right side of the screen, above your Excellinks.
Once you click on the “PRCEasyViewToYou” icon, you will be taken to a page where you can add which Excellinks or Scorecards are emailed to you. This will prompt you to review your most recent results on a regular basis. The results will automatically update as the interviews are completed. After selecting the “PRCEasyViewToYou” icon, your page will look like the picture below. You will only have the option to “Add a Report” or “Change my Email Address”. Note: DO NOT change your email as this is the email needed for you to log into EasyView. If you change it, you will not be able to log in.

Revised February, 2013 66
By clicking on “add a report”, you will see a list of your Excellinks and a link to your Scorecards. From here, simply ex-pand the plus sign and highlight the Excellinks or Scorecards you would like to have emailed to you, and then click “Next”. There is no limit to the number of reports you can add. Now, you will need to choose your format. You can choose from Acrobat, Power Point, and Excel. These exports will view just like exported reports in other areas of EasyView. If you would like to send the report to any other staff members, you can enter additional Vanderbilt emails. Please only use Vanderbilt emails in this section. If you would like to receive a copy of the data as well, check the box. Click “next”.

Revised February, 2013 67
Then, you will need to choose how often you would like this report emailed. You can choose to receive it daily, month-ly, or weekly. For example, you can receive a specific report every 20
th day of each month. In addition, you can also
choose to receive a report on the last Wednesday of each month. You have many options available. Choose the time of day you’d like the report sent. This is set to Central Time. If you would like to receive the first report before your scheduled alert, you may enter the date in the line allowed at the bottom of the options. This will send the first report on that day, and will continue with the schedule as you have set it above. One important note, if you would like to receive your report on the last day of the month, you have to choose “last” and “day” from the second section. Simply choosing the “30
th” of every month will result in an error message. This is due to
the programming and the number of days in the month of February. Note the example below.
In the last step, you can view exactly what the report will look like before you submit anything by clicking on the “This Report” link. This will give you the option to go back and make changes if necessary. If everything looks okay, simply hit the finish button and you are ready to receive the reports. In the beginning, you could set the frequency for “daily” so you can receive a quick example. You can then modify the settings to receive the report weekly or monthly.

Revised February, 2013 68
Snapshots
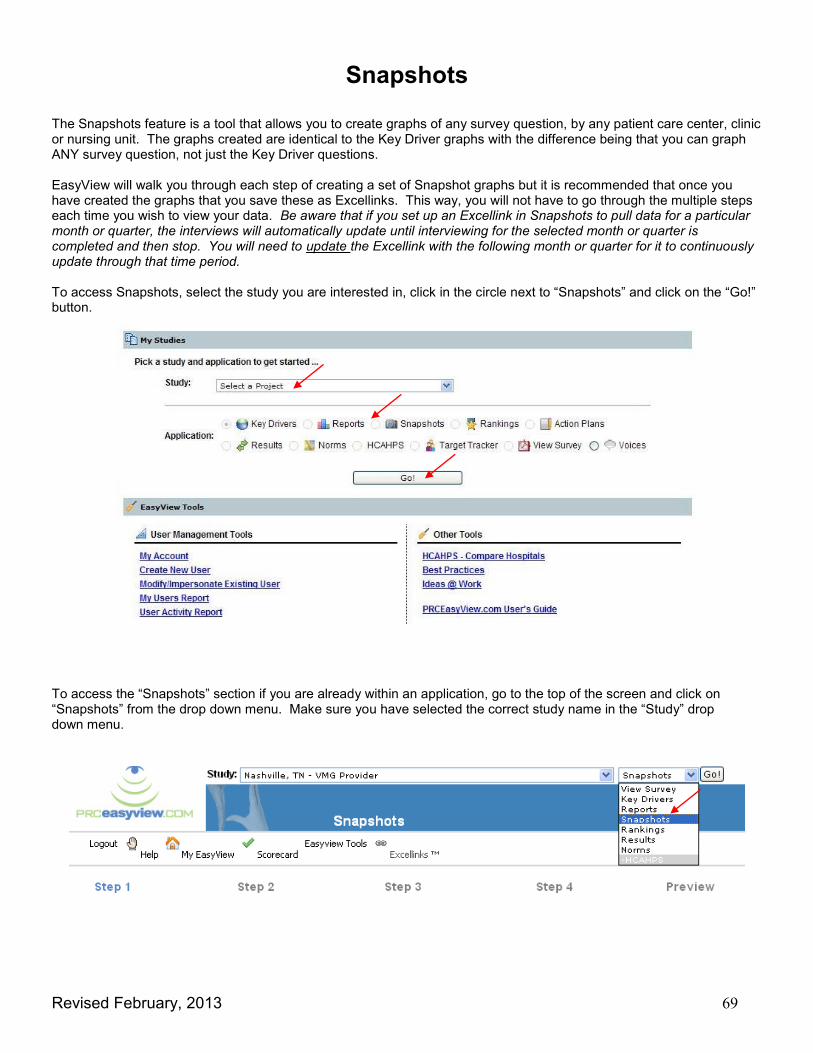
Revised February, 2013 69
Snapshots
The Snapshots feature is a tool that allows you to create graphs of any survey question, by any patient care center, clinic or nursing unit. The graphs created are identical to the Key Driver graphs with the difference being that you can graph ANY survey question, not just the Key Driver questions. EasyView will walk you through each step of creating a set of Snapshot graphs but it is recommended that once you have created the graphs that you save these as Excellinks. This way, you will not have to go through the multiple steps each time you wish to view your data. Be aware that if you set up an Excellink in Snapshots to pull data for a particular month or quarter, the interviews will automatically update until interviewing for the selected month or quarter is completed and then stop. You will need to update the Excellink with the following month or quarter for it to continuously update through that time period. To access Snapshots, select the study you are interested in, click in the circle next to “Snapshots” and click on the “Go!” button.
To access the “Snapshots” section if you are already within an application, go to the top of the screen and click on “Snapshots” from the drop down menu. Make sure you have selected the correct study name in the “Study” drop down menu.
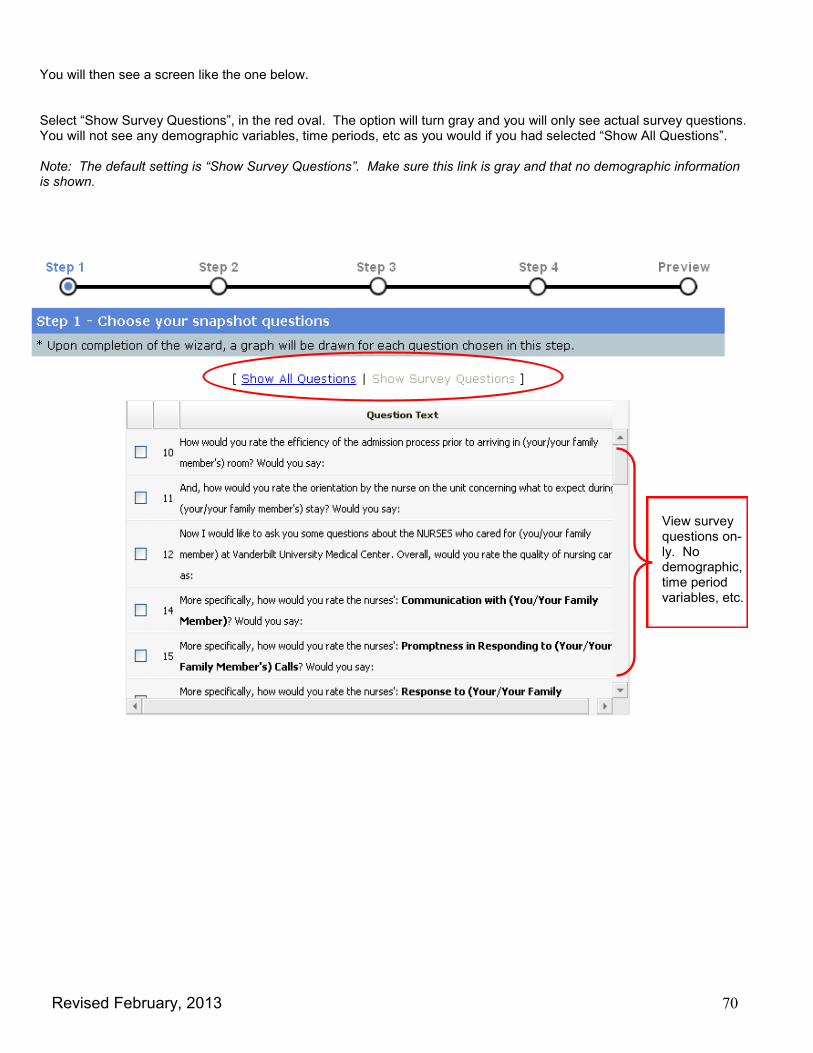
Revised February, 2013 70
You will then see a screen like the one below. Select “Show Survey Questions”, in the red oval. The option will turn gray and you will only see actual survey questions. You will not see any demographic variables, time periods, etc as you would if you had selected “Show All Questions”. Note: The default setting is “Show Survey Questions”. Make sure this link is gray and that no demographic information is shown.
View survey questions on-ly. No demographic, time period variables, etc.
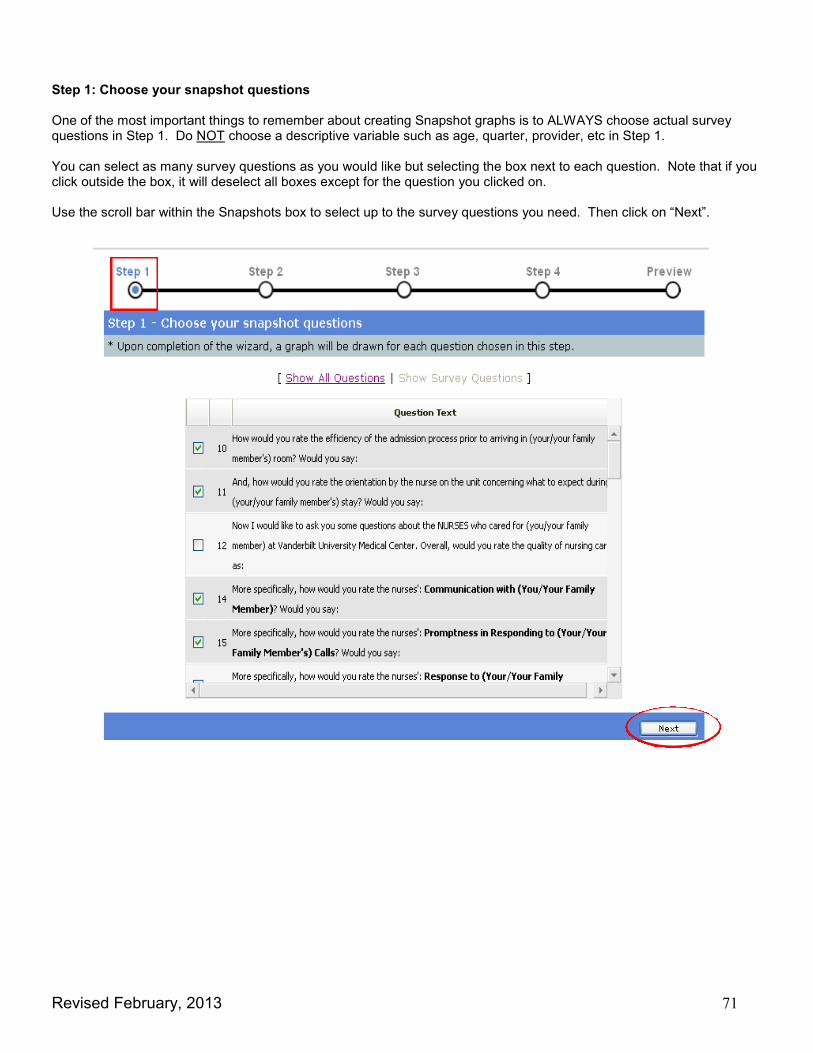
Revised February, 2013 71
Step 1: Choose your snapshot questions One of the most important things to remember about creating Snapshot graphs is to ALWAYS choose actual survey questions in Step 1. Do NOT choose a descriptive variable such as age, quarter, provider, etc in Step 1. You can select as many survey questions as you would like but selecting the box next to each question. Note that if you click outside the box, it will deselect all boxes except for the question you clicked on. Use the scroll bar within the Snapshots box to select up to the survey questions you need. Then click on “Next”.
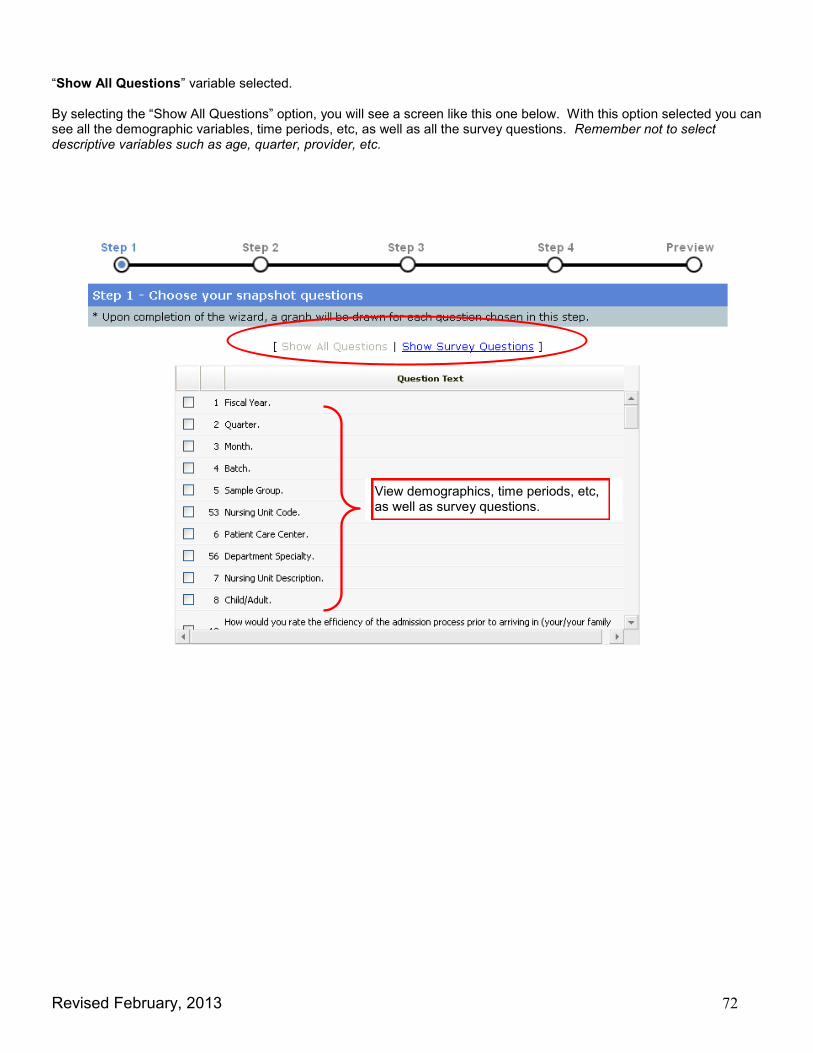
Revised February, 2013 72
“Show All Questions” variable selected. By selecting the “Show All Questions” option, you will see a screen like this one below. With this option selected you can see all the demographic variables, time periods, etc, as well as all the survey questions. Remember not to select descriptive variables such as age, quarter, provider, etc.
View demographics, time periods, etc, as well as survey questions.

Revised February, 2013 73
Step 2: Choose how you wish the data to be grouped In most cases, this is where you will select the time period variable. Choose either Fiscal Year, Quarter or Month then click on the “Next” button.
The “Graph It Now” button is available to the left of the drop down menu. It is meant to save time and is useful if you have completed a Snapshot graph and wish to go back and revise it. You can click on “Graph It Now” to avoid having to repeat steps that you do not need to change. For example, if you have created a set of Snapshots for a particular clinic but decide that you want to change it to trend by Fiscal Year rather than Quarter, you can change the timeframe, click on “Graph It Now” and not have to click through the later steps.
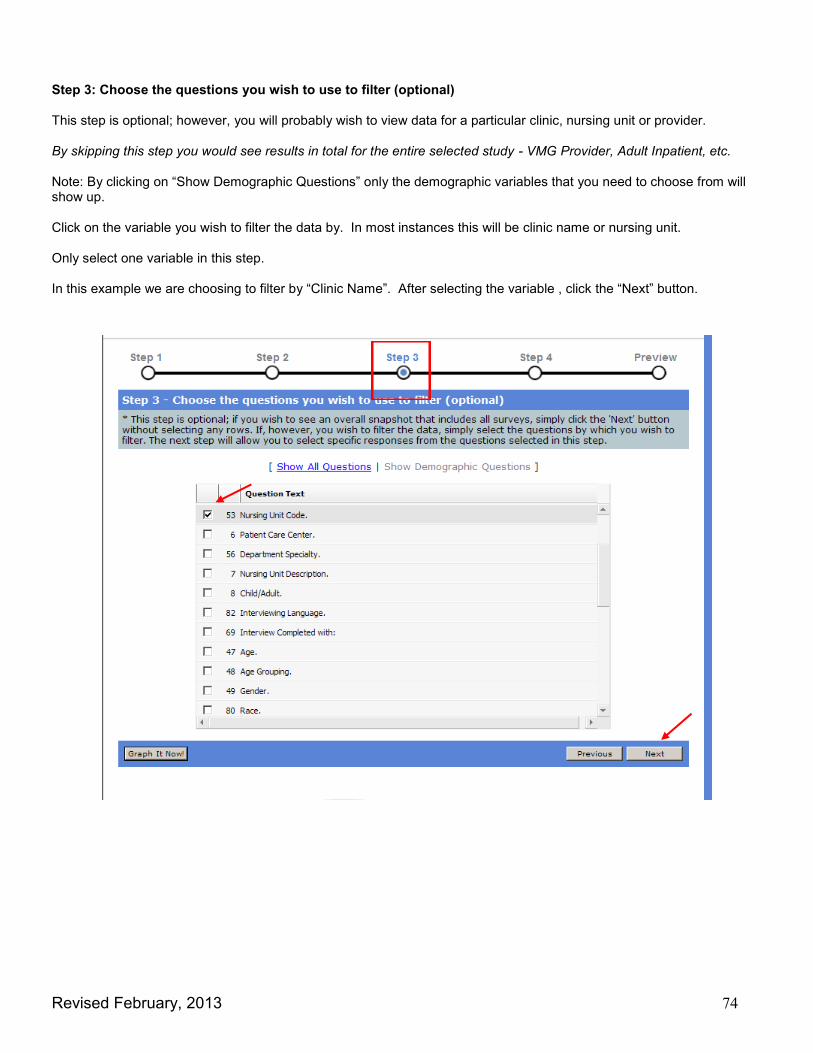
Revised February, 2013 74
Step 3: Choose the questions you wish to use to filter (optional) This step is optional; however, you will probably wish to view data for a particular clinic, nursing unit or provider. By skipping this step you would see results in total for the entire selected study - VMG Provider, Adult Inpatient, etc. Note: By clicking on “Show Demographic Questions” only the demographic variables that you need to choose from will show up. Click on the variable you wish to filter the data by. In most instances this will be clinic name or nursing unit. Only select one variable in this step. In this example we are choosing to filter by “Clinic Name”. After selecting the variable , click the “Next” button.

Revised February, 2013 75
Step 4: Choose the filtering responses This is where you will select the particular clinic, nursing unit, provider, etc that you wish to view. Do this by clicking on the “+” next to the clinic name in the right column. This will move the selection to the left column. Then click the “Next” button. Note: Usually you will only select one variable here. If you select multiple variables your results will be combined for the clinics, units or provider that you selected. Select “Show Filters Subtitle on Charts” to include the filters as a heading to your charts.

Revised February, 2013 76
Preview: Snapshot Wizard Preview In this step you will see a preview of the options you have chosen to graph. Review this information to make sure you have selected the questions, time period and filters that you want. If you need to change any of your selections, click on the blue “edit” option next to each section and you will be taken back to that step. Once you are satisfied with your choices, click the “Finish” button.

Revised February, 2013 77
Each graph will now appear one under the other beneath the filters section. These graphs may be interpreted exactly like the Key Drivers graphs with the blue/white bars representing the % Excellent responses. NOTE: If you have the black percentile line and/or gray shading, you can remove these by selecting Chart Options and deselecting the “Draw % Top Box Ranking” and “Draw Goal Line” options.
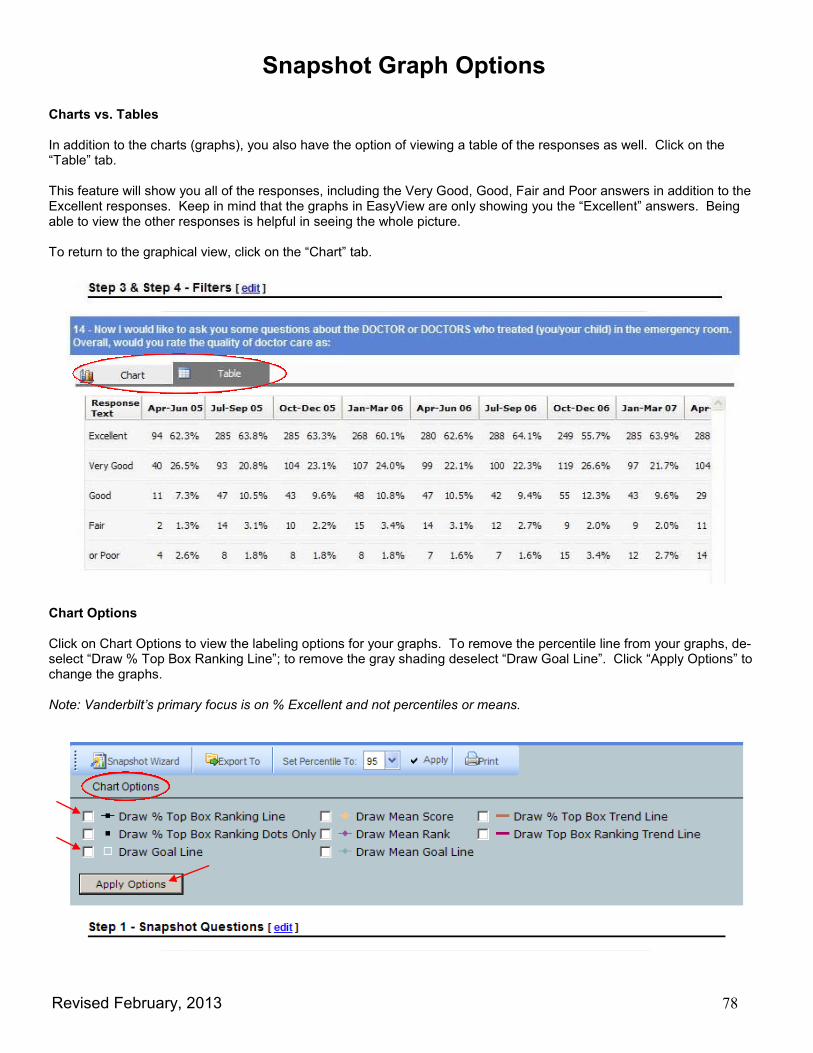
Revised February, 2013 78
Snapshot Graph Options
Charts vs. Tables In addition to the charts (graphs), you also have the option of viewing a table of the responses as well. Click on the “Table” tab. This feature will show you all of the responses, including the Very Good, Good, Fair and Poor answers in addition to the Excellent responses. Keep in mind that the graphs in EasyView are only showing you the “Excellent” answers. Being able to view the other responses is helpful in seeing the whole picture. To return to the graphical view, click on the “Chart” tab.
Chart Options Click on Chart Options to view the labeling options for your graphs. To remove the percentile line from your graphs, de-select “Draw % Top Box Ranking Line”; to remove the gray shading deselect “Draw Goal Line”. Click “Apply Options” to change the graphs. Note: Vanderbilt’s primary focus is on % Excellent and not percentiles or means.

Revised February, 2013 79
Snapshot Wizard You can start over and create a new Snapshot OR modify your selections using the Snapshot Wizard button. To modify your filters, select “Snapshot Wizard” and choose “Modify”. Then select which Step to modify. This will take you back to that step so you can change the filter. Proceed through the remaining steps, if necessary. To create a new set of graphs, go to “Snapshot Wizard” and choose “New Snapshot Wizard”. This will clear your screen and you will start over at Step 1. You might need to do this if you want to view more questions than the ten allowed by EasyView. First be sure to save the current Snapshot charts to Excellinks if you think you will need to view them regularly!
Export To You can Export the data by selecting the “Export To” button and choosing Excel, Acrobat or PowerPoint.

Revised February, 2013 80
Printing Snapshots Graphs and Tables To print your Snapshots, click on the “Print” button and choose whether you want to print the Charts only, Tables only or Charts + Tables. Note: EasyView will print off every chart/table, not just the one showing.
Saving Snapshots as Excellinks Due to the multiple steps it takes to create Snapshots, it is recommended once you have set up the charts you are going to be viewing on a regular basis, that you save them in Excellinks so they will be readily accessible from your homepage and you will not have to set them up again. Go to the “Excellinks” button at the top of the screen and follow the steps for creating Excellinks in that section of this guide. Again, be aware that if you set up an Excellink in Snapshots to pull data for a particular month or quarter, the interviews will automatically update until interviewing for the selected month or quarter is completed and then stop. You will need to update the Excellink with the following month or quarter for it to continuously update through that time period.
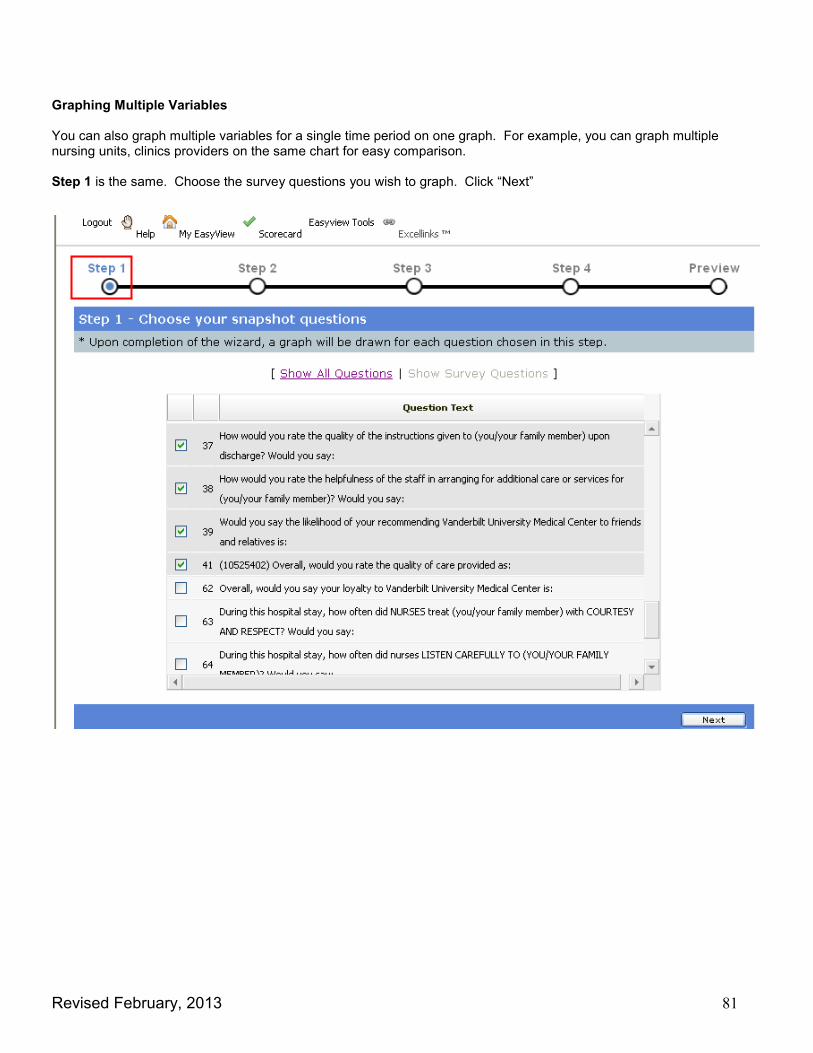
Revised February, 2013 81
Graphing Multiple Variables
You can also graph multiple variables for a single time period on one graph. For example, you can graph multiple nursing units, clinics providers on the same chart for easy comparison. Step 1 is the same. Choose the survey questions you wish to graph. Click “Next”
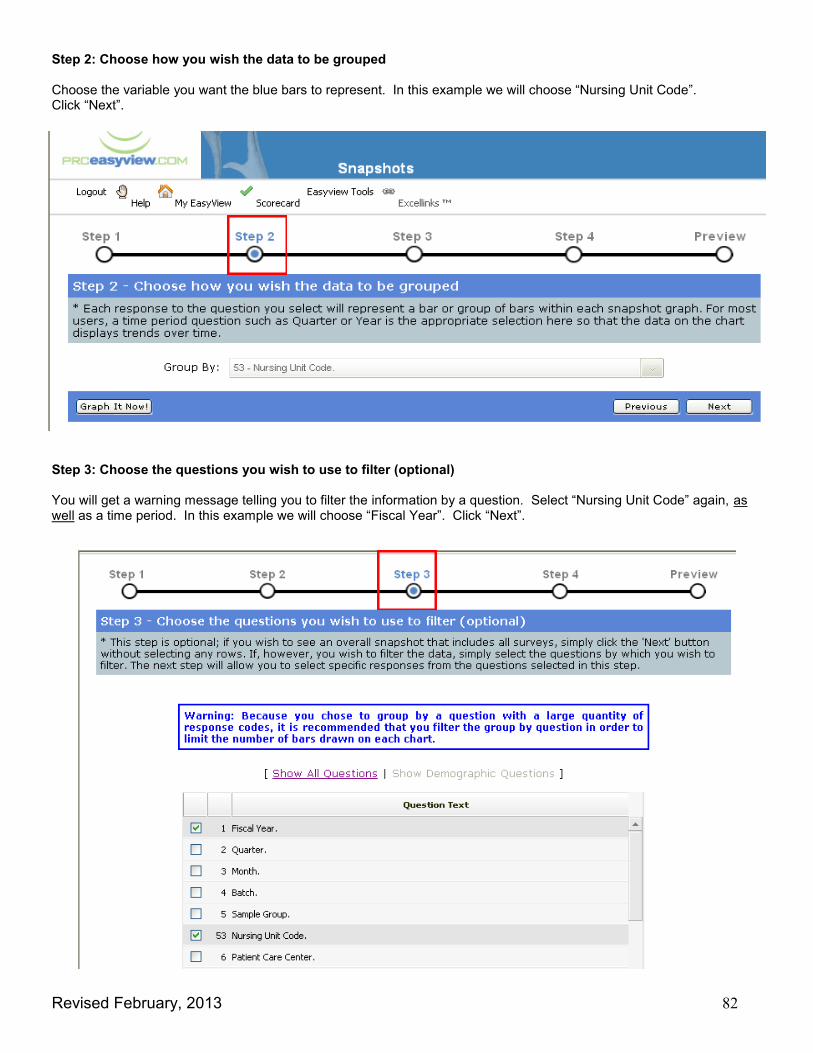
Revised February, 2013 82
Step 2: Choose how you wish the data to be grouped Choose the variable you want the blue bars to represent. In this example we will choose “Nursing Unit Code”. Click “Next”.
Step 3: Choose the questions you wish to use to filter (optional) You will get a warning message telling you to filter the information by a question. Select “Nursing Unit Code” again, as well as a time period. In this example we will choose “Fiscal Year”. Click “Next”.
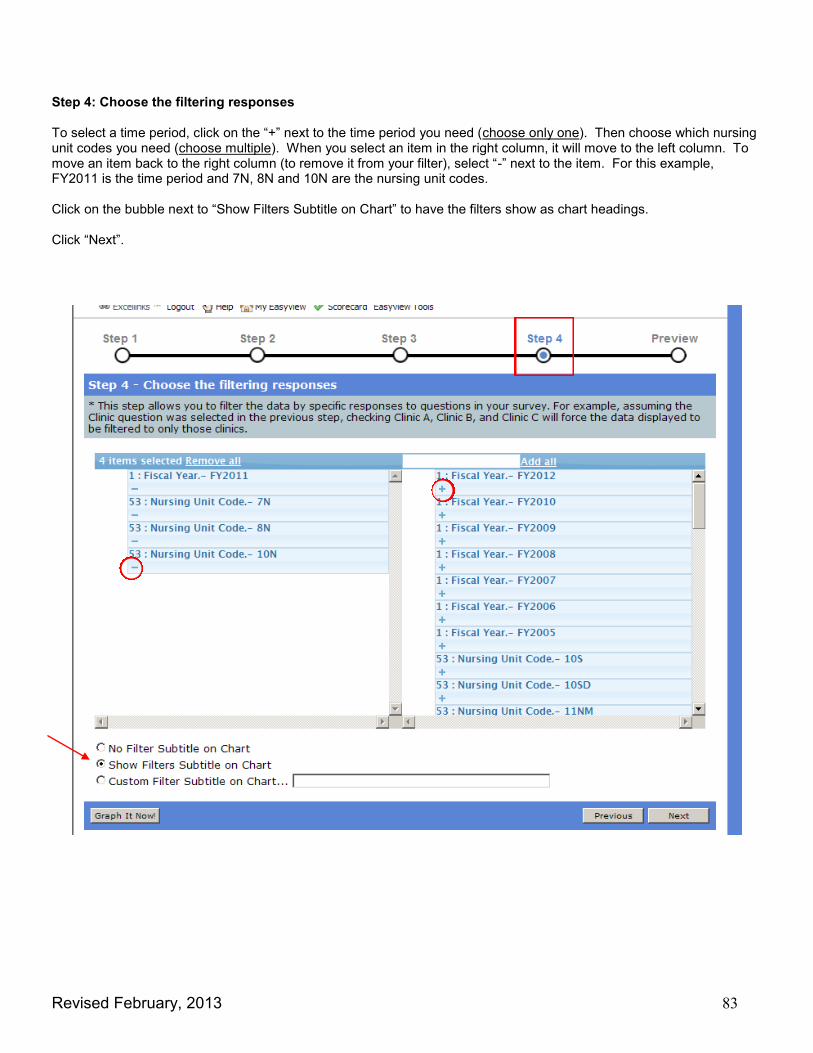
Revised February, 2013 83
Step 4: Choose the filtering responses To select a time period, click on the “+” next to the time period you need (choose only one). Then choose which nursing unit codes you need (choose multiple). When you select an item in the right column, it will move to the left column. To move an item back to the right column (to remove it from your filter), select “-” next to the item. For this example, FY2011 is the time period and 7N, 8N and 10N are the nursing unit codes. Click on the bubble next to “Show Filters Subtitle on Chart” to have the filters show as chart headings. Click “Next”.

Revised February, 2013 84
Step 5: Snapshot Wizard Preview Here you will see a preview of the options you’ve chosen to graph. Review the information to make sure you have selected the questions, time period and filters that you want. If you need to change any of your selections, click on the blue “edit” option and you will be taken back to that step. Once you are satisfied with your choices, click the “Finish” button.

Revised February, 2013 85
Your graphs will now appear, one below the other, for each questions you chose. Each blue bar represents the % Excellent scores for each filter option chose, in this case nursing unit. Note that the heading for each graph includes the Question, Time Period and Nursing Unit Codes. Remember, you can Export, Print, or Save an Excellink for your data. You can also modify your filters using either the blue “edit” link next to each Step or the “Snapshot Wizard”.
*** If you have the Percentile Line and Gray Data selected, pay close attention to the norm group that shows when you graph data in this way. In this example, the “Inpt Med” norm group is showing. This is because each of the nursing units that were chosen are assigned to the “Inpatient Medical” norm group. All of these units are being compared in the correct manner – to the narrowest service line PRC has available. If we had selected units from different norm groups, EasyView would have defaulted to the Overall Inpatient norm and the graphs would show how the units compared to ALL OTHER inpatient units in PRC’s database and NOT to the more ap-propriate “Inpt Med” group. Be sure and try to choose units or clinics that use the same norm group.

Revised February, 2013 86
Reports
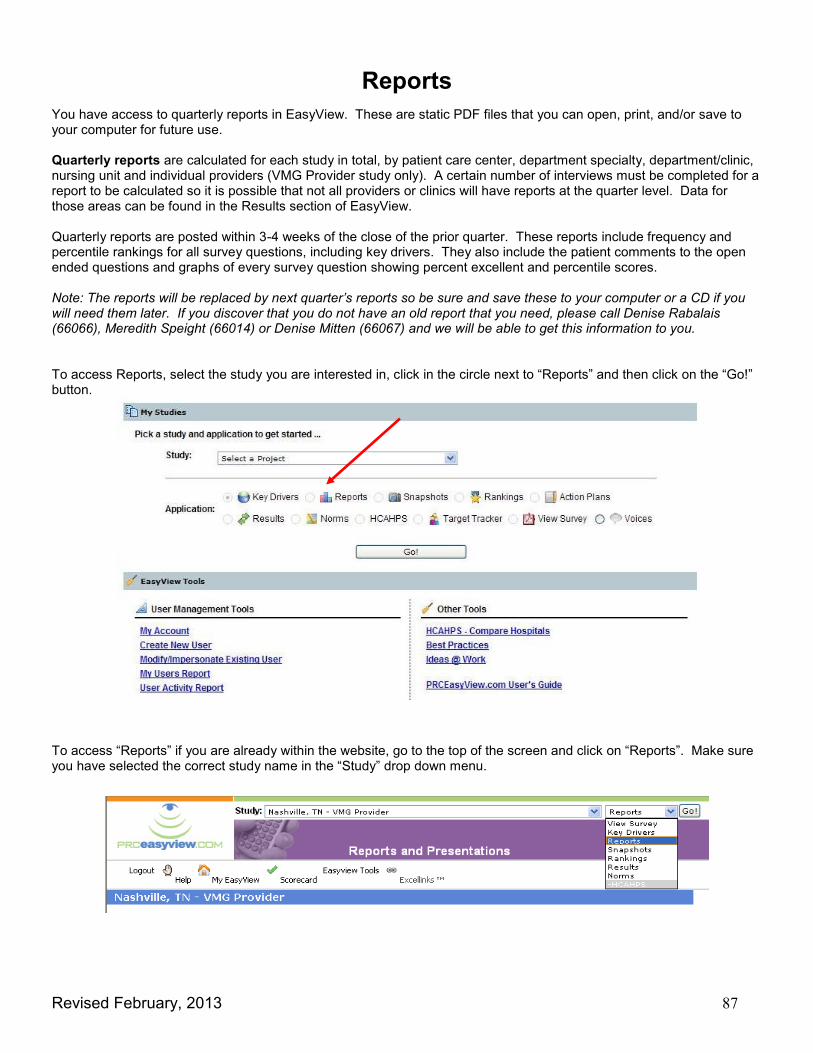
Revised February, 2013 87
Reports
You have access to quarterly reports in EasyView. These are static PDF files that you can open, print, and/or save to your computer for future use. Quarterly reports are calculated for each study in total, by patient care center, department specialty, department/clinic, nursing unit and individual providers (VMG Provider study only). A certain number of interviews must be completed for a report to be calculated so it is possible that not all providers or clinics will have reports at the quarter level. Data for those areas can be found in the Results section of EasyView. Quarterly reports are posted within 3-4 weeks of the close of the prior quarter. These reports include frequency and percentile rankings for all survey questions, including key drivers. They also include the patient comments to the open ended questions and graphs of every survey question showing percent excellent and percentile scores. Note: The reports will be replaced by next quarter’s reports so be sure and save these to your computer or a CD if you will need them later. If you discover that you do not have an old report that you need, please call Denise Rabalais (66066), Meredith Speight (66014) or Denise Mitten (66067) and we will be able to get this information to you. To access Reports, select the study you are interested in, click in the circle next to “Reports” and then click on the “Go!” button.
To access “Reports” if you are already within the website, go to the top of the screen and click on “Reports”. Make sure you have selected the correct study name in the “Study” drop down menu.
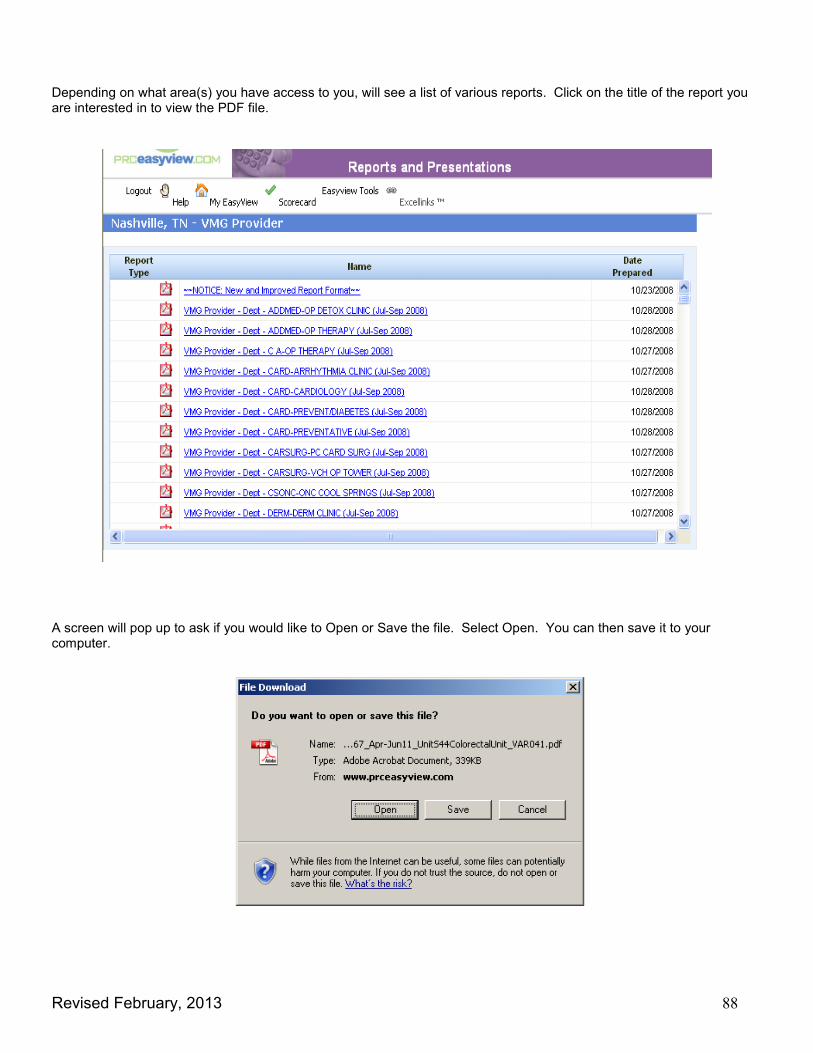
Revised February, 2013 88
Depending on what area(s) you have access to you, will see a list of various reports. Click on the title of the report you are interested in to view the PDF file.
A screen will pop up to ask if you would like to Open or Save the file. Select Open. You can then save it to your computer.

Revised February, 2013 89
Your report will open in Adobe Acrobat’s Portable Document Format (PDF). Below is an example of the pages within a report. A title page which includes the Date pulled, Time Period of Report and Unit Name.
Your Key Drivers, including the main graph, Overall Quality of Care, and the smaller graphs, the Key Drivers. Depending on your unit, you may have 2 or 3 listed.
To provide a full output of all your data, Frequency sections are in easy-to-read tables. The Overall Quality of Care and Key Drivers of Excellence questions are listed at the top to highlight their importance.
This table lists the Percentile Ranking, Percent Excellent Score and 95th Percentile for each question. Even though Vanderbilt is not focused on the Percentile score, this table gives you an overall view of how each question scored. The blue bars indicate the Percentile Ranking.
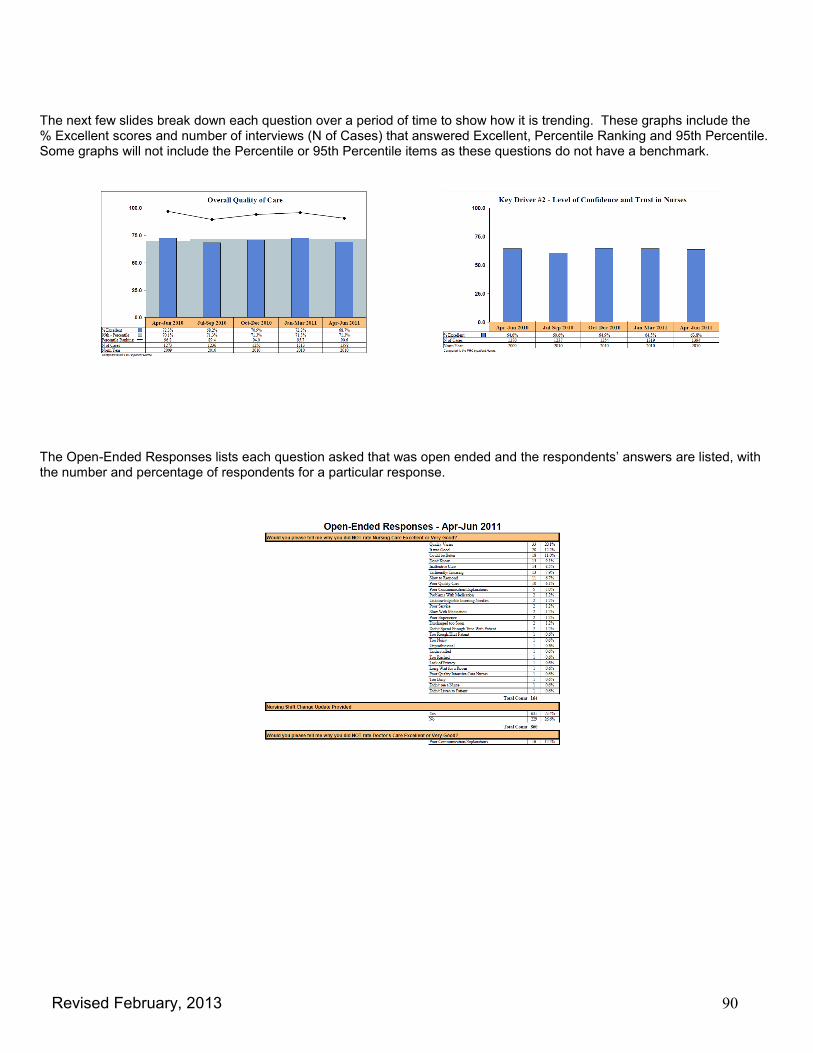
Revised February, 2013 90
The next few slides break down each question over a period of time to show how it is trending. These graphs include the % Excellent scores and number of interviews (N of Cases) that answered Excellent, Percentile Ranking and 95th Percentile. Some graphs will not include the Percentile or 95th Percentile items as these questions do not have a benchmark.
The Open-Ended Responses lists each question asked that was open ended and the respondents’ answers are listed, with the number and percentage of respondents for a particular response.
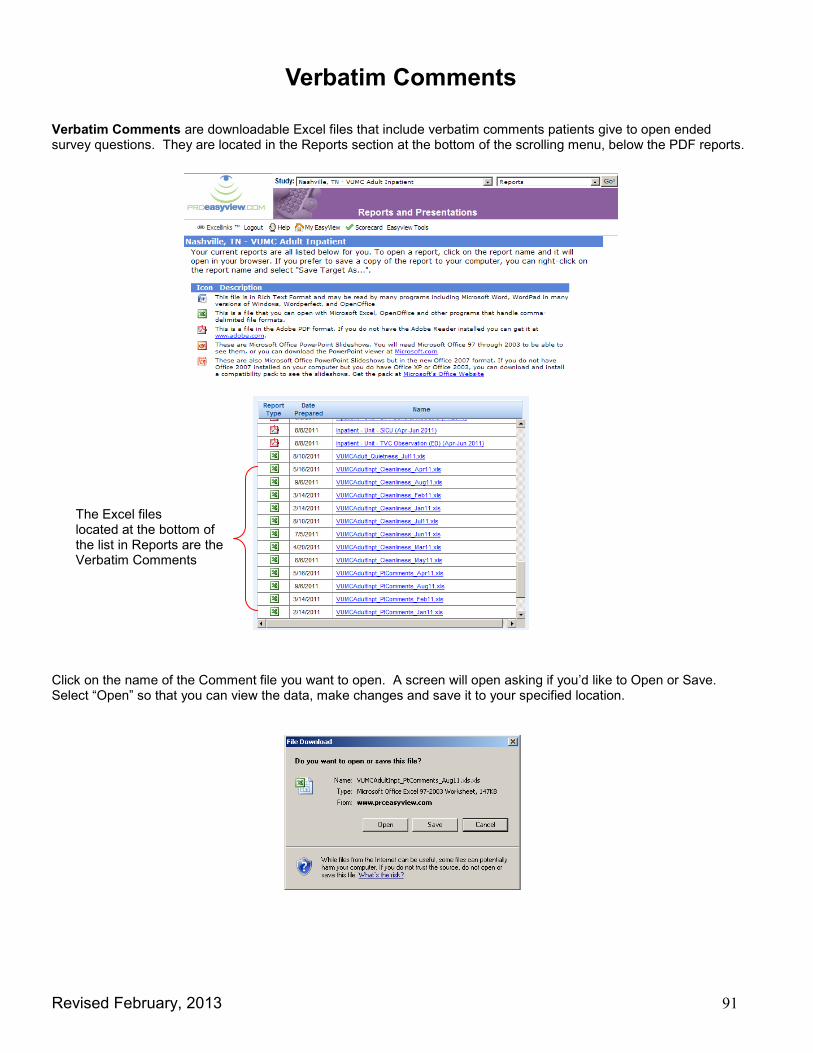
Revised February, 2013 91
Verbatim Comments
Verbatim Comments are downloadable Excel files that include verbatim comments patients give to open ended survey questions. They are located in the Reports section at the bottom of the scrolling menu, below the PDF reports. Click on the name of the Comment file you want to open. A screen will open asking if you’d like to Open or Save. Select “Open” so that you can view the data, make changes and save it to your specified location.
The Excel files located at the bottom of the list in Reports are the Verbatim Comments
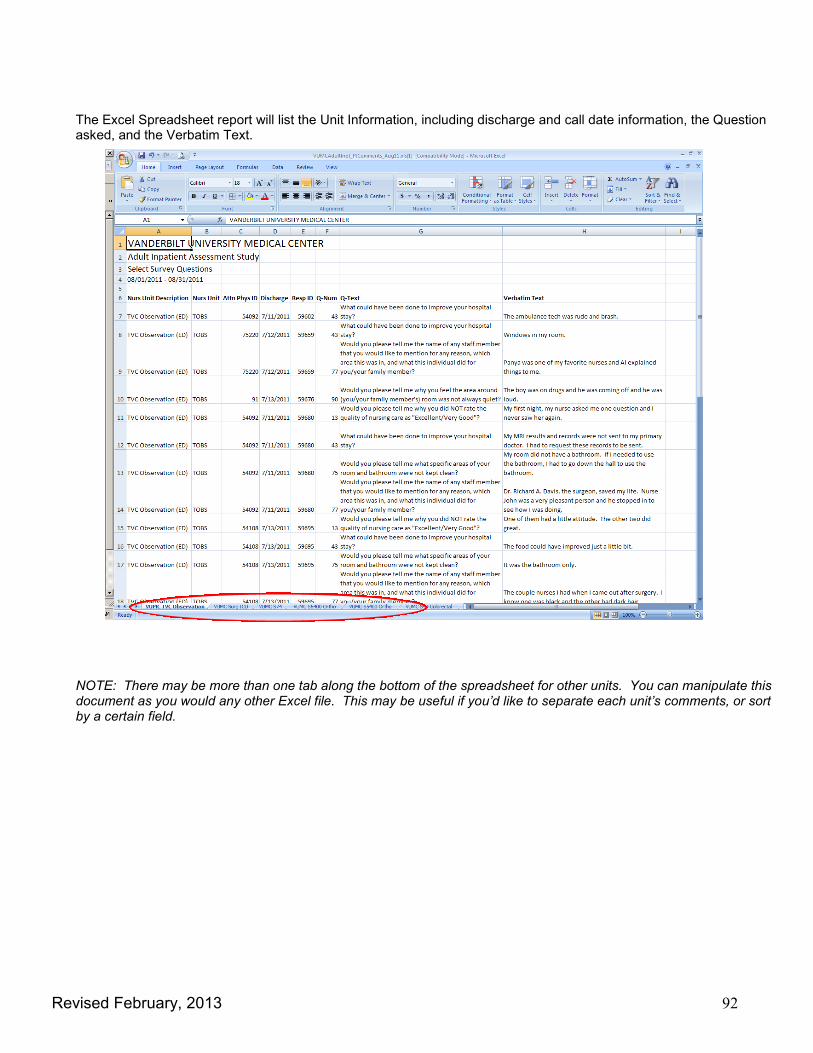
Revised February, 2013 92
The Excel Spreadsheet report will list the Unit Information, including discharge and call date information, the Question asked, and the Verbatim Text. NOTE: There may be more than one tab along the bottom of the spreadsheet for other units. You can manipulate this document as you would any other Excel file. This may be useful if you’d like to separate each unit’s comments, or sort by a certain field.

Revised February, 2013 93
Rankings

Revised February, 2013 94
Rankings
The charts in Rankings look the same as the ones you see in the Scorecards section. The purpose of the Rankings feature is to allow you to compare all nursing units, clinics, etc on any survey question within a particular study. The scores are then ranked by percentile in order from highest to lowest. To access the Rankings feature, select the study you are interested in, click in the circle next to “Rankings” and click on the “Go!” button.
To access “Rankings” if you are already within an application in the website, go to the top of the screen and click on “Rankings”. Make sure you have selected the correct study name in the “Study Tools” drop down menu.
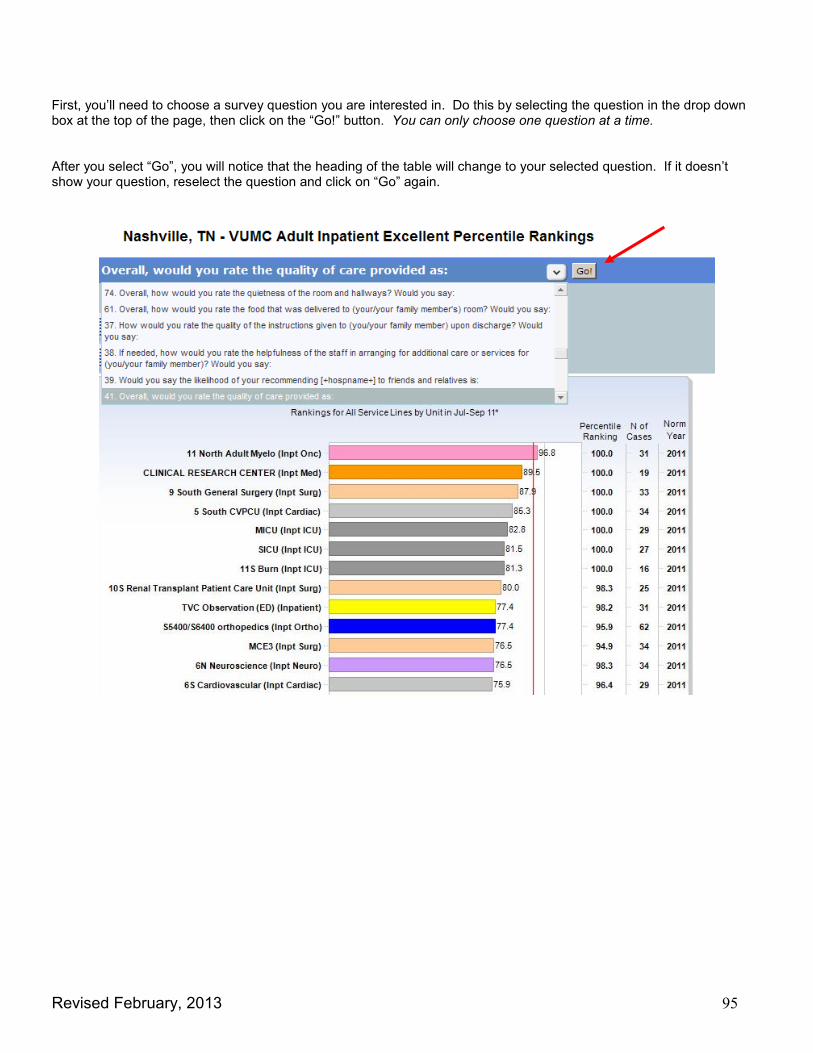
Revised February, 2013 95
First, you’ll need to choose a survey question you are interested in. Do this by selecting the question in the drop down box at the top of the page, then click on the “Go!” button. You can only choose one question at a time. After you select “Go”, you will notice that the heading of the table will change to your selected question. If it doesn’t show your question, reselect the question and click on “Go” again.
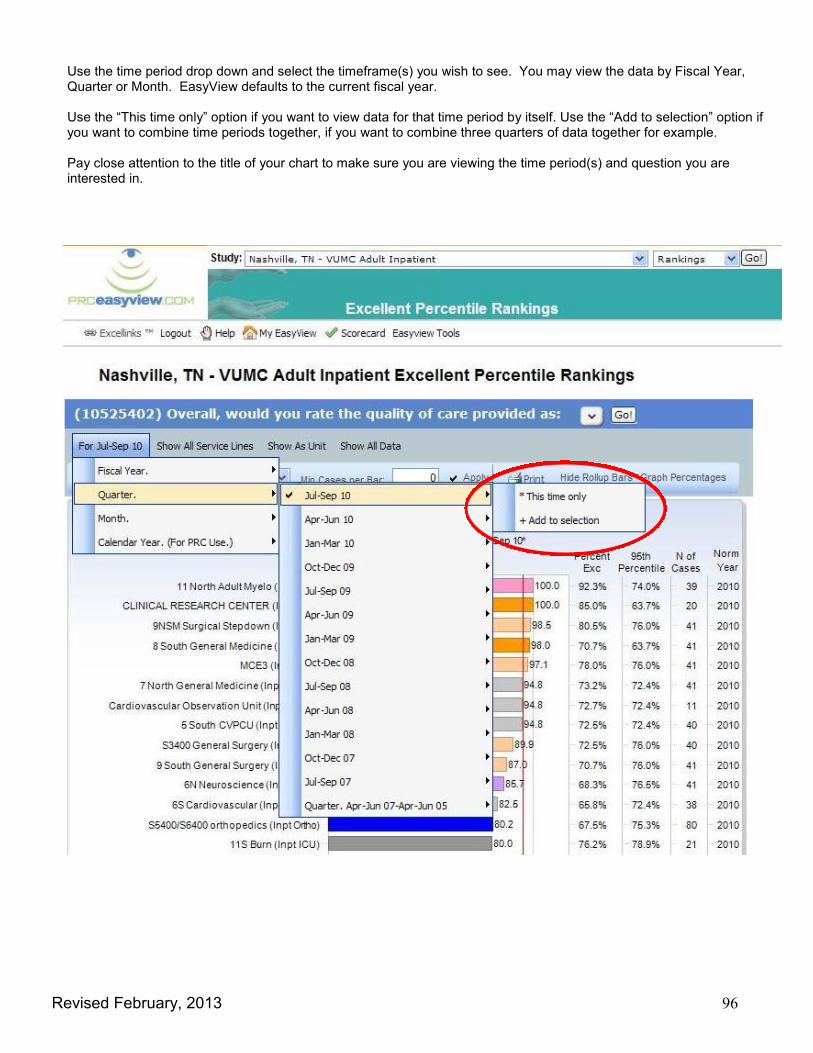
Revised February, 2013 96
Use the time period drop down and select the timeframe(s) you wish to see. You may view the data by Fiscal Year, Quarter or Month. EasyView defaults to the current fiscal year. Use the “This time only” option if you want to view data for that time period by itself. Use the “Add to selection” option if you want to combine time periods together, if you want to combine three quarters of data together for example. Pay close attention to the title of your chart to make sure you are viewing the time period(s) and question you are interested in.

Revised February, 2013 97
Depending on what studies you have access to, you will see various options in the menu bar next to the time period drop down. Different studies have different service line norms (designated by the different colored bars) and you can choose to only see certain ones or view all service lines on one chart. To view your data by %Excellent Ranking, click on the Graph Percentages button and the data will change to show only the % Excellent scores. Once you have changed this to Graph Percentages, this option will read “Graph Percentile” as it does in the example below. You can change the percentage goal line (the red line) to by selecting the number in the “Set Percentage To” drop down menu and clicking on the “Apply” button. You can Export the charts to Excel, Power Point or Adobe, or Print them. “Hide Rollup Bars” will simply take off the overall bar at the very bottom of the chart. “Trending Level” can be changed if you’d like to see the data over a period of time. For instance, If you have selected to view your data by Quarter, and change the trending level to 2 time periods, you will see the previous quarter’s data directly below the current quarter.
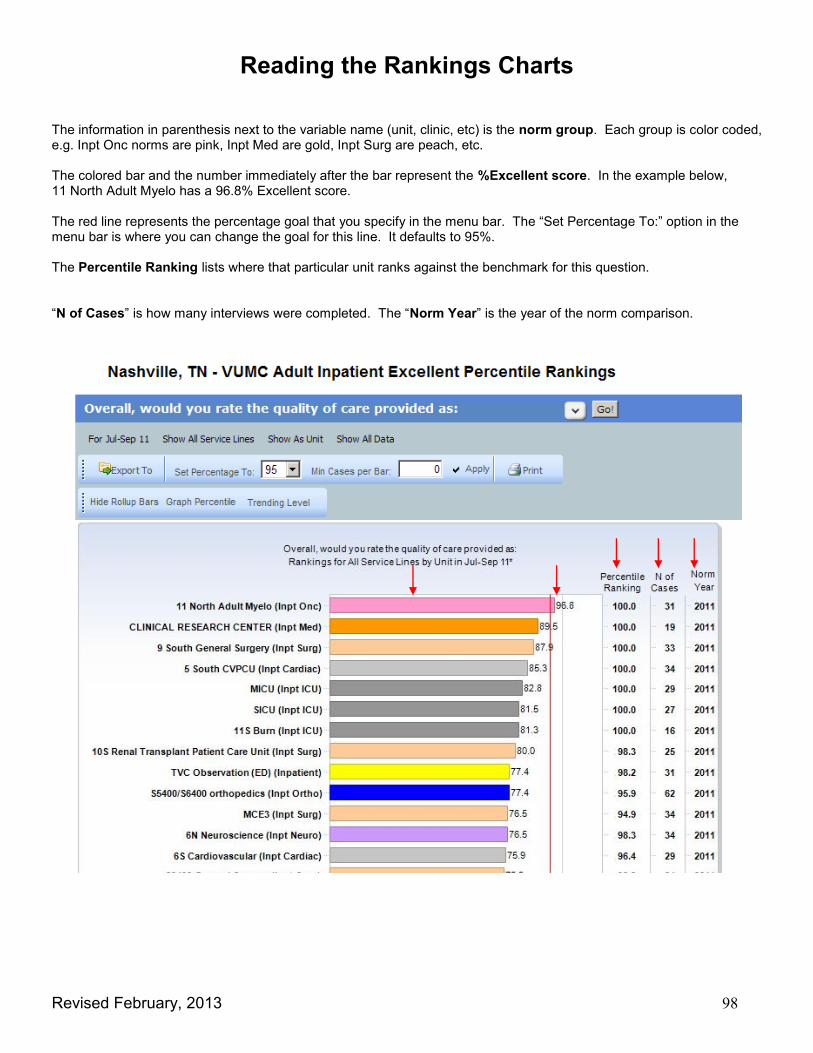
Revised February, 2013 98
Reading the Rankings Charts
The information in parenthesis next to the variable name (unit, clinic, etc) is the norm group. Each group is color coded, e.g. Inpt Onc norms are pink, Inpt Med are gold, Inpt Surg are peach, etc. The colored bar and the number immediately after the bar represent the %Excellent score. In the example below, 11 North Adult Myelo has a 96.8% Excellent score. The red line represents the percentage goal that you specify in the menu bar. The “Set Percentage To:” option in the menu bar is where you can change the goal for this line. It defaults to 95%. The Percentile Ranking lists where that particular unit ranks against the benchmark for this question. “N of Cases” is how many interviews were completed. The “Norm Year” is the year of the norm comparison.
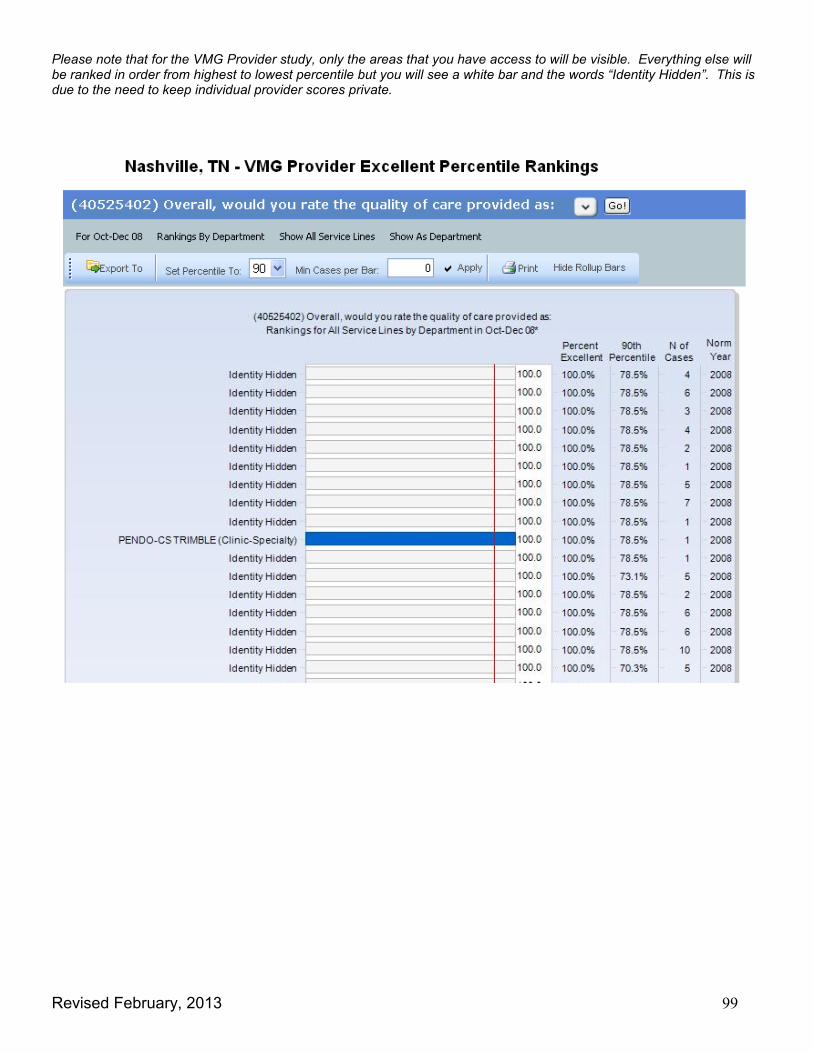
Revised February, 2013 99
Please note that for the VMG Provider study, only the areas that you have access to will be visible. Everything else will be ranked in order from highest to lowest percentile but you will see a white bar and the words “Identity Hidden”. This is due to the need to keep individual provider scores private.

Revised February, 2013 100
Results
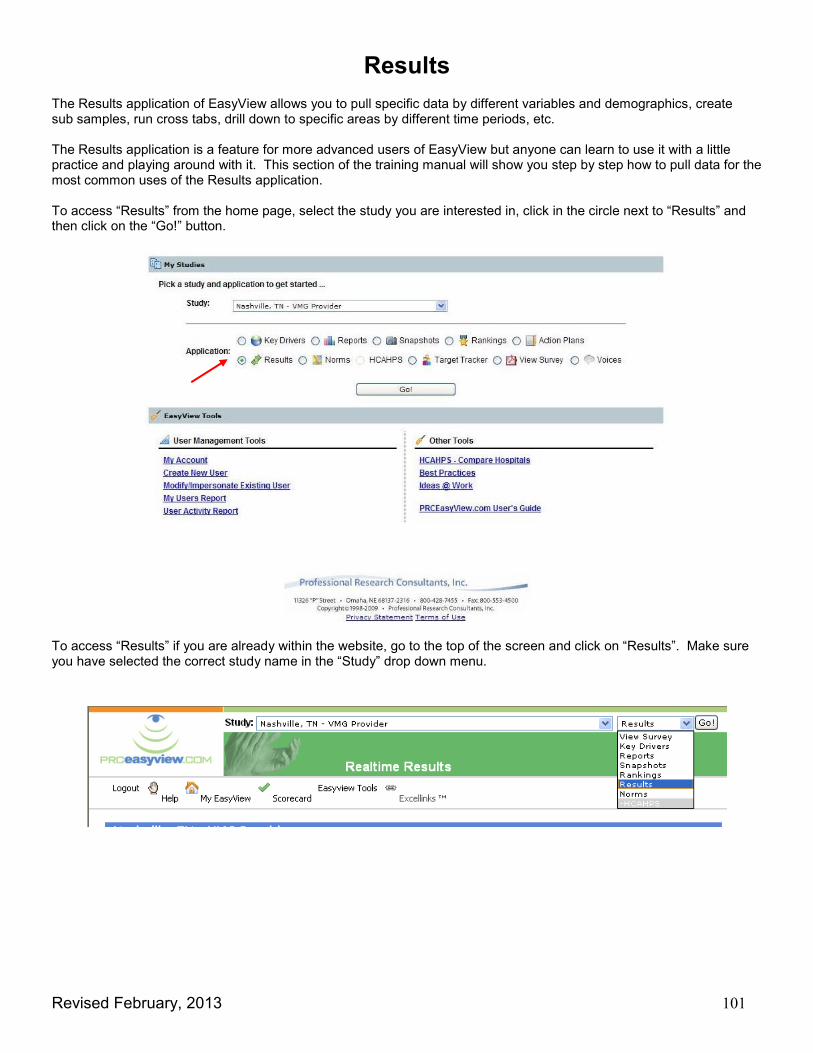
Revised February, 2013 101
Results
The Results application of EasyView allows you to pull specific data by different variables and demographics, create sub samples, run cross tabs, drill down to specific areas by different time periods, etc. The Results application is a feature for more advanced users of EasyView but anyone can learn to use it with a little practice and playing around with it. This section of the training manual will show you step by step how to pull data for the most common uses of the Results application. To access “Results” from the home page, select the study you are interested in, click in the circle next to “Results” and then click on the “Go!” button.
To access “Results” if you are already within the website, go to the top of the screen and click on “Results”. Make sure you have selected the correct study name in the “Study” drop down menu.

Revised February, 2013 102
The Results application will default to the Fiscal Year list as seen below. The numbers to the right of the years are frequencies. For instance, in FY2010 there were 49,680 interviews completed which makes up 21.1% of the total num-ber of interviews for all years.
The “Change Question” drop down menu contains all the demographic information contained in the patient record, as well as all the survey questions, including the open ended questions. Use the scroll tool to see every variable.
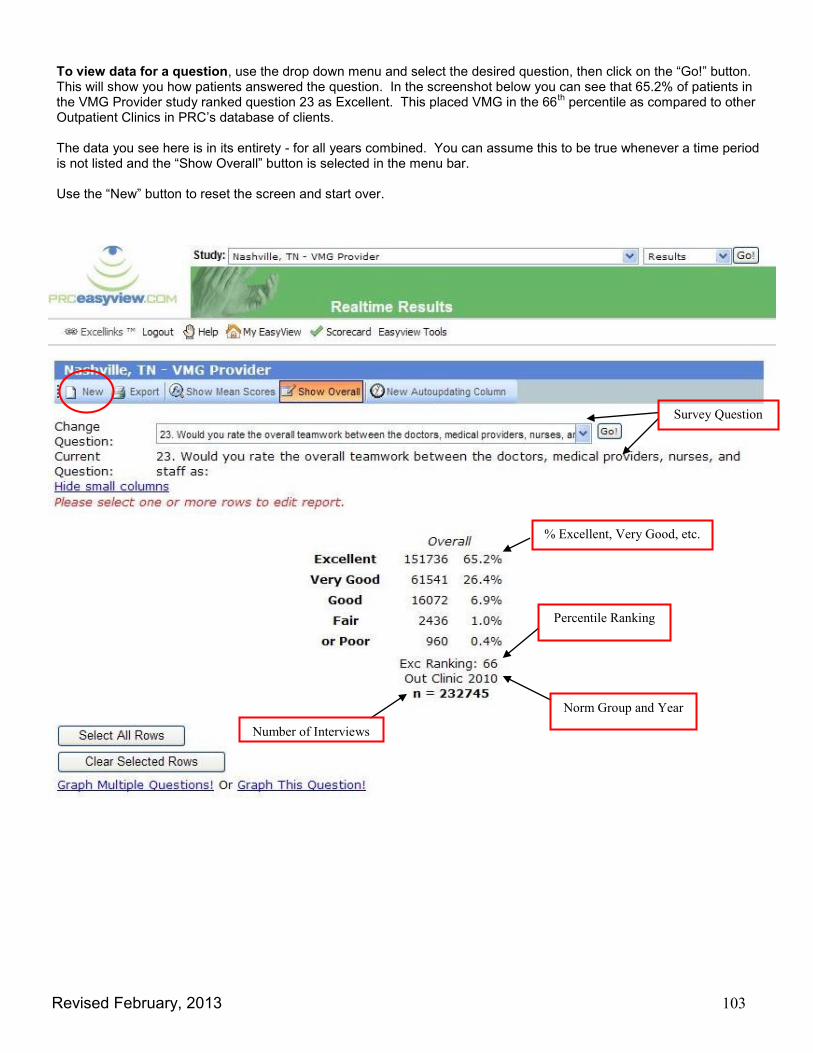
Revised February, 2013 103
To view data for a question, use the drop down menu and select the desired question, then click on the “Go!” button. This will show you how patients answered the question. In the screenshot below you can see that 65.2% of patients in the VMG Provider study ranked question 23 as Excellent. This placed VMG in the 66
th percentile as compared to other
Outpatient Clinics in PRC’s database of clients. The data you see here is in its entirety - for all years combined. You can assume this to be true whenever a time period is not listed and the “Show Overall” button is selected in the menu bar. Use the “New” button to reset the screen and start over.
Survey Question
% Excellent, Very Good, etc.
Percentile Ranking
Norm Group and Year
Number of Interviews
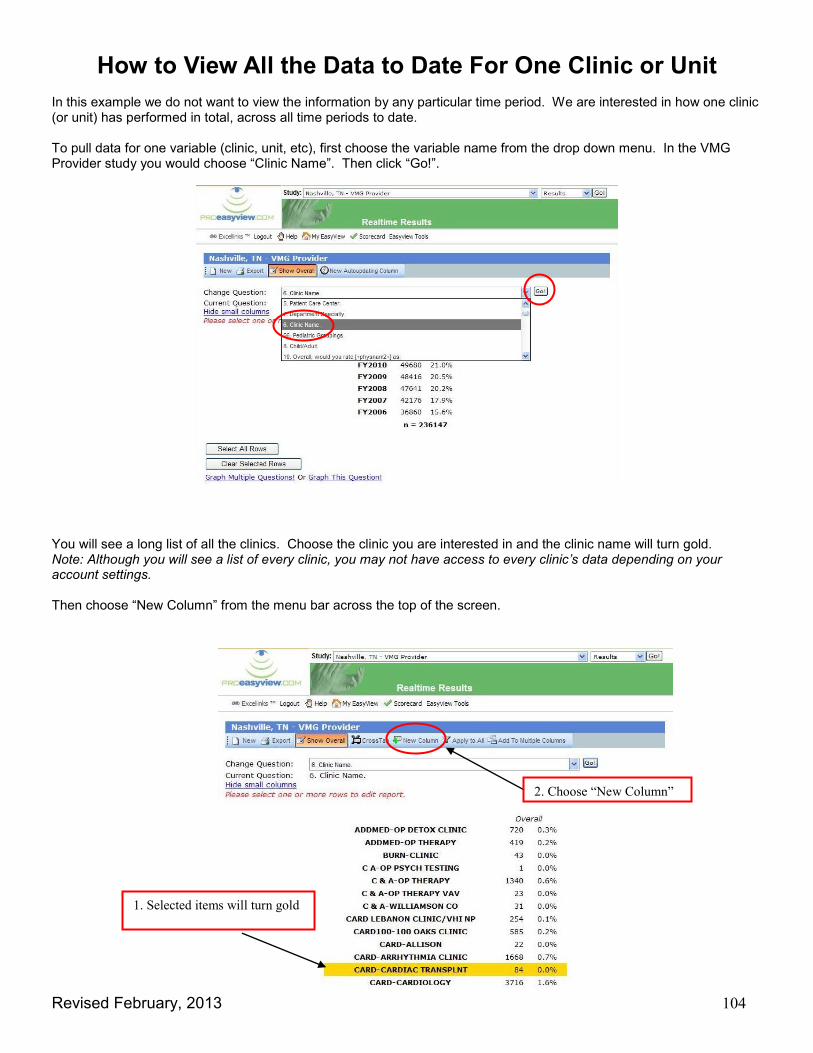
Revised February, 2013 104
How to View All the Data to Date For One Clinic or Unit In this example we do not want to view the information by any particular time period. We are interested in how one clinic (or unit) has performed in total, across all time periods to date. To pull data for one variable (clinic, unit, etc), first choose the variable name from the drop down menu. In the VMG Provider study you would choose “Clinic Name”. Then click “Go!”.
You will see a long list of all the clinics. Choose the clinic you are interested in and the clinic name will turn gold. Note: Although you will see a list of every clinic, you may not have access to every clinic’s data depending on your account settings. Then choose “New Column” from the menu bar across the top of the screen.
2. Choose “New Column”
1. Selected items will turn gold
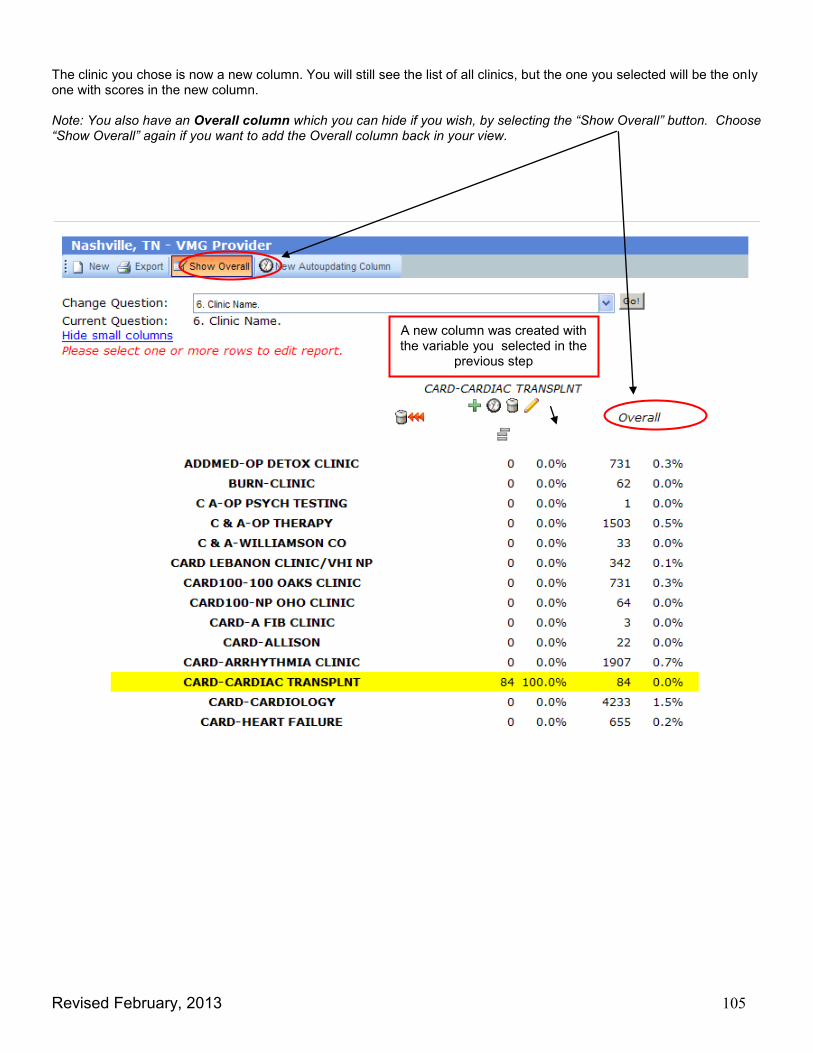
Revised February, 2013 105
The clinic you chose is now a new column. You will still see the list of all clinics, but the one you selected will be the only one with scores in the new column. Note: You also have an Overall column which you can hide if you wish, by selecting the “Show Overall” button. Choose “Show Overall” again if you want to add the Overall column back in your view.
A new column was created with the variable you selected in the
previous step

Revised February, 2013 106
Viewing the Scores For Selected Variables
After the filters are applied, follow these steps to export and print out the data.
Click “Export”.
Select the questions you are interested in. You can choose all questions by clicking on the “Select All” button under the list. If you only want to select a few questions, click in the box next to each question. NOTE: If you click outside the box on a question, it will deselect all questions but that one. Click “Next”.

Revised February, 2013 107
Select the format you wish to view the data in the drop down box then click on “Finish”. Examples of each format are shown below. Once you’ve exported the data into the format you like, you can print from there.
Note: If you have several columns of data you are pulling, exporting to Excel is probably your best choice. Text:

Revised February, 2013 108
Adobe PDF
Excel
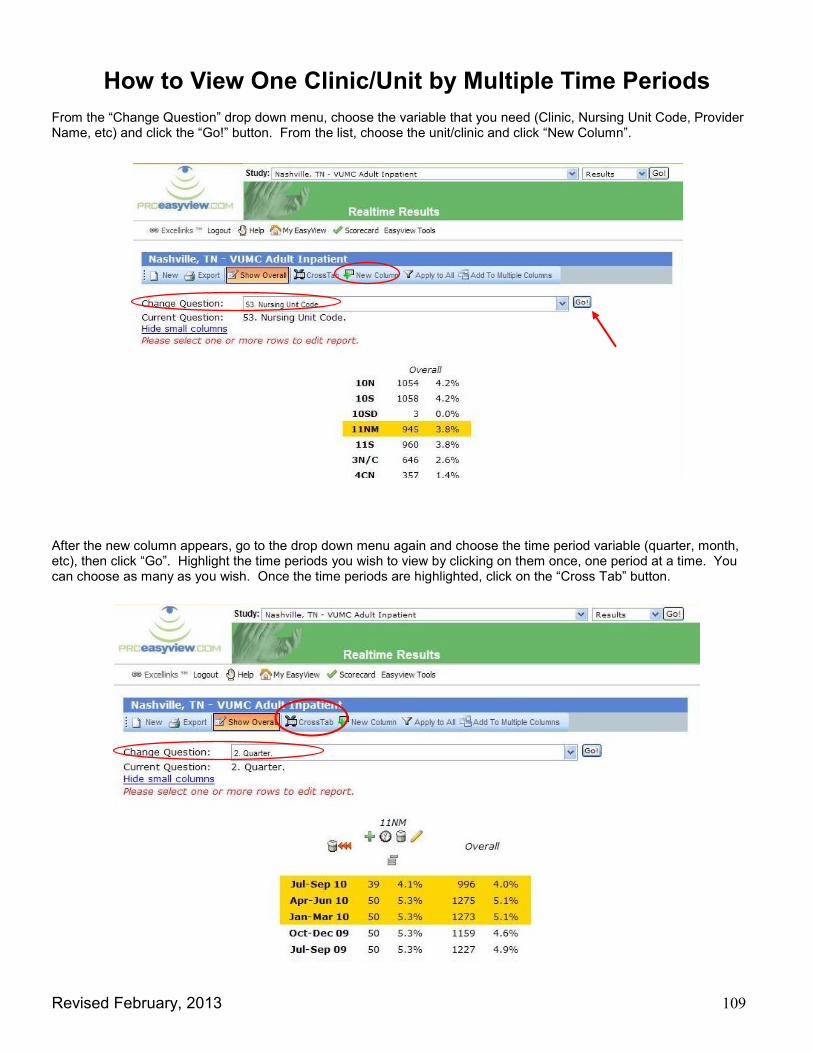
Revised February, 2013 109
How to View One Clinic/Unit by Multiple Time Periods From the “Change Question” drop down menu, choose the variable that you need (Clinic, Nursing Unit Code, Provider Name, etc) and click the “Go!” button. From the list, choose the unit/clinic and click “New Column”.
After the new column appears, go to the drop down menu again and choose the time period variable (quarter, month, etc), then click “Go”. Highlight the time periods you wish to view by clicking on them once, one period at a time. You can choose as many as you wish. Once the time periods are highlighted, click on the “Cross Tab” button.

Revised February, 2013 110
Now you will see a column for each unit/clinic and the combined time periods. NOTE: The Overall Column is still visi-ble but an be removed by clicking on “Show Overall” To view the scores and print the data, click the “Export” button and follow the steps from “Viewing the scores for selected variables” within this Results section.

Revised February, 2013 111
How to View Multiple Clinics/Units by One Time Period From a new screen (click “New”), choose the time period variable you want from the drop down menu and click “Go”.
Highlight the specific time period you want and choose “New Column”. The time period you selected will be pulled into a new column. (You can remove the Overall column by deselecting the “Show Overall” button”)

Revised February, 2013 112
Go to the “Change Question” drop down menu and choose the clinic name variable (or nursing unit code, etc). Click on the “Go!” button. Highlight the areas you are interested in by clicking on them once, one at a time. They will turn gold once highlighted. Click the “Cross Tab” button. You will see the areas you highlighted in columns by the time period selected.
To view the scores and print the data, click the “Export” button and follow the steps from “Viewing the scores for selected variables” within this Results section.

Revised February, 2013 113
This combines all of your selections into one column. To shorten or change the name of the column, click on the pencil icon beneath the column header. Change the column name and click “Rename”. Now you can proceed to trend this data by different time periods or export and print the information as is.
How to Combine Variables Together To combine like variables together (this could be clinics, units, time periods, etc), choose the variable type from the drop down list and highlight the areas you wish to combine. Then click “New Column”.

Revised February, 2013 114
Results – Icons
The green plus sign allows you to add any rows that you select (highlight) to the filter on that column.
The trash can allows you to delete the column.
The pencil icon lets you view and edit the current filter on the column and change the column title.
If you want to select (highlight) all the rows then click on the “Select All Rows” button.
To deselect (un-highlight) the rows, click on the “Clear Selected Rows” button.
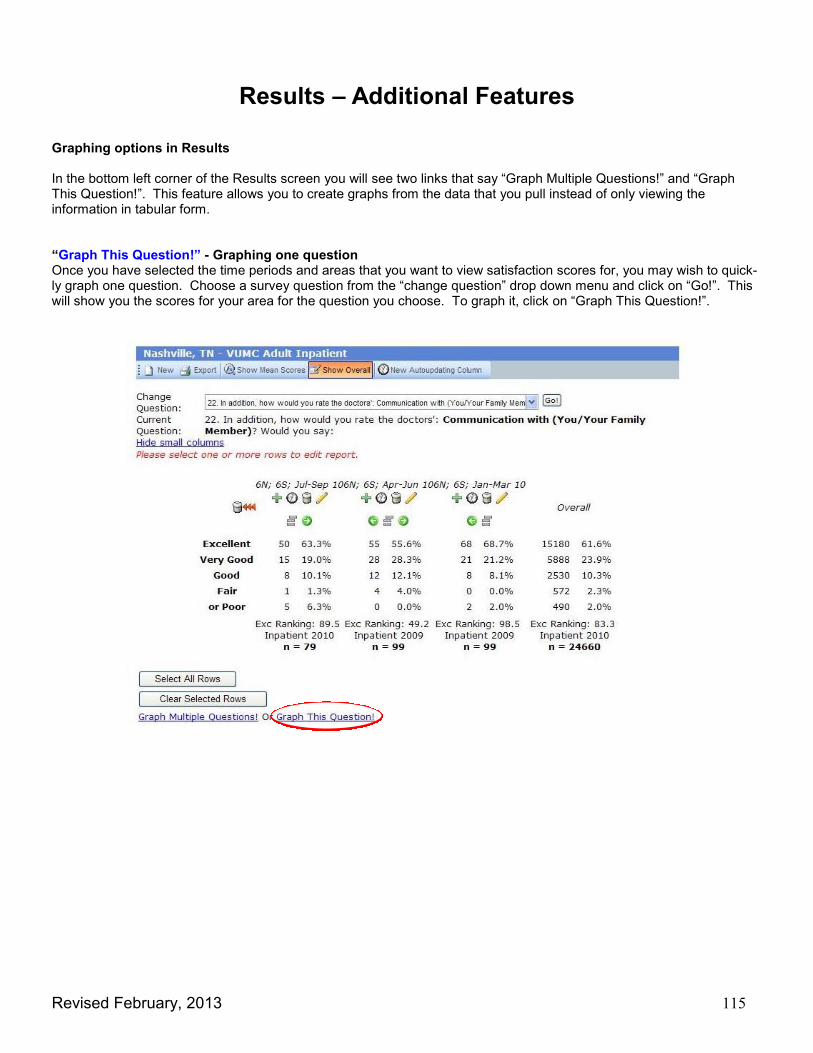
Revised February, 2013 115
Results – Additional Features Graphing options in Results In the bottom left corner of the Results screen you will see two links that say “Graph Multiple Questions!” and “Graph This Question!”. This feature allows you to create graphs from the data that you pull instead of only viewing the information in tabular form. “Graph This Question!” - Graphing one question Once you have selected the time periods and areas that you want to view satisfaction scores for, you may wish to quick-ly graph one question. Choose a survey question from the “change question” drop down menu and click on “Go!”. This will show you the scores for your area for the question you choose. To graph it, click on “Graph This Question!”.

Revised February, 2013 116
This is an example of the graph that will populate. Click on “Export To” to export your graph in Acrobat (PDF) format. Click on “Change Questions” to select another question to graph. Click on “Return” to return to the Results application, which will still have your filters selected.
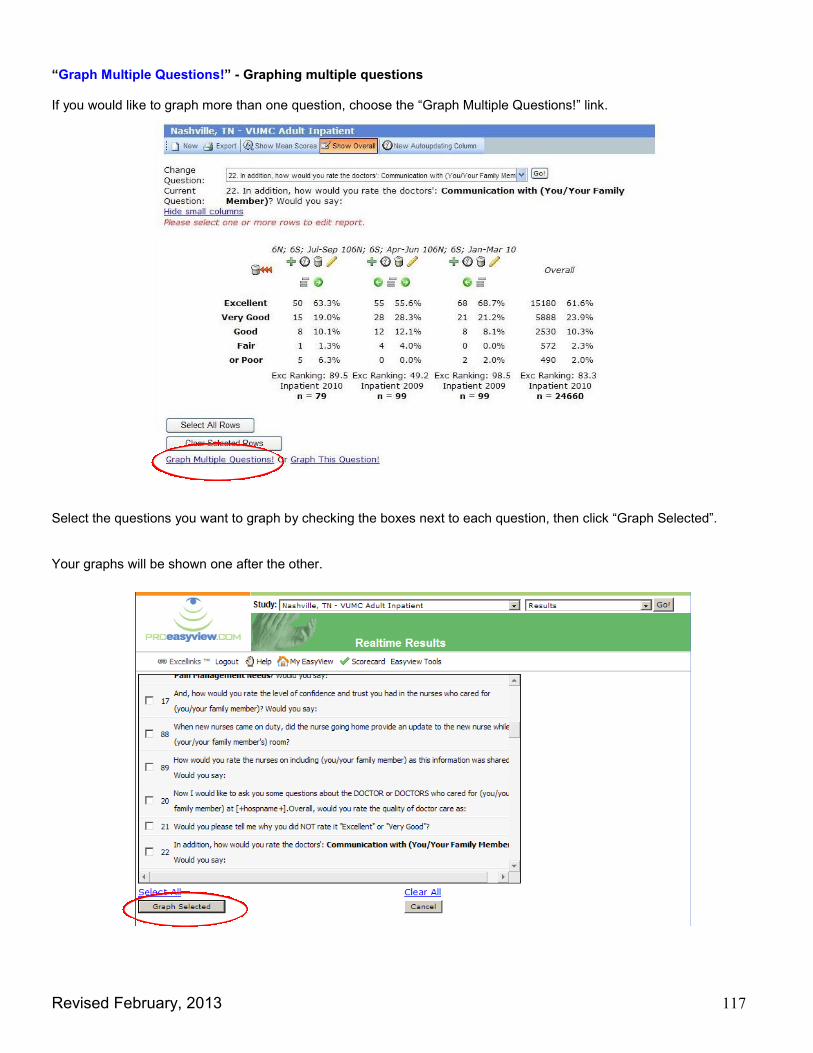
Revised February, 2013 117
“Graph Multiple Questions!” - Graphing multiple questions If you would like to graph more than one question, choose the “Graph Multiple Questions!” link.
Select the questions you want to graph by checking the boxes next to each question, then click “Graph Selected”. Your graphs will be shown one after the other.

Revised February, 2013 118
Results – Additional Features
Apply to All This is an advanced user feature of the Results application. This button allows you to add rows you’ve selected to a filter that is applied to all columns at once. In the example below, four Patient Care Centers were selected and placed in four columns using the Cross Tab button. Then all of the quarters for 2010 that are available so far were highlighted. Next we will select the “Apply to All” button because we want all three quarters to be applied to the four PCCs at one time. In other words, we want to see satisfaction data for 2010 to date for each of the PCCs we selected.
The filter was applied to each PCC selected.
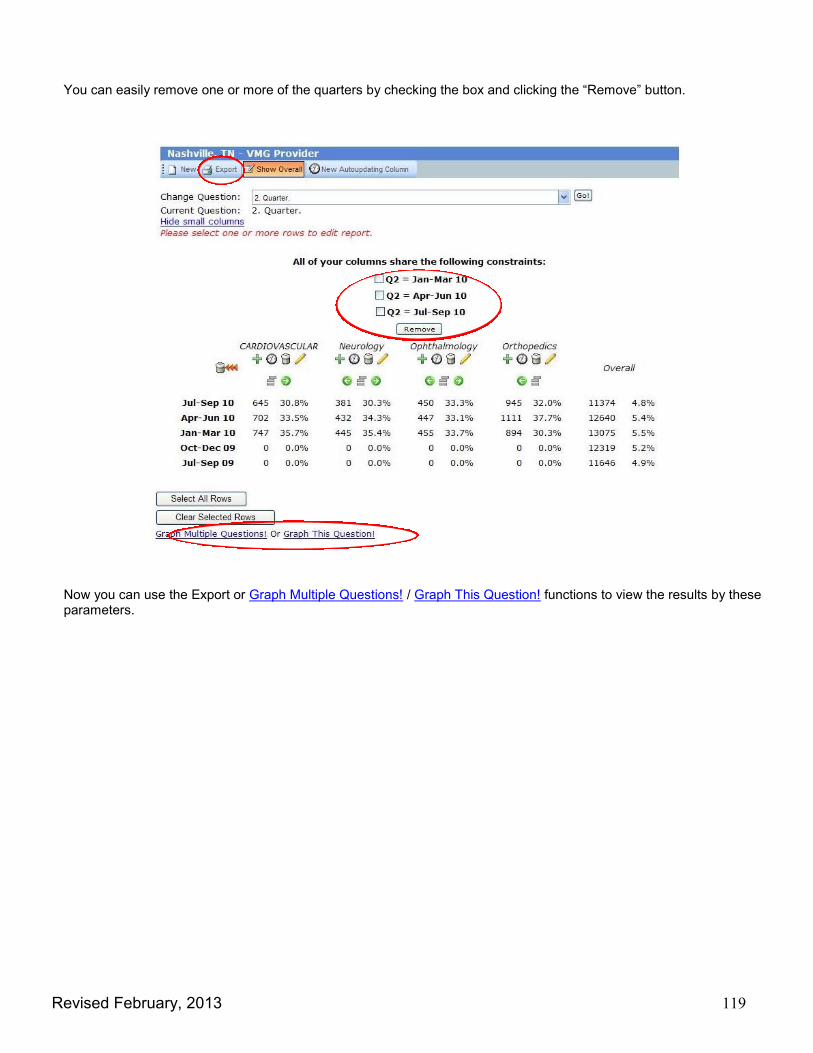
Revised February, 2013 119
You can easily remove one or more of the quarters by checking the box and clicking the “Remove” button.
Now you can use the Export or Graph Multiple Questions! / Graph This Question! functions to view the results by these parameters.

Revised February, 2013 120
Results – Additional Features
Add to Multiple Columns This is another advanced feature of the Results application. The “Add to Multiple Columns” button allows you to add selected rows to multiple columns at once. In this example, several Patient Care Centers were selected and placed into individual columns using the CrossTab button. FY2010 is highlighted and the “Add to Multiple Columns” button clicked.
A box opens up with the PCCs listed. Choose the PCCs you wish to view data for FY2010 and choose “Add”. (Hold the Ctrl key down to select multiple PCCs).
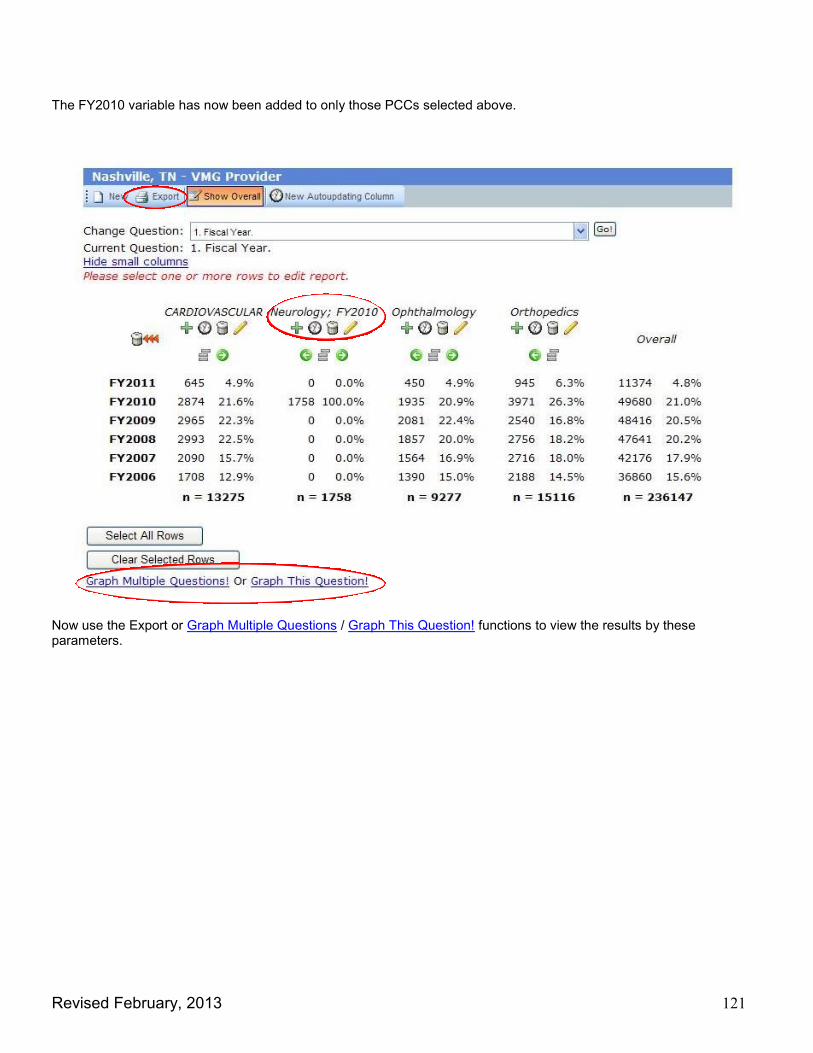
Revised February, 2013 121
The FY2010 variable has now been added to only those PCCs selected above. Now use the Export or Graph Multiple Questions / Graph This Question! functions to view the results by these parameters.

Revised February, 2013 122
Action
Planning

Revised February, 2013 123
Action Planning
The Action Planning application is a feature for more advanced users of EasyView but anyone can learn to use it with a little practice and playing around with it. This section of the training manual will show you step by step how to create an action plan for your unit. To access “Action Planning” from the home page, select the study you are interested in, click in the circle next to “Action Planning” and then click on the “Go!” button.
To access “Action Planning” if you are already within the website, go to the top of the screen and click on “Action Plan-ning”. Make sure you have selected the correct study name in the “Study” drop down menu.
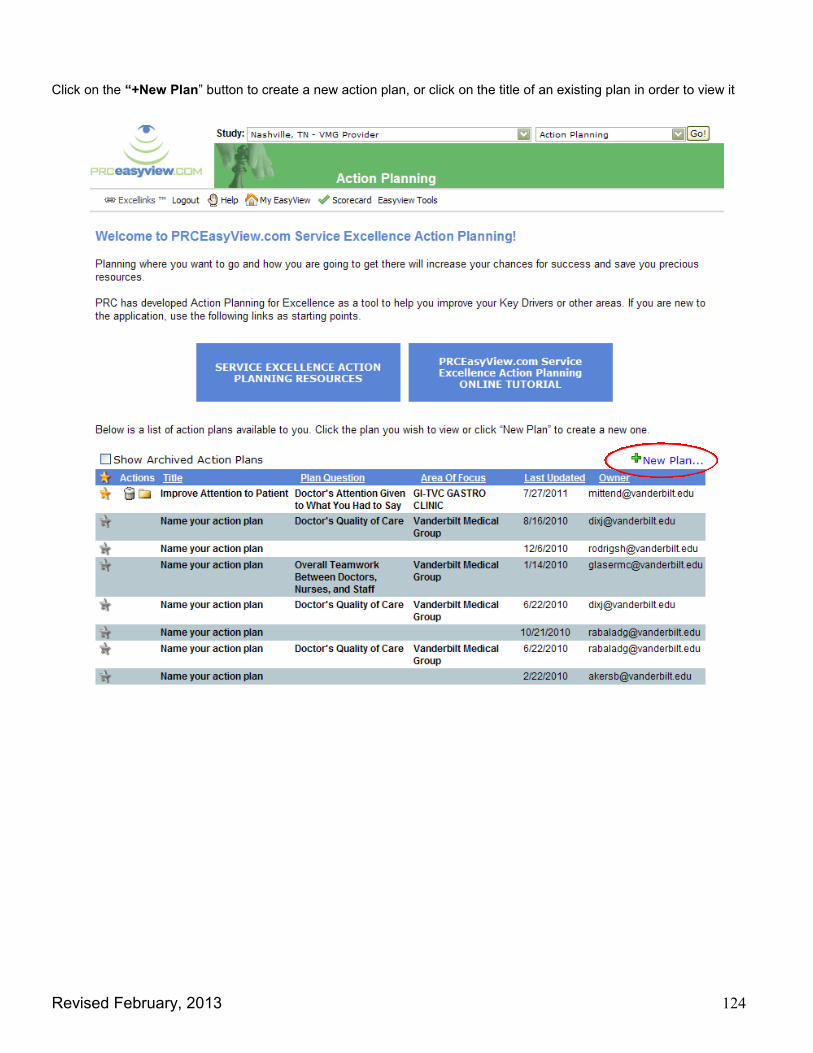
Revised February, 2013 124
Click on the “+New Plan” button to create a new action plan, or click on the title of an existing plan in order to view it

Revised February, 2013 125
Phase 1: Preparation Select the Area of Focus for study as a whole or to focus on a specific area within the study. In the pull down menu, you will see the Hospital as a whole, the Department Specialty/PCC, and the specific units under that specialty. Click on the unit you wish to use. Choose the Action Plan Question from the survey on which to focus.
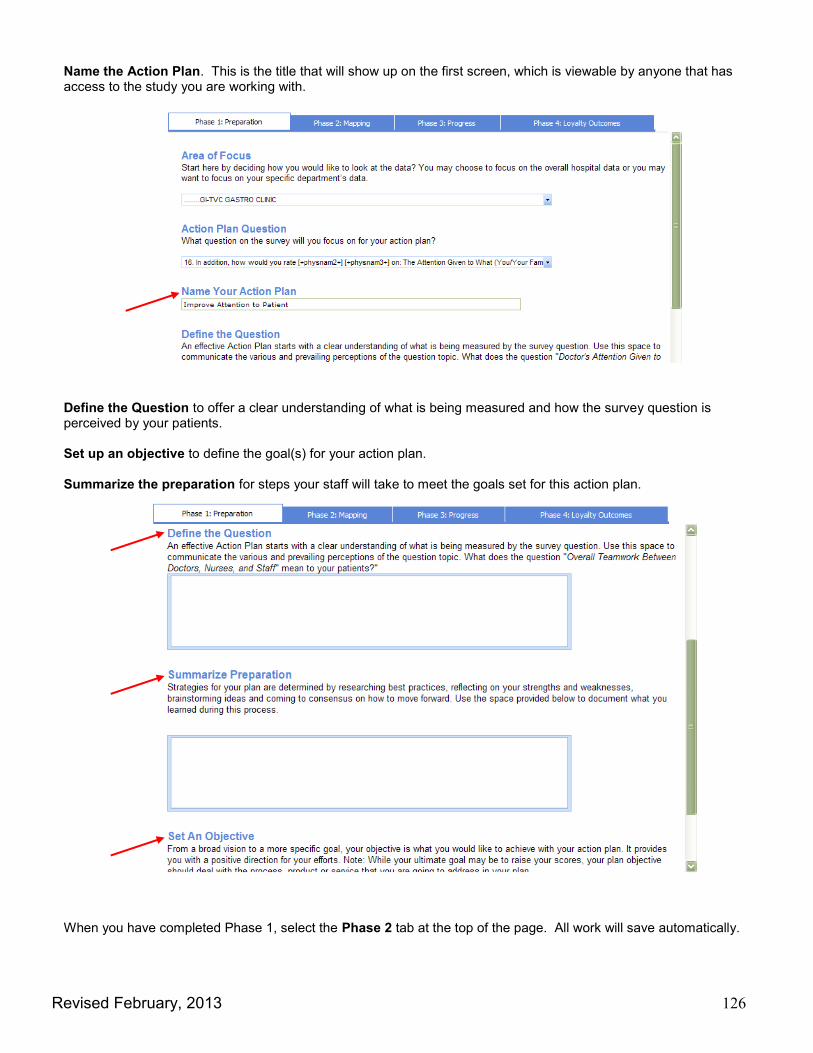
Revised February, 2013 126
Name the Action Plan. This is the title that will show up on the first screen, which is viewable by anyone that has access to the study you are working with. Define the Question to offer a clear understanding of what is being measured and how the survey question is perceived by your patients. Set up an objective to define the goal(s) for your action plan. Summarize the preparation for steps your staff will take to meet the goals set for this action plan. When you have completed Phase 1, select the Phase 2 tab at the top of the page. All work will save automatically.

Revised February, 2013 127
Phase 2: Mapping When you open the Phase 2: Mapping tab, your Objective will show up and you can now set up the steps to achieving your goal. There are four steps in this Phase: New Action, New Measure & Monitor, New Communication and New Cel-ebration. Each step allows you to set up a name, schedule, reminder options, assignment and a description. Each step has a description of that step, as in the red box below for the Action step.

Revised February, 2013 128
After you have set up the four steps for an objective, you will see each step in the table below. The Type column displays an icon that indicates the type of each Step. The Status column is color coded and the key is displays just below the Step list. The status of each Step can be updated by clicking in the checkbox to its left and then clicking on the appropriate status below. A green circle after the Step Description is an indication that the Step is recurring.

Revised February, 2013 129
Phase 3: Progress Click on the Phase 3: Progress tab to add or update comments for the strategy steps. NOTE: Any user with access to the study for which the action plan was created, can view or add comments. You can chose to show any or all steps created in Phase 2 by selecting the box next to each step. You can also chose to hide the completed steps by selecting that box. To create a comment, click on “Make a Comment” under the step you’d like to include it. A text box will open. Type in your comment and click Add. Comments will list from oldest to newest. If the text is Red, the scheduled date has passed for that step. You can go back to Phase 2 to edit the date or other parameters for each step. To change the status of a step, open the drop down box next to each step and select the status.
You can add numerous comments. They will include the date and time it was.
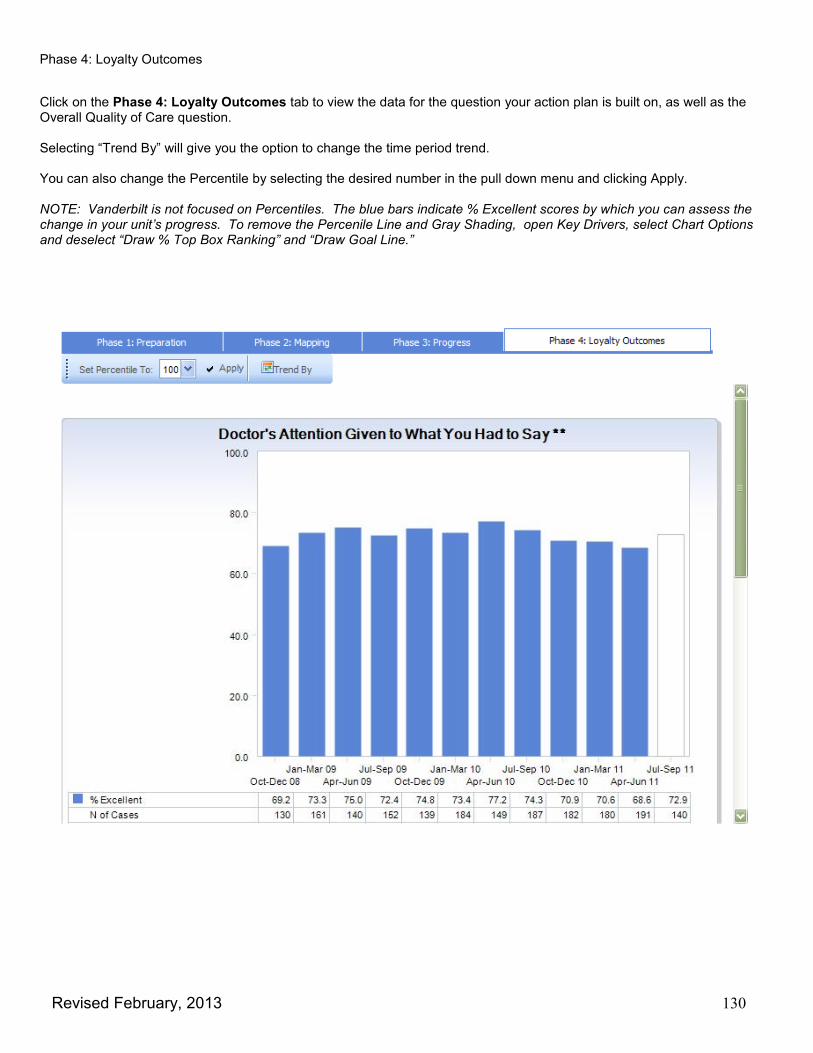
Revised February, 2013 130
Phase 4: Loyalty Outcomes
Click on the Phase 4: Loyalty Outcomes tab to view the data for the question your action plan is built on, as well as the Overall Quality of Care question. Selecting “Trend By” will give you the option to change the time period trend. You can also change the Percentile by selecting the desired number in the pull down menu and clicking Apply. NOTE: Vanderbilt is not focused on Percentiles. The blue bars indicate % Excellent scores by which you can assess the change in your unit’s progress. To remove the Percenile Line and Gray Shading, open Key Drivers, select Chart Options and deselect “Draw % Top Box Ranking” and “Draw Goal Line.”


![Chapter 22 EasyView MT8000 seires HMI and PLC …support.automatyka-przemyslowa.biz/files/plc[1].pdf · Chapter 22 EasyView MT8000 seires HMI and PLC connecting guide ... FATEK FB](https://img.dokumen.tips/doc/110x75/5a8dd8207f8b9af27f8c8ee7/chapter-22-easyview-mt8000-seires-hmi-and-plc-1pdfchapter-22-easyview-mt8000.jpg)


