Embed Size (px)
Citation preview

Reference genome assemblies reveal the origin andevolution of allohexaploid oatYuanying Peng ( [email protected] )
Sichuan Agricultural University https://orcid.org/0000-0002-3304-3301Honghai Yan
Sichuan Agricultural UniversityLaichun Guo
Baicheng Academy of Agricultural SciencesCao Deng
DNA Stories Bioinformatics Center https://orcid.org/0000-0001-9823-9121Lipeng Kang
Institute of Genetics and Developmental Biology https://orcid.org/0000-0003-0055-9149Chunlong Wang
Baicheng Academy of Agricultural SciencesPingping Zhou
Sichuan Agricultural UniversityKaiquan Yu
Sichuan Agricultural UniversityXiaolong Dong
Sichuan Agricultural UniversityJun Zhao
Sichuan Agricultural UniversityYun Peng
Sichuan Agricultural UniversityXiaomeng Liu
Sichuan Agricultural UniversityDi Deng
Sichuan Agricultural UniversityYinghong Xu
Sichuan Agricultural UniversityYing Li
Sichuan Agricultural UniversityQiantao Jiang
Sichuan Agricultural UniversityYan Li

Rice Research Institution https://orcid.org/0000-0002-6443-9245Liming Wei
Baicheng Academy of Agricultural SciencesJirui Wang
Sichuan Agricultural UniversityJian Ma
Sichuan Agricultural UniversityMing Hao
Sichuan Agricultural UniversityWei Li
Sichuan Agricultural UniversityHouyang Kang
Triticeae Research Institute, Sichuan Agricultural UniversityYouliang Zheng
Sichuan Agricultural UniversityYuming Wei
Sichuan Agricultural UniversityFei Lu
Institute of Genetics and Developmental Biology https://orcid.org/0000-0002-3596-1712Changzhong Ren
Baicheng Academy of Agricultural Sciences
Biological Sciences - Article
Keywords: common oat, avena sativa, plant evolution, genome sequencing
Posted Date: June 29th, 2021
DOI: https://doi.org/10.21203/rs.3.rs-664692/v1
License: This work is licensed under a Creative Commons Attribution 4.0 International License. Read Full License

Reference genome assemblies reveal the origin and evolution 1
of allohexaploid oat 2
Yuanying Peng1,2,3,4,10*, Honghai Yan1,3,10, Laichun Guo2,4,10, Cao Deng5,6,10, Lipeng Kang7,8,10, 3
Chunlong Wang2,4, Pingping Zhou1,3, Kaiquan Yu3, Xiaolong Dong3, Jun Zhao3, Yun Peng3, Xiaomeng 4
Liu3, Di Deng3, Yinghong Xu3, Ying Li3, Qiantao Jiang1,3, Yan Li1, Liming Wei2,4, Jirui Wang1,3, Jian 5
Ma1,3, Ming Hao1,3, Wei Li1,3, Houyang Kang1,3, Youliang Zheng1,3, Yuming Wei1,3*, Fei Lu7,8,9*, 6
Changzhong Ren2,4,11* 7
8
1 State Key Laboratory of Crop Gene Exploration and Utilization in Southwest China, Sichuan 9
Agricultural University, Chengdu, China. 10
2 National Oat Improvement Center, Baicheng Academy of Agricultural Sciences, Baicheng, China. 11
3 Triticeae Research Institute, Sichuan Agricultural University, Chengdu, China. 12
4 China Oat and Buckwheat Research Center, Baicheng, China. 13
5 The Key Laboratory of Animal Disease and Human Health of Sichuan Province, College of 14
Veterinary Medicine, Sichuan Agricultural University, Chengdu, China. 15
6 Departments of Bioinformatics, DNA Stories Bioinformatics Center, Chengdu, China 16
7 State Key Laboratory of Plant Cell and Chromosome Engineering, Institute of Genetics and 17
Developmental Biology, Innovative Academy of Seed Design, Chinese Academy of Sciences, Beijing, 18
China. 19
8 University of Chinese Academy of Sciences, Beijing, China. 20
9 CAS-JIC Centre of Excellence for Plant and Microbial Science (CEPAMS), Institute of Genetics and 21
Developmental Biology, Chinese Academy of Sciences, Beijing, China. 22
10 These authors contributed equally to this work. 23
11 Lead contact. 24
*Correspondence: Changzhong Ren ([email protected]), Fei Lu ([email protected]), 25
Yuming Wei ([email protected]), Yuanying Peng ([email protected]) 26

Common oat (Avena sativa) is one of the most important cereal crops serving as a 27
valuable source of forage and human food. While reference genomes of many 28
important crops have been generated, such work in oat has lagged behind, 29
primarily owing to its large, repeat-rich, polyploid genome. By using Oxford 30
Nanopore ultralong sequencing and Hi-C technologies, we have generated the 31
first reference-quality genome assembly of hulless common oat with a contig N50 32
of 93 Mb. We also assembled the genomes of diploid and tetraploid Avena 33
ancestors, which enabled us to identify oat subgenome, large-scale structural 34
rearrangements, and preferential gene loss in the C subgenome after 35
hexaploidization. Phylogenomic analyses of cereal crops indicated that the oat 36
lineage descended before wheat, offering oat as a unique window into the early 37
evolution of polyploid plants. The origin and evolution of hexaploid oat is 38
deduced from whole-genome sequencing, plastid genome and transcriptomes 39
assemblies of numerous Avena species. The high-quality reference genomes of 40
Avena species with different ploidies and the studies of their polyploidization 41
history will facilitate the full use of crop gene resources and provide a reference 42
for the molecular mechanisms underlying the polyploidization of higher plants, 43
helping us to overcome food security challenges. 44

Common oat (Avena sativa L., 2n = 6x = 42) is the sixth most important cereal crop 45
cultivated worldwide 1 and has long been prized by consumers largely because it is 46
one of the richest sources of protein, fat and VB1 among all crops 2. In addition, it is 47
the most widely grown cool-season annual forage species, representing a major source 48
of forage for livestock globally 3. Polyploid plants often have significant advantages 49
concerning biomass production, vigorousness, and robust adaptation to environmental 50
changes and contribute to the emergence of important agronomic traits in food crops 51
4-8. Therefore, crop polyploidization may play an important role in next-generation 52
crop improvement aimed at overcoming food security challenges 8. Many 53
commercially important crops have been sequenced and assembled, which has 54
improved the understanding of crop evolutionary history and the development of 55
efficient approaches for the selection of important traits 9. Oat research has lagged 56
behind in this regard, primarily due to the large hexaploid oat genome 10 containing 57
highly repetitive DNA sequences, in which two of the three subgenomes are too 58
homologous to distinguish from each other 11. Relatively little is currently known 59
about the position and distribution of genes on each of the oat chromosomes and their 60
evolution during the polyploidization events that gave rise to hexaploid species, which 61
limits the full and effective utilization of oat germplasms. 62
With the recent advances made by Oxford Nanopore Technologies (ONT), the ONT 63
system now offers ultralong sequence reads, delivering high contiguity with low 64
assembly errors caused by long repetitive regions 12. This technology has facilitated 65
complete telomere-to-telomere (T2T) genome assembly in various species, including 66
Homo sapiens by resolving long, complex repetitive regions 13,14. It is very suitable 67
for the assembly of the large, complex polyploid oat genome, with a high content of 68
repetitive sequences and high subgenomic homology. Here, we employed the ONT 69

system to sequence the genome of the Sanfensan oat variety (Avena sativa ssp. nuda 70
cv. Sanfensan, abbreviated SFS; see Methods), an ancient, important hexaploid oat 71
landrace that originated from the diversity centre of hulless oat, together with 72
assembling the genomes of additional diploid and tetraploid Avena species to address 73
the phylogenomic relationship of cereal crops and gain insights into the evolutionary 74
processes that established the dominant subgenome in allopolyploid oat species with 75
large, complex genomes. 76
77
Assembly and annotation of the oat genome 78
Using the PromethION platform and the ultralong read sequencing strategy 13,15, we 79
assembled the SFS genome into 329 contigs based on 1028 Gb cleaned ultralong 80
reads (max length: 1.38 Mb), representing ~100× theoretical coverage with a contig 81
N50 of 93.26 Mb and a maximum length of 405.55 Mb (Supplementary Tables 1-3). 82
The longest 119 contigs contained 90% of the sequences, with the 34 longest contigs 83
covering half the genome. The total assembly size was 10.76 Gb, including 10.44 Gb 84
anchored to 21 pseudochromosomes using ∼1.37 billion valid unique interaction pairs 85
generated from 1296 Gb of cleaned Hi-C data (Supplementary Table 1, Extended Data 86
Fig. 1a). The quality and contiguity of the genome assembly were assessed through 87
alignments with the hexaploid consensus map and BUSCO pipeline. Most markers 88
from the same linkage group were anchored to the corresponding pseudochromosome 89
(Extended Data Fig. 2a), and 97.75% of the 1375 BUSCO genes were identified in the 90
SFS genome assemblies, indicating a high-quality genome assembly (Extended Data 91
Fig. 2b). A key feature of this assembly was its long-range organization, with contigs 92
longer than 20.9 Mb representing 90% of the genome and an average of 15 contigs 93
representing one chromosome (Table 1). The longest contig spanned 405 Mb, which 94

is larger than the size of rice genome 16. This assembly represents a substantial 95
improvement over the hexaploid oat genome sequenced by Pepsi Co. in 2020 (>1900 96
contigs with a contig N50 of 30.27 Mb, 97
https://wheat.pw.usda.gov/jb/?data=/ggds/oat-ot3098-pepsico.) and recent assemblies 98
reported for polyploid species with large, complex genomes 17,18. 99
Protein-coding genes were annotated using a combination of ab initio prediction 100
and transcript evidence gathered from RNA sequences from multiple tissues based on 101
PacBio isoform sequencing (Iso-seq) approaches and reference protein sequences 102
from the other six closely related grass species (see Methods). In total, 120,769 103
protein-coding genes were identified (Table 1, Supplementary Table 4), 88.41% of 104
which were assigned to a predicted function (Supplementary Table 5). Among these 105
genes, the majority were retained in duplicate, largely owing to the allohexaploid 106
nature of the genome. The C subgenome contained fewer gene loci (33181) than the A 107
(40,085) and D (41,633) subgenomes. We also identified 59,916 noncoding RNAs, 108
including 5,386 rRNAs, 50,536 small RNAs, 3,712 rRNAs and 283 cis-regulatory 109
elements (Supplementary Table 6). Moreover, a total of 9.5 Gb (88.64%) of the SFS 110
assembly was annotated as repetitive sequences (Table 1, Supplementary Table 7). 111
Transposable element (TE)-related sequences constituted 86.2% of the total genome 112
assembly. This TE content was higher than those previously reported for barley 113
(80.80%) 19 and bread wheat (84.70) 9. Long terminal repeat (LTR) retrotransposons, 114
including Gypsy elements, unclassified retrotransposon elements and Copia elements, 115
were the most abundant TEs and constituted 71.66% of the assembled SFS genome. 116
To distinguish the subgenomes accurately and clarify the polyploidization history 117
of hexaploid oat, we also sequenced, assembled and annotated the most likely 118
ancestral diploid species, A. longiglumis, and tetraploid species, A. insularis 20, 119

resulting in >60-fold genome coverage for A. longiglumis (218.67 Gb) and A. 120
insularis (374.77 Gb). The assembled A. longiglumis genome was 3.74 Gb in size, 121
and 99.20% (3.71 Gb) of its sequences were anchored on the 7 chromosomes of A. 122
atlantica 21. The tetraploid A. insularis genome was 7.52 Gb in size, 95.08% (7.15 Gb) 123
of which was arranged into 14 chromosomes by Hi-C analysis (Extended Data Fig. 124
1b). We annotated 43,352 protein-coding genes in the A. longiglumis genome and 125
87,154 in the A. insularis genome. BUSCO analysis also revealed that a majority 126
(97.53% and 98.11%, respectively) of conserved genes were identified in these two 127
genome assemblies. Accordingly, most of the genome sequences of the A. longiglumis 128
(87.82%) and A. insularis (87%) were composed of repetitive elements. 129
Based on the genomic synteny and similarity among the hexaploid, diploid, and 130
tetraploid genomes, we successfully divided the 21 pseudochromosomes of hexaploid 131
oat into A, C, and D subgenomes (Extended Data Fig. 3a-d). Am1 (a repeat selectively 132
hybridized to the C subgenome) and As120a (a repeat selectively hybridized to the A 133
subgenome) satellite repeats were overrepresented in the C and A subgenomes, 134
respectively (Fig. 1). The subgenome assignments were further validated by mapping 135
the molecular markers from a recently published high-density linkage map of 136
hexaploid oat (Extended Data Fig. 2a) and by mapping the whole-genome sequencing 137
reads from a range of Avena species (Extended Data Fig. 3e-f). The nomenclature 138
system for bread wheat was adapted for naming the chromosomes of SFS (Extended 139
Data Fig. 4). 140
141
Evolutionary position of oat among cereal crops 142
We next used our oat genome assemblies to assess the phylogenomic relationships 143
among common oat and other cereal crops (Supplementary Table 8) by using 644 144

conserved core genes (Fig. 2a, Supplementary Fig. 1). Molecular dating estimated that 145
the divergence of monocot cereal crops occurred ~45 million years ago (mya) and was 146
concentrated in Poaceae. Pooideae and Oryzoideae split ~40 mya, whereas 147
Panicoideae and Chloridoideae diverged ~33 mya. In Pooideae, the tribes Aveneae 148
and Lolieae were indicated to be more closely related than to Triticeae. The oat 149
lineage descended (~16 mya) earlier than that of wheat (~7 mya), indicating a longer 150
time of evolution and offering a unique window into the early evolution of polyploid 151
cereal crops. 152
A high-confidence orthologous gene set for the 43 species was obtained, 2202 gene 153
families shared by all the genomes/subgenomes were identified, and 4387, 419, 459, 154
24, 152, 450, and 40 gene families were indicated to be specific to Polygonaceae, 155
Chenopodiaceae, Chloridoideae, Panicoideae, Aveninae, and Triticinae, respectively 156
(Fig. 2b, Supplementary Table 9). Most of these Avena-specific gene families were 157
assigned to molecular binding or metabolic process functions (Supplementary Table 158
10). In addition, 10 of them may play roles in fat biosynthesis, including 479 genes 159
involved in fatty acid biosynthesis. These genes might contribute to the much higher 160
concentration of oil in oat grains relative to other cereal crops (Supplementary Table 161
10). 162
The ancestral grass karyotype (AGK) was inferred by comparing modern species 163
via a completely automated method reconstructing the order of ancestral genes within 164
contiguous ancestral regions and is structured into 7 protochromosomes containing 165
7,010 protogenes 22. We therefore used the 7 AGK protochromosomes as an ancestral 166
reference to investigate the chromosomal evolution of rice, wheat and oat (Fig. 2c). A 167
total of 731 syntenic blocks (>5 genes) encompassing 19112 orthologous gene pairs 168
were identified between oat and the 7 AGK protochromosomes (Supplementary Table 169

11). Essentially, the third homologous group of oat was derived from a single ancient 170
chromosome, AGK1, (which also steadily gave rise to the complete chromosomes of 171
rice and wheat), with the exception of a segment of AGK2 that was translocated to 172
chromosome 3C in oat. Group six was derived from the insertion of AGK5 into 173
AGK4. The remaining five of the seven oat homologous groups were each derived 174
from at least three ancestral chromosomes via complex translocations (Fig. 2c). When 175
the oat assembly was compared with the three subgenomes of common wheat, the 176
ancestral chromosomes were found to be roughly similar, but a large number of 177
chromosomal rearrangements occurred, leading to many structural variations and 178
lower collinearity. 179
180
Polyploidization history and reticulate evolution 181
Previous phylogenetic studies aimed at identifying the progenitors of these species 182
have often analysed only a limited set of molecular markers, yielding inconsistent 183
results. To more accurately identify the relatives of each subgenome donor and the 184
extant ancestral hexaploid species, we sequenced and de novo assembled 185
transcriptomes, conducted whole-genome sequencing and assembled the complete 186
plastid genomes of other Avena species. These Avena species represented different 187
genomic subtypes (As, Al, Ac, Ad, Cv, and Cp) and different ploidies. 188
We sequenced 14 different Avena species (generating 6767.64 Gb of sequence data, 189
Supplementary Table 1) and mapped the obtained data onto the reference SFS genome. 190
The genomic variants of these 14 species as well as the assembled A. longiglumis and 191
A. insularis genomes relative to the SFS sequences were called based on the mapped 192
reads. Approximately 39~129 million SNPs were identified in these species 193
(Supplementary Table 12). The ratios of SNP numbers in the A, C and D subgenomes 194
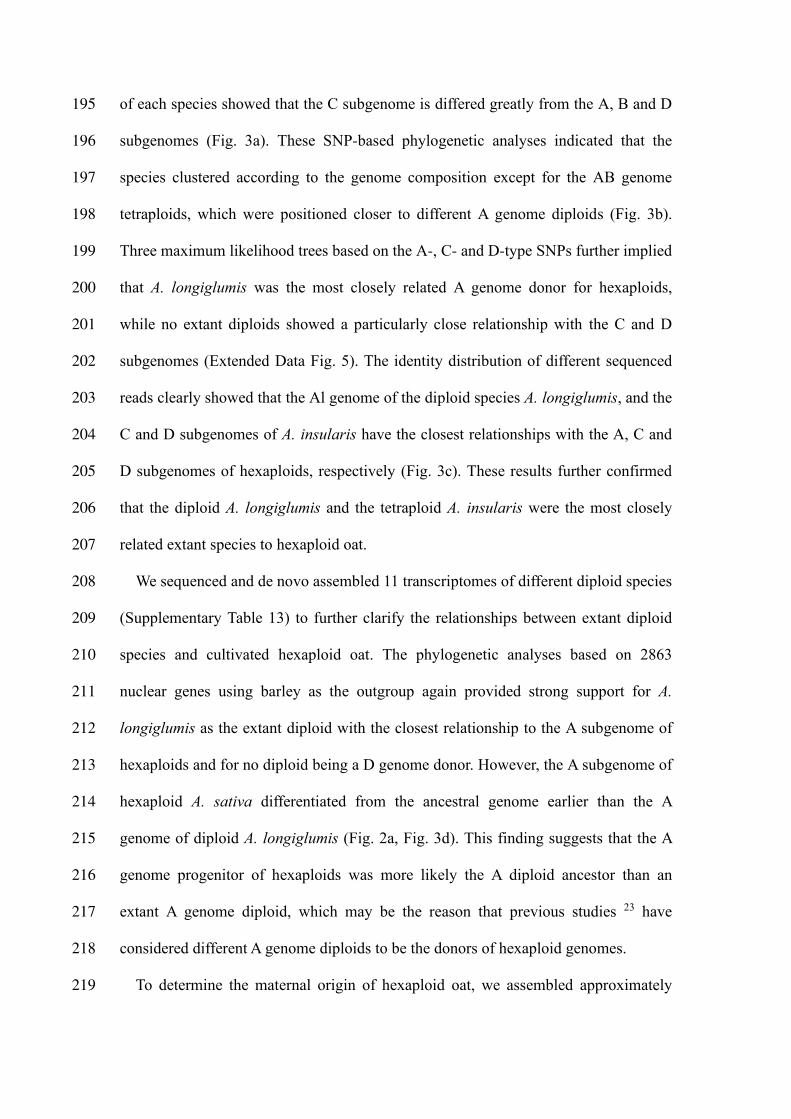
of each species showed that the C subgenome is differed greatly from the A, B and D 195
subgenomes (Fig. 3a). These SNP-based phylogenetic analyses indicated that the 196
species clustered according to the genome composition except for the AB genome 197
tetraploids, which were positioned closer to different A genome diploids (Fig. 3b). 198
Three maximum likelihood trees based on the A-, C- and D-type SNPs further implied 199
that A. longiglumis was the most closely related A genome donor for hexaploids, 200
while no extant diploids showed a particularly close relationship with the C and D 201
subgenomes (Extended Data Fig. 5). The identity distribution of different sequenced 202
reads clearly showed that the Al genome of the diploid species A. longiglumis, and the 203
C and D subgenomes of A. insularis have the closest relationships with the A, C and 204
D subgenomes of hexaploids, respectively (Fig. 3c). These results further confirmed 205
that the diploid A. longiglumis and the tetraploid A. insularis were the most closely 206
related extant species to hexaploid oat. 207
We sequenced and de novo assembled 11 transcriptomes of different diploid species 208
(Supplementary Table 13) to further clarify the relationships between extant diploid 209
species and cultivated hexaploid oat. The phylogenetic analyses based on 2863 210
nuclear genes using barley as the outgroup again provided strong support for A. 211
longiglumis as the extant diploid with the closest relationship to the A subgenome of 212
hexaploids and for no diploid being a D genome donor. However, the A subgenome of 213
hexaploid A. sativa differentiated from the ancestral genome earlier than the A 214
genome of diploid A. longiglumis (Fig. 2a, Fig. 3d). This finding suggests that the A 215
genome progenitor of hexaploids was more likely the A diploid ancestor than an 216
extant A genome diploid, which may be the reason that previous studies 23 have 217
considered different A genome diploids to be the donors of hexaploid genomes. 218
To determine the maternal origin of hexaploid oat, we assembled approximately 219

complete plastid genomes of 136 kb for each Avena species. Phylogenetic analysis of 220
18 complete Avena plastid genomes together with the previous 26 Avena chloroplast 221
genomes (Supplementary Tables 14-15) 24,25 showed that the C genome was 222
undoubtedly the male parent in polyploid formation and that the D genome, rather 223
than the A genome, was the maternal donor of hexaploid oat. The evolutionary order 224
of the different A genome subtypes was Ac-Ad-Al-As (Fig 3e, Supplementary Fig. 2). 225
The relatively low collinearity between C genome diploid species and the C 226
subgenome of Avena polyploids was consistent with the nuclear-cytoplasmic 227
interaction hypothesis suggesting that the paternally inherited genome of an 228
allopolyploid is usually more prone to genetic changes than the maternally derived 229
genome 26. 230
Our phylogenetic analyses revealed a common ancestor of A and D genome 231
diploids, indicating that the D genome ancestor is showed a closer relationship to the 232
A genome and may be extinct. The C and A/D lineages diverged from the ancestor of 233
the genus Avena ~17 mya, followed by the A genome subtypes, and the D genome 234
split from a common ancestor ~9 mya (Fig. 3d, 3f). Cultivated oat initially originated 235
from an allotetraploidy event between a paternal C genome and a maternal D genome 236
diploid (~2 mya, Supplementary Fig. 4), followed by hybridization between a paternal 237
A genome diploid progenitor (closely related to A. longiglumis) and maternal CD 238
genome tetraploid (closely related to A. insularis) to form the extant ACD genome 239
hexaploids (~0.5 mya, Supplementary Table 16, Supplementary Fig. 3). Our findings 240
clarify the evolutionary history of oats based on various lines of evidence (Fig. 3f) 241
and have broad implications for the understanding of genome function and cultivar 242
improvement in oat. 243
244

Subgenome structure, content, and response of subgenomes to polyploidization 245
Synteny analyses between the subgenomes of hexaploid oat revealed a much lower 246
level of conservation in oat (62.70% of genes organized in collinear blocks, 247
75727/120769) than in bread wheat (72.57%, 77292/106508). The A and D 248
subgenomes of oat showed a higher synteny than the C and A or D subgenomes, as 249
indicated by the numbers of collinear genes preserved between the three subgenomes 250
(Extended Data Fig. 6a). Such low levels of conservation between the C and D 251
subgenomes have also been observed in A. insularis (Extended Data Fig. 6b), 252
supporting the hypothesis that both the A and D subgenomes were derived from a 253
common diploid lineage that diverged from the C subgenome. The low levels of 254
conservation between the hexaploid subgenomes, particularly between C and A or D, 255
may reflect the preexisting differences in the subgenomes before polyploidization but 256
could also be attributed to chromosomal rearrangements after polyploidization. To 257
explore broad-scale structural evolution after polyploidization, we performed a 258
whole-genome synteny comparison, which revealed low collinearity between the 259
sequenced diploid C and tetraploid C subgenomes, especially for chromosome7C (Fig. 260
4a), suggesting that large chromosomal rearrangements might have accumulated 261
during evolution. We also found evidence of large chromosomal rearrangements 262
during hexaploidization (Fig. 4a, Extended Data Fig. 7a, b). For instance, one C to A 263
introgression and four C to D introgressions (Fig. 4c, Extended Data Fig. 7d) occurred. 264
These large translocations were confirmed by FISH assays (Fig. 4d, Extended Data 265
Fig. 7e). Moreover, the structural rearrangements in oat appeared biased among the 266
three subgenomes (Fig. 4b): most of them occurred between subgenomes A and D, 267
whereas fewer occurred between subgenomes A and C and between subgenomes D 268
and C. For instance, half of the tetraploid 6D chromosome was transferred to 269

hexaploid 6A, 7A and 2D chromosomes, resulting in a much smaller hexaploid 6D 270
chromosome. These results may support the hypothesis that the existence of two 271
well-conserved homologous genomes would facilitate inter-subgenome recombination 272
and rearrangement after polyploidization, as observed in a previous study 27. 273
The C subgenome (3.94 Gb) is 20% larger than the A (3.28 Gb) and D (3.22 Gb) 274
subgenomes in hexaploid (Table 1). TE abundance accounted for almost all of the size 275
differences between the subgenomes (Fig. 1, Extended Fig. 8a). We further found that 276
C genomes contained twice as many full-length LTRs as A and D genomes (Extended 277
Data Fig. 8b), and that the average length of LTRs was shorter in the C subgenome 278
than in the A and D subgenomes (Extended Data Fig. 8c). The amplification of 279
full-length LTRs in C genomes occurred over a relatively long period, peaking 280
approximately 1.8 mya, whereas LTRs were inserted into A and D genomes within the 281
last 1 mya (Extended Data Fig. 8d), which indicates that the C genome has a longer 282
evolutionary history than the A and D genomes. The C subgenome contained a 283
smaller number of gene loci (33181; 29%) than the A (40,085, 35%) and D (41,633, 284
36%) subgenomes in hexaploid (Table 1), whereas the tetraploid (89,995) showed 285
almost the same gene number as the A (43,477) and C (46,925) diploids together 286
(Table 1), suggesting that a remarkable gene loss occurred in the C subgenome after 287
hexaploidization (33,181 in hexaploid vs 43,243 in tetraploid). These results were 288
supported by the gene loss ratio in the subgenomes of A. insularis and SFS (Extended 289
Data Fig. 9a, b). We further found that more gene families underwent decreases in 290
hexaploid C subgenomes than in A and D subgenomes (Extended Data Fig. 9c), and 291
that gene losses mainly affected genes with expanded families, rather than singleton 292
genes (Extended Data Fig. 9d, e). Accordingly, the hexaploid C subgenome contained 293
more pseudogenes (29297) than the A (26141) and D (27262) subgenomes (Table 1, 294

Extended Data Fig. 9f). Together, these results suggest preferential gene loss or 295
pseudogenization in the C subgenome after hexaploidization. 296
Subgenome dominance is a striking whole-genome feature common to polyploids, 297
presumably associated with biased fractionation 28. Genes located in the dominant 298
subgenome always present a lower nonsynonymous ratio and higher expression levels 299
than orthologues in other subgenomes29,30. To test whether subgenome dominance has 300
occurred in hexaploid oat, we first compared nonsynonymous (Ka) with synonymous 301
(Ks) substitution rates between (sub)genomes using 2,767 one-to-one orthologous 302
gene sets among the polyploid oat and the progenitors, and the results suggested that 303
an accelerated evolution rate exists in polyploids relative to their diploid progenitors 304
(Supplementary Fig. 5). In SFS, the C subgenome presented a significantly higher 305
Ka/Ks value (0.37) than the A (0.17) and D (0.25) subgenomes (Fig. 4e), suggesting 306
that the C subgenome is subject to more relaxed selective constraints than the other 307
two subgenomes. We further examined the expression of 13,774 single-copy genes in 308
the three subgenomes, referred to as triads, in diverse organs and under six different 309
abiotic stresses. We found that most genes were expressed in a subgenome-specific 310
manner (Fig. 4f). Pairwise comparisons of the homologous gene triads revealed that a 311
similar number of gene pairs were preferentially transcribed in the A and D 312
subgenomes; however, the C subgenome had a significantly lower number of 313
preferentially transcribed gene pairs than the A (P=1.3E-3) and D (P=6.1E-3) 314
subgenomes (Fig. 4g, Supplementary Tables 17, 18). TE abundance plays an 315
important role in gene expression bias because TE insertion can have deleterious 316
effects on genes leading to lower expression 31. In oat, we found that the C 317
subgenome contained more TEs and showed higher overall TE densities near genes 318
than the A and D subgenomes; these characteristics are negatively correlated with 319

gene expression (Extended Data Fig. 10), supporting the hypothesis that subgenome 320
expression dominance is influenced by TE-density differences between subgenomes 321
as observed in other allopolyploids 7,32. All of these results revealed a biased gene 322
fractionation in the hexaploid C subgenome, which might be closely related to the 323
high global TE amount and TE density near genes, and the relaxation of selection 324
pressure of the C subgenome. 325
In conclusion, the three reference-quality genomes presented here constitute 326
important community resources for cereal genomics and provide new insights into the 327
evolutionary position of oat among cereal crops. This is the most comprehensive 328
molecular phylogenetic analysis of the genus Avena conducted to date, because it 329
included samples representing all extant Avena genomes and the greatest number (and 330
number of different types) of molecular markers evaluated thus far. The model for the 331
chronological formation of polyploid oat has been clarified, and the investigation of 332
oat subgenomes evolution during polyploidization events offers a unique window into 333
the early evolution of polyploid crops, which will accelerate improvements of oat and 334
help to make oat a useful model for studying polyploid genome evolution. 335
336
1 FAOSTATS. Food and agriculture organization of the united nations--statistics 337
division. http://www.fao.org (2021). 338
2 Fu, J. et al. Concise review: Coarse cereals exert multiple beneficial effects on 339
human health. Food chem 325, 126761, doi:10.1016/j.foodchem.2020.126761 340
(2020). 341
3 Fraser, J. & McCartney, D. Fodder oats in North America. in Fodder oats: A 342
World Overview (eds Suttie, J. M & Reynolds, S. G.) 19-35 (FAO, 2004). 343
4 Comai, L. The advantages and disadvantages of being polyploid. Nat Rev 344

Genet 6, 836-846, doi:10.1038/nrg1711 (2005). 345
5 Fang, Z. & Morrell, P. L. Domestication: Polyploidy boosts domestication. 346
Nat Plants 2, 16116, doi:10.1038/nplants.2016.116 (2016). 347
6 Van de Peer, Y., Mizrachi, E. & Marchal, K. The evolutionary significance of 348
polyploidy. Nat Rev Genet 18, 411-424, doi:10.1038/nrg.2017.26 (2017). 349
7 Edger, P. P. et al. Origin and evolution of the octoploid strawberry genome. 350
Nat Genet 51, 541-547, doi:10.1038/s41588-019-0356-4 (2019). 351
8 Yu, H. et al. A route to de novo domestication of wild allotetraploid rice. Cell 352
184, 1156-1170. e14, doi:10.1016/j.cell.2021.01.013 (2021). 353
9 Appels, R. et al. Shifting the limits in wheat research and breeding using a 354
fully annotated reference genome. Science 361, eaar7191, 355
doi:10.1126/science.aar7191 (2018). 356
10 Yan, H. et al. Genome size variation in the genus Avena. Genome 59, 357
209-220, doi:10.1139/gen-2015-0132 (2016). 358
11 Jellen, E., Gill, B. & TS, C. Genomic in situ hybridization differentiates 359
between A/D- and C-genome chromatin and detects intergenomic 360
translocations in polyploid oat species (genus Avena). Genome 37, 613-618, 361
doi:10.1139/g94-087 (1994). 362
12 Lang, D. et al. Comparison of the two up-to-date sequencing technologies for 363
genome assembly: HiFi reads of Pacific Biosciences Sequel II system and 364
ultralong reads of Oxford Nanopore. GigaScience 9, 365
doi:10.1093/gigascience/giaa123 (2020). 366
13 Miga, K. H. et al. Telomere-to-telomere assembly of a complete human X 367
chromosome. Nature 585, 79-84, doi:10.1038/s41586-020-2547-7 (2020). 368
14 Logsdon, G. A. et al. The structure, function and evolution of a complete 369

human chromosome 8. Nature 593, 101-107, 370
doi:10.1038/s41586-021-03420-7 (2021). 371
15 Jain, M. et al. Nanopore sequencing and assembly of a human genome with 372
ultra-long reads. Nat Biotechnol 36, 338-345, doi:10.1038/nbt.4060 (2018). 373
16 Sasaki, T. & International Rice Genome Sequencing, P. The map-based 374
sequence of the rice genome. Nature 436, 793-800, doi:10.1038/nature03895 375
(2005). 376
17 Lovell, J. T. et al. Genomic mechanisms of climate adaptation in polyploid 377
bioenergy switchgrass. Nature 590, 438-444, 378
doi:10.1038/s41586-020-03127-1 (2021). 379
18 Huang, G. et al. Genome sequence of Gossypium herbaceum and genome 380
updates of Gossypium arboreum and Gossypium hirsutum provide insights 381
into cotton A-genome evolution. Nat Genet 52, 516-524, 382
doi:10.1038/s41588-020-0607-4 (2020). 383
19 Mascher, M. et al. A chromosome conformation capture ordered sequence of 384
the barley genome. Nature 544, 427-433, doi: 10.1038/nature22043 (2017). 385
20 Yan, H. et al. High-density marker profiling confirms ancestral genomes of 386
Avena species and identifies D-genome chromosomes of hexaploid oat. Theor 387
Appl Genet 129, 2133-2149, doi:10.1007/s00122-016-2762-7 (2016). 388
21 Maughan, P. J. et al. Genomic insights from the first chromosome-scale 389
assemblies of oat (Avena spp.) diploid species. BMC Biol 17, 92, 390
doi:10.1186/s12915-019-0712-y (2019). 391
22 Murat, F., Armero, A., Pont, C., Klopp, C. & Salse, J. Reconstructing the 392
genome of the most recent common ancestor of flowering plants. Nat Genet 393
49, 490-496, doi:10.1038/ng.3813 (2017). 394

23 Peng, Y. et al. Phylogenetic inferences in Avena based on analysis of FL 395
intron2 sequences. Theor Appl Genet 121, 985-1000, 396
doi:10.1007/s00122-010-1367-9 (2010). 397
24 Fu, Y. B. Oat evolution revealed in the maternal lineages of 25 Avena species. 398
Sci Rep 8, 4252, doi:10.1038/s41598-018-22478-4 (2018). 399
25 Liu, Q. et al. Comparative chloroplast genome analyses of Avena: insights into 400
evolutionary dynamics and phylogeny. BMC Plant Biol 20, 406, 401
doi:10.1186/s12870-020-02621-y (2020). 402
26 Gill, B. S. & Friebe, B. Nucleocytoplasmic interaction hypothesis of genome 403
evolution and speciation in polyploid plants revisited: polyploid 404
species-specific chromosomal polymorphisms in wheat. in Polyploid and 405
Hybrid Genomics (eds Chen, Z. J & Birchler, J. A) 213-221, 406
doi:10.1002/9781118552872.ch13 (Wiley, 2013). 407
27 Zhuang, W. et al. The genome of cultivated peanut provides insight into 408
legume karyotypes, polyploid evolution and crop domestication. Nat Genet 51, 409
865-876, doi:10.1038/s41588-019-0402-2 (2019). 410
28 Alger, E. I. & Edger, P. P. One subgenome to rule them all: underlying 411
mechanisms of subgenome dominance. Curr Opin Plant Biol 54, 108-113, 412
doi:10.1016/j.pbi.2020.03.004 (2020). 413
29 Parkin, I. A. P. et al. Transcriptome and methylome profiling reveals relics of 414
genome dominance in the mesopolyploid Brassica oleracea. Genome Biol 15, 415
R77, doi:10.1186/gb-2014-15-6-r77 (2014). 416
30 Liu, S. et al. The Brassica oleracea genome reveals the asymmetrical 417
evolution of polyploid genomes. Nat Commun 5, 3930, 418
doi:10.1038/ncomms4930 (2014). 419

31 Hollister, J. D. & Gaut, B. S. Epigenetic silencing of transposable elements: a 420
trade-off between reduced transposition and deleterious effects on neighboring 421
gene expression. Genome Res 19, 1419-1428, doi:10.1101/gr.091678.109 422
(2009). 423
32 VanBuren, R. et al. Exceptional subgenome stability and functional divergence 424
in the allotetraploid Ethiopian cereal teff. Nat Commun 11, 884, 425
doi:10.1038/s41467-020-14724-z (2020). 426
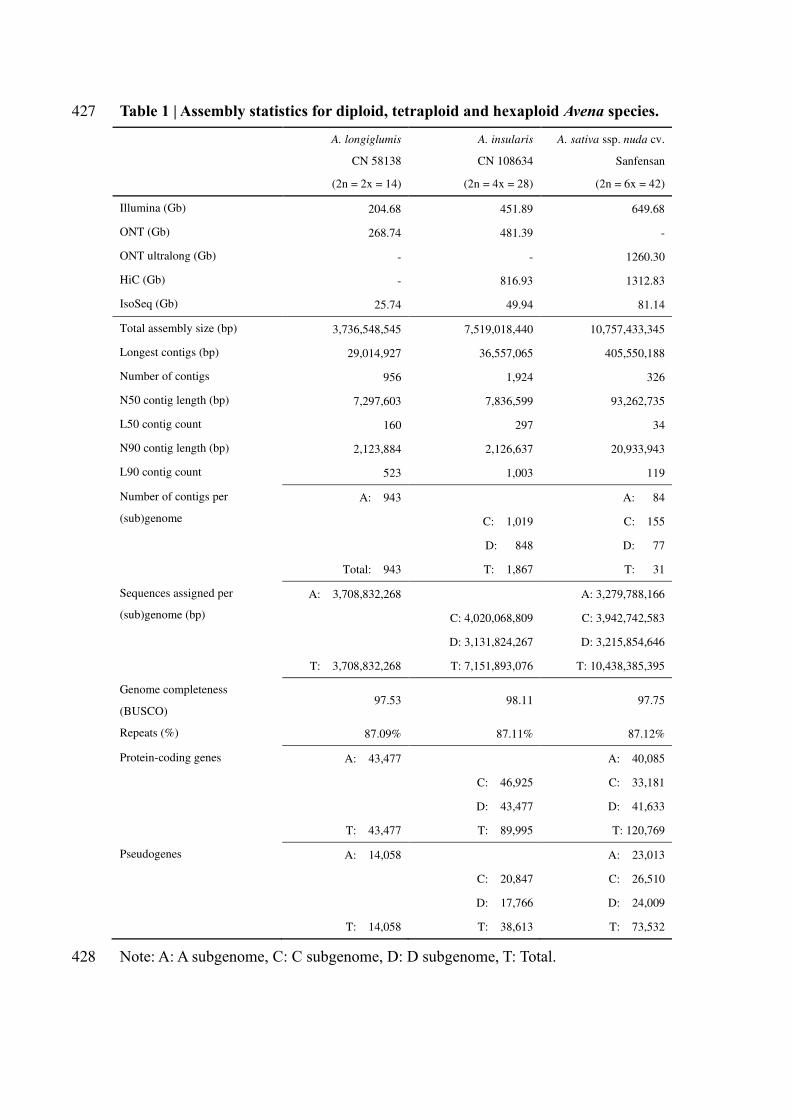
Table 1 | Assembly statistics for diploid, tetraploid and hexaploid Avena species. 427
A. longiglumis
CN 58138
A. insularis
CN 108634
A. sativa ssp. nuda cv.
Sanfensan
(2n = 2x = 14) (2n = 4x = 28) (2n = 6x = 42)
Illumina (Gb) 204.68 451.89 649.68
ONT (Gb) 268.74 481.39 -
ONT ultralong (Gb) - - 1260.30
HiC (Gb) - 816.93 1312.83
IsoSeq (Gb) 25.74 49.94 81.14
Total assembly size (bp) 3,736,548,545 7,519,018,440 10,757,433,345
Longest contigs (bp) 29,014,927 36,557,065 405,550,188
Number of contigs 956 1,924 326
N50 contig length (bp) 7,297,603 7,836,599 93,262,735
L50 contig count 160 297 34
N90 contig length (bp) 2,123,884 2,126,637 20,933,943
L90 contig count 523 1,003 119
Number of contigs per
(sub)genome
A: 943 A: 84
C: 1,019 C: 155
D: 848 D: 77
Total: 943 T: 1,867 T: 31
Sequences assigned per
(sub)genome (bp)
A: 3,708,832,268 A: 3,279,788,166
C: 4,020,068,809 C: 3,942,742,583
D: 3,131,824,267 D: 3,215,854,646
T: 3,708,832,268 T: 7,151,893,076 T: 10,438,385,395
Genome completeness
(BUSCO) 97.53 98.11 97.75
Repeats (%) 87.09% 87.11% 87.12%
Protein-coding genes A: 43,477 A: 40,085
C: 46,925 C: 33,181
D: 43,477 D: 41,633
T: 43,477 T: 89,995 T: 120,769
Pseudogenes A: 14,058 A: 23,013
C: 20,847 C: 26,510
D: 17,766 D: 24,009
T: 14,058 T: 38,613 T: 73,532
Note: A: A subgenome, C: C subgenome, D: D subgenome, T: Total. 428

429
Fig. 1 | Genomic features of oat. Circos display of important features of the 430
assembled diploid, tetraploid and hexaploid Avena species genomes. a, Chromosome 431
names and sizes. b, Gene density. c, Long terminal repeat (LTR) retrotransposon 432
density. d, Tandem repeat (TR) density. e, k-mer frequencies. f, The A 433
genome-specific repeat As120a. g, The C genome-specific repeat Am1. Links 434
between syntenic genes are shown in different colours. 435

436
Fig. 2 | Phylogenomic relationships of cereal crops. a, Phylogeny and time scale of 437
43 plant species, including 33 assembled cereal crops and panicles of the 20 sampled 438
cereal crops. The number in the upper left corner of each panicle image corresponds 439
to the number following the species name in the phylogenetic tree. b, Numbers of 440
gene families shared among and unique to Polygonaceae, Chenopodiaceae, 441
Chloridoideae, Panicoideae, Aveninae and Triticinae. c, Avena chromosome evolution 442
according to the AGK model and chromosomal synteny between the three 443
subgenomes of oat and related cereal crops. The genomes used for collinearity 444
analysis are marked with an abbreviation of the full name in the phylogenetic tree. 445

446
Fig. 3 | Phylogeny and polyploidization of Avena species. a, Comparable numbers 447
of A-, C- and D-type SNPs for each taxon. b, Maximum likelihood tree generated 448
from the SNPs. c, Identity distribution of different sequenced reads on different 449
subgenomes of hexaploids. d, Phylogenetic analyses based on 2,863 nuclear genes 450
using barley as an outgroup. e, Phylogenetic studies of complete plastid Avena 451
genomes. f, Model of the phylogenetic history of oat (Avena sativa; AACCDD) 452

453
Fig. 4 | Genomic structures of hexaploid oat and its relatives. a, Different colours 454
of lines depict synteny between subgenomes of SFS and putative tetraploid and 455
diploid ancestors. Thick lines connecting chromosomes 7C and 6D depict observed 456
large-scale chromosome rearrangements. b, Length of individual subgenome DNA 457
sequences inherited from ancestral genomes. Subscript letter represents subgenomes 458
of hexaploid (H) or tetraploid (T). c, Reads of the C genome diploid mapped to the 459
SFS reference reveal at least four large C to D genomic exchanges and one C to A 460
genomic exchange after polyploidization. d, FISH using the C genome-specific repeat 461
as a probe confirms the C to D and C to A translocations. Red and green represent 462
FISH signals detected with an A-specific repeat (As120a) or a C-specific repeat (Am1) 463
as probes. White arrows indicate C to D or C to A subgenome translocations. e, 464

Comparison of Ka/Ks value distributions between three subgenomes of SFS. The 465
central line for each box plot indicates the median. The top and bottom edges of the 466
box indicate the 25th and 75th percentiles, and the whiskers extend 1.5 times the 467
interquartile range beyond the edges of the box. The asterisks represent significant 468
differences (* Wilcoxon rank-sum test, P<0.05). f, Two-dimensional hierarchical 469
cluster analysis of expression among single-copy homologous oat genes compared 470
with organ-specific gene expression. g, Analysis of log2-fold changes in pairwise 471
gene expression between homologous genes. 472
473

Methods 474
Plant materials 475
The hexaploid species SFS (2n=6x=42, AACCDD), the diploid species A. longiglumis 476
(accession CN 58139, 2n=2x=14, AlAl) and the tetraploid species A. insularis 477
(accession CN 108634, 2n=4x=28, CCDD) were selected for genome sequencing and 478
assembly. SFS is a traditional hulless oat landrace that has a long cultivation history in 479
Shanxi, China, which is thought to be the region of origin of hulless oat varieties. It 480
has also been widely used as a parental line in hulless oat breeding programs, while A. 481
insularis and A. longiglumis have been considered the most likely tetraploid and 482
diploid ancestors of hexaploid oat 20. 483
Genome sequencing and assembly 484
Illumina HiSeq X-Ten or MGISEQ2000 platform was used to generate short 485
paired-end reads for SFS, A. insularis and A. longiglumis. For Illumina sequencing, 486
paired-end libraries were constructed by using the TruSeq Nano DNA HT Sample 487
preparation kit (Illumina, USA) according to the manufacturer’s instructions. For 488
MGI sequencing, method described in Supplementary Note was used for paired-end 489
libraries construction. A total of 649.7 Gb, 451.9 Gb and 204.7 Gb of raw reads were 490
generated for SFS, A. insularis and A. longiglumis, respectively (Supplementary Table 491
1). Oxford Nanopore Technology (ONT) platforms were used to generate long reads 492
for these three taxa. Considering the large and complex genome of hexaploid oat, the 493
ONT ultralong reads were generated for the SFS, whereas regular ONT long reads 494
were generated for the genomes of A. longiglumis and A. insularis. For ONT ultralong 495
reads library construction, high-molecular-weight genomic DNA molecules were 496
extracted from young leaves using the SDS method without the purification step to 497
maintain the length of the DNA. Then, 8-10 µg of high-quality DNA was 498
size-selected (>50 kb) and processed using the Ligation Sequencing 1D kit 499
(SQK-LSK109, Oxford Nanopore Technologies, UK) according to the manufacturer’s 500
instructions. For regular Nanopore library construction, 3-4 µg of 501
high-molecular-weight DNA was size selected (>20 kb) and ligated using the 502
SQK-LSK109 kit with the recommended protocol. All the prepared libraries were 503
sequenced on the PromethION platform at the Genome Center of Grandomics 504
(Wuhan, China). A total of 1260.3 Gb, 481.4 Gb and 268.7 Gb of raw ONT 505
(ultra-)long reads for SFS, A. insularis and A. longiglumis were produced from 71, 7 506
and 8 libraries, covering approximately 100-, 60- and 60- fold of their genomes, 507
respectively (Supplementary Table 2). 508
The raw ONT long reads were subjected to self-correction using the NextCorrect 509
module implemented in NextDenovo (https://github.com/Nextomics/NextDenovo) 510
(v2.0-beta.1). The corrected reads were then assembled into contigs by using 511
NextDenovo (Supplementary Table 3). To improve the accuracy of the assembled 512
contigs, a two-step polishing strategy was applied: the corrected Nanopore reads were 513
first used for initial polishing with Racon 33 (three rounds), and the highly accurate 514
short reads were then used to further correct the assemblies with NextPolish (four 515
rounds). 516
We employed Hi-C technology to obtain chromosome-level genome assemblies of 517
SFS and A. insularis. Hi-C libraries were created from tender leaves of SFS and A. 518
insularis. In brief, tender leaves were fixed with formaldehyde, and the cross-linked 519
DNA was then isolated, purified, and digested with DpnII. Sticky ends were filled and 520
marked with biotin-14-dATP; the resulting blunt-end fragments were ligated to form 521
chimaeric junctions, physically sheared, and enriched for fragments with a size of 522
300-600 bp. Chimaeric fragments representing the original cross-linked long distance 523
physical interactions were then processed to obtain paired-end sequencing libraries, 524
which were sequenced on the Illumina platform. A total of 1312.8 Gb and 816.9 Gb of 525
raw Hi-C data were generated for SFS and A. insularis. The polished contigs of SFS 526
and A. insularis were further clustered, ordered, anchored to pseudochromosomes 527
using Hi-C data with the LACHESIS program 34, whereas RaGOO 35 with the default 528
parameters was employed to anchor the contigs of A. longiglumis to seven 529
pseudochromosomes with the previously published As genome of diploid A. atlantica 530
as the reference. Marker sequences from the oat consensus genetic linkage map that 531
was derived from ten populations 36 were aligned to the final SFS assemblies to 532
evaluate the consistency between the Hi-C map and the genetic map (Extended Data 533
Fig. 2). The completeness of the assembled genomes was evaluated with the BUSCO 534
(v3.1.0) 37 pipeline. 535
Subgenome assignment 536
A reference-guided strategy based on subgenome homology was used to distinguish 537
the subgenomes of A. insularis and SFS. The A. longiglumis reference genome was 538
split into 100 bp markers and mapped onto the hexaploid genome assemblies. Unique 539
mapped markers were retained (Extended Data Fig. 3a). A syntenic block was defined 540
based on the presence of at least five synteny markers. The chromosomes with the 541
highest homology to A. longiglumis were assigned to the A subgenomes, and the 542
chromosomes with the second-highest homology were assigned to the D subgenomes 543
because of the high homology between the Avena A and D genomes according to 544
previous studies; the remaining chromosomes with the lowest homology were 545
accordingly assigned to the C subgenomes (Extended Data Fig. 3c). The 546
chromosomes of A. insularis were aligned with those of SFS and assigned to C and D 547
subgenomes (Extended Data Fig. 3b, d). The subgenome assignments were further 548

validated by two independent approaches. First, trimmed short reads from A. 549
longiglumis and A. insularis were mapped to the reference SFS genome, and the depth 550
coverage of paired reads from these two species was quantified (Extended Data Fig. 551
3e-f). Second, the abundance and distribution of two types of DNA repeats, As120a 552
and Am1, in the A. insularis reference and SFS genomes were investigated; these 553
repeat types have been reported to be overrepresented in the Avena A and C genomes, 554
respectively (Fig. 1). 555
Repeat and protein-coding gene annotation 556
Each of the whole-genomes was searched for repetitive sequences including tandem 557
repeats (TRs) and transposable elements (TEs). TRs were identified by using GMATA 558
38 and Tandem Repeats Finder 39. A species-specific de novo repeat library was 559
constructed using MITE-Hunter 40, LTR_FINDER 41 and RepeatModeler 560
(https://github.com/Dfam-consortium/RepeatModeler). Then RepeatMasker 42 was 561
adapted to search for TEs in the reference genome against Repbase 43 and the 562
species-specific de novo repeat library. 563
Protein coding genes were predicted using an evidence-based annotation workflow 564
by integrating evidence from transcriptomic data, homologue searches and ab initio 565
prediction. Transcriptomic data were generated by performing PacBio Iso-seq using 566
total RNA isolated from mixed organs. Raw reads were processed with IsoSeq3, 567
LIMA, and REFINE to identify full-length, nonchimeric circular consensus sequences 568
(CCSs). The resulting high-quality CCSs were mapped onto the reference genome for 569
de-redundancy. The nonredundant isoforms were then used to determine the locations 570
of potential intron-exon boundaries using GeneMarkST 44. Protein sequences from A. 571
atlantica, A. eriantha, Brachypodium distachyon, Hordeum vulgare, Oryza sativa, and 572
Triticum aestivum were used as protein evidence. Ab initio gene prediction was 573

performed using GeneMark-ET 45 and AUGUSTUS 46 with two rounds of iterative 574
training. All gene predictions were integrated using the recommended settings of 575
EVidenceModeler (EVM) 47 after removing transposable element-related genes, 576
pseudogenes and noncoding genes using TransposonPSI 48 with the default settings. 577
Noncoding RNAs (ncRNAs), including microRNAs, small nuclear RNAs, rRNAs 578
and regulatory elements, were identified using the Infernal 49 program to search 579
against the Rfam database 50. The rRNAs, tRNAs and miRNAs were identified using 580
RNAmmer 51, tRNAscan-SE 52, and miRanda v3.0, respectively. Functional 581
assignments of the predicted protein-coding genes were obtained with BLAST by 582
aligning the coding regions to sequences in public protein databases, including the 583
NCBI nonredundant (NR) protein, Kyoto Encyclopedia of Genes and Genomes 584
(KEGG), Eukaryotic Orthologous Groups of proteins (KOG), Gene Ontology (GO) 585
and SwissProt databases. The putative domains and GO terms of the predicted genes 586
were identified using the InterProScan 53 program with the default settings. 587
Phylogenomic analyses of cereal crops 588
Foughty-three plant species that containing the main cereal crops with high-quality 589
reference genomes were downloaded to infer the phylogenetic relationships of cereal 590
crops. For this purpose, single-copy gene families were identified using reciprocal 591
best hit (RBH)-based methods. In brief, each proteome of 42 species (51 subgenomes, 592
Supplementary Table 8) was subjected to BLAST searches against Amborella 593
trichopoda sequences according to an E-value ≤ 1e-5. The RBHs in each pair were 594
obtained and the gene families present in all the subgenomes were retained. 595
Conserved CDS alignments were extracted by using Gblocks 54 and were 596
concatenated to generate a supermatrix. 4DTV sites were extracted from this 597
supermatrix and subject to analysis with RAxML (v.8.2.0) 55 to generate the 598

maximum likelihood tree with the GTR+I+Γ model. Divergence times were estimated 599
using the MCMCTree program in the PAML4.7 package 56. 600
To explore the evolution of gene families in these cereal crops, orthologous groups 601
were constructed with OrthoFinder2 (v2.2.7) 57 using default settings based on the 602
all-vs-all BLASTP results of the 52 subgenomes. The genes that were exclusively 603
found in each subfamily (>60% species presented) were identified. Significantly 604
overrepresented GO terms in each group were identified using the R package 605
“topGO”. 606
To investigate the chromosomal evolution of the Avena genomes, representative 607
species from five subfamilies in Poaceae with chromosome-level genome assemblies 608
were selected. The synteny between these extant genomes and the reconstructed 609
AGKs 22 was identified using MCScanX 58 with the default settings, and the identified 610
syntenic blocks were then used to deduce the homologous relationship between AGK 611
marker genes and the protein sequences of Avena and the related cereal crop species. 612
The collinearity between species was identified and plotted using MCScanX (python 613
version). 614
The evolution and allopolyploidization history of oat 615
For whole-genome sequencing, 14 other Avena accessions were chosen, including six 616
A genome diploids: A. canariensis (CN 23017, Ac), A. damascena (CN 19457, Ad), A. 617
longiglumis (CN58138, Al), A. strigosa (CN 88610, As), A. wiestii (CN 90217, As) 618
and A. nuda (CN 58062, As); two C genome diploids: A. clauda (CN 21388, Cp) and 619
A. ventricosa (CN 21405, Cv); two AB genome tetraploids: A. barbata (CN 65538) 620
and A. agadiriana (CN 25869); three CD genome tetraploids: A. insularis (INS-4), A. 621
maroccana (CN 57945), A. murphyi (CN 21989); and one ACD genome hexaploid: 622
A. sativa (Ogle). These accessions represent all genome types found among extant 623
Avena species. All sequencing was performed with an Illumina HiSeq X-Ten 624
instrument, using 400 bp paired-end libraries. 625
Raw reads of the 14 newly sequenced as well as A. longiglumis and A. insularis 626
were trimmed using Trimmomatic v 0.40 59 and mapped onto the reference SFS 627
genome using BWA 60. The genomic variants were called based on the mapped short 628
paired-end reads using the call function of BCFtools 61, and the obtained variants were 629
further filtered. The qualified SNPs were used as the RAxML input for constructing 630
the phylogenetic relationships using maximum likelihood and 100 bootstrap replicates. 631
The identity between SFS and each sequenced accession was calculated by mapping 632
~1X clean reads of each accession to the reference SFS genome. 633
All sequenced diploid accessions were further subjected to transcriptome 634
sequencing. For this purpose, RNA was isolated from each accession independently 635
from a combination of sample from seven tissues/conditions, including seedlings (two 636
weeks old), flag leaves at the booting (Zodoks 45) and heading (Zodoks 58) stages, 637
panicles at the booting (Zodoks 45), heading (Zodoks 50, 58) and grain dough 638
(Zodoks 83) stages. Then, the seven types of RNA samples were mixed in equal 639
amounts and sequenced in paired-end, 150-bp reads on an MGI system. The raw reads 640
were cleaned with Trimmomatic. De novo assembly was performed using Trinity with 641
the default settings. Coding sequences (CDSs) were predicted using TransDecoder 62. 642
Each proteome from these diploid species and five Avena reference genomes was 643
subjected to BLAST searches against Hordeum vulgare according to an E-value ≤ 644
1e-5. The RBHs in each pair were obtained and the gene families present in all the 645
evaluated species were retained. Phylogenetic tree inference and divergence time 646
estimation were conducted using the same methods described above. 647
The chloroplast genomes of all sequenced taxa were assembled using the clean 648
short reads with NOVOPlasty 63. Another 26 Avena chloroplast genomes previously 649
published by Fu et al. 24 and Liu et al. 25 were also downloaded (Supplementary Table 650
15). Multiple sequence alignments were performed using MUSCLE 64, and the 651
identified informative sites were used for phylogenetic tree construction using 652
RAxML with 100 bootstrap replicates under the GTR+I+Γ evolutionary model, where 653
the chloroplast genome sequence from Triticum aestivum was used as the outgroup. 654
Divergence times were estimated according to independent rates and JC69 models 655
using the MCMCTree program in the PAML4.7 package. 656
Synteny and comparative genomics 657
The subgenome synteny between SFS and A. insularis was analysed by plotting the 658
positions of homologous pairs in the subgenome pairs within the context of 21 and 14 659
chromosomes using the Circos 65 software (Extended Data Fig. 6a, b). The 660
chromosome painting of SFS chromosomes with A. insularis and A. longiglumis, as 661
well those of A. insularis chromosomes with A. longiglumis and A. eriantha were 662
performed by aligning genomic chunks (100 bp markers) to their potential ancestors 663
using BWA with the default settings. The uniquely mapped markers were retained. We 664
then processed the markers on each chromosome by requiring at least five consecutive 665
markers supporting homology to the same chromosome. We consolidated each group 666
of five consecutive potential markers as one confirmed block. These confirmed blocks 667
with less than 2 Mb were further consolidated as superblocks. The total lengths of the 668
subgenomes of A. insularis and SFS inherited from the ancestral genomes were 669
calculated by summing the lengths of superblocks. 670
The interchromosomal exchanges between A. insularis and SFS after 671
polyploidization was also analysed by individually mapping reads from A. 672
longiglumis and A. eriantha to the A. insularis reference genome and reads from A. 673

longiglumis, A. eriantha and A. insularis to the SFS reference genome. The 674
single-base depth coverage of the properly paired reads obtained from the A. 675
longiglumis, A. eriantha and A. insularis mapping was calculated using the Mosdepth 676
program. The median depth within a sliding window (window size: 1 Mb, step size: 677
0.5 Mb) was calculated and plotted along with the chromosomes of the reference 678
genome (Fig. 4c, Extended Data Fig. 7a-d). 679
FISH analysis 680
Major interchromosomal exchanges between the C and D subgenomes of A. insularis 681
and SFS were detected by using FISH technology with the C genome-specific repeat 682
Am1 as the probe. Metaphase chromosome preparation 66 and FISH analysis 67 were 683
performed as previously described (Fig. 4d, Extended Data Fig. 7e). 684
Ka/Ks analysis 685
One-to-one orthologous gene sets among the genome assemblies for Hordeum vulgare, 686
the A and C diploid progenitors, A. longiglumis and A. eriantha, and the subgenomes 687
of A. insularis and SFS were identified using OrthoFinder2 57. A total of 2,767 688
orthologous gene sets were obtained and then used for nonsynonymous (Ka) and 689
synonymous (Ks) rate calculations. For this purpose, the homoeologous gene pair list 690
was used as input and the protein sequences from each gene pair were aligned using 691
MUSCLE 64. PAL2NAL 68 was used to convert the peptide alignment to a nucleotide 692
alignment and Ka and Ks values were computed between gene pairs by using Codeml 693
from PAML4.7 in free-ration mode. All estimates with Ks<0.01 were excluded from 694
the analysis. The significance of the differences in Ka/Ks values between genomes 695
(subgenomes) was estimated using the Wilcoxon rank-sum test for nonnormal 696
distributions in R. 697
Full-length long terminal repeat (LTR) retrotransposon analysis 698
Full-length LTRs were identified using LTR_FINDER and classified using 699
hierarchical methods (Supplementary Note) (Extended Data Fig. 8b). To estimate the 700
insertion times of full-length LTRs, the 5’- and 3’-LTR sequences of the full-length 701
LTRs were aligned and used to calculate divergence using distmat 69. The insertion 702
times were estimated with the formula T=K/2r, where r represents the neutral 703
mutation rate, which is 1.3 × 10⁻⁸ mutations per site per year 70 (Extended Data Fig. 704
8d). 705
Gene family size comparisons between the SFS subgenomes and the A and C 706
diploid genomes 707
To evaluate the relationships between gene family sizes in the hexaploid subgenomes 708
and the diploid genomes of A. longiglumis and A. eriantha, gene family were 709
identified through OrthoFinder2 57. The gene family sizes were compared between 710
each diploid genome and each of the SFS subgenomes. The scatter dots and 711
regression lines were plotted (Extended Data Figure 9a, b). 712
Gene loss and retention 713
Orthologues between A. eriantha and the C subgenome of A. insularis were identified 714
using RBH-based methods. A sliding window approach with a window size of 100 715
genes and a step size of 10 genes by using the A. eriantha genome as the reference 716
was employed to calculate the percentage of retained genes in the C and D 717
subgenomes individually and in A. insularis (Extended Data Fig. 9e). The gene 718
retention rates of the subgenomes of SFS were also estimated and plotted using the 719
same methods (Extended Data Fig. 9f). 720
Gene expression analysis 721
For gene expression analyses, RNA from SFS samples from seven tissues/conditions 722

(described above) of SFS was individually isolated and sequenced with three 723
biological replicates using an MGISEQ2000 sequencer. In addition, two-week-old 724
seedlings of SFS were exposed to six different abiotic stresses: heat, cold, drought, 725
waterlogging, alkaline and salt. RNA was isolated from seedlings after stress 726
treatment for one week and sequenced with three biological replicates. 727
Gene expression levels in each sample were quantified using the HiSAT2-HTSeq 728
pipeline. Differentially expressed genes (DEGs) between stress and control conditions 729
were detected with the edgeR software package 71 (FDR < 0.05 and |log2-fold change 730
(FC)| > 0.5). To analyse differences in the expression patterns of homoeologous genes, 731
we undertook an initial analysis of expression variation among strict single-copy 732
homoelogous triplets. To this end, we used MCScanX 58 to detect syntenic blocks, and 733
13,744 orthologous triads with a single gene copy per subgenome were identified. 734
Triplet expression vectors were created by concatenating the observed gene 735
expression values for the A, C, and D homoeologs. Triplets that expressed at least one 736
homolog across the sampled tissues were summarized in a triplet expression matrix. 737
The expression values of the triplet expression matrix were log10 transformed 738
(log10(TPM+1)), and the matrix was subjected to two-dimensional hierarchical 739
clustering using “hclust” implemented in R with the “average” correlation distance 740
and clustering. Heatmap visualization was performed using the heatmap.2 command 741
from the R package gplots. 742
33 Vaser, R., Sovic, I., Nagarajan, N. & Sikic, M. Fast and accurate de novo 743
genome assembly from long uncorrected reads. Genome Res 27, 737-746, 744
doi:10.1101/gr.214270.116 (2017). 745
34 Burton, J. N. et al. Chromosome-scale scaffolding of de novo genome 746
assemblies based on chromatin interactions. Nat Biotechnol 31, 1119-1125, 747

doi:10.1038/nbt.2727 (2013). 748
35 Alonge, M. et al. RaGOO: fast and accurate reference-guided scaffolding of 749
draft genomes. Genome Biol 20, 224. doi:10.1186/s13059-019-1829-6 (2019). 750
36 Bekele, W. A., Wight, C. P., Chao, S., Howarth, C. J. & Tinker, N. A. 751
Haplotype-based genotyping-by-sequencing in oat genome research. Plant 752
Biotechnol J 16, 1452-1463, doi: 10.1111/pbi.12888 (2018). 753
37 Simão, F. A., Waterhouse, R. M., Ioannidis, P., Kriventseva, E. V. & Zdobnov, 754
E. M. BUSCO: assessing genome assembly and annotation completeness with 755
single-copy orthologs. Bioinformatics 31, 3210-3212, 756
doi:10.1093/bioinformatics/btv351 (2015). 757
38 Wang, X. & Wang, L. GMATA: An integrated software package for 758
genome-scale SSR mining, marker development and viewing. Front Plant Sci 759
7, doi:10.3389/fpls.2016.01350 (2016). 760
39 Benson, G. Tandem repeats finder: a program to analyze DNA sequences. 761
Nucleic Acids Res 27, 573-580, doi:10.1093/nar/27.2.573 (1999). 762
40 Han, Y. & Wessler, S. R. MITE-Hunter: a program for discovering miniature 763
inverted-repeat transposable elements from genomic sequences. Nucleic Acids 764
Res 38, e199-e199, doi:10.1093/nar/gkq862 (2010). 765
41 Xu, Z. & Wang, H. LTR_FINDER: an efficient tool for the prediction of 766
full-length LTR retrotransposons. Nucleic Acids Res 35, W265-W268, 767
doi:10.1093/nar/gkm286 (2007). 768
42 Bedell, J. A., Korf, I. & Gish, W. MaskerAid: a performance enhancement to 769
RepeatMasker. Bioinformatics 16, 1040-1041, 770
doi:10.1093/bioinformatics/16.11.1040 (2000). 771
43 Jurka, J. et al. Repbase Update, a database of eukaryotic repetitive elements. 772

Cytogenet Genome Res 110, 462-467, doi:10.1159/000084979 (2005). 773
44 Tang, S., Lomsadze, A. & Borodovsky, M. Identification of protein coding 774
regions in RNA transcripts. Nucleic Acids Res 43, e78, 775
doi:10.1093/nar/gkv227 (2015). 776
45 Lomsadze, A., Burns, P. D. & Borodovsky, M. Integration of mapped 777
RNA-Seq reads into automatic training of eukaryotic gene finding algorithm. 778
Nucleic Acids Res 42, e119-e119, doi:10.1093/nar/gku557 (2014). 779
46 Stanke, M., Diekhans, M., Baertsch, R. & Haussler, D. Using native and 780
syntenically mapped cDNA alignments to improve de novo gene finding. 781
Bioinformatics 24, 637-644, doi:10.1093/bioinformatics/btn013 (2008). 782
47 Haas, B. J. et al. Automated eukaryotic gene structure annotation using 783
EVidenceModeler and the Program to Assemble Spliced Alignments. Genome 784
Biol 9, R7, doi:10.1186/gb-2008-9-1-r7 (2008). 785
48 Urasaki, N. et al. Draft genome sequence of bitter gourd (Momordica 786
charantia), a vegetable and medicinal plant in tropical and subtropical regions. 787
DNA Res 24, 51-58, doi:10.1093/dnares/dsw047 (2017). 788
49 Nawrocki, E. P. & Eddy, S. R. Infernal 1.1: 100-fold faster RNA homology 789
searches. Bioinformatics 29, 2933-2935, doi:10.1093/bioinformatics/btt509 790
(2013). 791
50 Griffiths-Jones, S. et al. Rfam: annotating non-coding RNAs in complete 792
genomes. Nucleic Acids Res 33, D121-D124, doi:10.1093/nar/gki081 (2005). 793
51 Lagesen, K. et al. RNAmmer: consistent and rapid annotation of ribosomal 794
RNA genes. Nucleic Acids Res 35, 3100-3108, doi:10.1093/nar/gkm160 795
(2007). 796
52 Lowe, T. M. & Eddy, S. R. tRNAscan-SE: a program for improved detection 797

of transfer RNA genes in genomic sequence. Nucleic Acids Res 25, 955-964, 798
doi:10.1093/nar/25.5.955 (1997). 799
53 Hunter, S. et al. InterPro: the integrative protein signature database. Nucleic 800
Acids Res 37, D211-D215, doi:10.1093/nar/gkn785 (2009). 801
54 Talavera, G. & Castresana, J. Improvement of phylogenies after removing 802
divergent and ambiguously aligned blocks from protein sequence alignments. 803
Syst Biol 56, 564-577, doi:10.1080/10635150701472164 (2007). 804
55 Stamatakis, A. RAxML version 8: a tool for phylogenetic analysis and 805
post-analysis of large phylogenies. Bioinformatics 30, 1312-1313, 806
doi:10.1093/bioinformatics/btu033 (2014). 807
56 Arenas, M., Sánchez-Cobos, A. & Bastolla, U. Maximum-likelihood 808
phylogenetic inference with selection on protein folding stability. Mol Biol 809
Evol 32, 2195-2207, doi:10.1093/molbev/msv085 (2015). 810
57 Emms, D. M. & Kelly, S. OrthoFinder: phylogenetic orthology inference for 811
comparative genomics. Genome Biol 20, 238, doi:10.1186/s13059-019-1832-y 812
(2019). 813
58 Wang, Y. et al. MCScanX: a toolkit for detection and evolutionary analysis of 814
gene synteny and collinearity. Nucleic Acids Res 40, e49, 815
doi:10.1093/nar/gkr1293 (2012). 816
59 Bolger, A. M., Lohse, M. & Usadel, B. Trimmomatic: a flexible trimmer for 817
Illumina sequence data. Bioinformatics 30, 2114-2120, 818
doi:10.1093/bioinformatics/btu170 (2014). 819
60 Li, H. & Durbin, R. Fast and accurate long-read alignment with 820
Burrows-Wheeler transform. Bioinformatics 26, 589-595, 821
doi:10.1093/bioinformatics/btp698 (2010). 822

61 Li, H. et al. The sequence alignment/map format and SAMtools. 823
Bioinformatics 25, 2078-2079, doi:10.1093/bioinformatics/btp352 (2009). 824
62 Haas, B. J. et al. De novo transcript sequence reconstruction from RNA-seq 825
using the Trinity platform for reference generation and analysis. Nat Protoc 8, 826
1494-1512, doi:10.1038/nprot.2013.084 (2013). 827
63 Dierckxsens, N., Mardulyn, P. & Smits, G. NOVOPlasty: de novo assembly of 828
organelle genomes from whole genome data. Nucleic Acids Res 45, e18, 829
doi:10.1093/nar/gkw955 (2017). 830
64 Edgar, R. C. MUSCLE: multiple sequence alignment with high accuracy and 831
high throughput. Nucleic Acids Res 32, 1792-1797, doi:10.1093/nar/gkh340 832
(2004). 833
65 Krzywinski, M. et al. Circos: an information aesthetic for comparative 834
genomics. Genome Res 19, 1639-1645, doi:10.1101/gr.092759.109 (2009). 835
66 Yan, H. et al. New evidence confirming the CD genomic constitutions of the 836
tetraploid Avena species in the section Pachycarpa Baum. PloS One 16, 837
e0240703, doi:10.1371/journal.pone.0240703 (2021). 838
67 Fu, S. et al. Oligonucleotide probes for ND-FISH analysis to identify rye and 839
wheat chromosomes. Sci Rep 5, 10552, doi:10.1038/srep10552 (2015). 840
68 Suyama, M., Torrents, D. & Bork, P. PAL2NAL: robust conversion of protein 841
sequence alignments into the corresponding codon alignments. Nucleic Acids 842
Res 34, W609-612, doi:10.1093/nar/gkl315 (2006). 843
69 Rice, P., Longden, I. & Bleasby, A. EMBOSS: the European molecular 844
biology open software suite. Trends Genet 16, 276-277, 845
doi:10.1016/s0168-9525(00)02024-2 (2000). 846
70 Wicker, T. et al. Impact of transposable elements on genome structure and 847
evolution in bread wheat. Genome Biol 19, 103, 848
doi:10.1186/s13059-018-1479-0 (2018). 849
71 Robinson, M. D., McCarthy, D. J. & Smyth, G. K. edgeR: a Bioconductor 850
package for differential expression analysis of digital gene expression data. 851
Bioinformatics 26, 139-140, doi:10.1093/bioinformatics/btp616 (2009). 852

Acknowledgements This research was supported by China Agriculture Research 853
System of MOF and MARA (CARS07), the National Natural Science Foundation of 854
China (32072025, 31801430), the Science and Technology Development Program of 855
Jilin Province (20200402034NC) and Talent Fund Project of Jilin Province. The 856
authors thank Mawsheng Chern, Department of Plant Pathology and the Genome 857
Center, University of California, Davis, California, USA, for improving the writing of 858
this article. We also thank Agriculture & Agri-Food Canada (AAFC) and Dr. Eric N. 859
Jellen, Brigham Young University, Provo, Utah, USA, for providing the Avena 860
materials. 861
862
Author contributions C.R., Yuanying Peng, F.L. and Y.W. conceived the study. C.R., 863
Yuanying Peng and H.Y. provided funding. C.R., Yuanying Peng, H.Y., L.G., P.Z., 864
C.W., J.Z., Yun Peng, D.D. and L.W. collected and prepared the tissue samples for 865
sequencing. Yuanying Peng, C.D., H.Y., L.K. and F.L. led the bioinformatics analyses. 866
P.Z., K.Y., C.D., Y.X. and Yun Peng conducted transcriptome sequencing and analysis. 867
K.Y and X.D. constructed database. X.L. and Ying Li conducted the FISH validation 868
of chromosome translocation. J.M., M.H. and Yan Li collected the pictures of spikes. 869
C.D., Yuanying Peng and H.Y. developed the figures. Yuanying Peng, H.Y., L.G., and 870
C.D. drafted the manuscript, Q.J., J.W., L.W., W.L., H.K., Y.W., Y.Z. contributed to 871
the writing. Yuanying Peng, H.Y., L.G., C.D. and L.K. contributed equally. 872
873
Competing interests The authors declare no competing interests. 874
875
Additional Information 876
Supplementary Information is available for this paper. 877
Correspondence and requests for materials should be addressed to R.C. 878
([email protected]) or Yuanying Peng ([email protected]). 879
Data availability 880
The genome assemblies and sequence data for A. sativa ssp. nuda cv. Sanfensan, A. 881
insularis (CN 108634) and A. longiglumis (CN 58139) were deposited at NCBI under 882
BioProject codes PRJNA 727473, PRJNA731599 and PRJNA716144, respectively. 883
Sanfensan genome assembly (SAMN19770945), ONT data (SAMN19021785), Hi-C 884
data (SAMN19340419), NGS data (SAMN19582572), Iso-seq data (SAMN19581880) 885
and RNA-seq data (SAMN19582573, SAMN19582574); A.insularis genome 886
assembly (SAMN19771048), ONT data (SAMN19291344), Hi-C data 887
(SAMN19312172), NGS data (SAMN19579880) and Iso-seq data (SAMN19581879); 888
A.longiglumis genome assembly (SAMN19771099), ONT data (SAMN18395928), 889
NGS data (SAMN19523931) and Iso-seq data (SAMN19581877). All raw data for the 890
other 14 deep-sequenced accessions including 8 diploids, 5 tetraploids and 1 891
hexaploid are available under projected numbers can be found in Supplementary 892
Table 1. All other data are available from the corresponding author upon reasonable 893
request. 894

895 Extended Data Fig. 1|Hi-C contact map of Avena polyploid species. Abundant 896
intrachromosomal contacts were observed. Chromosomes are sorted by size; 897
interchromosomal contacts were also found but with a much lower intensity. a, The 21 898
chromosomes of hexaploid SFS. b, The 14 chromosomes of tetraploid A. insularis. 899

900
Extended Data Fig. 2|Assembly validation. a, The final assemblies were 901
evaluated using the consensus hexaploid linkage map. Markers from each of the 902
linkage groups of the hexaploid consensus linkage map anchored to the assembled 903
SFS (top) and A. insularis (bottom) chromosomes. b, Completeness of the three 904
assembled genomes as assessed by BUSCO. Bar charts show the percentages of 1,375 905
highly conserved plant BUSCO genes that are completely present, fragmented or 906
missing in the assembly. 907
908
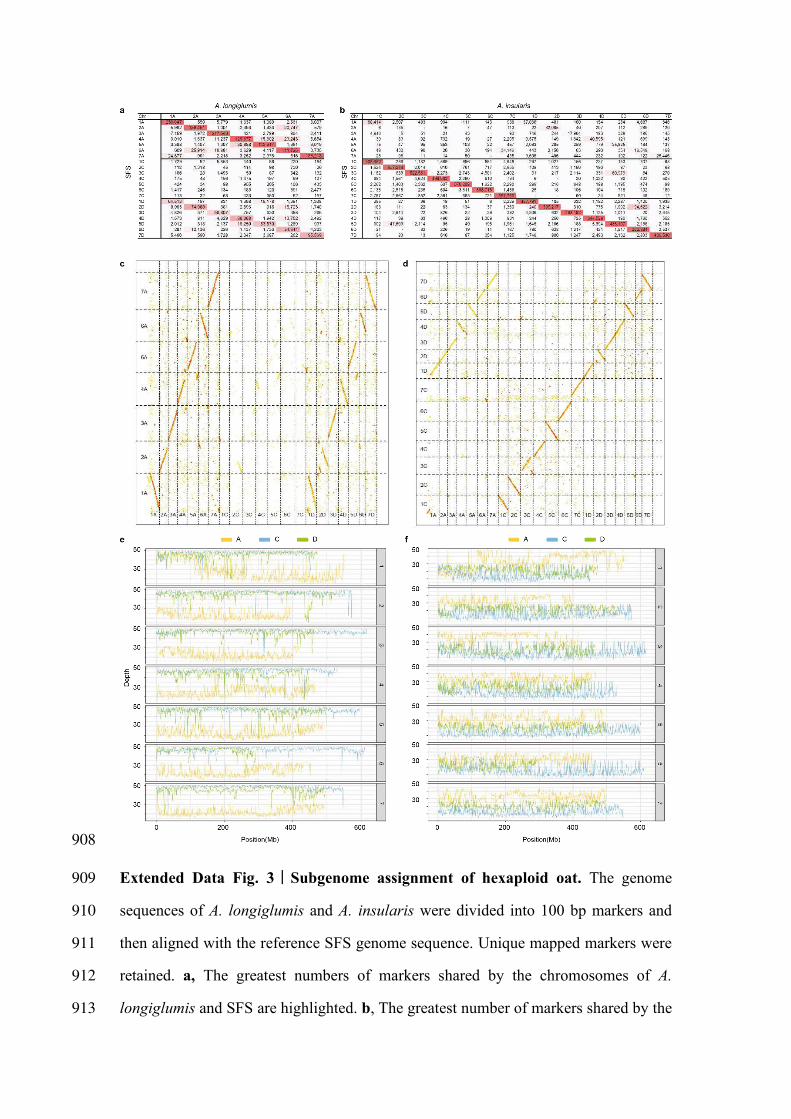
Extended Data Fig. 3|Subgenome assignment of hexaploid oat. The genome 909
sequences of A. longiglumis and A. insularis were divided into 100 bp markers and 910
then aligned with the reference SFS genome sequence. Unique mapped markers were 911
retained. a, The greatest numbers of markers shared by the chromosomes of A. 912
longiglumis and SFS are highlighted. b, The greatest number of markers shared by the 913

chromosomes of A. insularis and SFS are highlighted. c, Dot plots display the degrees 914
of synteny between A. longiglumis and SFS. d, Dot plots display the degrees of 915
synteny between A. insularis and SFS. Each dot represents a syntenic block of five or 916
more 100 bp markers. The distance between each pair of adjacent markers is less than 917
200 kb. e-f, Coverage depth obtained along the SFS chromosomes after mapping 918
Illumina sequence reads from A. longiglumis (e) and A. insularis (f) to the reference 919
genome of SFS. 920

921
Extended Data Fig. 4| Standard nomenclature for SFS chromosomes. The 922
assignment of SFS chromosomes was performed based on synteny with the 923
chromosomes of bread wheat to maintain consistency with future assemblies. 924
Chromosome names specify homologous groups (1 to 7) and subgenomes (A/C/D). a, 925
The matrix shows the number of conserved protein-coding genes between each pair of 926
SFS and bread wheat chromosomes. b, Dot plots display the degrees of synteny 927
between SFS and bread wheat. Each dot represents a syntenic block of five or more 928
genes. 929

930
Extended Data Fig. 5|Phylogenetic analyses of different Avena genomes. Clean 931
short paired reads from all the sequenced Avena taxa were aligned to the subgenomes 932
of SFS individually, and variants were called and filtered using bcftools. The resulting 933
SNPs based on three subgenomes of SFS were used for phylogenetic tree construction. 934
a, Phylogenetic tree generated from the SNPs of the A subgenome. b, Phylogenetic 935
tree generated from the SNPs of the C subgenome. c, Phylogenetic tree generated 936
from the SNPs of the D subgenome. 937

938
Extended Data Fig. 6|Structural and conserved synteny landscape of the A. 939
insularis and SFS subgenomes. Homoeologous gene pairs in syntenic blocks are 940
linked. The rings depict the 31-mer distribution along each chromosome (1), the 941
density of tandem repeat (TR) (2), the density of long terminal repeats (LTRs) (3), and 942
the density of protein-coding genes (4). a, SFS. b, A. insularis. 943

944
Extended Data Fig. 7|Intergenomic exchanges between the oat subgenomes. a, 945
Reads of the A genome diploid mapped to the reference SFS genome. b, Reads of the 946
CD genome tetraploid mapped to the reference SFS genome. c, Reads of the A 947
genome diploid mapped to the reference A. insularis genome. d, Reads of the C 948
genome diploid mapped to the reference A. insularis genome reveal at least four large 949
C to D genomic exchanges. e, The major C to D translocations (indicated by white 950
arrows) in A. insularis were confirmed using FISH technology with the C 951
genome-specific repeat Am1 (green signals) as the probe. 952

953
Extended Data Figure 8|Analysis of TEs in Avena genomes. a, Genomic 954
constituents of the subgenomes of SFS in comparison with those of the subgenomes 955
of A. insularis, and the Al (A. longiglumis), As (A. atlantica), and Cp (A. eriantha) 956
diploid genomes. b, Numbers of full-length long terminal repeats (LTRs) identified 957
with LTR_FINDER in the subgenomes of SFS and A. insularis, as well as in the Al, 958
As, and Cp genomes. c, Average sequence length of LTRs. d, Insertion times of 959
full-length LTRs in Avena genomes. 960
961
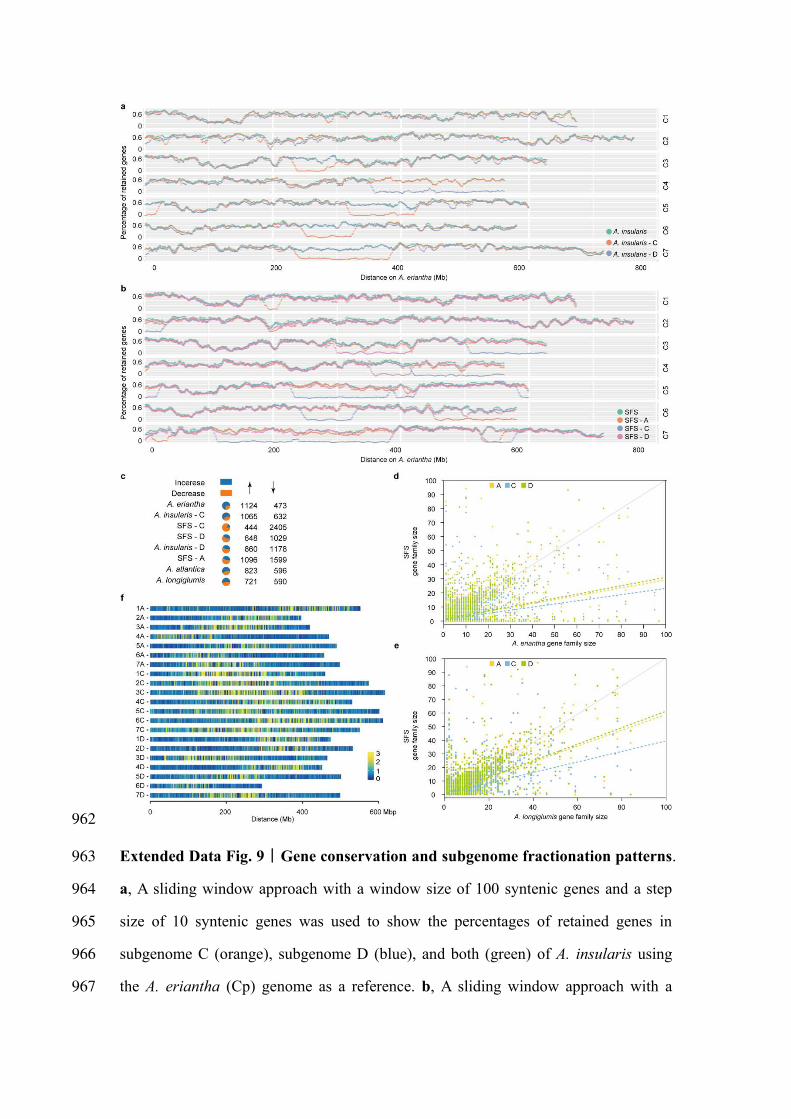
962
Extended Data Fig. 9|Gene conservation and subgenome fractionation patterns. 963
a, A sliding window approach with a window size of 100 syntenic genes and a step 964
size of 10 syntenic genes was used to show the percentages of retained genes in 965
subgenome C (orange), subgenome D (blue), and both (green) of A. insularis using 966
the A. eriantha (Cp) genome as a reference. b, A sliding window approach with a 967
window size of 100 syntenic genes and a step size of 10 syntenic genes was used to 968
show the percentage of retained genes in subgenome A (orange), subgenome C (blue), 969
subgenome D (pink), and all three (green) of SFS using the A. eriantha (Cp) genome 970
as a reference. c, Number of expanded and contracted gene families in the 971
subgenomes of SFS and A. insularis and the putative diploid progenitor genomes of A. 972
longiglumis and A. eriantha. d, Relationships between gene family sizes in diploid A. 973
eriantha and each subgenome of SFS. e, Relationship between gene family sizes in 974
diploid A. longiglumis and each subgenome of SFS. The black line shows a 1:1 gene 975
copy number relationship for SFS, A. eriantha, and A. longiglumis, and coloured lines 976
show the regression fits for the observed gene family size in the subgenomes of SFS 977
(colours: green, A subgenome; orange, D subgenome; blue, C subgenome). f, 978
Distribution of the identified pseudogenes along the SFS chromosomes. 979

980
Extended Data Fig. 10|Impact of TE density on gene expression in SFS. a, Gene 981
expression is negatively correlated with TE density in SFS. Genes were grouped into 982
twenty bins (5% increments in TE density). The mean log10-transformed gene 983
expression of each bin is shown by a boxplot. The central line in each box plot 984
indicates the median. The top and bottom edges of the box indicate the first and third 985
quartiles and the whiskers extended 1.5 times the interquartile range beyond the edges 986
of the box. Black dots represent outliers. b, TE density was calculated in 5 kb up- and 987
5 kb downstream windows from the gene. TE densities near genes in the C 988
subgenome are highest relative to homoeologs in the A and D subgenomes. 989

Supplementary Files
This is a list of supplementary �les associated with this preprint. Click to download.
SupplementaryTables12720210627.xlsx
SupplementaryInformation20210627.pdf
SupplementaryInformation20210627.pdf

![Genome-Wide Association Studies Reveal the Genetic Basis ...LARGE-SCALE BIOLOGY ARTICLE Genome-Wide Association Studies Reveal the Genetic Basis of Ionomic Variation in Rice[OPEN]](https://img.dokumen.tips/doc/110x75/5e5eb5092265ae59ce62c695/genome-wide-association-studies-reveal-the-genetic-basis-large-scale-biology.jpg)