Embed Size (px)
Citation preview
Reference Designs for Hydrogen Fueling Stations
DOE-EERE-FCTO Webinar Series October 13, 2015
Joe Pratt1, Danny Terlip2, Amgad Elgowainy3, Chris Ainscough2, Jennifer Kurtz2
1Sandia National Laboratories 2National Renewable Energy Laboratory
3Argonne National Laboratory
Question and Answer
• Please type your questions into the question box
2

Reference Designs for Hydrogen Fueling Stations
DOE-EERE-FCTO Webinar Series October 13, 2015
Joe Pratt1, Danny Terlip2, Amgad Elgowainy3, Chris Ainscough2, Jennifer Kurtz2
1Sandia National Laboratories 2National Renewable Energy Laboratory
3Argonne National Laboratory
Outline
1. Objective and Approach 2. Development of Inputs 3. Economic Screening Results 4. Market Matching and Downselect 5. Station Designs 6. Conclusions and Future Steps
H2First is a multi-lab project launched by the DOE’s Energy Efficiency and Renewable Energy (EERE) Fuel Cell Technologies Office (FCTO) to support
H2USA
4
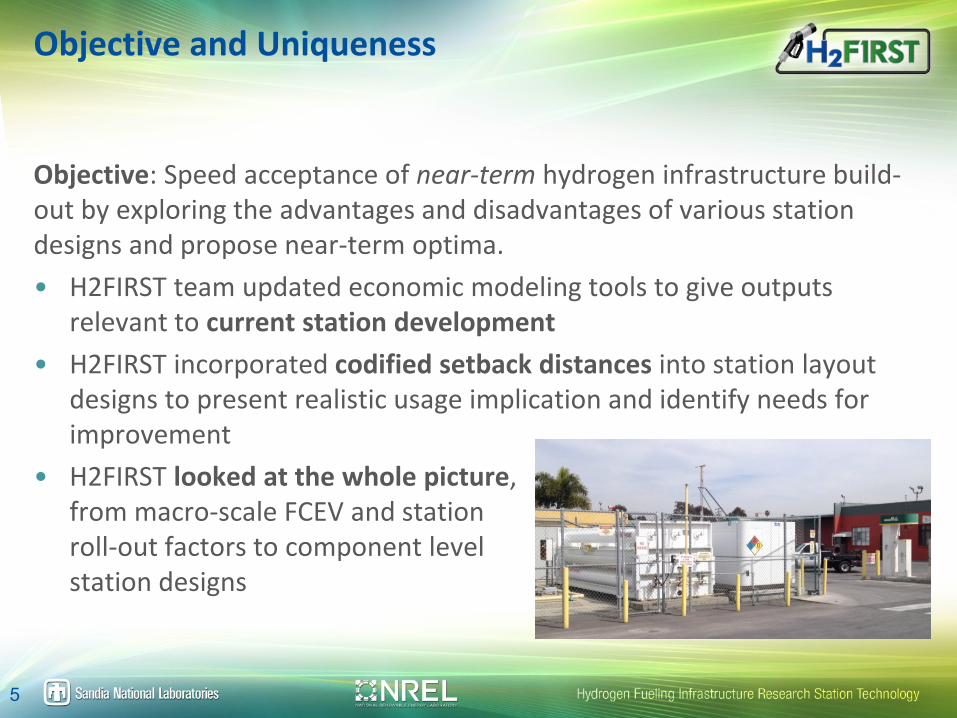
Objective and Uniqueness
Objective: Speed acceptance of near-term hydrogen infrastructure build-out by exploring the advantages and disadvantages of various station designs and propose near-term optima. • H2FIRST team updated economic modeling tools to give outputs
relevant to current station development • H2FIRST incorporated codified setback distances into station layout
designs to present realistic usage implication and identify needs for improvement
• H2FIRST looked at the whole picture, from macro-scale FCEV and station roll-out factors to component level station designs
5
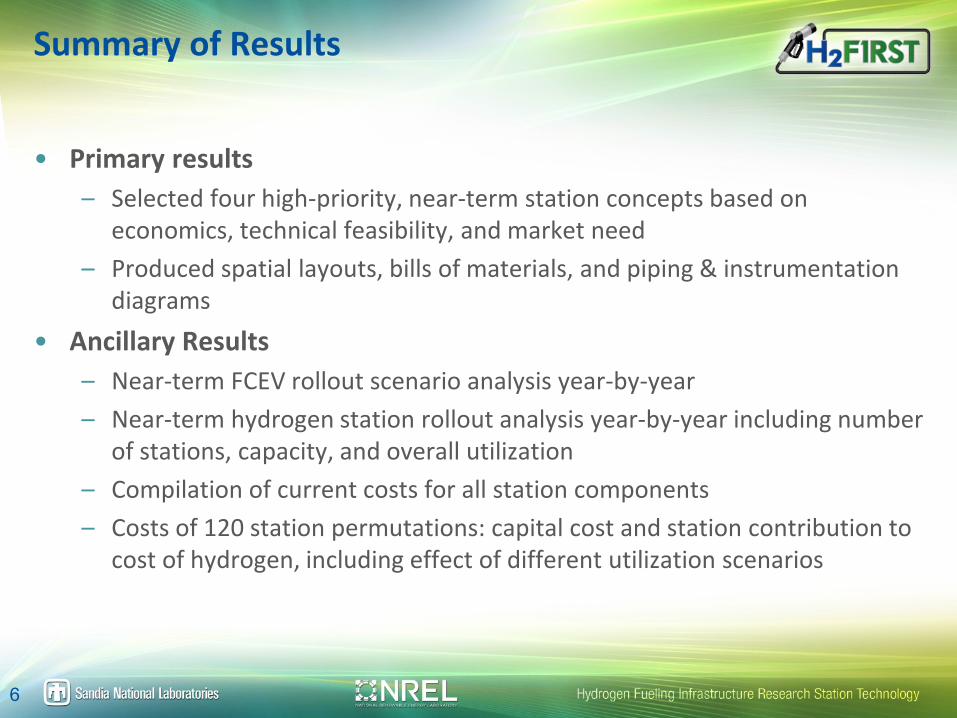
Summary of Results
• Primary results – Selected four high-priority, near-term station concepts based on
economics, technical feasibility, and market need – Produced spatial layouts, bills of materials, and piping & instrumentation
diagrams • Ancillary Results
– Near-term FCEV rollout scenario analysis year-by-year – Near-term hydrogen station rollout analysis year-by-year including number
of stations, capacity, and overall utilization – Compilation of current costs for all station components – Costs of 120 station permutations: capital cost and station contribution to
cost of hydrogen, including effect of different utilization scenarios
6
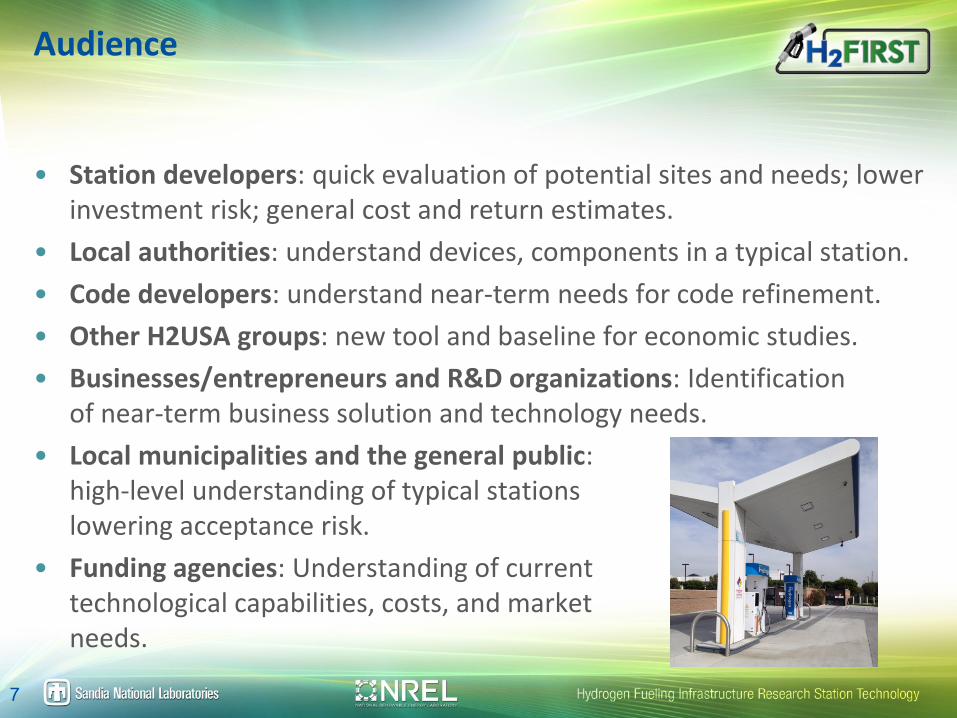
Audience
• Station developers: quick evaluation of potential sites and needs; lower investment risk; general cost and return estimates.
• Local authorities: understand devices, components in a typical station. • Code developers: understand near-term needs for code refinement. • Other H2USA groups: new tool and baseline for economic studies. • Businesses/entrepreneurs and R&D organizations: Identification
of near-term business solution and technology needs. • Local municipalities and the general public:
high-level understanding of typical stations lowering acceptance risk.
• Funding agencies: Understanding of current technological capabilities, costs, and market needs.
7
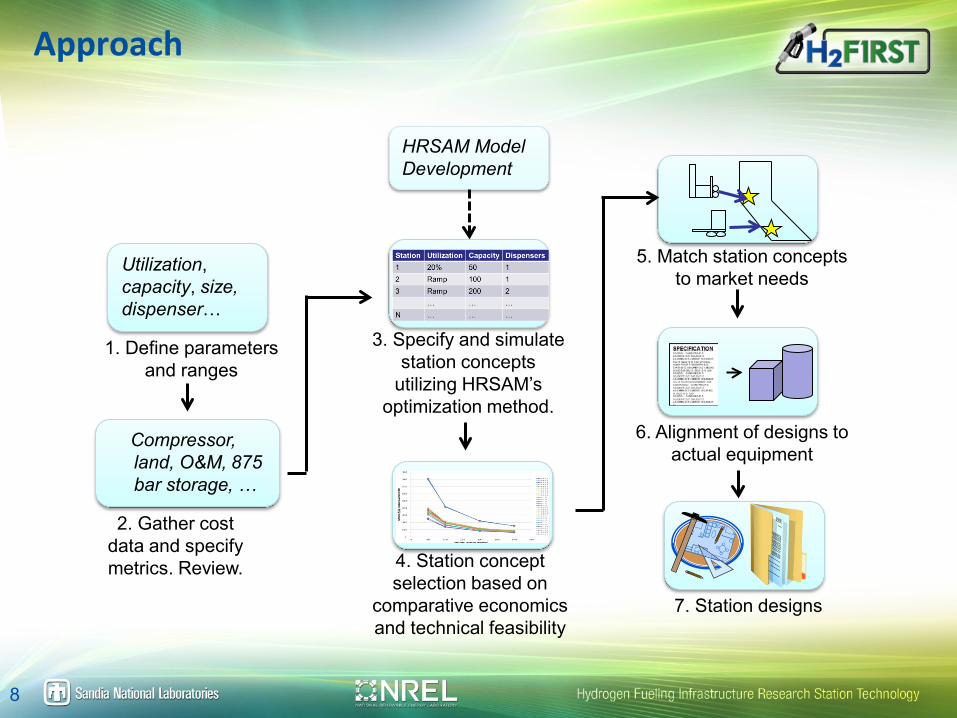
Approach
Compressor, land, O&M, 875 bar storage, …
2. Gather cost data and specify metrics. Review.
Utilization, capacity, size, dispenser…
1. Define parameters and ranges
3. Specify and simulate station concepts
utilizing HRSAM’s optimization method.
4. Station concept selection based on
comparative economics and technical feasibility
5. Match station concepts to market needs
6. Alignment of designs to actual equipment
7. Station designs
HRSAM Model Development
8
DEVELOPMENT OF INPUTS
9
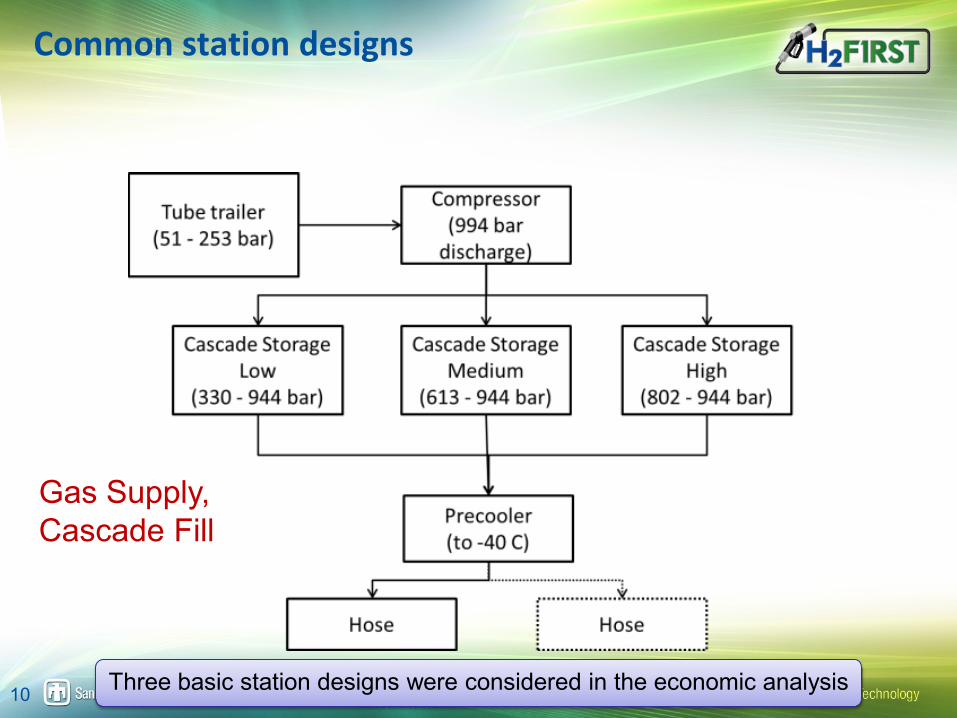
Common station designs
Gas Supply, Cascade Fill
Three basic station designs were considered in the economic analysis 10
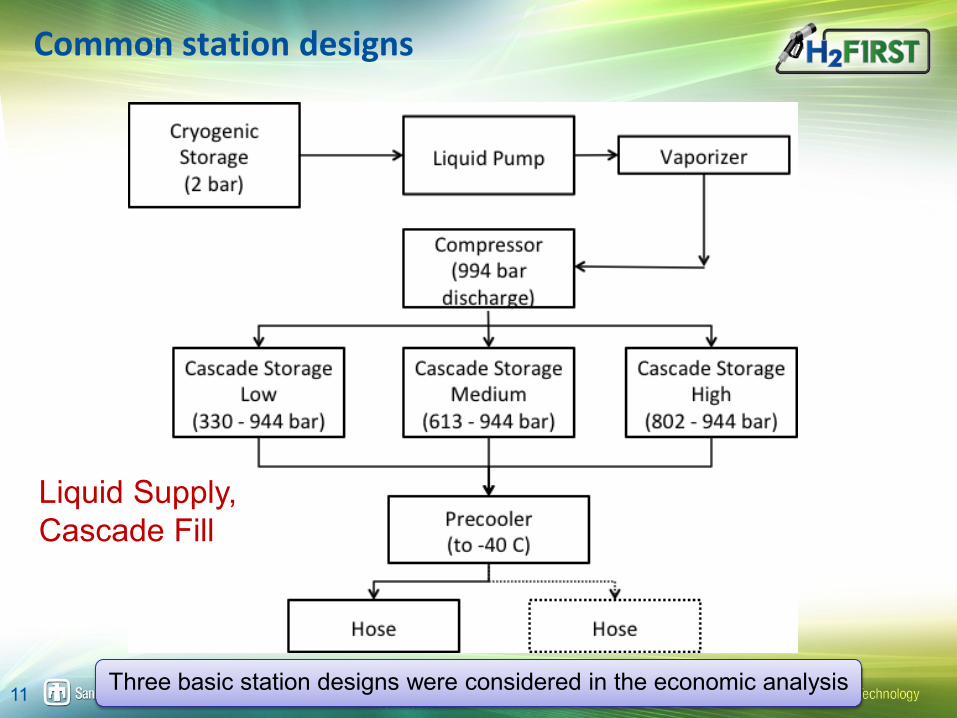
Common station designs
Three basic station designs were considered in the economic analysis
Liquid Supply, Cascade Fill
11
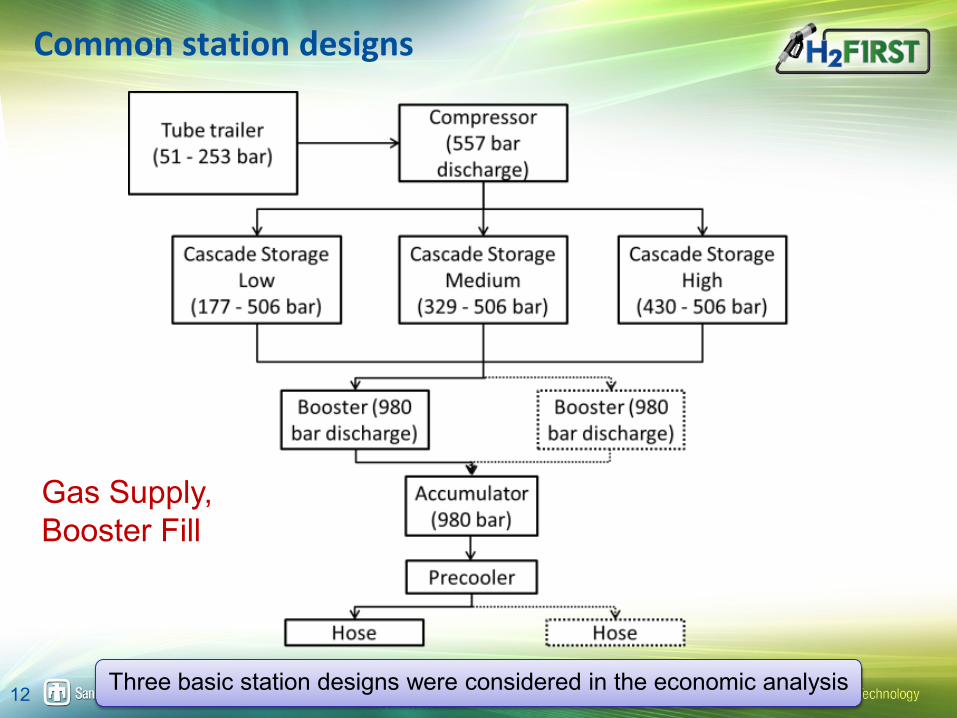
Gas Supply, Booster Fill
Common station designs
Three basic station designs were considered in the economic analysis 12
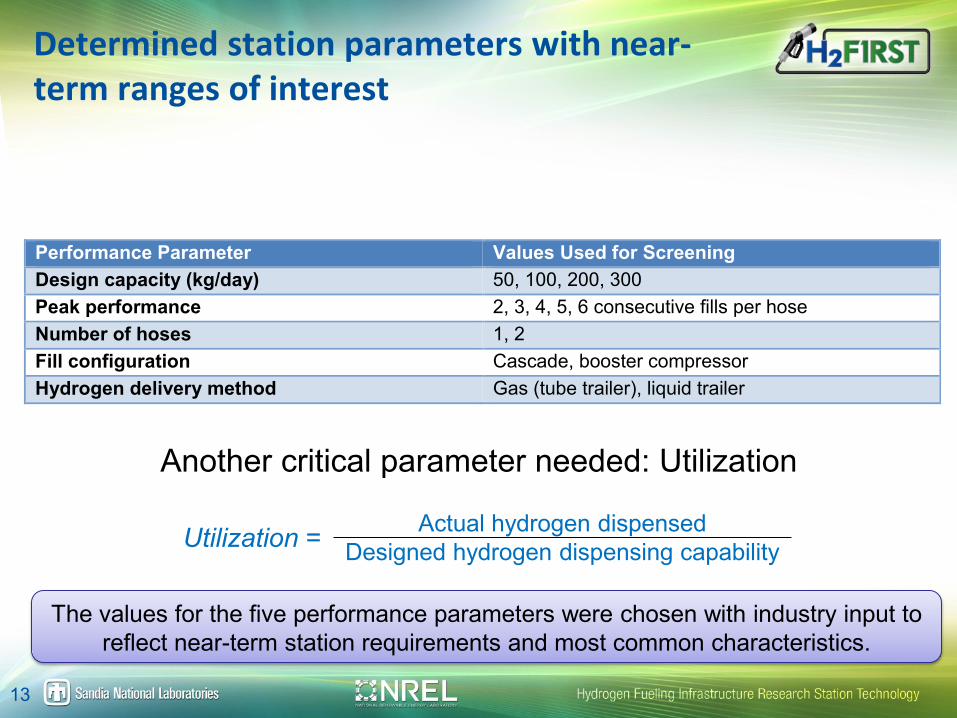
Determined station parameters with near-term ranges of interest
Performance Parameter Values Used for Screening Design capacity (kg/day) 50, 100, 200, 300 Peak performance 2, 3, 4, 5, 6 consecutive fills per hose Number of hoses 1, 2 Fill configuration Cascade, booster compressor Hydrogen delivery method Gas (tube trailer), liquid trailer
The values for the five performance parameters were chosen with industry input to reflect near-term station requirements and most common characteristics.
Another critical parameter needed: Utilization
Actual hydrogen dispensed Designed hydrogen dispensing capability Utilization =
13
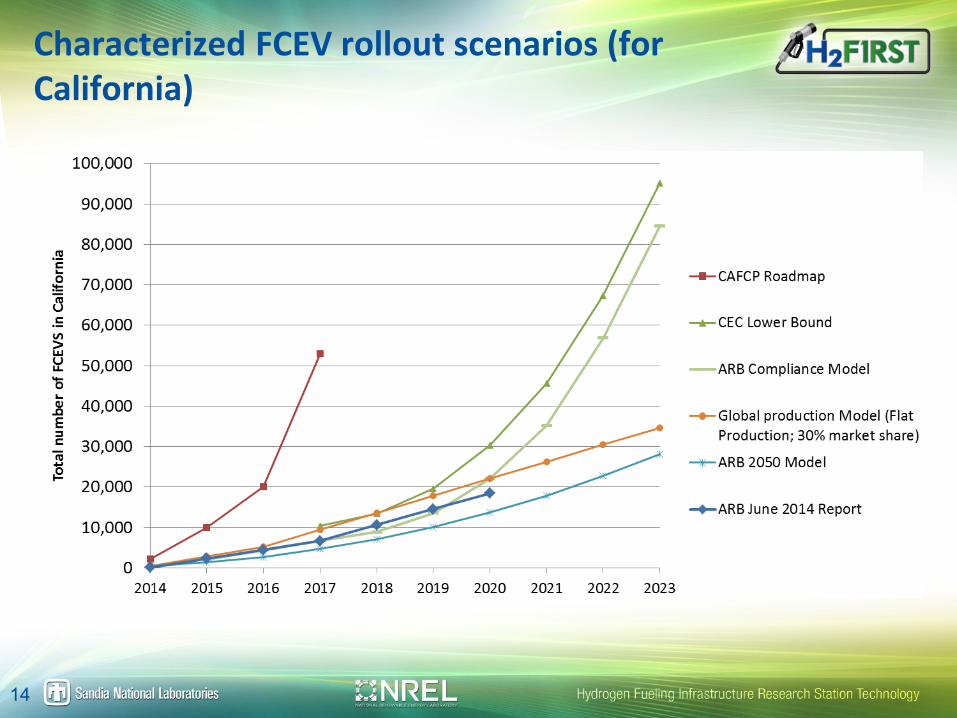
Characterized FCEV rollout scenarios (for California)
14
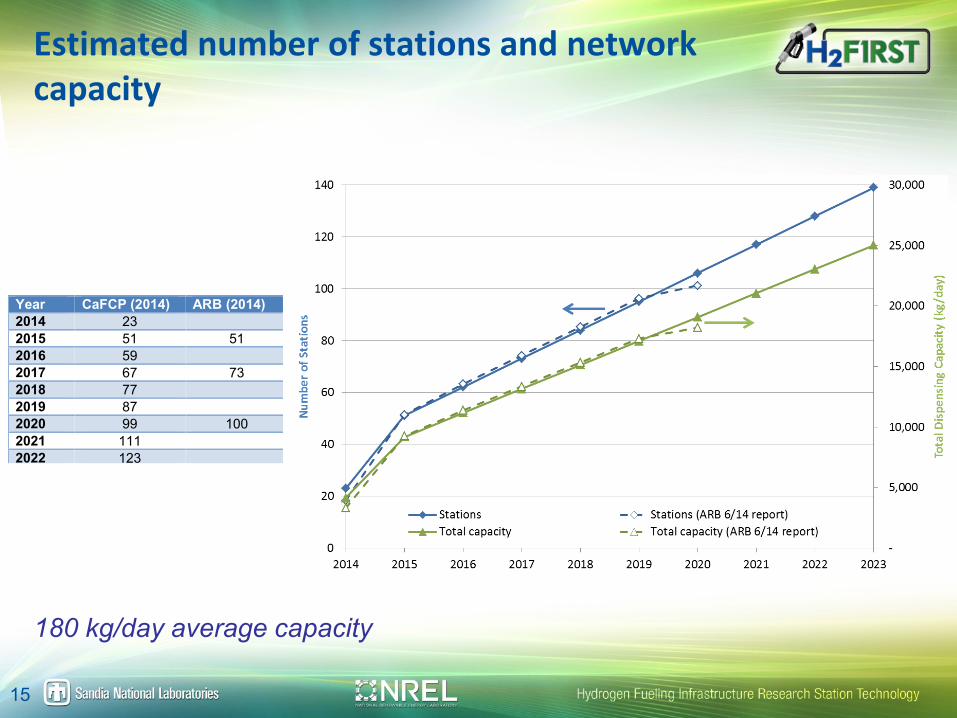
Estimated number of stations and network capacity
Year CaFCP (2014) ARB (2014) 2014 23 2015 51 51 2016 59 2017 67 73 2018 77 2019 87 2020 99 100 2021 111 2022 123
180 kg/day average capacity
15
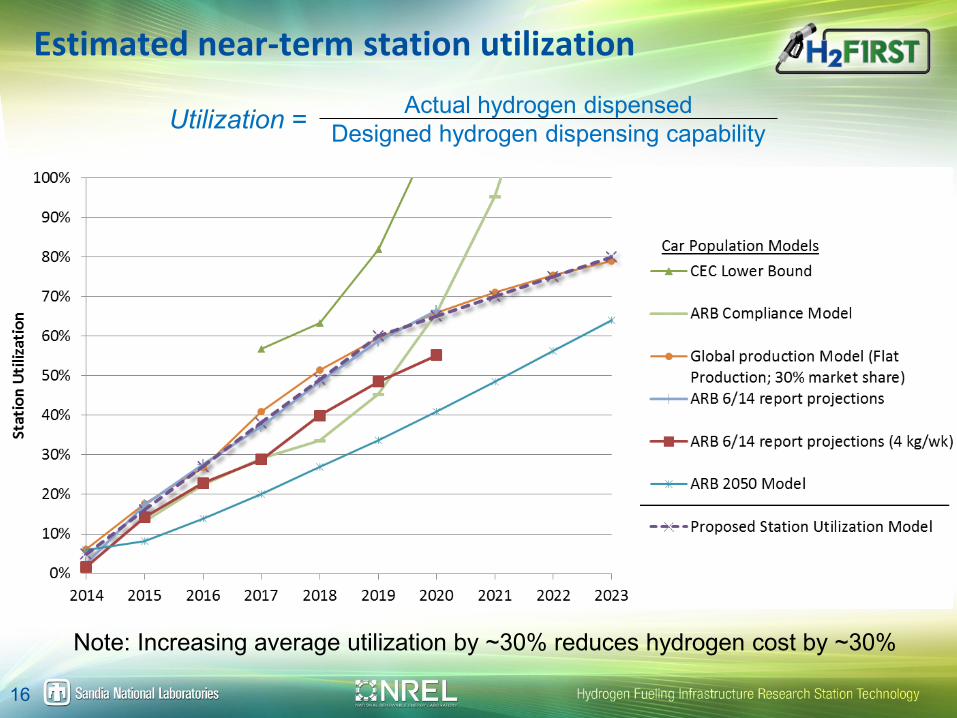
Estimated near-term station utilization
Note: Increasing average utilization by ~30% reduces hydrogen cost by ~30%
Actual hydrogen dispensed Designed hydrogen dispensing capability Utilization =
16
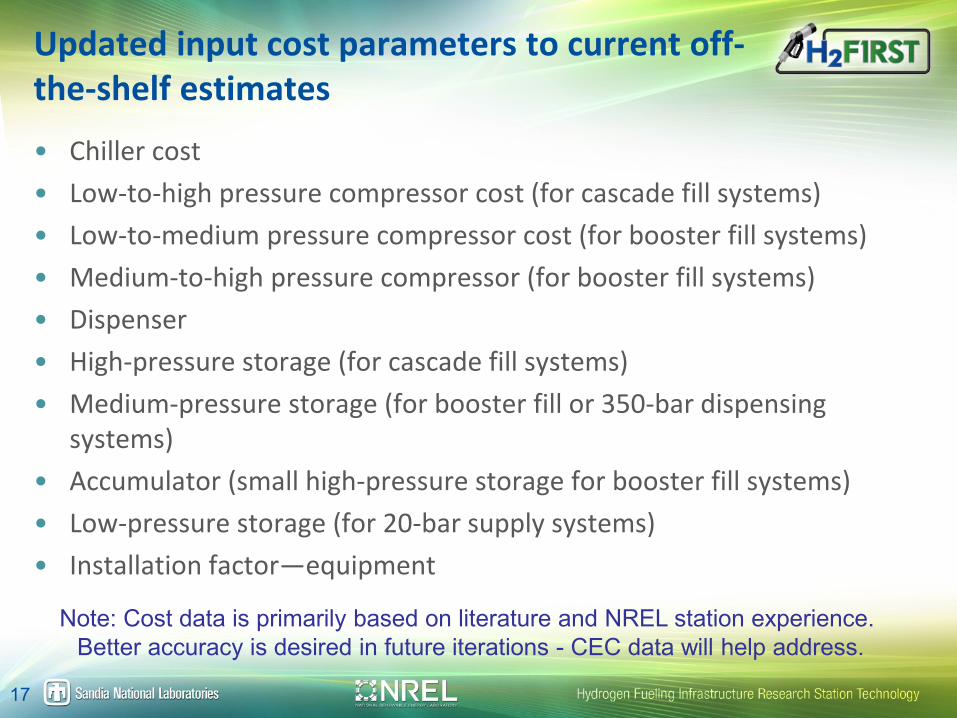
Updated input cost parameters to current off-the-shelf estimates
• Chiller cost • Low-to-high pressure compressor cost (for cascade fill systems) • Low-to-medium pressure compressor cost (for booster fill systems) • Medium-to-high pressure compressor (for booster fill systems) • Dispenser • High-pressure storage (for cascade fill systems) • Medium-pressure storage (for booster fill or 350-bar dispensing
systems) • Accumulator (small high-pressure storage for booster fill systems) • Low-pressure storage (for 20-bar supply systems) • Installation factor—equipment
17
Note: Cost data is primarily based on literature and NREL station experience. Better accuracy is desired in future iterations - CEC data will help address.
ECONOMIC SCREENING RESULTS
18
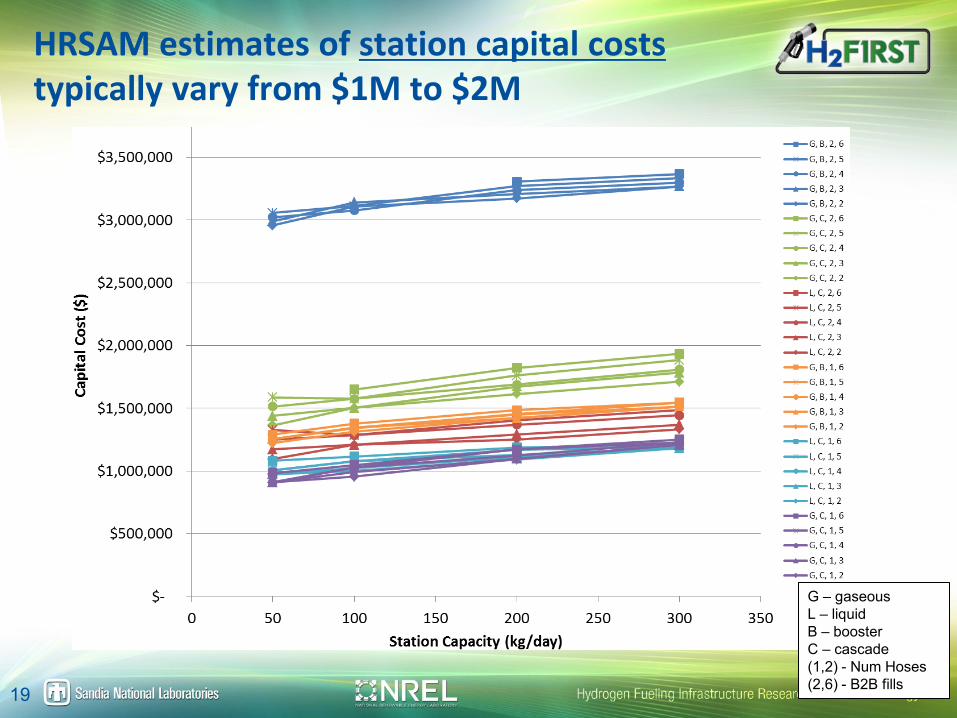
HRSAM estimates of station capital costs typically vary from $1M to $2M
G – gaseous L – liquid B – booster C – cascade (1,2) - Num Hoses (2,6) - B2B fills 19
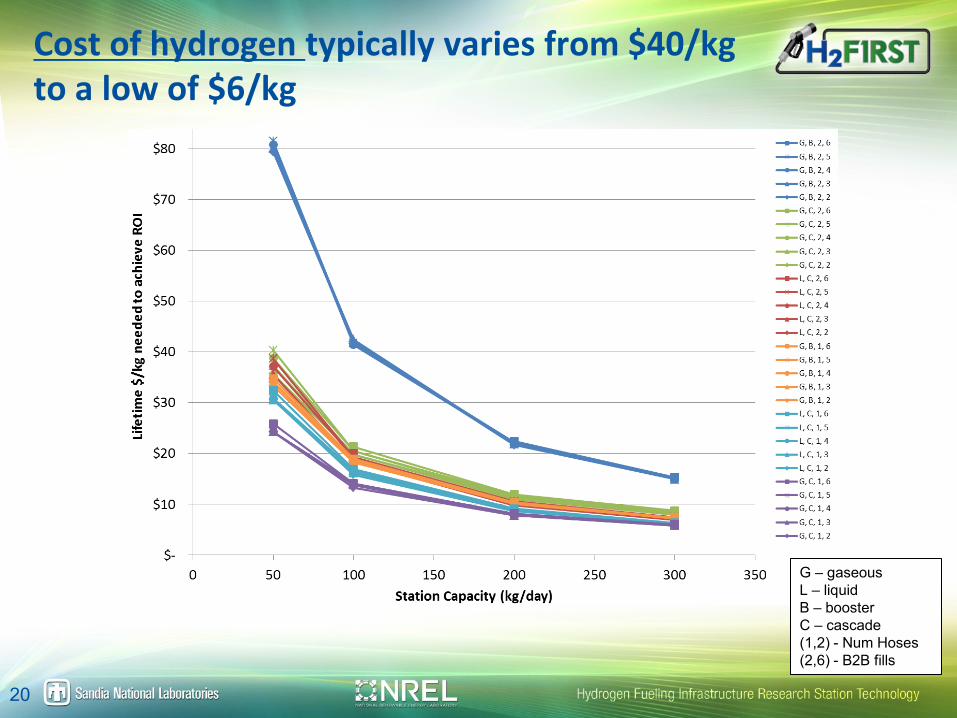
Cost of hydrogen typically varies from $40/kg to a low of $6/kg
G – gaseous L – liquid B – booster C – cascade (1,2) - Num Hoses (2,6) - B2B fills
20
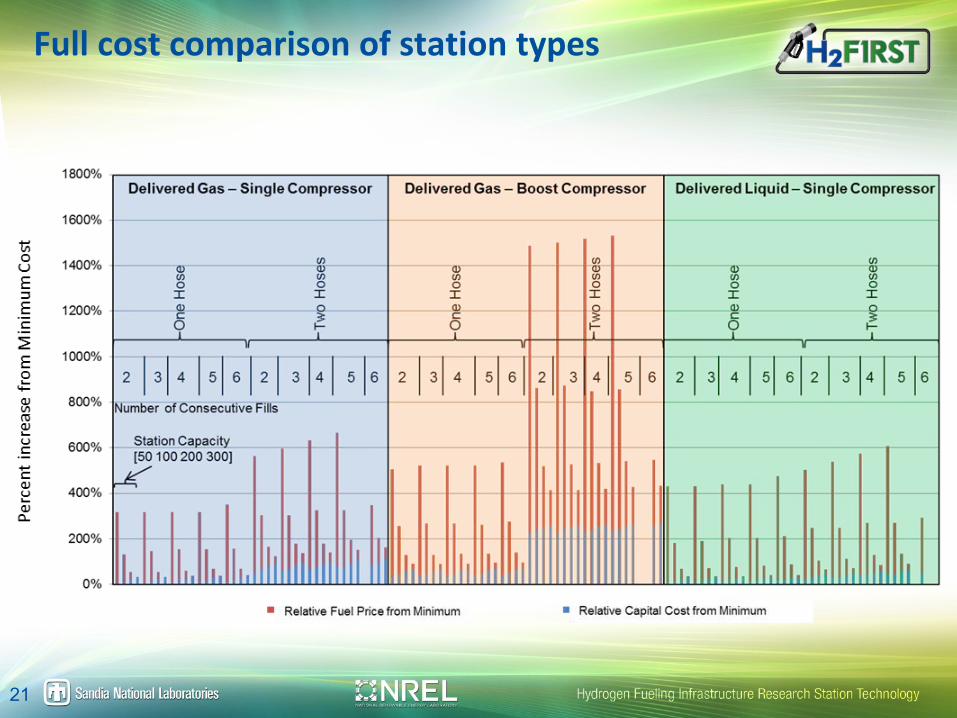
Full cost comparison of station types
21
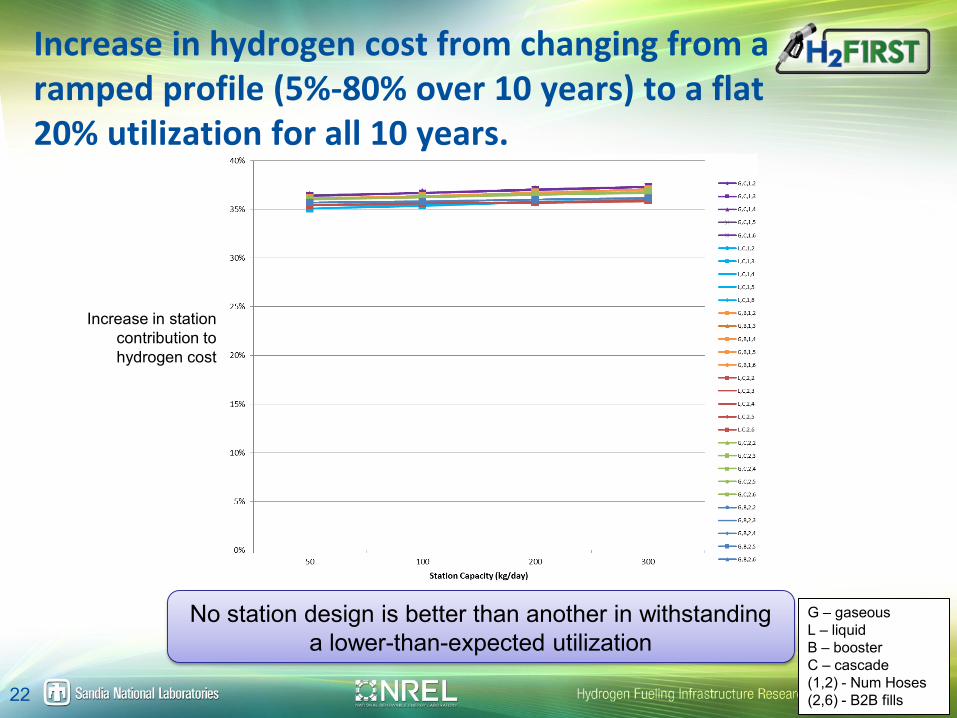
Increase in hydrogen cost from changing from a ramped profile (5%-80% over 10 years) to a flat 20% utilization for all 10 years.
G – gaseous L – liquid B – booster C – cascade (1,2) - Num Hoses (2,6) - B2B fills
No station design is better than another in withstanding a lower-than-expected utilization
Increase in station contribution to hydrogen cost
22
MARKET MATCHING AND DOWNSELECT
23
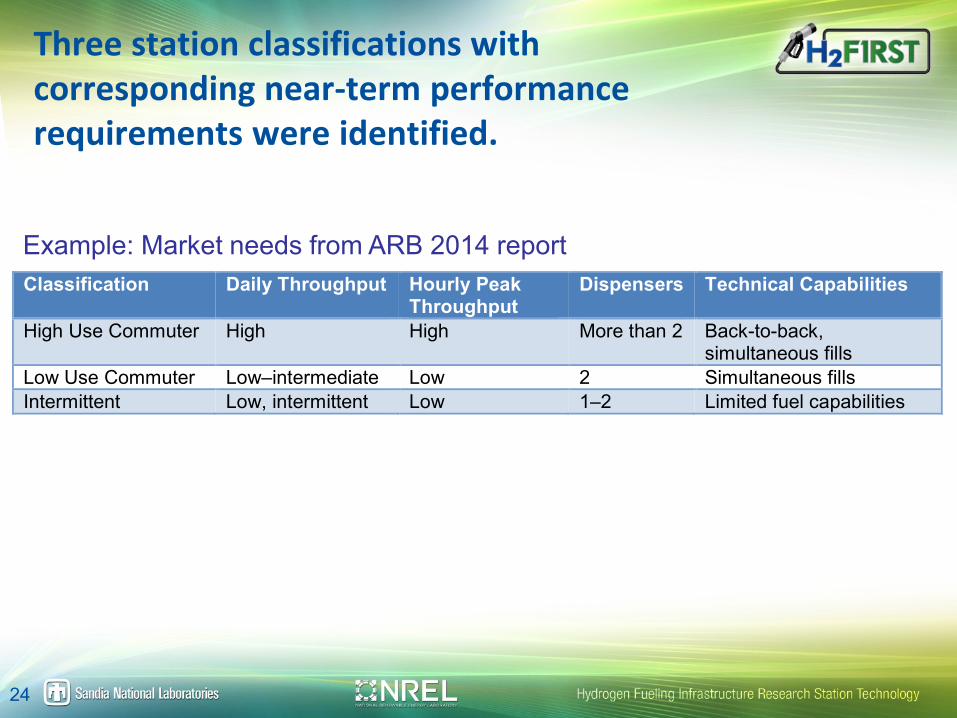
Three station classifications with corresponding near-term performance requirements were identified.
Example: Market needs from ARB 2014 report Classification Daily Throughput Hourly Peak
Throughput Dispensers Technical Capabilities
High Use Commuter High High More than 2 Back-to-back, simultaneous fills
Low Use Commuter Low–intermediate Low 2 Simultaneous fills Intermittent Low, intermittent Low 1–2 Limited fuel capabilities
24
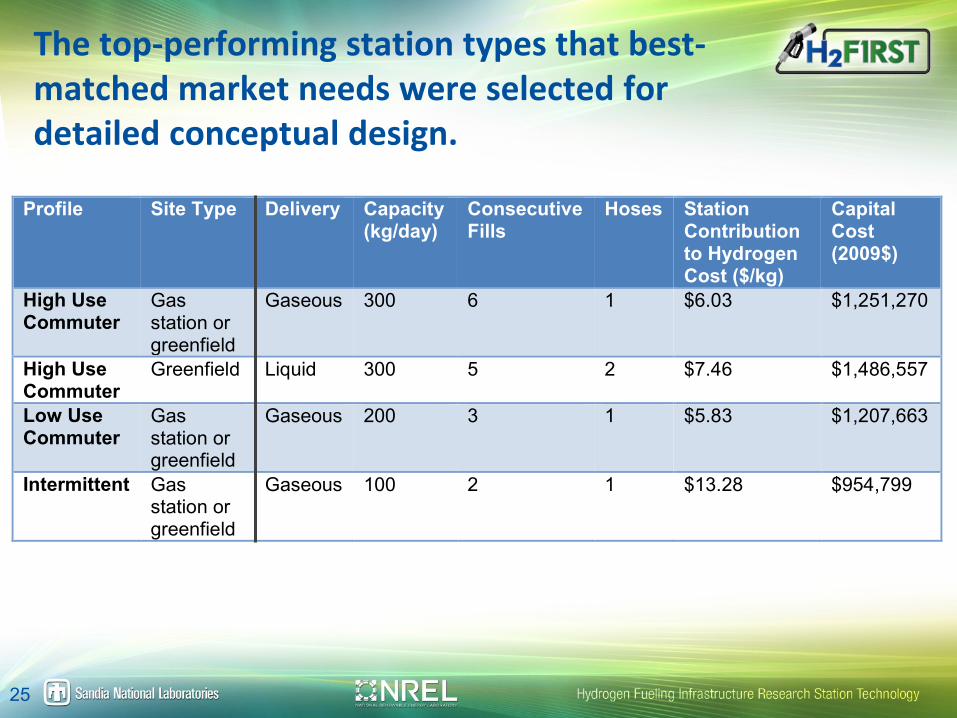
The top-performing station types that best-matched market needs were selected for detailed conceptual design.
Profile Site Type Delivery Capacity (kg/day)
Consecutive Fills
Hoses Station Contribution to Hydrogen Cost ($/kg)
Capital Cost (2009$)
High Use Commuter
Gas station or greenfield
Gaseous 300 6 1 $6.03 $1,251,270
High Use Commuter
Greenfield Liquid 300 5 2 $7.46 $1,486,557
Low Use Commuter
Gas station or greenfield
Gaseous 200 3 1 $5.83 $1,207,663
Intermittent Gas station or greenfield
Gaseous 100 2 1 $13.28 $954,799
25
STATION DESIGNS
26
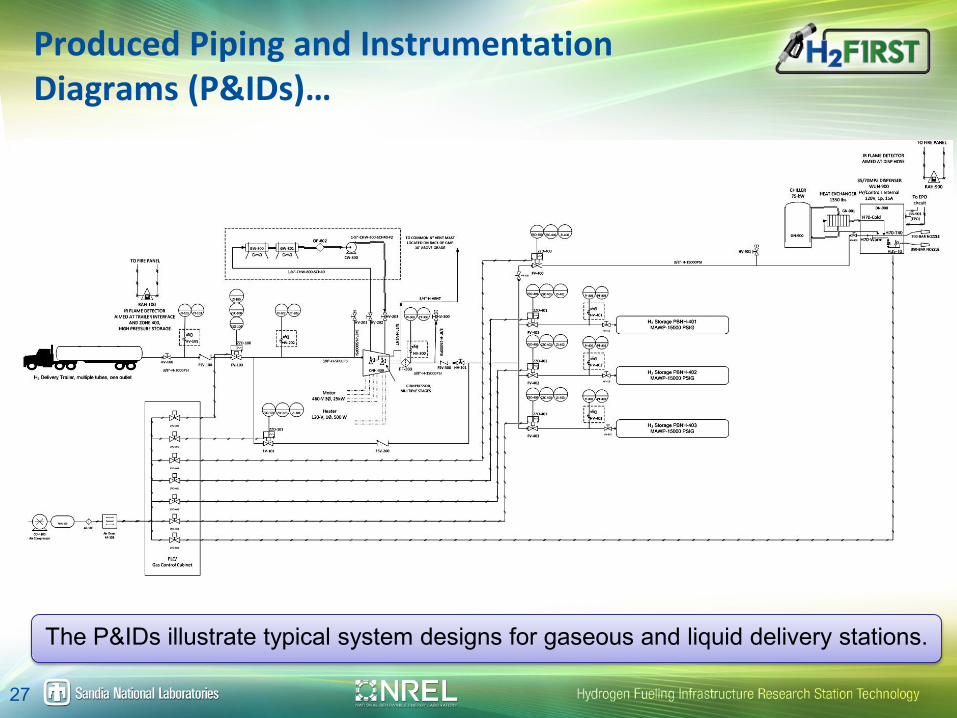
Produced Piping and Instrumentation Diagrams (P&IDs)…
The P&IDs illustrate typical system designs for gaseous and liquid delivery stations.
27
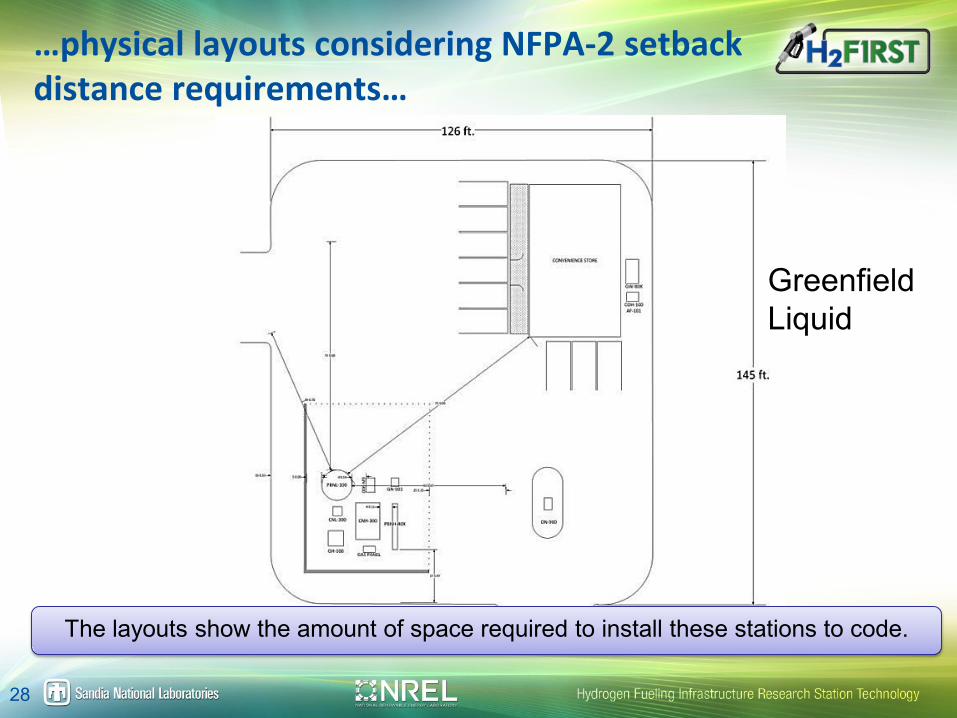
…physical layouts considering NFPA-2 setback distance requirements…
The layouts show the amount of space required to install these stations to code.
Greenfield Liquid
28
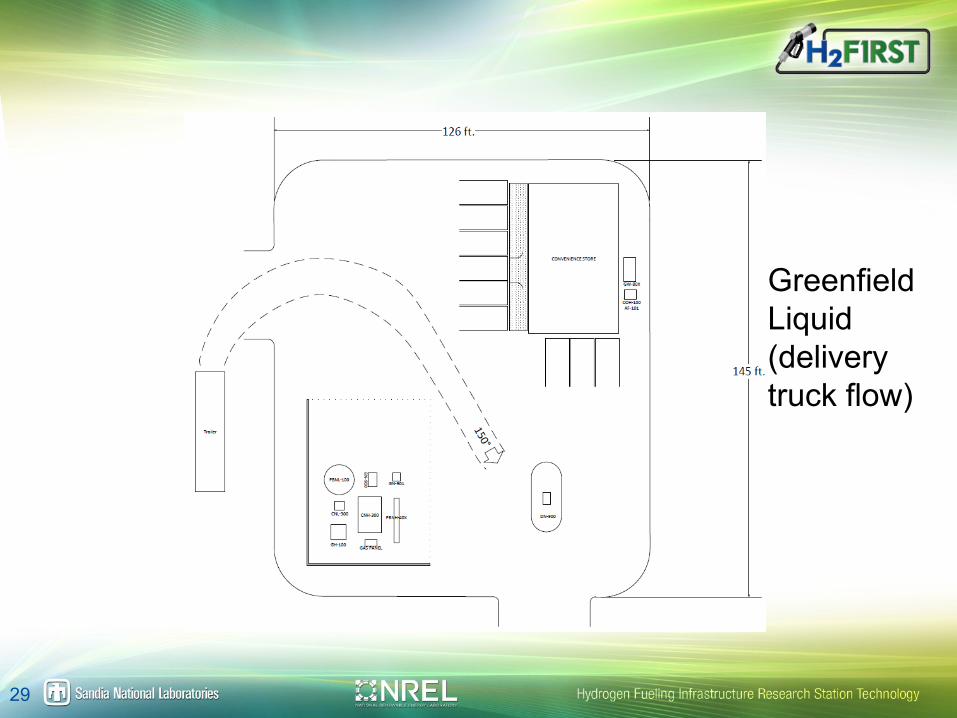
Greenfield Liquid (delivery truck flow)
29
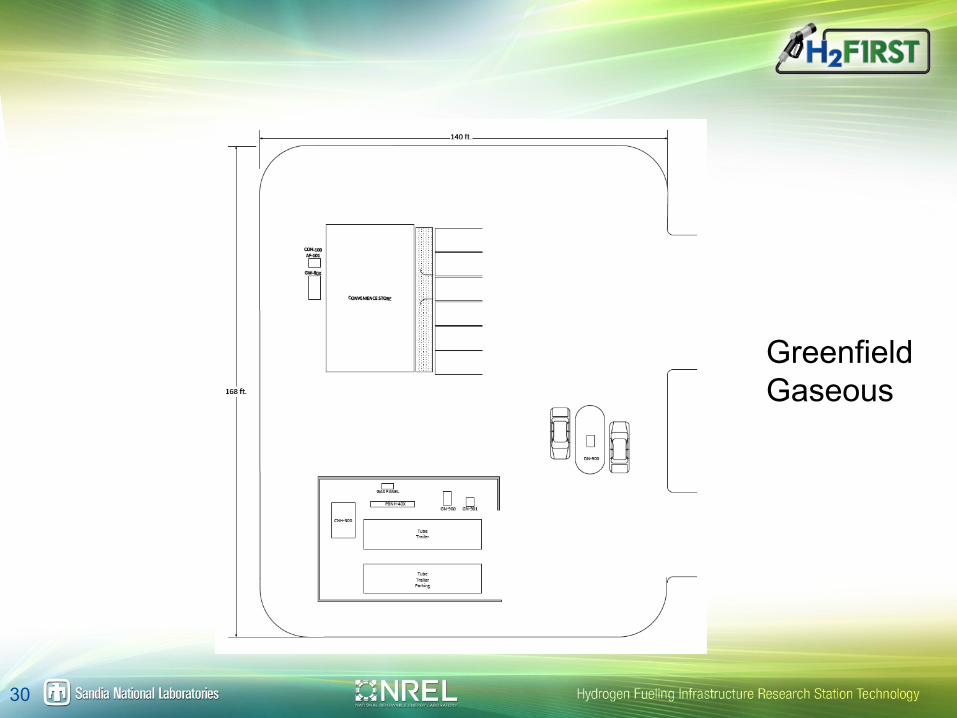
Greenfield Gaseous
30
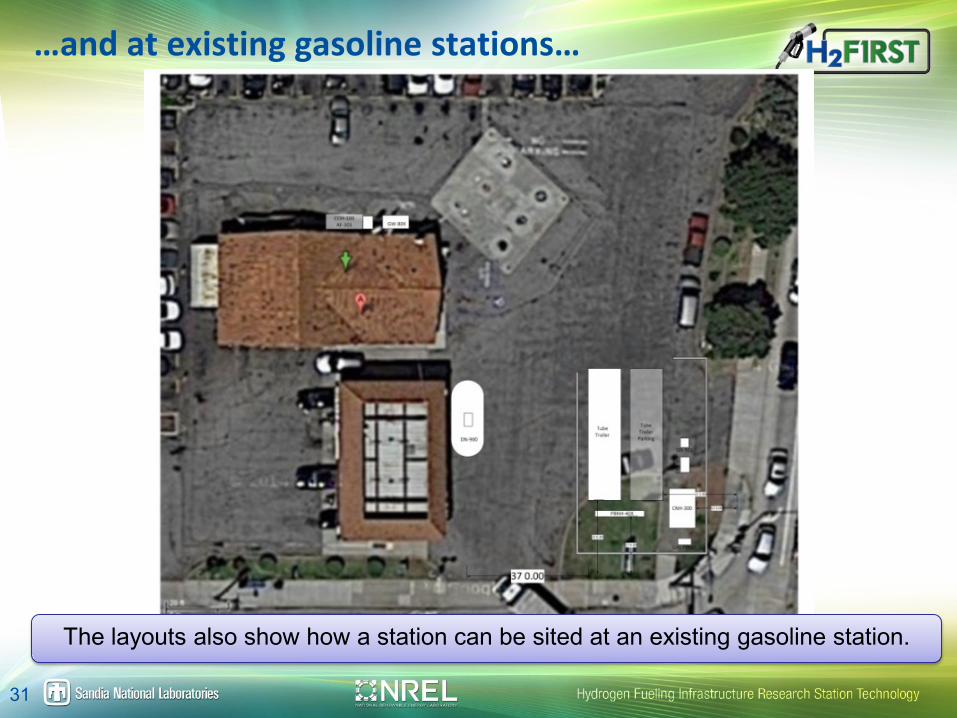
…and at existing gasoline stations…
The layouts also show how a station can be sited at an existing gasoline station.
31
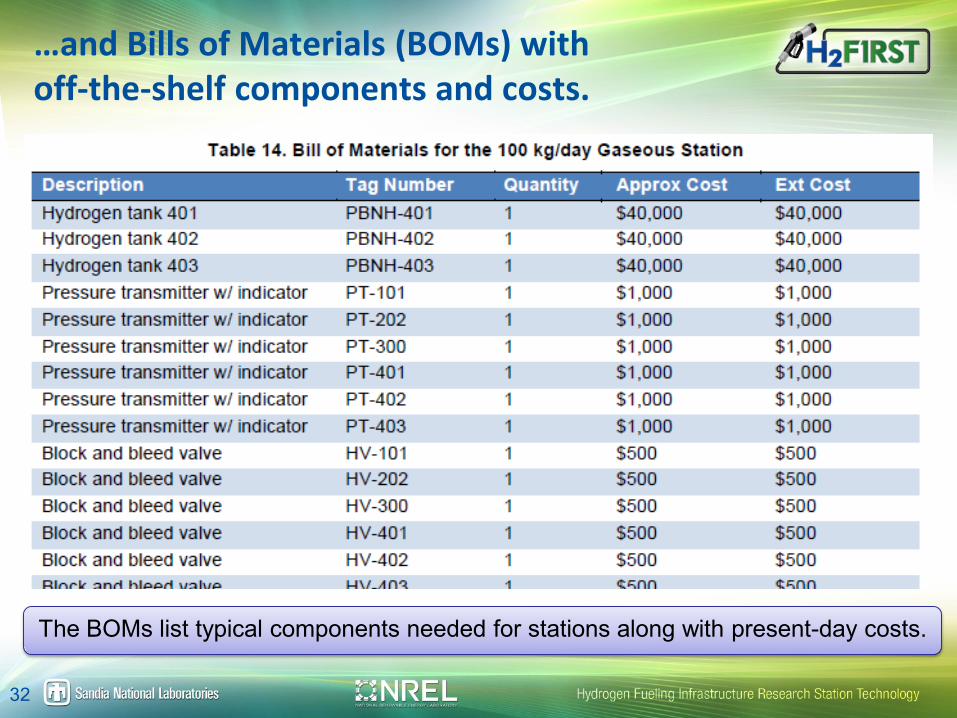
…and Bills of Materials (BOMs) with off-the-shelf components and costs.
The BOMs list typical components needed for stations along with present-day costs.
32
CONCLUSIONS AND FUTURE STEPS
33
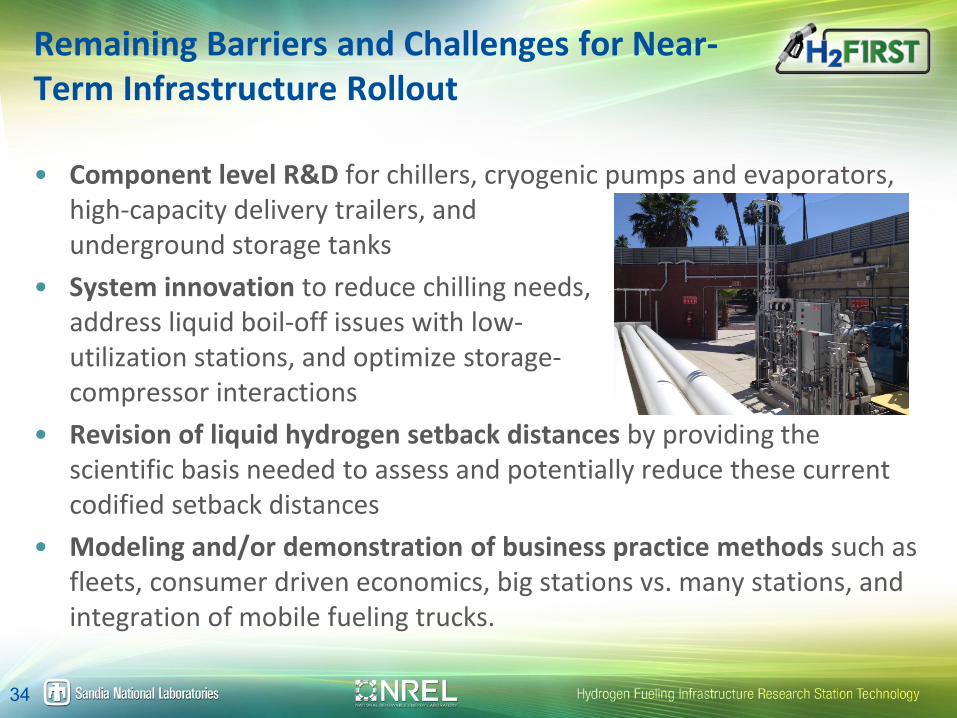
Remaining Barriers and Challenges for Near-Term Infrastructure Rollout
• Component level R&D for chillers, cryogenic pumps and evaporators, high-capacity delivery trailers, and underground storage tanks
• System innovation to reduce chilling needs, address liquid boil-off issues with low- utilization stations, and optimize storage- compressor interactions
• Revision of liquid hydrogen setback distances by providing the scientific basis needed to assess and potentially reduce these current codified setback distances
• Modeling and/or demonstration of business practice methods such as fleets, consumer driven economics, big stations vs. many stations, and integration of mobile fueling trucks.
34
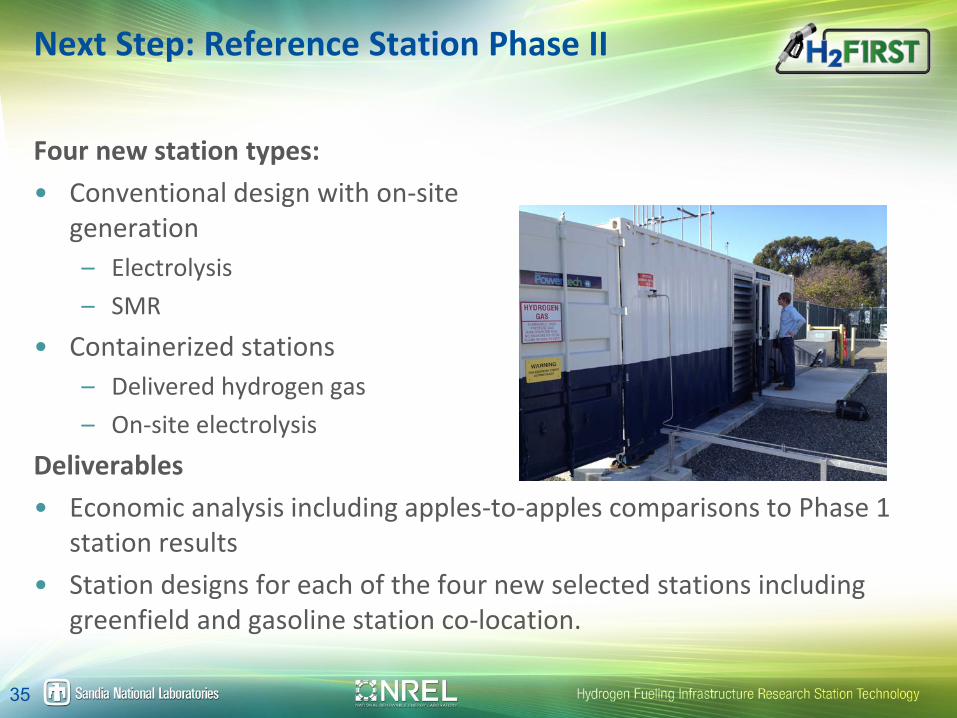
Next Step: Reference Station Phase II
Four new station types: • Conventional design with on-site
generation – Electrolysis – SMR
• Containerized stations – Delivered hydrogen gas – On-site electrolysis
Deliverables • Economic analysis including apples-to-apples comparisons to Phase 1
station results • Station designs for each of the four new selected stations including
greenfield and gasoline station co-location.
35
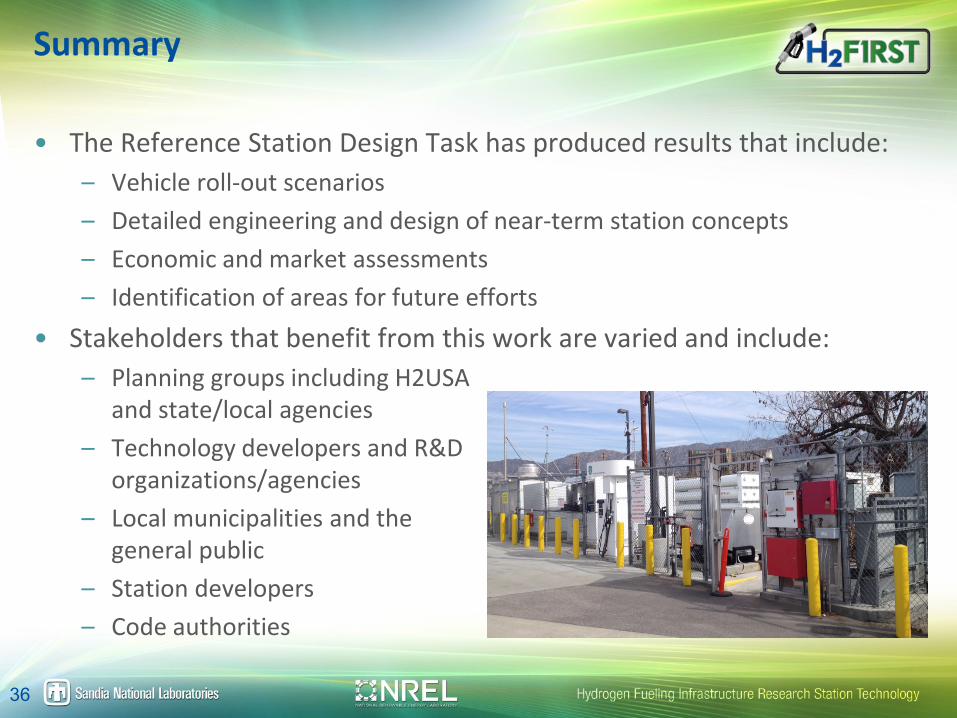
Summary
• The Reference Station Design Task has produced results that include: – Vehicle roll-out scenarios – Detailed engineering and design of near-term station concepts – Economic and market assessments – Identification of areas for future efforts
• Stakeholders that benefit from this work are varied and include: – Planning groups including H2USA
and state/local agencies – Technology developers and R&D
organizations/agencies – Local municipalities and the
general public – Station developers – Code authorities
36
For more information on the Reference Station task:
• Visit the Reference Station website for the final report and to download high-resolution images of the P&IDs – http://www.energy.gov/eere/fuelcells/downloads/h2first-reference-
station-design-task-project-deliverable-2-2 • Contact the Reference Station team:
– Joe Pratt, Sandia • (925) 294-2133 • [email protected]
– Danny Terlip, NREL • (303) 275-4180 • [email protected]
37

Question and Answer
• Please type your questions into the question box
38
Additional Information
• More information located at EERE website!
– http://www.energy.gov/eere/fuelcells/h2first
• DOE Host: Jason Marcinkoski – [email protected]
• Presenter: Joe Pratt – [email protected]
• Webinar Host: – [email protected]
• H2FIRST Contacts
– Alex Schroeder, National Renewable Energy Laboratory • 303-275-3790 • [email protected]
– Rachel Wallace, Strategic
Partnerships, Sandia National Laboratories • 925-294-4896 • [email protected]
39