Embed Size (px)
Citation preview

Marine Geology 357 (2014) 12–24
Contents lists available at ScienceDirect
Marine Geology
j ourna l homepage: www.e lsev ie r .com/ locate /margeo
REE partitioning in riverine sediments around the Yellow Sea and itsimportance in shelf sediment provenance
Dhongil Lim a,⁎, Hoi Soo Jung b, Jin Yong Choi c
a South Sea Research Institute, Korea Institute of Ocean Science and Technology, Geoje 656-830, Republic of Koreab Marine Environment and Conservation Research Department, Korea Institute of Ocean Science and Technology, Ansan, P.O. Box 29, Seoul 425-600, Republic of Koreac Department of Oceanography, Kunsan National University, Kunsan 573-751, Republic of Korea
⁎ Corresponding author. Tel.: +82 55 639 8580; fax: +E-mail address: [email protected] (D. Lim).
http://dx.doi.org/10.1016/j.margeo.2014.07.0020025-3227/© 2014 Elsevier B.V. All rights reserved.
a b s t r a c t
a r t i c l e i n f oArticle history:Received 14 June 2013Received in revised form 8 May 2014Accepted 5 July 2014Available online 14 July 2014
Communicated by G.J. de Lange
Keywords:rare earth elementsfractionation patternssediment provenanceYellow Sea
We sought to identify the characteristics and their controlling factors of rare earth element (REE) fractionationpatterns in two chemically partitioned (labile and residual) fractions of Korean (KR) and Chinese riverine (CR)sediments. We also investigated their sediment origins in the Yellow Sea based on REE signatures. The resultsshowed that the upper continental crust (UCC)-normalized REE fractionation patternswere remarkably differentfor labile and residual fractions, even between KR and CR sediments. Notably, KR sediments in both residual andlabile fractions exhibited a striking enrichment of light REEs (LREEs), unlike CR sediments, with no obviousfractionation. Such LREE enrichment is relatively much stronger in the coarse-grained sandy sediments. Thepeculiar LREE enrichment in both fractions of KR sediments was preferentially linked to grater felsic graniticcompositions, compared with CR sediments that were close to those of the UCC (granodiorite with relativelymore mafic minerals), consisting of a mixture of various rock types. Application of these REE signatures to theprovenance of Yellow Sea sediments provides an important clue to the cause underlying the lack of correlationbetween the mud budget and the river discharge in Korean coastal regions as well as the ultimate fate of CRsediments. The REE fractionation signals, especially in residual fractions may shed light on the major existingphases affecting REE fractionation as well as the origin of sediments in the Yellow Sea.
82 55 639 8429.
© 2014 Elsevier B.V. All rights reserved.
1. Introduction
Generally, the element compositional characteristics of the parentrock are modified by multiple geochemical and physicochemical pro-cesses (e.g., coagulation, adsorption, flocculation, diagenetic remobiliza-tion, and resuspension) during the transport and/or temporary storageof the sediments in river, estuary and coastal systems (Sholkovitz, 1976;Hoyle et al., 1984; Sholkovitz, 1995; Johannesson et al., 1996; Censiet al., 2004; Marmolejo-Rodriguez et al., 2007; Wang and Liu, 2008).At the site of deposition, also, environmental signatures such asbioclasts, authigenic minerals, and other diagenetic labile fractionsmay be added to the sediments, causing a compositional change thatis essentially unrelated to the initial detrital compositions. In addition,the mixing of detritus derived from multiple sources may modify theinitial sediment characteristics, especially when dispersal pathwaysare complex and involve the recycling of previously deposited sedi-ments (Weltje and von Eynatten, 2004). Because of this complexity,unraveling the provenance using bulk chemical composition of the sed-iments is not straightforward. This challenge in determining sediment
provenance is especially true in the Yellow Sea, which has several poten-tial source rivers and their various spectrums of rock compositions aswellas various coastal and shelf environments with complex current systems(Yang et al., 2003a; Lim et al., 2007). For better understanding of originalcompositions of river sediments, therefore, the sediments should bechemically divided into two fractions at least: the residual (mainly theinitial sediment composition) and the labile fractions, which is sensitiveto changes in the physicochemical environments (Leleyter et al., 1999).
Recent progress in understanding sediment provenance in theYellow Sea has been driven by improved data acquisition and process-ing methods, especially with regard to the elemental compositions(Yang et al., 2003a; Lim et al., 2006; Yang and Youn, 2007; Xu et al.,2009; Jung et al., 2012; Lim et al., 2013). Several elements includingiron (Fe), magnesium (Mg), vanadium (V), thorium (Th), and rareearth elements (REEs), and their ratios to aluminum (Al) have beensuggested as sediment provenance tracers for the Yellow Sea (Choet al., 1999; Yang et al., 2003a; Lim et al., 2006; Xu et al., 2009, 2011).Among these elements, REEs have been preferred as potential tracersfor studying provenance because of their low solubility duringweathering and diagenetic processes (e.g., McLennan, 1989; Singh andRajamani, 2001; Prego et al., 2009; Xu et al., 2009 and references there-in). Despite this, some studies have indicated that REEs may behavenon-conservatively (Braun et al., 1990; Sholkovitz et al., 1994). In

13D. Lim et al. / Marine Geology 357 (2014) 12–24
addition, the sediment grain-size and heavy minerals, together withlarge portion of labile fractions, can exert some influence on the concen-trations and fractionation patterns of REEs, and furthermay badly inter-pret the identification of the sediment source (Song and Choi, 2009;Jung et al., 2012). In this respect, Song and Choi (2009) provided diag-nostic and persuasive information on the existing forms of REEs inboth KRandCR sediments using two- orfive-step leaching experiments.In particular, the authors suggested that the LREE enrichment of KR sed-iments ismost likely related to clayminerals (especially chlorite) for theleached fraction and heavy minerals (i.e., allanite) for the residual frac-tion. However, these minerals, suggested as main contributor to LREEenrichment, are accessory with very low contents in bulk sediments,which exert a minor control on the REE compositions (Yang et al.,2002, 2003a; Cai et al., 2008). In addition, the difference in contents be-tween KR and CR sediments to explain such different REE enrichmentpattern is even not large. The circumstances are demandingmore objec-tive explanation for the obvious difference in REE fractionation patternof two river sediments. Accordingly, their applicability as provenancetracers throughout the Yellow Sea is still questionable (Yang et al.,2003a), even though the potential REE tracers derived from KR and CRsediments have been suggested (Yang et al., 2002, 2003b; Jiang et al.,2009; Xu et al., 2009).
Here, we present the characteristics of REE concentrations and frac-tionation patterns in two partitioning phases (labile and residualphases) of KR and CR, and Yellow Sea shelf sediments. Also constraintsof the REE fractionation patterns are discussed in detail focusing onthe cause of LREE enrichment identified in KR sediments. In addition,
Fig. 1.Map showing major current system and major rivers in the Yellow Sea, and sampling areYellow Sea Warm Currents.
their signals identified in two fractions of river sediments are appliedto the shelf sediments sampled across the entire Yellow Sea to checkthe validity as provenance tracer.
2. Materials and methods
In total, 28 riverine sediment samples were collected from themouths of the Keum (n = 3) and Yeongsan (n = 4) Rivers of Korea,and from the Huanghe (HH, n = 11) and Chanjiang (CJ, n = 10) Riversof China, which are all considered to be major sediment source areasfor the YellowSea (Fig. 1). To test the applicability of potential REE tracerssuggested in this study, 31 surface sediments from the Yellow Sea wereanalyzed along with river sediments (Fig. 1). The sediment grain-sizewas analyzed using the standard dry-sieving technique for the sand frac-tion (b4ϕ) and the pipettemethod for themud fraction (N4ϕ), and tex-tural parameter were calculated using graphic methods (Ingram, 1971).
For the REE analysis [LREEs: La to Nd, middle-REEs (MREES): Sm toDy, and heavy REEs: Ho to Lu], including Al, Fe, titanium (Ti), hafnium(Hf), uranium (U), Th, and zirconium (Zr), the sediments were oven-dried at 60 °C overnight and then powdered and homogenized withan automated agate mortar and pestle. For the REEs, approximately0.2 g of powdered bulk sampleswasweighed out, placed into a graphitecrucible, and blended with 1.0 g of lithium metaborate (LiBO2). Thecombined powderswere then fused at 900 °C for 20min, and the resul-tant cake was cooled and dissolved in 200 ml of cold 5% nitric acid(HNO3). Each solution was analyzed for REE concentrations using in-ductively coupled plasmamass spectrometry (ICP-MS) at theUniversity
as (shaded) in rivers and sampling sites (dots) in the shelf. Isobaths are in meters. YSWC:

Table 1Concentrations of rare earth elements (REEs) and upper continental crust (UCC)-normalized fractionation ratios in leached and residual fractions of Korean and Chinese river sediments.The residual fraction results from the difference in the total and labile fractions. Mz: Mean grain-size, HH: Huanghe, CJ: Changjiang, KR: Korean rivers.
Sediment texture Leached fraction
Sample no. Sand%
Silt%
Clay%
Mzphi
Al%
Fe%
Ti%
Hfppm
Zrppm
Thppm
Uppm
Lappm
Ceppm
Prppm
HH1 23 68 8 5.2 0.56 0.65 0.01 0.10 2.41 2.72 0.35 7.73 15.83 1.98HH2 24 66 10 5.4 0.28 0.40 0.00 0.07 1.90 1.90 0.26 7.03 14.18 1.88HH3 19 73 8 5.2 0.44 0.97 0.02 0.13 2.85 2.90 0.47 8.09 16.88 2.07HH4 52 44 4 4.4 0.42 0.48 0.01 0.18 2.24 2.39 0.35 8.00 15.90 2.06HH5 27 64 9 5.2 0.45 0.72 0.01 0.10 2.69 2.78 0.40 8.10 16.44 2.04HH6 11 77 12 5.7 0.50 0.66 0.01 0.05 1.61 2.80 0.37 9.26 19.42 2.45HH7 11 78 11 5.7 0.35 0.86 0.02 0.06 1.97 2.94 0.42 9.05 18.86 2.35HH8 10 77 14 5.9 0.40 0.81 0.01 0.07 1.68 3.01 0.42 9.40 19.66 2.44HH9 28 65 7 4.9 0.53 0.63 0.01 0.11 2.17 2.68 0.37 7.61 15.55 1.97HH10 26 68 6 4.9 0.46 0.61 0.01 0.07 1.98 2.74 0.34 7.17 14.65 1.86HH11 22 72 6 4.9 0.40 0.53 0.01 0.08 1.48 2.19 0.32 6.81 13.92 1.77CJ1 12 70 18 6.1 0.56 1.13 0.02 0.04 0.85 1.91 0.54 10.26 23.54 2.90CJ2 6 78 17 6.2 0.45 1.05 0.02 0.07 0.78 2.38 0.35 9.71 22.06 2.68CJ3 1 70 30 7.3 0.67 1.53 0.02 0.03 0.55 2.31 0.55 16.02 37.73 4.48CJ4 3 72 26 6.9 0.53 1.37 0.02 0.04 0.99 2.91 0.55 12.59 29.23 3.58CJ5 8 75 17 6.1 0.48 1.12 0.01 0.03 0.85 2.00 0.45 9.72 21.59 2.67CJ6 5 71 24 6.7 0.48 1.25 0.02 0.09 0.98 2.29 0.63 12.05 28.84 3.43CJ7 9 80 11 5.7 0.34 0.98 0.01 0.04 0.93 1.60 0.41 8.71 19.86 2.46CJ8 4 76 20 6.5 0.47 1.12 0.02 0.03 0.66 1.89 0.44 11.60 26.93 3.26CJ9 3 78 19 6.4 0.44 0.99 0.01 0.04 0.65 2.00 0.35 10.64 24.28 2.98CJ10 11 77 13 5.8 0.47 1.20 0.02 0.05 0.56 2.09 0.41 10.23 23.72 2.91KR1 0 40 59 7.9 0.58 1.16 0.02 0.00 0.25 1.14 0.53 16.10 33.75 3.92KR2 0 51 49 8.8 0.52 0.94 0.01 0.00 0.24 1.29 0.65 14.41 30.62 3.57KR3 0 40 59 8.3 0.57 1.05 0.01 0.00 0.22 0.91 0.63 16.49 34.05 4.00KR4 0 36 64 7.0 0.67 1.21 0.02 0.00 0.33 1.60 0.78 19.48 41.20 4.75KR5 0 43 57 8.8 0.58 1.34 0.02 0.00 0.52 1.83 1.02 22.83 47.65 5.31KR6 0 50 50 8.3 0.63 1.32 0.01 0.01 1.14 1.52 1.26 24.13 49.29 5.47KR7 10 57 33 7.1 0.50 0.91 0.02 0.02 0.40 1.49 1.11 19.85 40.50 4.56
Residual fractionHH1 4.94 1.70 0.35 4.43 132.0 6.78 2.02 21.21 43.23 4.80HH2 4.89 1.86 0.39 5.76 151.9 11.33 2.40 27.29 55.03 6.21HH3 4.78 1.37 0.31 3.30 106.7 6.39 1.71 19.65 39.25 4.45HH4 4.73 1.62 0.34 5.38 154.8 7.37 1.99 23.10 45.80 5.23HH5 4.77 1.57 0.31 4.31 145.7 6.53 1.80 20.59 40.33 4.58HH6 5.43 2.21 0.35 3.57 105.1 8.30 2.13 22.38 44.31 4.96HH7 5.63 1.92 0.32 2.68 83.0 6.16 1.59 17.97 35.87 3.86HH8 5.33 2.03 0.31 2.74 83.4 5.98 1.60 17.11 34.11 3.79HH9 4.66 1.64 0.34 4.79 130.3 7.65 1.99 24.67 47.86 5.40HH10 4.91 1.62 0.30 2.95 93.5 5.41 1.58 17.92 36.13 4.05HH11 5.04 1.74 0.28 2.84 90.7 4.97 1.42 14.93 30.04 3.30CJ1 6.17 3.15 0.59 4.57 146.3 10.47 2.76 27.77 52.32 5.84CJ2 6.17 2.48 0.48 3.62 124.1 9.10 2.16 25.58 47.99 5.38CJ3 8.46 4.24 0.62 4.23 139.2 14.44 2.75 28.16 52.00 5.37CJ4 7.33 3.66 0.62 4.25 148.2 11.61 2.71 28.84 53.75 5.57CJ5 6.23 3.31 0.55 4.74 147.4 12.48 2.61 33.37 62.94 6.94CJ6 6.82 3.51 0.65 4.38 141.2 12.18 2.85 31.96 58.30 6.44CJ7 5.96 2.59 0.49 4.12 130.2 10.34 2.17 27.64 52.25 5.68CJ8 6.58 3.24 0.59 4.98 155.0 12.65 2.78 31.13 59.60 6.29CJ9 7.12 3.22 0.50 3.60 117.4 11.16 3.64 26.47 48.72 5.26CJ10 6.35 2.96 0.59 4.75 156.7 12.07 2.79 31.57 59.31 6.47KR1 8.66 2.99 0.48 3.85 129.6 14.01 2.67 29.50 51.67 6.66KR2 7.81 2.62 0.37 3.91 130.8 13.13 2.69 29.78 54.58 6.84KR3 8.74 3.12 0.38 3.86 134.7 14.81 2.84 30.77 55.84 6.39KR4 9.24 3.24 0.48 3.18 114.6 14.27 2.52 26.08 46.15 6.50KR5 8.99 3.03 0.45 3.82 130.6 16.56 3.03 29.21 47.65 5.55KR6 9.76 3.22 0.51 3.70 123.4 17.77 3.24 28.58 48.65 6.27KR7 8.55 2.65 0.43 3.84 130.0 14.86 2.91 27.14 50.49 5.96
14 D. Lim et al. / Marine Geology 357 (2014) 12–24
of London. The validity of the analytical procedure was evaluated byaccuracy and precision tests conducted on the reference sample MAG-1 (n= 8). The accuracy and precision for most elements were between5% and 10%, indicating satisfactory data acquisition. Powdered bulk sed-iments (approximately 0.2 g)were leachedwith 20ml 1 N hydrochloricacid (HCl) for 24 h at room temperature to determine the REE concen-trations in the labile fraction (Yang et al., 2004; Song and Choi, 2009).
After being run through a centrifuge, the supernatants (solutions)were analyzed for leachable concentrations of REEs using ICP-MS atthe Korea Basic Science Institute (KBSI) in Daejeon, Korea. Interferencecorrection factors were determined by analysis of 100 ng/ml Ba, Ceand Nd standard solutions and applied to all samples. Precision testsconducted on the reference sampleMAG-1 (n=6) during leachingpro-cess showed that the analytical uncertainty was estimated to be less
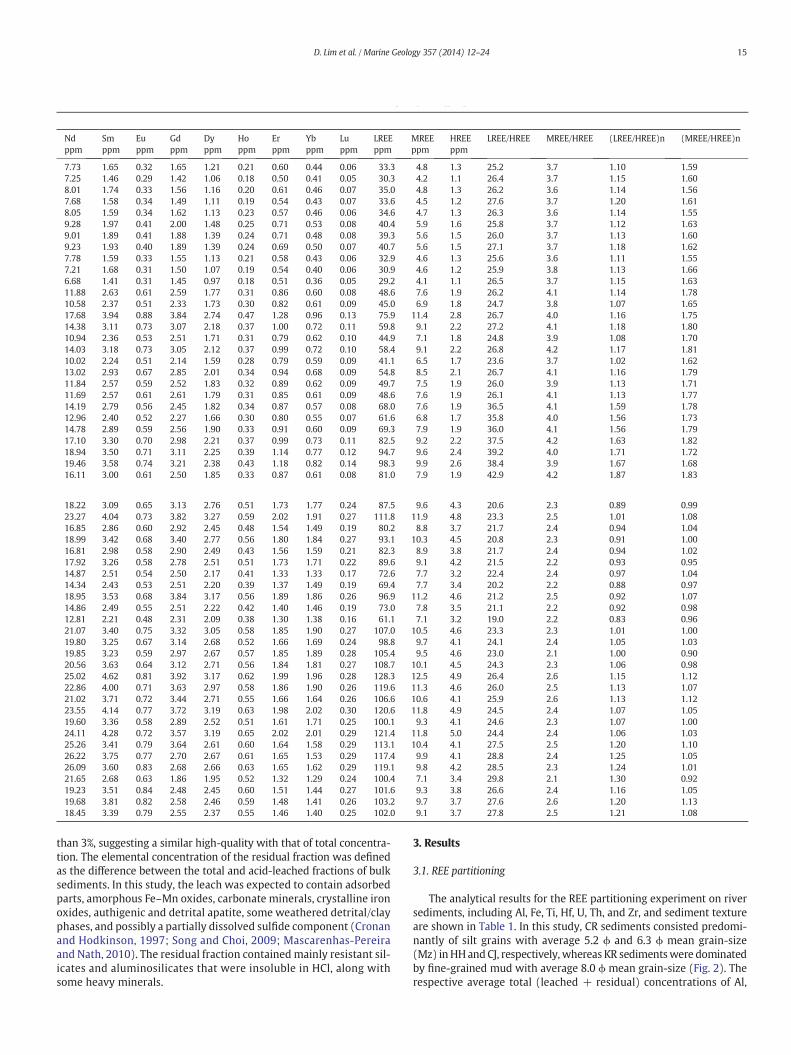
Table 1Concentrations of rare earth elements (REEs) and upper continental crust (UCC)-normalized fractionation ratios in leached and residual fractions of Korean and Chinese river sediments.The residual fraction results from the difference in the total and labile fractions. HH: Huanghe, CJ: Changjiang, KR: Korean rivers.
Ndppm
Smppm
Euppm
Gdppm
Dyppm
Hoppm
Erppm
Ybppm
Luppm
LREEppm
MREEppm
HREEppm
LREE/HREE MREE/HREE (LREE/HREE)n (MREE/HREE)n
7.73 1.65 0.32 1.65 1.21 0.21 0.60 0.44 0.06 33.3 4.8 1.3 25.2 3.7 1.10 1.597.25 1.46 0.29 1.42 1.06 0.18 0.50 0.41 0.05 30.3 4.2 1.1 26.4 3.7 1.15 1.608.01 1.74 0.33 1.56 1.16 0.20 0.61 0.46 0.07 35.0 4.8 1.3 26.2 3.6 1.14 1.567.68 1.58 0.34 1.49 1.11 0.19 0.54 0.43 0.07 33.6 4.5 1.2 27.6 3.7 1.20 1.618.05 1.59 0.34 1.62 1.13 0.23 0.57 0.46 0.06 34.6 4.7 1.3 26.3 3.6 1.14 1.559.28 1.97 0.41 2.00 1.48 0.25 0.71 0.53 0.08 40.4 5.9 1.6 25.8 3.7 1.12 1.639.01 1.89 0.41 1.88 1.39 0.24 0.71 0.48 0.08 39.3 5.6 1.5 26.0 3.7 1.13 1.609.23 1.93 0.40 1.89 1.39 0.24 0.69 0.50 0.07 40.7 5.6 1.5 27.1 3.7 1.18 1.627.78 1.59 0.33 1.55 1.13 0.21 0.58 0.43 0.06 32.9 4.6 1.3 25.6 3.6 1.11 1.557.21 1.68 0.31 1.50 1.07 0.19 0.54 0.40 0.06 30.9 4.6 1.2 25.9 3.8 1.13 1.666.68 1.41 0.31 1.45 0.97 0.18 0.51 0.36 0.05 29.2 4.1 1.1 26.5 3.7 1.15 1.6311.88 2.63 0.61 2.59 1.77 0.31 0.86 0.60 0.08 48.6 7.6 1.9 26.2 4.1 1.14 1.7810.58 2.37 0.51 2.33 1.73 0.30 0.82 0.61 0.09 45.0 6.9 1.8 24.7 3.8 1.07 1.6517.68 3.94 0.88 3.84 2.74 0.47 1.28 0.96 0.13 75.9 11.4 2.8 26.7 4.0 1.16 1.7514.38 3.11 0.73 3.07 2.18 0.37 1.00 0.72 0.11 59.8 9.1 2.2 27.2 4.1 1.18 1.8010.94 2.36 0.53 2.51 1.71 0.31 0.79 0.62 0.10 44.9 7.1 1.8 24.8 3.9 1.08 1.7014.03 3.18 0.73 3.05 2.12 0.37 0.99 0.72 0.10 58.4 9.1 2.2 26.8 4.2 1.17 1.8110.02 2.24 0.51 2.14 1.59 0.28 0.79 0.59 0.09 41.1 6.5 1.7 23.6 3.7 1.02 1.6213.02 2.93 0.67 2.85 2.01 0.34 0.94 0.68 0.09 54.8 8.5 2.1 26.7 4.1 1.16 1.7911.84 2.57 0.59 2.52 1.83 0.32 0.89 0.62 0.09 49.7 7.5 1.9 26.0 3.9 1.13 1.7111.69 2.57 0.61 2.61 1.79 0.31 0.85 0.61 0.09 48.6 7.6 1.9 26.1 4.1 1.13 1.7714.19 2.79 0.56 2.45 1.82 0.34 0.87 0.57 0.08 68.0 7.6 1.9 36.5 4.1 1.59 1.7812.96 2.40 0.52 2.27 1.66 0.30 0.80 0.55 0.07 61.6 6.8 1.7 35.8 4.0 1.56 1.7314.78 2.89 0.59 2.56 1.90 0.33 0.91 0.60 0.09 69.3 7.9 1.9 36.0 4.1 1.56 1.7917.10 3.30 0.70 2.98 2.21 0.37 0.99 0.73 0.11 82.5 9.2 2.2 37.5 4.2 1.63 1.8218.94 3.50 0.71 3.11 2.25 0.39 1.14 0.77 0.12 94.7 9.6 2.4 39.2 4.0 1.71 1.7219.46 3.58 0.74 3.21 2.38 0.43 1.18 0.82 0.14 98.3 9.9 2.6 38.4 3.9 1.67 1.6816.11 3.00 0.61 2.50 1.85 0.33 0.87 0.61 0.08 81.0 7.9 1.9 42.9 4.2 1.87 1.83
18.22 3.09 0.65 3.13 2.76 0.51 1.73 1.77 0.24 87.5 9.6 4.3 20.6 2.3 0.89 0.9923.27 4.04 0.73 3.82 3.27 0.59 2.02 1.91 0.27 111.8 11.9 4.8 23.3 2.5 1.01 1.0816.85 2.86 0.60 2.92 2.45 0.48 1.54 1.49 0.19 80.2 8.8 3.7 21.7 2.4 0.94 1.0418.99 3.42 0.68 3.40 2.77 0.56 1.80 1.84 0.27 93.1 10.3 4.5 20.8 2.3 0.91 1.0016.81 2.98 0.58 2.90 2.49 0.43 1.56 1.59 0.21 82.3 8.9 3.8 21.7 2.4 0.94 1.0217.92 3.26 0.58 2.78 2.51 0.51 1.73 1.71 0.22 89.6 9.1 4.2 21.5 2.2 0.93 0.9514.87 2.51 0.54 2.50 2.17 0.41 1.33 1.33 0.17 72.6 7.7 3.2 22.4 2.4 0.97 1.0414.34 2.43 0.53 2.51 2.20 0.39 1.37 1.49 0.19 69.4 7.7 3.4 20.2 2.2 0.88 0.9718.95 3.53 0.68 3.84 3.17 0.56 1.89 1.86 0.26 96.9 11.2 4.6 21.2 2.5 0.92 1.0714.86 2.49 0.55 2.51 2.22 0.42 1.40 1.46 0.19 73.0 7.8 3.5 21.1 2.2 0.92 0.9812.81 2.21 0.48 2.31 2.09 0.38 1.30 1.38 0.16 61.1 7.1 3.2 19.0 2.2 0.83 0.9621.07 3.40 0.75 3.32 3.05 0.58 1.85 1.90 0.27 107.0 10.5 4.6 23.3 2.3 1.01 1.0019.80 3.25 0.67 3.14 2.68 0.52 1.66 1.69 0.24 98.8 9.7 4.1 24.1 2.4 1.05 1.0319.85 3.23 0.59 2.97 2.67 0.57 1.85 1.89 0.28 105.4 9.5 4.6 23.0 2.1 1.00 0.9020.56 3.63 0.64 3.12 2.71 0.56 1.84 1.81 0.27 108.7 10.1 4.5 24.3 2.3 1.06 0.9825.02 4.62 0.81 3.92 3.17 0.62 1.99 1.96 0.28 128.3 12.5 4.9 26.4 2.6 1.15 1.1222.86 4.00 0.71 3.63 2.97 0.58 1.86 1.90 0.26 119.6 11.3 4.6 26.0 2.5 1.13 1.0721.02 3.71 0.72 3.44 2.71 0.55 1.66 1.64 0.26 106.6 10.6 4.1 25.9 2.6 1.13 1.1223.55 4.14 0.77 3.72 3.19 0.63 1.98 2.02 0.30 120.6 11.8 4.9 24.5 2.4 1.07 1.0519.60 3.36 0.58 2.89 2.52 0.51 1.61 1.71 0.25 100.1 9.3 4.1 24.6 2.3 1.07 1.0024.11 4.28 0.72 3.57 3.19 0.65 2.02 2.01 0.29 121.4 11.8 5.0 24.4 2.4 1.06 1.0325.26 3.41 0.79 3.64 2.61 0.60 1.64 1.58 0.29 113.1 10.4 4.1 27.5 2.5 1.20 1.1026.22 3.75 0.77 2.70 2.67 0.61 1.65 1.53 0.29 117.4 9.9 4.1 28.8 2.4 1.25 1.0526.09 3.60 0.83 2.68 2.66 0.63 1.65 1.62 0.29 119.1 9.8 4.2 28.5 2.3 1.24 1.0121.65 2.68 0.63 1.86 1.95 0.52 1.32 1.29 0.24 100.4 7.1 3.4 29.8 2.1 1.30 0.9219.23 3.51 0.84 2.48 2.45 0.60 1.51 1.44 0.27 101.6 9.3 3.8 26.6 2.4 1.16 1.0519.68 3.81 0.82 2.58 2.46 0.59 1.48 1.41 0.26 103.2 9.7 3.7 27.6 2.6 1.20 1.1318.45 3.39 0.79 2.55 2.37 0.55 1.46 1.40 0.25 102.0 9.1 3.7 27.8 2.5 1.21 1.08
15D. Lim et al. / Marine Geology 357 (2014) 12–24
than 3%, suggesting a similar high-quality with that of total concentra-tion. The elemental concentration of the residual fraction was definedas the difference between the total and acid-leached fractions of bulksediments. In this study, the leach was expected to contain adsorbedparts, amorphous Fe–Mn oxides, carbonate minerals, crystalline ironoxides, authigenic and detrital apatite, some weathered detrital/clayphases, and possibly a partially dissolved sulfide component (Cronanand Hodkinson, 1997; Song and Choi, 2009; Mascarenhas-Pereiraand Nath, 2010). The residual fraction contained mainly resistant sil-icates and aluminosilicates that were insoluble in HCl, along withsome heavy minerals.
3. Results
3.1. REE partitioning
The analytical results for the REE partitioning experiment on riversediments, including Al, Fe, Ti, Hf, U, Th, and Zr, and sediment textureare shown in Table 1. In this study, CR sediments consisted predomi-nantly of silt grains with average 5.2 ϕ and 6.3 ϕ mean grain-size(Mz) inHHandCJ, respectively, whereas KR sedimentswere dominatedby fine-grained mud with average 8.0 ϕ mean grain-size (Fig. 2). Therespective average total (leached + residual) concentrations of Al,

Fig. 2. Sediment texture and mean grain-size of river and shelf sediments. HH: Huanghe, CJ: Changjiang, KR: Korean rivers, Y: Yellow Sea shelf.
16 D. Lim et al. / Marine Geology 357 (2014) 12–24
Fe, Ti, and Zr were 9.40 ± 0.65%, 4.11 ± 0.40%, 0.46± 0.05%, and 128.1± 6.6 ppm, respectively, in KR sediments; 5.51 ± 0.33%, 2.42 ±0.27%,0.34 ± 0.03%, and 118.2 ± 27.9 ppm, respectively, in HH sediments;and 7.21 ± 0.82%, 4.41 ± 0.66%, 0.58 ± 0.06%, and 141.4 ±13.0 ppm, respectively, in CJ sediments. The ΣREE concentration of thetotal fraction was highest in KR sediments (average 211 ± 10 ppm),followed by CJ (average 190 ± 16 ppm) and then HH (average 137 ±16 ppm) sediments. All the river sediments were greatly enriched byLREEs; the LREE/HREE ratios were the highest in the KR sediments(30.3–33.0) and relatively low in both CJ (24.1–26.2) and HH(20.9–23.9) sediments of the China.
The relative percentages of the leached fraction for Al, Ti, and Zrwere less than 10%, 5%, and 2%, respectively, in all rivers, implying thatthe amount of weathered detrital phases dissolved by the acidicsolution was less in the REE concentrations of the leached fraction. Incontrast, the percentages of leached Fe concentrations ranged between18% and 42% in all the river sediments, indicating that large contribu-tions of Fe were made by reactive phases. The relative percentages ofthe leached fraction for each REE ranged from 27% (Lu) to 52% (Gd) inKR sediments, 27% (Lu and Yb) to 48% (Eu) in CJ sediments, and 22%(Yb) to 37% (Eu) in HH sediments. MREEs were much more prone toacid leaching than the other elements in all the rivers (Fig. 3). Inthe leached fraction, the ΣREE concentration was also the highest inthe KR sediments (average 89.9 ± 15.3 ppm) and relatively low in theCJ (average 62.8 ± 11.9 ppm) and HH sediments (average 40.8 ±4.7 ppm; Table 1). The leached REE concentrations accounted for an
Fig. 3. Relative percent of the leached fraction for rare earth elements (REEs) in riv
average of 43%, 33%, and 30% of the total concentration in the KR, CJ,and HH sediments, respectively. Overall, LREEs were more enrichedthan HREEs; the LREE/HREE ratios were much higher in the KR(35.8–42.9 in range) than in CR sediments (23.6–27.6 in range;Table 1). REE (especially LREE) concentrations in the leached fractionshowed a fairly close positive correlation with sediment grain-size andFe concentrations, although KR sediments in case of grain size deviatedslightly from the regression line (Fig. 4a and b). Notably reactive Fephases such as amorphous iron-oxides are major contributor in REEenrichment of labile fractions.
Unlike the leached fraction, the ΣREE concentration of the residualfraction was relatively high in KR (average 121 ± 9 ppm) and CJ (aver-age 127 ± 11 ppm) sediments and low in HH sediments (average 96 ±16 ppm; Table 2). In the residual fraction, in particular, no correlationwas observed between REE concentration and grain size for any riversediments (Fig. 4a), indicating that the sediment grain-size may play aminor role in controlling residual REEs. However, heavy mineral-associated elements (Ti, Zr, Hf, Th, and U) showed a fairly close positivecorrelation with REE concentration in the residual fraction. Togetherwith some contributions of Fe in LREEs, this pattern suggests that theincreases in REE concentration are closely related to heavy mineralcontents (Fig. 4b and c). The residual fractions in all river sedimentsalso exhibited LREE enrichment. The LREE/HREE ratios ranged from26.6 to 29.8 (average 28.1), 23.0 to 26.4 (average 24.6), and 19.0to 23.3 (average 21.2) in KR, CJ, and HH sediments, respectively(Table 1). Although the REE concentrations in the residual fraction
er sediments. The Korean river sediments in all REEs have the highest value.

Fig. 4. Correlations between (a) the rare earth element (REE) concentrations and mean grain-size, (b) the concentrations of REEs and Fe and (c) heavy mineral-associated elements(Hf + Zr + Th + U) in leached and residual fractions of river sediments.
17D. Lim et al. / Marine Geology 357 (2014) 12–24
were similar between KR and CJ sediments, the LREE/HREE ratio washigher in KR sediments, as shown in the leached fraction.
3.2. UCC-normalized REEs distribution pattern
In the UCC-normalized distribution pattern of REEs, the river sedi-ments display remarkably different patterns in leached and/or residualfractions, as was the case in KR and CR sediments (Fig. 5a to c). In theleached fraction, KR sediments showed a remarkable LREE and MREEenrichment relative to HREEs, with a range of 1.56–1.87 (average1.65) in the (LREE/HREE)n and (LREE/HREE)river/(LREE/HREE)ucc ratiosand 1.68–1.83 (average 1.76) in the (MREE/HREE)n ratio (Table 1).However, both CR sediments were strongly fractionated by LREEsand HREEs with MREE enrichment, resulting in a convex up pattern,albeit at different absolute concentrations (Fig. 5b), with a range of1.02–1.20 (average 1.14) in the (LREE/HREE)n ratio and 1.55–1.81 (av-erage 1.67) in the (MREE/HREE)n ratio (Table 1). In residual fractions,meanwhile, KR sediments showed LREE enrichment relative to HREEs,with the (LREE/HREE)n values ranging from 1.16 to 1.30 (average1.22), as in the leached fraction. However, these patterns did not indi-cate significantMREE (e.g., Gd and Dy) enrichment (Fig. 5c). For CR sed-iments, the UCC-normalized pattern of the residual fraction was nearlyflat [average 1.00 and 1.02 in (LREE/HREE)n and (MREE/HREE)n,respectively], indicating that the river sediments were similar to theUCC composition, even though the concentrations were relatively lowin HH sediments. The characteristics of the river sediments in theUCC-normalized REE patterns were consistent with those in previousstudies (Yang et al., 2002; Xu et al., 2009), although there were relativedifferences in their values or concentrations because of the difference insediment grain-size and heavymineral contents (Yang et al., 2002; Song
and Choi, 2009; Jung et al., 2012). For the LREE enrichment observedin Korean sediments, approximately 60% was contributed from theleached fraction when the contribution was estimated using a two-end member mixing model based on the (LREE/HREE)n ratio.
4. Discussion
4.1. REE fractionation enrichments in river sediments and their implications
4.1.1. Enrichment of LREEs in residual fraction of Korean river sedimentsGenerally, the REEs in world river sediments show unique fraction-
ation patterns of their own. For example, the LREE enrichment in UCC-normalized REE patterns has been observed for other large- to small-scale rivers, including in sediments of the Amazon River (Yang et al.,2003b), while the MREE enrichment in sediments of the Mississippiand Indus (Yang et al., 2003b), and Changjiang and Huanghe (Yanget al., 2002; Xu et al., 2009) rivers, as well as other small-scale rivers(e.g., the Gaoping River in Taiwan and the Chambal River in India;Chung et al., 2009 and Rengarajan and Sarin, 2004, respectively).In this study, KR sediments in the residual fraction also exhibited pecu-liar enrichment of LREEs, whereas all CR sediments were flat, with noobvious REE fractionation, indicating a distinct difference in the detritalmineralogical compositions of two river sediments (Fig. 5). This phe-nomenon was distinctly observed in the suspended matters (Yanget al., 2003b) and fine-grained sediments (b20 μm) (Song and Choi,2009) from the rivers as well as their source rocks (Xu et al., 2009,Fig. 5d). Song and Choi (2009) noted that the pronounced LREE enrich-ment in KR sediments was due to REE-rich clay minerals (especiallychlorite) for acid-leachable fractions and Ca-associated heavy mineralssuch as allanite for the residual fractions. As mentioned above,

Table 2Concentrations of rare earth elements (REEs) andupper continental crust (UCC)-normalized fractionation ratios in leached and residual fractions of surficial sediments from theYellow Seashelf. The residual fraction results from the difference in the total and labile fractions.
Sediment texture Leached fraction
Station no. Sand%
Silt%
Clay%
Mzphi
Al%
Fe%
Ti%
Hfppm
Zrppm
Thppm
Uppm
Lappm
Ceppm
Prppm
Y1 4 46 50 8.0 0.62 1.06 0.01 0.00 0.58 0.38 0.40 17.59 37.21 4.40Y2 0 59 41 7.3 0.65 1.11 0.01 0.02 0.60 0.58 0.44 16.04 32.89 3.98Y3 1 30 69 9.5 0.70 1.27 0.01 0.10 0.70 0.61 1.21 15.36 33.19 4.00Y4 0 33 67 9.1 0.81 1.48 0.01 0.01 0.59 0.31 1.92 13.43 29.96 3.51Y5 0 31 69 9.3 0.78 1.50 0.01 0.01 0.51 0.34 1.42 13.45 29.40 3.52Y7 0 39 61 8.9 0.73 1.32 0.01 0.00 0.51 0.28 1.52 13.73 30.21 3.52Y8 0 36 64 8.9 0.72 1.44 0.01 0.03 0.68 0.40 1.25 12.85 27.97 3.35Y10 0 36 64 9.0 0.78 1.45 0.01 0.00 0.59 0.28 1.52 13.39 29.71 3.51Y12 32 27 41 7.0 0.61 1.09 0.01 0.00 0.42 0.42 3.56 13.65 29.33 3.43Y14 89 5 6 1.6 0.16 0.31 0.00 0.00 0.04 0.16 0.21 6.88 15.03 1.65Y16 0 36 64 9.0 0.74 1.51 0.01 0.02 0.66 0.48 0.51 12.48 27.80 3.22Y18 8 39 53 8.3 0.71 1.24 0.01 0.00 0.34 0.31 1.56 12.89 28.31 3.23Y21 3 36 61 8.9 0.67 1.29 0.01 0.00 0.55 0.36 0.82 12.37 27.28 3.16Y22 30 27 43 7.3 0.59 1.03 0.01 0.00 0.35 0.41 1.43 14.00 29.84 3.47Y23 81 8 11 2.5 0.25 0.51 0.01 0.02 0.20 0.43 0.26 10.37 21.92 2.51Y25 59 22 19 2.7 0.36 0.72 0.01 0.01 0.39 0.61 0.29 10.18 21.04 2.50Y27 26 32 42 7.1 0.58 1.06 0.01 0.05 0.53 0.46 2.31 12.78 27.69 3.22Y29 0 56 44 7.4 0.76 1.32 0.02 0.08 0.81 0.91 0.44 16.40 34.96 3.97Y33 – – – – 0.31 0.62 0.01 0.00 0.35 0.41 0.31 11.28 23.80 2.74Y35 0 76 24 6.4 0.62 1.07 0.01 0.00 0.54 1.07 0.31 12.14 25.47 3.07Y36 67 32 1 3.7 0.42 0.99 0.01 0.00 0.64 1.38 0.21 6.88 14.68 1.82Y37 48 51 1 4.0 0.37 0.82 0.01 0.00 0.53 1.18 0.29 6.31 13.04 1.64Y38 28 54 18 4.6 0.46 0.92 0.01 0.00 0.27 0.30 0.33 8.28 17.39 2.11Y39 12 42 46 7.6 0.66 1.35 0.01 0.01 0.48 0.56 0.89 11.05 24.17 2.87Y40 21 33 46 7.6 0.62 1.20 0.01 0.00 0.45 0.50 0.75 11.59 25.31 3.04Y41 0 47 53 8.3 0.68 1.32 0.01 0.07 2.46 0.57 1.35 12.42 26.66 3.18Y42 29 30 41 6.7 0.54 1.02 0.01 0.08 4.77 0.40 1.31 12.11 25.84 3.03Y43 0 54 46 7.7 0.65 1.20 0.01 0.00 0.62 0.55 0.38 14.85 31.26 3.59Y44 71 10 19 2.8 0.32 0.67 0.00 0.00 0.14 0.56 0.67 11.72 24.89 2.86Y45 34 58 8 4.6 0.36 0.72 0.00 0.00 0.33 0.80 0.64 11.58 24.14 2.77
Residual fractionY1 7.17 3.26 0.39 3.54 107.8 13.57 2.16 30.57 42.08 8.58Y2 6.71 2.85 0.07 2.49 77.3 12.33 2.16 32.29 44.27 8.73Y3 7.66 3.41 0.41 3.36 103.3 14.26 2.57 34.02 47.38 8.95Y4 8.03 3.23 0.42 3.13 98.9 14.83 2.72 36.10 49.88 9.43Y5 8.36 3.42 0.45 3.84 115.1 15.12 2.95 36.30 51.14 9.86Y7 8.00 3.16 0.43 4.03 109.0 14.99 2.71 34.19 46.37 9.24Y8 8.24 3.59 0.46 3.05 101.1 13.64 2.61 30.41 45.30 7.46Y10 8.02 3.31 0.43 2.88 93.4 14.22 2.52 29.87 43.52 7.26Y12 7.14 2.56 0.36 3.95 121.8 12.77 2.32 28.90 42.98 7.10Y14 2.97 0.74 0.11 1.73 58.8 7.39 1.07 18.00 28.90 4.05Y16 8.01 3.45 0.13 2.38 83.4 13.38 2.43 30.00 44.85 7.23Y18 7.48 2.83 0.09 2.79 96.5 12.92 2.50 29.97 44.41 7.33Y21 7.98 3.26 0.43 3.13 106.5 13.83 2.56 30.63 45.84 7.30Y22 7.27 2.64 0.38 4.27 123.9 15.04 2.71 35.47 51.15 9.45Y23 4.44 1.39 0.24 4.15 118.7 13.62 1.93 34.75 56.51 9.28Y25 4.94 1.60 0.29 3.01 98.0 14.99 1.83 34.58 55.13 8.17Y27 6.81 2.33 0.04 2.67 86.7 11.97 2.53 29.21 44.77 6.91Y29 7.62 3.00 0.06 2.69 88.2 15.57 2.55 33.31 49.05 8.53Y33 5.77 1.64 0.28 6.22 150.7 15.30 2.54 37.17 58.46 9.93Y35 6.33 2.86 0.38 4.53 131.2 12.48 2.49 29.91 47.29 7.43Y36 4.84 2.18 0.03 0.57 34.4 9.79 2.34 38.69 64.12 9.98Y37 4.72 1.81 0.40 5.16 137.0 10.21 2.18 36.25 58.95 8.92Y38 5.91 1.96 0.34 4.09 117.8 9.36 1.88 28.03 45.82 6.72Y39 7.12 3.07 0.28 3.02 96.7 13.07 2.52 30.25 47.07 7.52Y40 7.06 2.66 0.39 2.88 93.9 12.49 2.17 31.47 47.41 7.75Y41 7.67 2.90 0.41 3.94 119.2 13.47 2.68 30.45 46.52 7.33Y42 7.13 2.64 0.37 3.64 109.0 13.68 2.79 29.76 46.21 7.53Y43 7.60 2.92 0.4 3.82 118.6 14.13 2.41 29.70 45.08 7.50Y44 5.31 1.68 0.25 3.27 96.8 10.96 1.96 26.26 41.91 6.74Y45 5.87 1.86 0.21 2.25 74.3 12.46 1.89 32.41 50.68 8.47
18 D. Lim et al. / Marine Geology 357 (2014) 12–24
however, the total contents of clay minerals and allanite among themineral compositions of river bulk sediments was very low (Yanget al., 2002). In addition, the relative percentage of chlorite was alsolow (12–20% in KR and 8–16% in CR sediments) amongmajor claymin-eral assemblages (illite, kaolinite, chlorite, and smectite; Yang et al.,2003a), and the difference in contents of these accessory minerals,between KR and CR sediments was not even large. So, the hypothesis
of chlorite and allanite contribution related to the LREE enrichment ofKR sediments cannot be certified.
In general, the residue remaining after HCl leaching may containrelatively stable detrital phases such as silicates, aluminosilicates andaccessory resistant minerals (mainly heavy minerals; e.g., Yang et al.,2002; Yang et al., 2004; Mascarenhas-Pereira and Nath, 2010). Asshown in Fig. 4a and c, the REE concentrations in the residual fraction

Table 2Concentrations of rare earth elements (REEs) andupper continental crust (UCC)-normalized fractionation ratios in leached and residual fractions of surficial sediments from theYellow Seashelf. The residual fraction results from the difference in the total and labile fractions.
Ndppm
Smppm
Euppm
Gdppm
Dyppm
Hoppm
Erppm
Ybppm
Luppm
LREEppm
MREEppm
HREEppm
LREE/HREE MREE/HREE (LREE/HREE)n (MREE/HREE)n
15.81 3.17 0.67 2.93 2.16 0.39 1.03 0.79 0.11 75.0 8.9 2.3 32.2 3.8 1.40 1.6714.58 2.95 0.62 2.71 2.00 0.37 0.99 0.74 0.12 67.5 8.3 2.2 30.5 3.7 1.33 1.6314.18 2.98 0.65 2.83 2.14 0.39 1.00 0.74 0.12 66.7 8.6 2.3 29.6 3.8 1.29 1.6613.22 2.74 0.60 2.69 1.92 0.34 0.90 0.66 0.10 60.1 8.0 2.0 30.1 4.0 1.31 1.7313.31 2.80 0.61 2.69 1.99 0.34 0.92 0.67 0.09 59.7 8.1 2.0 29.6 4.0 1.29 1.7413.14 2.74 0.59 2.53 1.83 0.31 0.84 0.55 0.08 60.6 7.7 1.8 33.8 4.3 1.47 1.8712.60 2.67 0.59 2.60 1.93 0.33 0.84 0.59 0.09 56.8 7.8 1.8 30.7 4.2 1.34 1.8313.32 2.75 0.56 2.61 1.83 0.33 0.84 0.62 0.08 59.9 7.8 1.9 32.1 4.2 1.40 1.8112.80 2.63 0.52 2.44 1.70 0.29 0.78 0.51 0.08 59.2 7.3 1.7 35.8 4.4 1.56 1.926.11 1.15 0.23 1.05 0.70 0.11 0.34 0.24 0.03 29.7 3.1 0.7 41.6 4.4 1.81 1.91
12.66 2.73 0.55 2.64 1.83 0.31 0.84 0.56 0.09 56.2 7.7 1.8 31.2 4.3 1.36 1.8712.32 2.45 0.51 2.45 1.79 0.28 0.78 0.58 0.09 56.7 7.2 1.7 32.9 4.2 1.43 1.8112.45 2.65 0.53 2.47 1.82 0.30 0.80 0.58 0.08 55.3 7.5 1.8 31.3 4.2 1.36 1.8412.78 2.63 0.53 2.42 1.73 0.31 0.80 0.61 0.07 60.1 7.3 1.8 33.4 4.1 1.45 1.779.23 1.76 0.38 1.64 1.16 0.21 0.52 0.32 0.05 44.0 4.9 1.1 40.0 4.5 1.74 1.959.11 1.79 0.38 1.66 1.22 0.22 0.58 0.37 0.06 42.8 5.1 1.2 34.9 4.1 1.52 1.79
12.31 2.51 0.55 2.37 1.70 0.29 0.74 0.47 0.08 56.0 7.1 1.6 35.4 4.5 1.54 1.9614.26 2.88 0.62 2.76 2.00 0.35 0.91 0.72 0.10 69.6 8.3 2.1 33.5 4.0 1.46 1.739.97 2.05 0.39 1.83 1.35 0.22 0.61 0.41 0.06 47.8 5.6 1.3 36.8 4.3 1.60 1.88
11.87 2.50 0.51 2.53 1.87 0.33 0.88 0.73 0.10 52.6 7.4 2.0 25.8 3.6 1.12 1.586.92 1.52 0.33 1.56 1.10 0.19 0.54 0.37 0.06 30.3 4.5 1.2 26.1 3.9 1.13 1.696.43 1.34 0.28 1.37 1.04 0.17 0.46 0.34 0.05 27.4 4.0 1.0 26.8 3.9 1.17 1.728.11 1.72 0.36 1.69 1.22 0.21 0.57 0.42 0.05 35.9 5.0 1.2 28.8 4.0 1.25 1.74
10.99 2.35 0.51 2.33 1.67 0.29 0.74 0.59 0.07 49.1 6.9 1.7 29.1 4.1 1.26 1.7711.64 2.50 0.50 2.41 1.74 0.29 0.77 0.52 0.08 51.6 7.1 1.7 31.0 4.3 1.35 1.8712.17 2.54 0.55 2.53 1.78 0.30 0.80 0.61 0.08 54.4 7.4 1.8 30.5 4.1 1.33 1.8011.70 2.34 0.48 2.29 1.65 0.28 0.72 0.52 0.07 52.7 6.8 1.6 33.1 4.2 1.44 1.8513.54 2.72 0.55 2.44 1.88 0.31 0.84 0.64 0.10 63.2 7.6 1.9 33.5 4.0 1.46 1.7510.72 2.20 0.44 2.02 1.36 0.23 0.60 0.44 0.05 50.2 6.0 1.3 38.2 4.6 1.66 1.9910.69 2.15 0.42 2.03 1.43 0.24 0.67 0.52 0.06 49.2 6.0 1.5 32.9 4.0 1.43 1.75
18.43 3.25 0.75 2.13 2.23 0.60 1.46 1.57 0.28 99.7 8.4 3.9 25.5 2.1 1.11 0.9319.76 3.76 0.81 2.48 2.57 0.65 1.62 1.54 0.27 105.0 9.6 4.1 25.8 2.4 1.12 1.0320.09 3.64 0.80 2.35 2.44 0.59 1.57 1.62 0.28 110.4 9.2 4.1 27.2 2.3 1.18 0.9921.19 3.95 0.79 2.40 2.64 0.63 1.62 1.62 0.30 116.6 9.8 4.2 28.0 2.3 1.22 1.0222.94 4.13 0.90 2.66 2.78 0.72 1.81 1.70 0.33 120.2 10.5 4.6 26.4 2.3 1.15 1.0021.59 3.71 0.83 2.47 2.64 0.65 1.70 1.72 0.30 111.4 9.6 4.4 25.5 2.2 1.11 0.9620.65 3.73 0.75 2.38 2.44 0.59 1.68 1.60 0.28 103.8 9.3 4.2 25.0 2.2 1.09 0.9719.82 3.40 0.75 2.34 2.48 0.59 1.60 1.51 0.26 100.5 9.0 4.0 25.3 2.3 1.10 0.9819.70 3.24 0.67 2.06 1.99 0.49 1.29 1.29 0.23 98.7 8.0 3.3 29.9 2.4 1.30 1.0511.35 2.10 0.34 1.35 1.00 0.22 0.49 0.45 0.09 62.3 4.8 1.3 49.7 3.8 2.16 1.6619.80 3.45 0.74 2.25 2.28 0.57 1.51 1.55 0.25 101.9 8.7 3.9 26.2 2.2 1.14 0.9819.98 3.57 0.76 2.29 2.27 0.61 1.55 1.47 0.25 101.7 8.9 3.9 26.2 2.3 1.14 1.0019.79 3.36 0.78 2.33 2.32 0.58 1.58 1.57 0.27 103.6 8.8 4.0 25.9 2.2 1.13 0.9623.73 4.21 0.81 2.79 2.48 0.60 1.60 1.51 0.27 119.8 10.3 4.0 30.2 2.6 1.31 1.1329.84 4.76 0.64 3.33 2.28 0.43 1.15 1.07 0.18 130.4 11.0 2.8 46.1 3.9 2.01 1.6926.49 4.24 0.59 3.10 2.28 0.45 1.18 1.17 0.19 124.4 10.2 3.0 41.5 3.4 1.80 1.4821.18 3.20 0.69 2.53 2.45 0.55 1.56 1.53 0.25 102.1 8.9 3.9 26.2 2.3 1.14 0.9926.73 4.08 0.80 3.04 2.99 0.65 1.76 1.65 0.27 117.6 10.9 4.3 27.2 2.5 1.18 1.1031.18 4.65 0.84 3.59 2.89 0.61 1.58 1.53 0.27 136.7 12.0 4.0 34.3 3.0 1.49 1.3123.84 3.75 0.80 3.13 3.20 0.73 1.90 1.76 0.31 108.5 10.9 4.7 23.0 2.3 1.00 1.0032.46 5.20 1.09 4.04 3.68 0.78 2.06 1.92 0.33 145.3 14.0 5.1 28.5 2.7 1.24 1.1929.45 4.93 1.03 4.05 3.66 0.78 2.17 2.00 0.32 133.6 13.7 5.3 25.3 2.6 1.10 1.1321.40 3.44 0.79 2.75 2.62 0.58 1.46 1.44 0.25 102.0 9.6 3.7 27.3 2.6 1.19 1.1223.95 3.72 0.77 2.95 2.89 0.64 1.74 1.51 0.28 108.8 10.3 4.2 26.1 2.5 1.14 1.0824.31 3.77 0.79 2.77 2.65 0.61 1.60 1.56 0.26 110.9 10.0 4.0 27.5 2.5 1.20 1.0822.94 3.60 0.73 2.69 2.74 0.62 1.65 1.54 0.28 107.2 9.8 4.1 26.3 2.4 1.14 1.0423.52 3.69 0.78 2.73 2.69 0.56 1.60 1.57 0.27 107.0 9.9 4.0 26.7 2.5 1.16 1.0723.41 3.67 0.77 2.93 2.80 0.62 1.74 1.60 0.26 105.7 10.2 4.2 25.0 2.4 1.09 1.0521.26 3.18 0.66 2.26 2.01 0.42 1.09 1.05 0.19 96.2 8.1 2.7 35.0 2.9 1.52 1.2826.71 4.06 0.80 2.86 2.41 0.50 1.25 1.10 0.20 118.3 10.1 3.1 38.7 3.3 1.68 1.44
19D. Lim et al. / Marine Geology 357 (2014) 12–24
of the river sediments are probably constrained by the heavy mineralcontent, but not by the sediment grain-size. Recently, Jung et al.(2012) reported some information on highly LREE-enriched heavymin-erals in core sediments from the Yellow and East China Seas. For exam-ple, the LREE/HRE ratios (25.2–26.6 in the average core values) in bulkheavy minerals were much higher than those of the bulk sediments(15.3–18.9). Therefore, the difference in various accessory heavy
mineral compositions (e.g., monazite, titanite, allanite, and ilmenite)may be responsible for the LREE enrichment of the residual fraction,even though they contribute only approximately 10–20% of the totalREE concentration (Yang et al., 2002; Cai et al., 2008).
Another possibility for the innate differentiation of the patterns be-tween KR and CR sediments can be explained by the bulkmineralogicalcompositions of residual fractions (predominantly quartz, feldspar, and

20 D. Lim et al. / Marine Geology 357 (2014) 12–24
mica). KR sediments are mainly derived from uniform source rock(mainly granite and granitic gneiss), whereas the source rocks of CRsediments are composed of complex and highly diverse lithologies, in-cluding carbonate andmetamorphic rocks, clastic sediments, and loess(Chough et al., 2000; Xu et al., 2009 and references therein). In fact,such a flat fractionation pattern revealed in the final weathered mate-rials (river and clastic sediments and loess) of Chinese source rocks, asshown in Fig. 5, implies that their REE compositions are equivalent tothose of the UCC. Such various origins of source rocks explain whythe geochemical compositions of CR sediments are close to those ofthe UCC, which have a granodioritic bulk composition (Rudnick andGao, 2003). In contrast, the REE compositions of KR sediments are thesame as that of typical igneous rocks (granites) in Korea, which showa strong enrichment of LREEs or depletion of HREEs relative to theUCC (Fig. 5d). This pattern definitely indicates that KR sediments re-flect the REE characteristics of granite in terms of the inheritance ofsediment sources. That is, CR sediments show the character of granodi-orite with relatively more abundant mafic minerals (e.g., plagioclaseand biotite mica) in average mineral composition, whereas KR sedi-ments have mineral composition of granite with more abundant sili-cate contents. According to several studies (e.g., Cullers and Graf,1983; McLennan et al., 1993; Nyakairu and Koeberl, 2001; Sanematsuet al., 2009), usually,more silicic rocks contain higher LREE/HREE ratiosbecause the concentration of LREE in felsic rocks tends to increaserelative to the HREE concentration. Therefore, these REE fractionationcharacteristics in the residual fractionmay occur because KR sedimentshave greater felsic compositions on average compared to CR sedimentsor the UCC.
This interpretation is clearly supported by the correlation betweenthe (LREEs/HREEs)ucc ratio and the sediment grain-size in the residualfraction (Fig. 6). Characteristically, the ratio of (LREE/HREE)ucc wasmuch higher in coarse-grained sand sediments, with low clay andheavy mineral contents than in silt- and clay-dominated sediments.This ratio reached approximately 2.2 in coarse sand sediments but grad-ually decreases to about 1.0 in fine sand sediments (approximately 4 ϕin mean grain-size). The ratio was then constant in a range of approxi-mately 1.0–1.3 with increasingmud content. Stronger LREE enrichmentoccurred in coarse sands that consistedmainly of uniform lightminerals(i.e., a more felsic composition) compared to silt and clay sediments,with various mineral compositions including light, heavy, and clayminerals. This strong LREE enrichment in the residual fraction of KRsediments may be due to the intensive silicate weathering of the felsicrocks (McLennan, 1989). Our results hence suggest that the LREEenrichment signal (LREE/HREE ratio and fractionation ratios) in the re-sidual fractions can be used as a better tracer for the sediment prove-nance, than the signal in bulk sediments. However, these potentialtracers should be used cautiously in sandy shelf areas with the stronghydrodynamic sorting process of the sediments, because they areconstrained not by the source rock but by coarse sands and/or HREE-enriched heavy minerals (e.g., zircon and garnet).
4.1.2. Enrichments of LREEs and MREEs in labile fraction of river sedimentsUnlike CR sediments with MREE enrichment, KR sediments are
characterized by pronounced LREE enrichment in leached fraction(Fig. 5). Although clay particles can cause the LREE enrichment be-cause of their strong adsorption properties (Byrne and Kim, 1990;Koeppenkastrop and De Carlo, 1992; Sholkovitz, 1992; Sholkovitzet al., 1994), the LREE enrichment in the ion-exchange fraction wasnot observed in any KR and CR sediments (Song and Choi, 2009).As shown in Fig. 6, in addition, the ratio of (LREE/HREE)ucc in theleached fraction was much higher in coarse sand fractions than insilt- and clay-dominated fractions, even though the magnitude wasrelatively low compared with those of the residual part (Fig. 6).Hence, the clay contents and compositions (especially for chlorite)cannot explain the remarkable LREE enrichment observed in leachedfraction. Considering the low leached concentrations of Ti and Zr
(b1% in Korean sediments; Table 2), the accessory heavy mineralsare also not expected to affect the REE pattern of the leachedfraction.
As a result, the LREE enrichment pattern in KR sediments may berelated to weathered detrital substances that can be dissolved by acidsolutions. Considering the relative percentage of Al in this study, theamount of weathered detrital phases in the leached fraction was upto 10% of the total REE concentration, which indicates that the composi-tions of these substances might play a crucial role in the relativeincrease in the LREE concentration relative to that of HREEs. Theseunstable weathered detrital materials have largely the same mineralcomposition as the residual fraction. In the leached fraction, the LREEenrichment may be relevant to the weathered detrital phases of sedi-ments extracted by the 1 M HCl solution, reflecting the mineralogy ofthe residual fraction. As shown in Fig. 5, however, the LREE enrichmentwas much more apparent in the leached fraction than in the residualfraction, although the REE concentration is relatively low in the leachedfraction. This may be due to the masking effect of zircon and garnet forthe HREE enrichment relative to the LREE enrichment in the residualfraction of sediments, resulting in a decrease of the LREE/HREE values(Jung et al., 2012). Accordingly, acidic solutions (1 M HCl) in severalstudies were used for the various labile fractions, including Fe–Mnoxide, carbonate, and apatite, but we should consider that the proce-dure can release REEs in labile to moderately resistant REE-bearingminerals.
In the leached fraction,meanwhile, KR and CR sediments are typical-ly characterized byMREE enrichment (Fig. 5 and Table 1). Such a signif-icant MREE enrichment signature in the leached fraction of all riversediments is different from the traditional LREE andHREE fractionation.Banner et al. (1988) and Zhang et al. (1998) revealed thatmany types ofminerals are enriched withMREEs, including carbonate, apatite, Fe–Mnoxides, and organic matter. In this study, the REE concentration of labilefraction increases linearly with the Fe concentration, especially inMREEs and LREEs. However, in the residual fraction, correlations arenot apparent (Fig. 4b). This evidently shows that Fe oxide mineralsplay an important role in MREE enrichment of the leached fraction.Moreover, previous sequential leaching experiments for Fe–Mn oxidephases revealed that the MREE enrichment observed in KR and/orCR sediments could be explained by reactive Fe minerals such as amor-phous Fe oxyhydroxide, ferrihydrite, lepidocrocite, and goethite (Zhanget al., 1998; Yang et al., 2002;Wang and Liu, 2008; Song andChoi, 2009).Yang et al. (2002) also suggested that more than 46% of the leachedREEs exist in Fe–Mn oxides in these river sediments. Accordingly, theMREE enrichment in KR and CR sediments is likely mostly due to labileFe–Mn oxides, with a small influence from the apatite and carbonatefractions. Therefore, this MREE enrichment (i.e., the fractionation ratiobetween MREEs and HREEs) in the acid-leachable fraction should beused cautiously when it is applied to study the sediment provenancein the Yellow and East China Sea shelves because of the active diageneticmodification of amorphous Fe oxide minerals, especially in suboxicand/or anoxic environments, as previously suggested by Song andChoi (2009).
4.2. Application of the LREE enrichment signal for sediment provenance onthe Yellow Sea shelf
In this study, we investigated whether the REE fractionation signalcan trace the sediment source in the Yellow Sea shelf adjoining theKorean and Chinese river systems. The Yellow Sea shelf sedimentsexhibit a broad variation in sediment grain-size (from 1.6 to 9.5 ϕ),consisting of 0–89% sand, 5–76% silt, and 1–69% clay (Table 2). Overall,fine-grained sediments dominate the shelf (especially the centralpart), except for some coarse-grained sandy sediments [stations (St.)14, 23, 25, and 44; see Fig. 1 for stations; Fig. 7a]. Characteristically,these sand grains, which are widely distributed in the eastern part ofthe Yellow Sea (see Fig. 1 of Lim et al., 2007), consist almost entirely
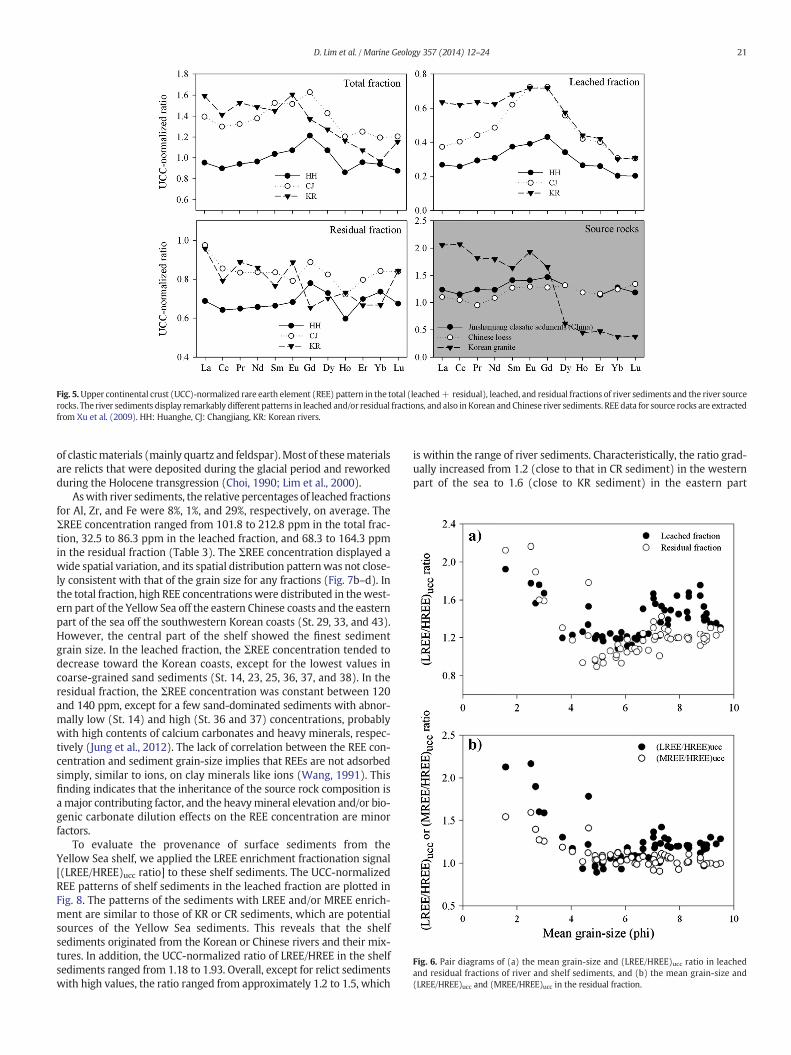
Fig. 6. Pair diagrams of (a) the mean grain-size and (LREE/HREE)ucc ratio in leachedand residual fractions of river and shelf sediments, and (b) the mean grain-size and(LREE/HREE)ucc and (MREE/HREE)ucc in the residual fraction.
Fig. 5.Upper continental crust (UCC)-normalized rare earth element (REE) pattern in the total (leached+ residual), leached, and residual fractions of river sediments and the river sourcerocks. The river sediments display remarkably different patterns in leached and/or residual fractions, and also in Korean andChinese river sediments. REE data for source rocks are extractedfrom Xu et al. (2009). HH: Huanghe, CJ: Changjiang, KR: Korean rivers.
21D. Lim et al. / Marine Geology 357 (2014) 12–24
of clasticmaterials (mainly quartz and feldspar).Most of thesematerialsare relicts that were deposited during the glacial period and reworkedduring the Holocene transgression (Choi, 1990; Lim et al., 2000).
Aswith river sediments, the relative percentages of leached fractionsfor Al, Zr, and Fe were 8%, 1%, and 29%, respectively, on average. TheΣREE concentration ranged from 101.8 to 212.8 ppm in the total frac-tion, 32.5 to 86.3 ppm in the leached fraction, and 68.3 to 164.3 ppmin the residual fraction (Table 3). The ΣREE concentration displayed awide spatial variation, and its spatial distribution patternwas not close-ly consistent with that of the grain size for any fractions (Fig. 7b–d). Inthe total fraction, high REE concentrationswere distributed in thewest-ern part of the Yellow Sea off the eastern Chinese coasts and the easternpart of the sea off the southwestern Korean coasts (St. 29, 33, and 43).However, the central part of the shelf showed the finest sedimentgrain size. In the leached fraction, the ΣREE concentration tended todecrease toward the Korean coasts, except for the lowest values incoarse-grained sand sediments (St. 14, 23, 25, 36, 37, and 38). In theresidual fraction, the ΣREE concentration was constant between 120and 140 ppm, except for a few sand-dominated sediments with abnor-mally low (St. 14) and high (St. 36 and 37) concentrations, probablywith high contents of calcium carbonates and heavy minerals, respec-tively (Jung et al., 2012). The lack of correlation between the REE con-centration and sediment grain-size implies that REEs are not adsorbedsimply, similar to ions, on clay minerals like ions (Wang, 1991). Thisfinding indicates that the inheritance of the source rock composition isa major contributing factor, and the heavymineral elevation and/or bio-genic carbonate dilution effects on the REE concentration are minorfactors.
To evaluate the provenance of surface sediments from theYellow Sea shelf, we applied the LREE enrichment fractionation signal[(LREE/HREE)ucc ratio] to these shelf sediments. The UCC-normalizedREE patterns of shelf sediments in the leached fraction are plotted inFig. 8. The patterns of the sediments with LREE and/or MREE enrich-ment are similar to those of KR or CR sediments, which are potentialsources of the Yellow Sea sediments. This reveals that the shelfsediments originated from the Korean or Chinese rivers and their mix-tures. In addition, the UCC-normalized ratio of LREE/HREE in the shelfsediments ranged from 1.18 to 1.93. Overall, except for relict sedimentswith high values, the ratio ranged from approximately 1.2 to 1.5, which
is within the range of river sediments. Characteristically, the ratio grad-ually increased from 1.2 (close to that in CR sediment) in the westernpart of the sea to 1.6 (close to KR sediment) in the eastern part

22 D. Lim et al. / Marine Geology 357 (2014) 12–24
(Fig. 7e). This gradual change in the spatial distribution across the shelfprovides information on the relative contribution of each river in thesediment provenance of the Yellow Sea. Nonetheless, the high LREE en-richment feature relative to the HREE in the leached fractionmay be un-suitable as a provenance tracer because the acidic solution can dissolvesome part of the relatively unstable weathered silicates of the residualfraction. In addition, the amount of dissolution can differ by sample.
In addition, the (LREE/HREE)ucc ratio in the residual fraction of theshelf sediments ranged from 1.20 to 2.17. However, except for relictsandy sediments with high values (N1.5), most sediments were con-stant between 1.2 and 1.3 in (LREE/HREE)ucc (Fig. 7f). Considering thespatial distribution of the ratio, most shelf sediments in the central-western part of the Yellow Sea are dominated by CR sediments, whereasthe muddy sediments [named the southeastern Yellow Sea mud(SEYSM) deposit or Huksan Mud Belt] in the southeastern part of theYellow Sea (southwestern Korean coasts) are composed of a mixtureof both Korean and Chinese river-derived sediments. This geochemicalresult directly supports the multi-source theory of the SEYSM deposits,which have been suggested by Lim et al. (2007) on the basis of varioussedimentological data (e.g, the sediment budgets and the seasonal andspatial distributions of suspended matter). According to formingmech-anism of the mud deposit (Lim et al., 2007), the Chinese river-derivedfine sediments (mainly ole-Huanghe delta and/or Changjiang River)are considered to be transported into the northern part of the EastChina Sea, forming the southwestern Cheju Island mud deposit. Later,
a)
c)
e)
Fig. 7. Spatial distribution of (a) the mean grain size, (b–d) rare earth element (REE) concentrratios in the leached and residual fractions, respectively, on the Yellow Sea shelf.
some of these clay sediments seem to be reworked and transportedinto the coastal area of `Korea by the Yellow Sea Warm Current (abranch of Kuroshio), especially during winter, providing an importantclue regarding the mud budget shortage in the SEYSM, which cannotbe explained by the Korean river discharge only.
Meanwhile, higher values were observed in relict sediments of thesoutheastern Yellow Sea. We assume that the southeastern sandysediments primarily came from the Korean rivers during the postglacialtransgression. However, this assumption suggests a distinctive differ-ence in origin frommodern rivers and coastal sediments that are direct-ly transported from the river. If this is the case, the REE distributionpatterns in sandy sediments may not be an effective tool for discrimi-nating sediment provenance. REE fractionation characteristics andtheir spatial distribution patterns in labile and residual partitioningcan provide evidence to help explain the major phases affecting REEfractionation of river sediments as well as the origin of sediments inthe Yellow Sea. However, the REE tracers should be used cautiously inrelict sandy shelf areas dominated by strong hydrodynamic sortingprocess because they can be constrained by coarse sand and/or heavymineral content (e.g., zircon and garnet).
5. Conclusions
In this study, REEswere partitioned into labile (1MHCl leached) andresidual phases in Korean–Chinese riverine sediments (29 samples) and
b)
d)
f)
ations in total, leached, and residual fractions, respectively, and (e and f) (LREE/HREE)ucc

Fig. 8. Upper continental crust (UCC)-normalized patterns of Yellow Sea sediments in theleached fraction, together with river sediments. The patterns of shelf sediments with theLREE and/or the MREE enrichment relative to HREE are similar to those of Korean orChinese river sediments. HH: Huanghe, CJ: Changjiang, KR: Korean rivers, YS: Yellow Seashelf.
23D. Lim et al. / Marine Geology 357 (2014) 12–24
shelf sediments (31 samples) from the Yellow Sea. The leached REEconcentrations accounted for an average of 43% and 32% of the totalconcentration of KR and CR sediments, respectively. The ΣREE concen-trations in these river sediments were mainly influenced by the sedi-ment grain size for the leached fraction and by heavy minerals for theresidual fraction. The UCC-normalized fractionation patterns showedLREE and MREE enrichment in KR sediments, and MREE enrichmentin CR sediments. These fractionation patterns in the total REE composi-tions were largely governed by those of the leached fraction, eventhough approximately half of the LREE enrichment in the KR sedimentwas due to the residual fraction. A convex up-pattern with MREEenrichment in the leached fraction of KR and CR sediments was prefer-entially linked to Fe–Mn oxides, with minor contributions from theapatite and carbonate fractions. A remarkable LREE enrichment in KRsediments has been inherited from the felsic granitic rocks (mainlygranite and granitic gneiss) of the river basins. In contrast, Chinese sed-iments in the residual fraction are characterized by flat UCC-normalizedpatternswith no LREE orMREE enrichment. This pattern shows that thegeochemical composition of CR sediments is close to that of the UCC,which consists of a mixture of various rocks. Chinese rivers are morecomplex and have a greater variety of source rock types and maficitiesthan Korean rivers. The spatial distribution of the REE signature pro-vides information on the contribution of each river to the sediments ofthe Yellow Sea aswell as the ultimate fate of CR sediments. Nonetheless,the LREE enrichment signature should be used cautiously, especially inrelict sandy shelf areas dominated by strong hydrodynamic sortingprocesses.
Acknowledgment
This research was supported by the Korea Institute of Ocean Scienceand Technology (Grant No. PE99233). Careful reviews by three ano-nyms reviewers were helpful in revising the manuscript and are highlyappreciated. We thank the Library of Marine samples (LIMS), KIOST forsupplying the sediment samples.
References
Banner, J.L., Hanson, G.N., Meyers, W.J., 1988. Rare earth element and Nd isotopicvariations in regionally extensive dolomites from the Burlington-Keokuk Formation(Mississippian): implications for REE mobility during carbonate diagenesis. Journalof Sedimentary Petrology 58, 415–432.
Braun, J.J., Pagel, M., Muller, J.P., Bilong, P., Michard, Guillet B., 1990. Cerium anomalies inlateritic profiles. Geochimica et Cosmochimica Acta 54, 781–795.
Byrne, R.H., Kim, K.H., 1990. Rare earth element scavenging in seawater. Geochimica etCosmochimica Acta 54, 2645–2656.
Cai, G., Guo, F., Liu, X., Sui, S., Li, C., Zhao, L., 2008. Geochemistry of Neogene sedimentaryrocks from the Jiyang basin, North China Block: the roles of grain size and clayminerals. Geochemical Journal 42, 381–402.
Censi, P., Mazzola, S., Sprovieri, M., Bonanno, A., Patti, B., Punturo, R., Spoto, S.E., Saiano, F.,Alonzo, G., 2004. Rare earth elements distribution in sea waters and suspendedparticulate of the central Mediterranean sea. Chemistry and Ecology 20, 323–343.
Cho, Y.G., Lee, C.B., Choi, M.S., 1999. Geochemistry of surface sediments off the southernand western coast of Korea. Marine Geology 159, 111–129.
Choi, J.Y., 1990. Depostitional Environments of the Coarse-Grained Sediments on theContinental Shelf of Korean SeasPh.D. Thesis Seoul National University (331 pp.).
Chung, C.H., You, C.F., Chu, H.Y., 2009. Weathering sources in the Gaoping (Kaoping) rivercatchments, southwestern Taiwan: insights from major elements, Sr isotopes andrare earth elements. Journal of Marine Systems 76, 433–443.
Chough, S.K., Lee, H.J., Yoon, S.H., 2000. Marine Geology of Korean Seas. Elsevier,Amsterdam.
Cronan, D.S., Hodkinson, R.A., 1997. Geochemistry of hydrothermal sediments from ODPSites 834 and 835 in the Lau Basin, southwest Pacific. Marine Geology 141, 237–268.
Cullers, R.L., Graf, J., 1983. Rare earth elements in igneous rocks of the continental crust:intermediate and silicic rocks, ore petrogenesis. In: Henderson, P. (Ed.), Rare EarthElement Geochemistry. Elsevier, Amsterdam, pp. 275–312.
Hoyle, J., Elderfield, H., Gledhill, A., Greaves, M., 1984. The behavior of rare earth elementsduringmixing of river and seawaters. Geochimica et Cosmochimica Acta 48, 143–149.
Ingram, R.L., 1971. In: Caver, R.E. (Ed.), Procedures in Sedimentary Petrology. Wiley-InterScience, pp. 49–67.
Jiang, F., Zhou, X., Li, A., Li, T., 2009. Quantitatively distinguishing sediments from theYangtze River and the Yellow River using δEuN–ΣREEs plot. Science in China SeriesD: Earth Sciences 52, 232–241.
Johannesson, K.H., Lyons, W.B., Yelken, M.A., Gaudette, H.E., Stetzenbach, K.J., 1996.Geochemistry of the rare-earth elements in hypersaline and dilute acidic natural ter-restrial waters: complexation behavior and middle rare-earth element enrichments.Chemical Geology 133, 125–144.
Jung, H.S., Lim, D.I., Choi, J.Y., Yoo, H.S., Rho, K.C., Lee, H.B., 2012. Rare earth elementcompositions of core sediments from the shelf of the South Sea, Korea: their controlsand origins. Continental Shelf Research 48, 75–86.
Koeppenkastrop, D., De Carlo, E.H., 1992. Sorption of rare-earth elements from seawateronto synthetic mineral particles: an experimental approach. Chemical Geology 95,251–263.
Leleyter, L., Probst, J.-L., Depetris, P., Haida, S., Mortatti, J., Rouault, R., Samuel, J., 1999. REEdistribution pattern in river sediments: partitioning into residual and labile fractions.Earth and Planetary Sciences 329, 45–52.
Lim, D.I., Park, Y.A., Choi, J.Y., Cho, J.W., Khim, B.K., 2000. Glauconite grains in continentalshelf sediments around the Korean Peninsula and their depositional implications.Geo-Marine Letters 20, 80–86.
Lim, D.I., Jung, H.S., Choi, J.Y., Yang, S., Ahn, K.S., 2006. Geochemical compositions of riverand shelf sediments in the Yellow Sea: grain-size normalization and sedimentprovenance. Continental Shelf Research 26, 15–24.
Lim, D.I., Choi, J.Y., Jung, H.S., Rho, K.C., Ahn, K.S., 2007. Recent sediment accumulation andorigin of shelf mud deposits in the Yellow and East China Seas. Progress in Oceanog-raphy 73, 145–159.
Lim, D.I., Choi, J.Y., Shin, H.H., Rho, K.C., Jung, H.S., 2013. Multielement geochemistry ofoffshore sediment origin and dispersal. Quaternary International 298, 196–206.
McLennan, S.M., 1989. Rare earth elements in sedimentary rocks: influence of provenanceand sedimentary process. In: Lipin, B.R., Mckay, G.A. (Eds.), Geochemistry andMineralogy of Rare Earth Elements. Reviews in Mineralogy, vol. 21, pp. 169–200.
Mclennan, S.M., Hemming, S., McDaniel, D.K., Hanson, G.N., 1993. Geochemical ap-proaches to sedimentation, provenance, and tectonics. In: Johnson, M.J., Basu, A.(Eds.), Processes Controlling the Composition of Clastic Sediments. Geological Societyof America, Special Paper, 284, pp. 21–40.
Marmolejo-Rodriguez, A.J., Prego, R., Meyer-Willerer, A., Shumilin, E., Sapozhnikov, D.,2007. Rare earth elements in iron oxy-hydroxide rich sediments from the MarabascoRiver-Estuary System (Pacific coast of Mexico), REE affinity with rion and aluminium.Journal of Geochemical Exploration 94, 43–51.
Mascarenhas-Pereira, M.B.L., Nath, B.N., 2010. Selective leaching studies of sediments froma seamount flank in the Central Indian Basin: resolving hydrothermal, volcanogenicand terrigenous components using major, trace and rare-earth elements. MarineChemistry 121, 49–66.
Nyakairu, G.W.A., Koeberl, C., 2001.Mineralogical and chemical composition and distribu-tion of rare earth elements in clay-rich sediments from central Uganda. GeochemicalJournal 35, 13–28.
Prego, R., Caetano, M., Vale, C., Marmolejo-Rodriguez, J., 2009. Rare earth elements in sed-iments of the Vigo Ria, NW Iberian Peninsula. Continental Shelf Research 29, 896–902.
Rengarajan, R., Sarin, M.M., 2004. Distribution of rare earth elements in the Yamuna andthe Chambal rivers, India. Geochemical Journal 38, 551–569.
Rudnick, R.L., Gao, S., 2003. The composition of the continental crust, In The Crust (ed. R.L.Rudnick) Vol. 3, Treatise On Geochemistry (Eds. H.D. Holland and K.K. Turekian),Elsevier-Pergamon, Oxford.
Sanematsu, K., Murakami, H., Watanabe, Y., Duangsurigna, S., Vilayhack, S., 2009.Enricment of rare earth elements (REE) in granitic rocks and their weathered crustsin central and southern Laos. Bulletin of the Geological Survey of Japan 60, 527–558.
Sholkovitz, E.R., 1976. Flocculation of dissolved organic and inorganic matter during themixing of river water and seawater. Geochimica et Cosmochimica Acta 40, 831–845.
Sholkovitz, E.R., 1992. Chemical evolution of rare earth elements: fractionation betweencolloidal and solution phases of filtered river water. Earth and Planetary ScienceLetters 114, 77–84.
Sholkovitz, E.R., 1995. The aquatic chemistry of rare earth elements in rivers and estuaries.Aquatic Geochemistry 1, 1–34.

24 D. Lim et al. / Marine Geology 357 (2014) 12–24
Sholkovitz, E.R., Landing, W.M., Lewis, B.L., 1994. Ocean particle chemistry: the fraction-ation of rare earth elements between suspended particles and seawater. Geochimicaet Cosmochimica Acta 58, 1567–1579.
Singh, P., Rajamani, V., 2001. REE geochemistry of recent clastic sediments from theKaveri floodplains, southern India: implication to source area weathering andsedimentary processes. Geochimica et Cosmochimica Acta 65, 3093–3108.
Song, Y.H., Choi, M.S., 2009. REE geochemistry of fine-grained sediments from majorrivers around the Yellow Sea. Chemical Geology 266, 328–342.
Wang, J., 1991. REE geochemistry of surficial sediments from the Yellow Sea of China.Chinese Journal of Geochemistry 10, 88–98.
Wang, Z., Liu, C., 2008. Geochemistry of rare earth elements in the dissolved, acid-solubleand residual phases in surface waters of the Changjiang Estuary. Journal of Oceanog-raphy 64, 407–416.
Weltje, G.J., von Eynatten, H., 2004. Quantitative provenance analysis of sediments:review and outlook. Sedimentary Geology 171, 1–11.
Xu, F., Li, A., Li, T., Xu, K., Chen, S., Qiu, L., Cao, Y., 2011. Rare earth element geochemistry inthe inner shelf of the East China Sea and its implication to sediment provenances.Journal of Rare Earths 29, 702–709.
Xu, Z., Lim, D.I., Choi, J.Y., Yang, S., Jung, H.S., 2009. Rare earth elements in bottom sedi-ments of major rivers around the Yellow Sea: implications for sediment provenance.Geo-Marine Letters 29, 291–300.
Yang, S.Y., Jung, H.S., Choi, M.S., Li, C.X., 2002. The rare earth element compositions of theChangjiang (Yangtz) and Huanghe (Yellow) river sediments. Earth Planetary ScienceLetters 201, 407–419.
Yang, S.Y., Jung, H.S., Lim, D.I., Li, C.X., 2003a. A review on the provenance discriminationof sediments in the Yellow Sea. Earth-Science Reviews 63, 93–120.
Yang, S.Y., Li, C., Lee, C.B., Na, T.K., 2003b. REE geochemistry of suspended sediments fromthe rivers around the Yellow Sea and provenance indicators. Chinese Science Bulletin48, 1135–1139.
Yang, S.Y., Lim, D.I., Jung, H.S., Oh, B.C., 2004. Geochemical composition and provenancediscrimination of coastal sediments around Cheju Island in the southeastern YellowSea. Marine Geology 206, 41–53.
Yang, S.Y., Youn, J.S., 2007. Geochemical compositions and provenance discrimination ofthe central south Yellow Sea sediments. Marine Geology 243, 229–241.
Zhang, C., Wang, L., Zhang, S., 1998. Geochemistry of rare earth elements in the main-stream of the Yangtze River, China. Applied Geochemistry 13, 451–462.