Embed Size (px)
Citation preview

REDUCTION OF OUTBOUND FREIGHT COSTS - EQUIPMENT
Black Belt - Nicole BrannonChampion - Tony MartinoMBB - Art Girard FA - Diane Brightwell

2
Project Definition
Problem Statement: Excessive freight charges on outbound Equipment across Canada.
IKON is faced with multiple charges for these repeat deliveries.
Project Metric (Y): Reduction of outbound freight charges for Equipment.
Defect Definition: Preventable 2nd deliveries or pickups.
Project Benefits: An overall 70% process improvement and cost reduction across Canada
Documented standardized processes across Canada.

3
Project Background
No detailed reporting
2003 no detailed reporting given to IKON Logistic Leaders. 3rd Party Logistics billing 3rd Party Payable
Jan’04 detailed reports were provided to Logistics.
Scrutinized by Logistic Leaders Became our Measurement System
No Standard Process Across Canada
Differed from Province to Province Marketplace to Marketplace

4
Data Collection reveals Defects
14 13 18 19 23 26 30 45 85139
3.4 3.2 4.4 4.6 5.6 6.3 7.310.920.633.7
400
300
200
100
0
100
80
60
40
20
0Defect
CountPercent
Perc
ent
Cou
nt
65%of all defects were caused by 3 issues:
Customer not expecting
Cancelled en route
Technician required
5
Overview of Findings - Root Causes
Data Collection and the FMEA pointed us towards several manageable root causes. All of which have had IMPROVEMENTS IMPLEMENTED:
Pre-calls Audit revealed 100% of deliveries did not contain pre-call information
Removal process No pre-call attempts No verification of tech scheduled Extra charges incurred for paperwork mishandling
No Accountability No Audits No Controls

6
PROCESS IMPROVEMENT – SOP DEVELOPED FOR BEST FIT SOLUTIONS
Defect Definitions - Provides IKON and 3rd Party Logistics with a standard vocabulary and understanding of specific defects
Equipment Delivery/Tracking Processes - Provides IKON and 3rd Party Logistics with a standard process for reporting delivery and removal transactions.
Data Collection and Defect Mapping - Outlines the process by which logistics will accurately track and record all equipment deliveries and pickups.
Setting Customer Expectations Process update sent to Sales re-enforcing expectations set by Logistics that customer contact must be made prior to delivery or pick-up attempts by 3PL.
Effective Pre-calls Contains a pre-call checklist, escalation process if customer cant be contacted, removal process and process maps.

7
Pre-call Process Flow – 3PL (Exel)
Scheduler isreschedule forpick-up whentechnician hasclosed service
call
Failed pick-up ordelivery
Adhering toEquipment Pickup
/ RemovalTracking
documentation
Driver will note onPOD or RMA and
billing sheetreason for failed
attempt
Driver returnsPOD/RMA and pre-call
checklist to the3PLdispatcher
Notifies IKON Scheduler
3PL Pre-call Process Flow
1 START
3PL makes pre-call utilizing pre-callchecklist
Contact is made via telephone
Acknowledgement to customer thatpick-up will be done with delivery
Scheduler gives RMA back to 3PL
If problem withdelivery
3PL to givethe RMA backto the IKONScheduler
Schedulerchecks OMDfor setup callor Removal
Delivery and Corresponding pick upscheduled
Exel (3PL) outsourced for all Equipment Logistics
across Canada
This process flow was incorporated by Exel into
their Internal Process Documentation
8
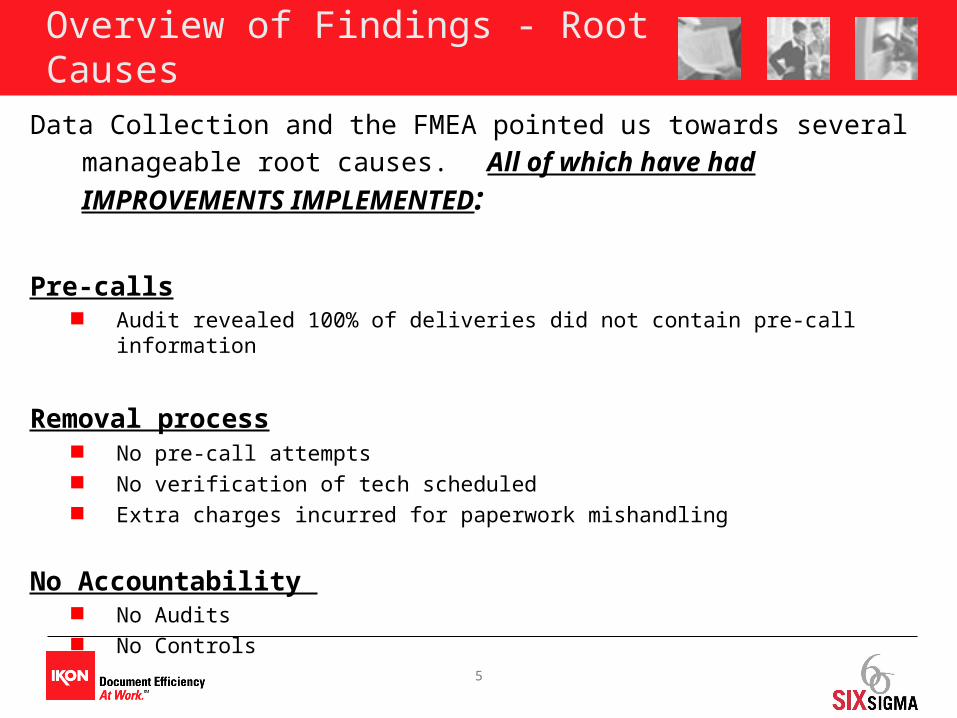
Internal Defect Mapping / Reporting and Audit Process Flow to Sustain the Gains
Data Collection and Defect Reporting - Equipment Deliveries/Pickups
Fin
an
cia
l
An
aly
st
CC
Ma
na
ge
rIn
ve
nto
ry
An
aly
st
Re
gio
na
l
An
aly
st
Re
gio
na
l
Inve
nto
ry
Ma
na
ge
r
Exe
l -
3P
L
1.0Provides Billing
Sheet for weeklydeliveries
2.0Maps
defects
3.1Summary of
analysiscompiled
3.0Analyzes
data
3.0aIs the
informationcomplete
YES
YES
4.0Collects data
weekly deliverysheets for 7Provinces
4.0aSummary of allprovinces into
one sheet
5.0Reviews
5.aDoes process failto meet control
limits
6.0Reports
financials perCorporateGuidelines
5.0bContacts CC
Manager a to resolveprocess breakdown
YES
NO
NO2.0a
Gage R/R testgiven to designate
2.0bMaps
defects
gives to cc manager to sign off
2.0cGives back to CCManager to submit
5.0cSummary of
analysis given toDirector ofLogistics
Before Six Sigma there was no standardized process in place for data collection,auditing, or reporting
Before Six Sigma there was no standardized process in place for data collection,auditing, or reporting

9
Process in Control - Prairies
2 1 D a y s o f D e l i v e r i e sP
rop
ort
ion
222018161412108642
0.09
0.08
0.07
0.06
0.05
0.04
0.03
0.02
0.01
0.00
_P=0.0345
UB=0.047
LCL=0
J u n e ' 0 4 = 3 .4 % D e f e c t i v e
20 D a y s o f D e l i v e r i e s
Pro
po
rtio
n D
efe
ctiv
e
2018161412108642
1.0
0.8
0.6
0.4
0.2
0.0
_P=0.241
UB=0.047LCL=0
J a n ' 0 4 = 2 4 % D e f e c t i v e
DPMO = 241,379 Zlt = 0.8 Zst = 2.3DPMO = 241,379 Zlt = 0.8 Zst = 2.3 DPMO = 33,707 Zlt = 1.9 Zst = 3.4 DPMO = 33,707 Zlt = 1.9 Zst = 3.4

10
Process Capability – Improvement TrendJan ’04 – June ’04 Across Canada
Pre-Process Improvement: Jan’04 Post-Process Improvement – June’04
DPMO = 161,378 Zlt = 1.0 Zst = 2.5 DPMO = Zlt = 1.4 Zst = 2.9
Pre-Process Improvement: Jan’04 Post-Process Improvement – June’04
DPMO = 161,378 Zlt = 1.0 Zst = 2.5 DPMO = Zlt = 1.4 Zst = 2.9
16
15
14
13
12
11
10
9
8
7
6
June '04May '04Apr '04Mar '04Feb '04Jan '04
Per
cent
Def
ectiv
e
Index
Trend Analysis Canada for Defective Deliveries - Equipment

11
FINANCIAL BENEFITS
Benefits come from tracking actual defects to actual dollars billed to IKON by 3PL using Jan’04 baseline.
Hard Savings Feb-Jun’04 = 68,804Hard Savings Feb-Jun’04 = 68,804
$6,833.00
$9,770.00
$12,780.00$20,935.00
$13,490.00
FEBRUARY
MARCH
APRIL
MAY
JUNE
Forecasted ’04 savings = $112,000 Forecasted ’05 savings = $263,424 Forecasted ’04 savings = $112,000 Forecasted ’05 savings = $263,424

12
Project Closure
Project is scheduled for close-out presentation to the Steering Committee on August 30th
Process Hand-off documents have been prepared including Process Hand-off Contract signatures from Champion, Financial Analyst, Process Owner and Master Black Belt.
Any Feed-back you may have to prepare this project for closure would be welcomed.