Embed Size (px)
Citation preview

C I R E D 24st International Conference on Electricity Distribution Stockholm, 10-13 June 2013
Paper 0176
CIRED2013 Session 5 0167
REDUCTION OF ENERGY LOSSES IN ELECTRICAL DISTRIBUTION SYSTEMS
Hamed EMARA KASSEM EX-Chairman of Rural Electrification
Authority- Egypt
Mohammed BADR Faculty of Engineering,
Ain Shams university- Egypt [email protected] [email protected]
Salwa ALI AHMED Egyptian Electricity Holding Company (EEHC) – Egypt
ABSTRACT This paper contains a strategy to minimize energy losses in an electrical distribution network. In order to develop the strategy, a model was constructed to simulate an electrical distribution network, and different parameters were included that help in estimation of technical losses in medium voltage (MV) distribution network. The main objective of this paper is to minimize technical and non-technical losses in power systems. There are losses in power systems that cannot be predicted or calculated beforehand, these are the non-technical losses. The bulk of these losses are likely caused by electricity theft, rather than the other possibilities such as poor maintenance of meters, and calculation and accounting mistakes, some power systems may suffer from both. The strategy is applied on a part of real distribution network. The network segments consist of different network busses delivering electrical energy from substation to supply different customers. In this network, the load supplied by one bus is a varying load for different times especially at maximum load conditions.
Key Words: Technical losses, non-technical losses, Maneuvers, PRAO software, Multi- objective genetic algorithm, Electrical distribution network.
INTRODUCTION
Every element in a power system (a line or a transformer etc) offers resistance to power flow and thus consumes some energy while performing the duty expected from it. In order to study power losses in a distribution network, which constitute a portion of the total losses in electrical power systems, the logical first step is to understand the complete picture of power systems losses.
Fig.1 Connection between generation and distribution systems
Fig.1 explains General Connection between generation and distribution systems, Generation (Production), Transmission (Transportation) and Distribution (Retailing). The efficient use of electrical energy will slow the destruction of the environments natural resources and will also reduce the cost of electricity for the consumers. These paper studies losses in
electrical distribution networks, the losses in power distribution systems can be classified as technical and non-technical losses. As shown in Figure2.
Fig.2 Technical operation and commercial management
A. Technical losses They are usually present due to the following reasons:- • I2R Losses or heat loss,
• Unoptimized location of transformers, • Lengthy single-phase lines, • Phase imbalance, • Loose joints, • Low power factor loads, • Overloading of transmission lines, • Low quality of insulators and conductors, • Low quality earthing at consumer premises.
The above losses are considered "technical", reducing them is an imperative requirement for any electric company, because if they exceed certain "allowable" levels, they can actually endanger the company's financial status [1].
B. Non-Technical Losses
There are so many types of non- technical losses. Among them are the following: • Electricity theft • Non-payment by customers • Errors in technical losses computation • Errors in accounting and record keeping that distort technical
information. Non-technical (or commercial) losses are associated with inadequate or missing revenue metering, with problems with billing and/or collection systems, and/or with consumer pilferage. The purpose of this paper is to develop a technique or the analysis of the losses reduction problem and for the subsequent development of action plans to solve the overall problem, through a systemic approach. Generally, an

C I R E D 24st International Conference on Electricity Distribution Stockholm, 10-13 June 2013
Paper 0176
CIRED2013 Session 5 0167
optimization system has smaller worst voltage drops, overloads, and energy losses. Reduction of losses improves system quality, security, and reliability. It can improve utilization factors of existing facilities and defer feeder expansion project. As a result, a utility can produce power with higher quality and lower electricity price, which will attract customers to the utility and enhance the utility competitive ability in the deregulated environments. The network configuration management technique is considered on top of these solutions. At first, they considered two objectives such as optimization of voltage drop and overload then, loss reduction in distribution systems. So, an attempt was made to solve the network reconfiguration problem having multiple objectives such as minimization of power losses, load balancing among supply transformers, minimization of the worst voltage drop and overload. Pareto front [2] had proposed a GA based approach to solve the optimization problem of technical losses in the electrical distribution networks. The reconfiguration algorithm directly constructs an optimal solution for voltage drop, overload and minimum losses accounting for the major constraints on maneuvers such as the network must not have any closed loops, and the limitations of line capacities or voltage drops are satisfied.
THE PROPOSED GENETIC ALGORITHM
A genetic algorithm developed by J.H. Holland (1975) [3] is a model of machine learning, which derives its behavior from a metaphor of the processes of evolution in nature. GAs is executed iteratively on a set of coded chromosomes, called a population, with three basic genetic operators: selection, crossover and mutation. Each member of the population is called a chromosome (or individual) and is represented by a string all the strings and applies three operators in order to optimize the function. [4-5], GAs uses only the objective function information and probabilistic transition rules for genetic operations.
a) Selection
This operator is used by the algorithm to choose the best individuals or chromosomes based on their fitness values (as the fitness of the individual increase it becomes more likely to be selected) to form the initial population. [4].
b) Crossover
This operator is used by the algorithm to enhance the fitness value of the individuals. In this operator, two randomly selected individuals (called parents) exchange some of their genes together in order to get two new two individuals are called offspring. And the method that was used is crossover probability with a probability value equals to 0.8 which means that crossover operator will be applied on 80% of the individuals in the current population. This technique was chosen due its superiority among the other crossover techniques as it ensures the transportation of the best traits in the current generation to next one [4-6].
c) Mutation
This operator prevents the algorithm from being trapped in local minima as it helps in the recovering of the lost traits due to the crossover operator. It also helps in the exploration of the search space thus adding more diversity to the population.
The technique used in this research was the mutation probability in which the algorithm flips certain number of bits (from zero to one or vice versa) in each of the selected individuals to be mutated in the aim of increasing the individual fitness. The probability value used was 0.2 (i.e. 20% of the individuals will be mutated). The value was low comparably with the crossover ratio in order to keep the exploitation/exploration balance. The GA will run for several preset time, or the difference in the fitness value does not change for several preset number of generations. Fig. 1
Shows a flow chart describes how GA works to reach the optimum solution.
Fig. 1 Basic structure of genetic algorithm
Let us consider problem having "m" objectives:
Any two solutions u(1) and u(2) (having ‘t’ decision variables each) can have one of two possibilities one dominates the other or none dominates the other. A solution u(1) is said to dominate the other solution u(2), if the following conditions are true: The solution u(1) is no worse (say the operator denotes worse and denotes better) than u(2) in all objectives, or
The solution u(1) is strictly better than u(2) in at least one objective, or
If any of the above condition is violated, the solution u(1) does not dominate the solution u (2). If u(1) dominates the solution u(2), then we can also say that u(2) is dominated by u(1), or u(1) is non-dominated by u(2) , or simply between the two solutions, u(1) is the non-dominated solution, then the resultant solution v dominate any member of that set then the set is called local Pareto optimal set. [7].
DISTRIBUTION NETWORK PLANNING CRITERIA
PRAO software [9] enables analysis of the current state of electricity supply regarding load flow and voltage profile in the normal condition and the reliability or quality analysis in

C I R E D 24st International Conference on Electricity Distribution Stockholm, 10-13 June 2013
Paper 0176
CIRED2013 Session 5 0167
the backup condition based on evolutionary algorithms for multi-criterion optimization. [8]. Those analyses are a basis for variant planning of the medium or long term (up to 10 years) distribution network development, during which a year by year electricity supply quality verification and the economical evaluation of every investment and the whole long term investment plan is performed. Further important data is outage frequencies of the system elements (overhead lines, cables, transformers,). Clearly, it is necessary to have organized system of data acquisition (measurement) and data storage (database) to successfully overlook the network performance and development. Important part of the distribution network planning is criteria and assumptions used in the planning process. Below are the examples used in the practice in Egypt, divided into three parts, according to the type of the analyses they are used in. Load flow and voltage profile and power loss are analyses in the normal conditions are conducted according to two criteria: "Load of the lines and transformers up to 80 % of thermal current and admissible voltage drop in 11kV network up to 6 %. The equivalent criteria are lower: load of the overhead lines and transformers up to 100 % of thermal current and admissible voltage drop in 11 kV network up to 6%"
NETWORK INITIAL STATE ANALYSES
The first step of the distribution network planning is analyses of its initial state with intention to encounter possible defects. The example given in this paper is based on the simple network fed from 66/11 kV substation in Cairo region, with very long feeders. Overview of the relative loads of lines and voltage drops indicates that the major power supply problem in this network is high voltage drop. The consequence is low power delivery quality in the entire region, despite existing connection lines between feeders. The picture shows expected number of permanent outages and expected yearly duration of outages per consumer and placement of (manually operated) switches in the 11 kV network. Average power delivery quality data for feeders and the entire network are given in the Table I.
TABLE I EXISTING SITUATION OF SAMPLE OF DISTRIBUTION NETWORK
Basic Data of EXISTING SITUATION:
Number of nodes 24 node &(sources: 1 - feeders: 7 - transformers: 2)
Number of segments 61 (open: 10)
Overload 6857.4 kVA
Sum of losses 723.8kW
Max. voltage drop 8.38 %
Minimum transit margin -3000.3kVA
Total length 38.639 km
Total powered load 14287.8kVA
SOLUTION METHODOLOGIES
Collection and analysis done of the existing data of the electric network of the part of distribution network and main feeding system (substations 66/11kV) and distribution panel (11 kV). Network fed from 66/11KV substation; this is mainly formed of 11 bus bars. The network consists of 24 nodes, including the main substation bus bar. With total installed capacity of 15.730MVA, and a maximum load of 14287.8MVA, this means a utilization factor of about 0.806at system peak. Table II, Present the input data of nodes and sections expressed in node numbering respectively. Fig. 3 presents the single line diagram for the network showing incoming and outgoing feeders for sample network.
Fig. 3 Single line diagrams for the network showing incoming and
outgoing feeders for sample network
From PRAO program, all sections are shown in Fig. 4 in the normal operation scheme. [9].
Fig. 4. Relative loads and voltage drops of existing situation-
expected yearly outage duration
CONFIGURATION NETWORK
For optimization and reconfiguration using PRAO software is based on GA and the construction of an initial population of feasible individuals this technique using the system loops and applying specialized genetic operators as in the short example, the Result after 12 iteration (maneuver) by open and close the switches as follows in Table III:
C I R E D 24st International Conference on Electricity Distribution Stockholm, 10-13 June 2013
Paper 0176
CIRED2013 Session 5 0167
TABLE III RESULT AFTER MANEUVER SAMPLE NETWORK FROM EGYPT
Impact index Existing situation Maneuver Overload kVA 6857.4 0.0 Sum of losses kW 723.8 198.7 Max. voltage drop % 8.38 3.04 Total powered load kVA 14287.8 14287.8
Openings
Closings SHOUBR_291 EL_ZER_040 EL_ZER_054 EL_400_013 EL_ZER_033 271196_048 EL_ZER_039 EL_SHO_046 196107_032 793400_025 167400_017 EL_SHO_044
It's obvious from Table III that the maneuver succeed to reduction overload, voltage drop and power loss this mean that, the multi criterion algorithm solution to develop the network according to the criteria as shown on fig.5.
Fig. 5 Relative loads and voltage drops after maneuver
CONCLUSION In this paper, approach based on Genetic Algorithm in order to Multi-objective optimization analysis, management of electricity distribution network planning includes, besides classic load flow and voltage profile analyses, power delivery quality assessments, operation reliability analyses and above all economic evaluation of all investments. This is especially important in medium networks characterized with low consumption and long small cross sectioned conductor, causing two major problems: unacceptably high voltage drop and unacceptably low power delivery quality. Classic solutions for those problems, new MV cable or major reconstructions of the existing conductor, are just not economically justified investments in such areas. This paper deals with the electrical losses in distribution system which can be divided into technical and non-technical. Study of the factors affecting both types of losses has been presented. The magnitude of energy dissipation or the unavoidable component of technical losses depends largely on the system configuration, pattern of loading of distribution conductors, magnitude and types of loads, characteristics of equipment’s etc. There is a formulation of the feeder reconfiguration to reduce technical losses and balance the load of distribution network under normal operating conditions. The calculation of the technical losses in the sample network
was calculated using multi criterion algorithm. Multi criterion algorithm has been used to reduce the system power losses. This algorithm is based on reconfiguration of the system under study, while observing the over load and voltage drop combined with system loss to reach the optimum configuration for the system. Results of the paper show that the multi criterion algorithm has succeeded to reduce technical loss for all sample networks of the system to reach the acceptable limit. Non-technical losses such as unanticipated increases in system losses due to equipment deterioration over time, but are usually ignored in any calculations. System miscalculation on the part of the utilities, due to accounting errors, poor record keeping, or other information errors may also contribute to NTL [12]. • Non-technical losses are calculated by the use of statistical
analytical methods for detecting electricity theft by analyzing utility billing information.
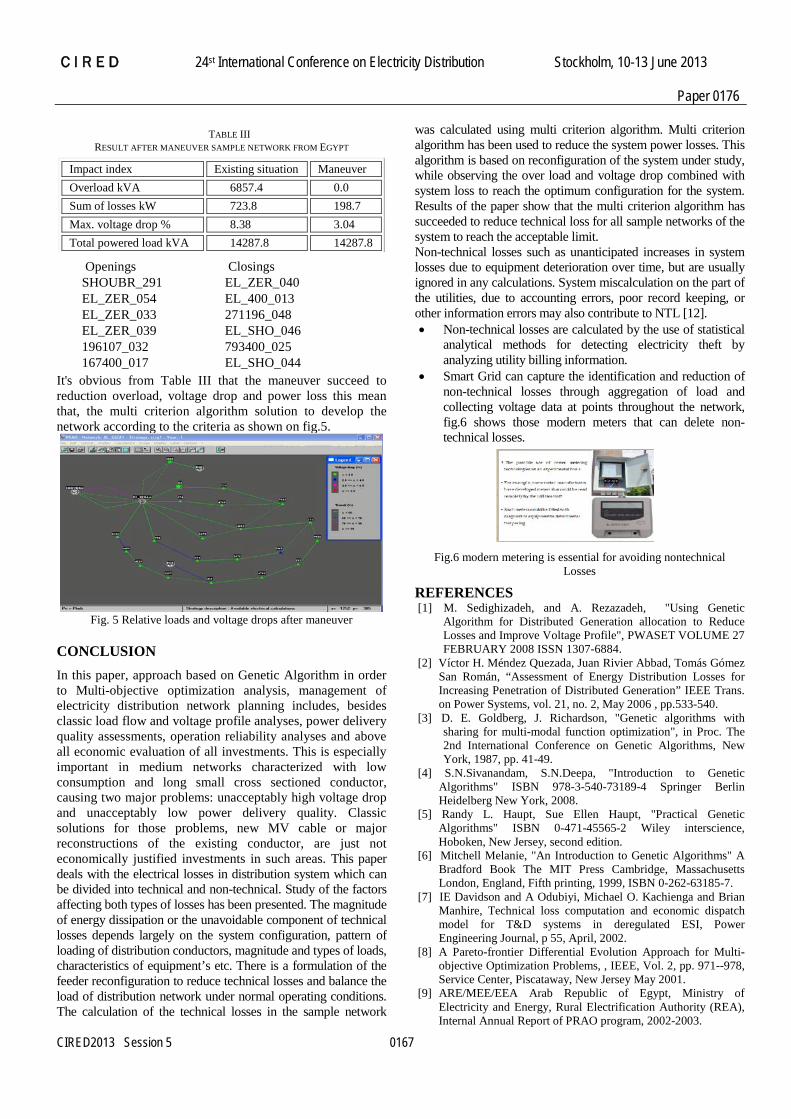
• Smart Grid can capture the identification and reduction of non-technical losses through aggregation of load and collecting voltage data at points throughout the network, fig.6 shows those modern meters that can delete non-technical losses.
Fig.6 modern metering is essential for avoiding nontechnical Losses
REFERENCES [1] M. Sedighizadeh, and A. Rezazadeh, "Using Genetic
Algorithm for Distributed Generation allocation to Reduce Losses and Improve Voltage Profile", PWASET VOLUME 27 FEBRUARY 2008 ISSN 1307-6884.
[2] Víctor H. Méndez Quezada, Juan Rivier Abbad, Tomás Gómez San Román, “Assessment of Energy Distribution Losses for Increasing Penetration of Distributed Generation” IEEE Trans. on Power Systems, vol. 21, no. 2, May 2006 , pp.533-540.
[3] D. E. Goldberg, J. Richardson, "Genetic algorithms with sharing for multi-modal function optimization", in Proc. The 2nd International Conference on Genetic Algorithms, New York, 1987, pp. 41-49.
[4] S.N.Sivanandam, S.N.Deepa, "Introduction to Genetic Algorithms" ISBN 978-3-540-73189-4 Springer Berlin Heidelberg New York, 2008.
[5] Randy L. Haupt, Sue Ellen Haupt, "Practical Genetic Algorithms" ISBN 0-471-45565-2 Wiley interscience, Hoboken, New Jersey, second edition.
[6] Mitchell Melanie, "An Introduction to Genetic Algorithms" A Bradford Book The MIT Press Cambridge, Massachusetts London, England, Fifth printing, 1999, ISBN 0-262-63185-7.
[7] IE Davidson and A Odubiyi, Michael O. Kachienga and Brian Manhire, Technical loss computation and economic dispatch model for T&D systems in deregulated ESI, Power Engineering Journal, p 55, April, 2002.
[8] A Pareto-frontier Differential Evolution Approach for Multi-objective Optimization Problems, , IEEE, Vol. 2, pp. 971--978, Service Center, Piscataway, New Jersey May 2001.
[9] ARE/MEE/EEA Arab Republic of Egypt, Ministry of Electricity and Energy, Rural Electrification Authority (REA), Internal Annual Report of PRAO program, 2002-2003.