Embed Size (px)
Citation preview

Reducing Transatlantic Barriers to Trade and Investment
An Economic Assessment
Final Project Report
March 2013
Prepared under implementing Framework Contract TRADE10/A2/A16
Joseph Francois (project leader)
Centre for Economic Policy Research, London

Colophon
Reducing Trans-Atlantic Barriers to Trade and Investment
Primary authors: Joseph Francois, Miriam Manchin, Hanna Norberg, Olga Pindyuk, Patrick Tomberger
Client: European CommissionPrepared under implementing Framework Contract TRADE10/A2/A16
Date: March 2013
Contact:Centre for Economic Policy Research3rd Floor77 Bastwick StreetLondon, EC1V 3PZUKTel: +44 (0)20 7183 8801Email: [email protected]: www.cepr.org

Contents
Colophon ii
Key Findings vii
Executive Summary 1
1. Introduction 5
2. Economic and Policy Background 72.1. Current trade flows and FDI 82.1.1. Trade 82.1.2. FDI 102.2. Current patterns of tariffs 142.3. Non-tariff barriers 152.3.1. Indexes and econometrics 16
3. Technical Discussion on CGE Modelling Set Up 213.1. The model 213.2. Sectors and regions in the model 24
4. The Policy Options Considered 274.1. Scenarios 274.2. Spill-overs 284.3. Sectoral effects: Preliminary ranking 30
5. Results 335.1. Limited Scenarios 335.2. Full FTA 455.2.1. Macro Results 455.2.2. Output and Trade 495.2.3. Sustainability Impacts 705.2.4. Global Effects 81
6. FDI Barriers 856.1 Indexes and comparison of levels of openness 856.2 Impact of NTBs on foreign affiliates 91
7. Conclusions 95
8. References 97
Annex 1: Mapping of model sectors 103
Annex 2: CGE model technical overview 105
Annex 3: High tariff sectors, ranked by HS2 applied tariff rates 113
Annex 4: Derivation of foreign investment income equation 115

iv
List of FiguresFigure 1 EU trade in goods with the US by sector (in million euros), 2011 9Figure 2 The bilateral composition of trade in projected benchmark (2027) 9Figure 3 EU27 outward stocks of FDI, 2010 10Figure 4 Top ten hosts of EU outward FDI stocks, 2010 (in 1000 million euros) 11Figure 5 Top ten sources of EU inward FDI stocks, 2010 (in 1000 million euros) 11Figure 6 US outward and inward FDI to the EU and the rest of the World, 2010 (in 1000 million euros) 12Figure 7 EU’s direct investment flows to the US, 2004-2011 13Figure 8 EU’s direct investment flows from the US, 2004-2011 13Figure 9 Trade Weighted Applied (MFN) average tariff rates 2007 14Figure 10 Value added and impact rankings 32Figure 11 Decomposition of EU output changes, ambitious scenario 63Figure 12 Average Value of NTM Indexes for FDI 87Figure 13 Average NTM index values for FDI located in the EU 88Figure 14 Breakdown of NTBs for FDI by sector 89Figure 15 Income from FDI, market size, and openness, 2007-2009 90Figure 3 Representative nested production technology 106Figure 4 Representative household demand 108
List of TablesSummary of Macroeconomic Effect 3Table 1 Perceived NTB index by business (index between 0-100) 18Table 2 Total trade cost estimates from NTB reduction in per cent, Ecorys (2009) 20Table 3 Sectors and regions used in the CGE model 25Table 4 Scenario Summaries 28Table 5 Impact ranking indexes 31Table 6 Changes in GDP (in per cent), 2027 benchmark, limited agreement, 20 per cent direct spill-overs 34Table 7 Changes in GDP (in million euros), 2027 benchmark, limited agreement, 20 per cent direct spill-overs 35Table 8 Changes in trade (in per cent), extra-EU trade for the EU, 2027 benchmark, limited agreement, 20 per cent direct spill-overs 36Table 9 Changes in trade (in million euros), extra-EU trade in case of the EU, 2027 benchmark, limited agreement, 20 per cent direct spill-overs 36Table 10 Changes in EU bilateral exports to US by sector (in per cent), 2027 benchmark, limited agreement, 20 per cent direct spill-overs 38Table 11 Changes in US bilateral exports to EU by sector, 2027 benchmark, limited agreement, 20 per cent direct spill-overs 39Table 12 Changes in EU trade by sector (in per cent), 2027 benchmark, limited agreement, 20 per cent direct spill-overs 40

v
Table 13 Changes in US trade by sector (in per cent), 2027 benchmark, limited agreement, 20 per cent direct spill-overs 42Table 14 Changes in EU output by sector (in per cent), 2027 benchmark, limited agreement, 20 per cent direct spill-overs 43Table 15 Changes in US output by sector (in per cent), 2027 benchmark, limited agreement, 20 per cent direct spill-overs 44Table 16 Changes in GDP (in per cent), 2027 benchmark, 20 per cent direct spill-overs 46Table 17 Changes in GDP (in million euros), 2027 benchmark, 20 per cent direct spill-overs 47Table 18 Household disposable income, million euro, 2027 benchmark 48Table 19 Changes in bilateral exports to the partner country (in per cent and million euros), 2027 benchmark, 20 per cent direct spill-overs 50Table 20 Changes in value of total exports (in per cent and million euros), extra-EU exports in case of the EU, 2027 benchmark, 20 per cent direct spill-overs 51Table 21 Changes in value of total imports (in per cent and million euros), extra-EU imports in case of the EU, 2027 benchmark, 20 per cent direct spill-overs 52Table 22 Changes in terms of trade (in per cent), 2027 benchmark, 20 per cent direct spill-overs 53Table 23 Change in EU tariff revenue (in million euros), 2027 benchmark 54Table 24 Trade diverted from intra-EU trade (in million euros), 2027 benchmark, 20 per cent direct spill-overs, ambitious experiment 55Table 25 Change in EU exports to non-US, extra-EU destinations (in million euros), 2027 benchmark, 20 per cent direct spill-overs, ambitious experiment 57Table 26 Change in EU imports from non-US extra-EU sources (in million euros), 2027 benchmark, 20 per cent direct spill-overs, ambitious experiment 59Table 27 Changes in EU output by sector (in per cent). 2027 benchmark, 20 per cent direct spill-overs 60Table 28 Changes in US output by sector (in per cent), 2027 benchmark, 20 per cent direct spill-overs 61Table 29 Changes in extra-EU exports and imports by sector (in per cent and million euros), 2027 benchmark, 20 per cent direct spill-overs 64Table 30 Changes in US exports and imports by sector (in per cent and million euros), 2027 benchmark, 20 per cent direct spill-overs. 66Table 31 Changes in bilateral exports from the EU to the US by sector (in per cent and million euros), 2027 benchmark, 20 per cent direct spill-overs 68Table 32 Changes in bilateral exports from the US to the EU by sector (in per cent and million euros), 2027 benchmark, 20 per cent direct spill-overs 69Table 33 Changes in wages for less and more skilled labour, total effects (in per cent), 2027 benchmark, 20 per cent direct spill-overs 71Table 34 Change in more skilled employment in the EU by sector (in per cent), 2027 benchmark, ambitious scenario, 20 per cent direct spill-overs 73Table 35 Change in more skilled employment in the US by sector (in per cent), 2027 benchmark, ambitious scenario 74Table 36 Change in less skilled employment in the EU by sector (in per cent), 2027 benchmark, ambitious scenario 75Table 37 Change in less skilled employment in the US by sector (in per cent), 2027 benchmark, ambitious scenario 76

vi
Reducing Transatlantic Barriers to Trade and Investment
Table 38 Displacement of less and more skilled labour in the EU and US, total effects (in per cent), 2027 benchmark, 20 per cent direct spill-overs 77Table 39 Changes in CO2-emissions (in thousand metric tons), 2027 benchmark, 20 per cent direct spill-overs 79Table 40 Changes in land use (in per cent), 2027 benchmark, 20 per cent direct spill-overs 80Table 41 Total effects on GDP for rest of the World (in million euros and per cent), 2027 benchmark, 20 per cent direct spill-overs 82Table 42 Change in exports by region (in per cent), 2027 benchmark, 20 per cent direct spill-overs 83Table 43 Regression estimates for NTMs and FDI 92Table A1 Mapping of Model Sectors to GTAP 103Table A2 Mapping of Model Sectors to ISIC rev 3.1 104Table A3 Annualized GDP growth rates 111Table A4 HS-2 Classification, top 2 per cent of tariff lines 113

vii
• An ambitious and comprehensive transatlantic trade and investment agreement
couldbringsignificanteconomicgainsasawholefortheEU(€119billionayear)
andUS(€95billionayear).Thistranslatestoanextra€545indisposableincome
eachyearforafamilyof4intheEU,onaverage,and€655perfamilyintheUS.
• ThebenefitsfortheEUandUSwouldnotbeattheexpenseoftherestoftheworld.
Onthecontrary,liberalisingtradebetweentheEUandtheUSwouldhaveaposi-
tiveimpactonworldwidetradeandincomes,increasingglobalincomebyalmost
€100billion.
• Incomegainsarearesultofincreasedtrade.EUexportstotheUSwouldgoupby
28%,equivalent toanadditional€187billionworthofexportsofEUgoodsand
services.Overall,totalexportswouldincrease6%intheEUand8%intheUS.
• Reducing non-tariff barrierswill be a key part of transatlantic liberalisation.As
muchas80%ofthetotalpotentialgainscomefromcuttingcostsimposedbybu-
reaucracyandregulations,aswellasfromliberalisingtradeinservicesandpublic
procurement.
• Theincreasedlevelofeconomicactivityandproductivitygainscreatedbytheagree-
mentwillbenefittheEUandUSlabourmarkets,bothintermsofoverallwagesand
newjobopportunitiesforhighandlowskilledworkers.Labourdisplacementwill
bewellwithinnormallabourmarketmovementsandeconomictrends.Thismeans
arelativelysmallnumberofpeoplewouldhavetochangejobsandmovefromone
sectortoanother(0.2to0.5percentoftheEUlabourforce.)
• TheagreementwouldhavenegligibleeffectsonCO2emissionsandonthesustain-
ableuseofnaturalresources.
Key Findings


1
TheeconomiesoftheEuropeanUnionandtheUnitedStatesareveryimportanttrading
partnersforeachother.Althoughaveragetarifflevelsarerelativelylowalready,various
non-tariffbarriersorNTBs(oftenintheformofdomesticregulations)onbothsides
oftheAtlanticconstituteimportantimpedimentstodeepeningtransatlantictradeand
investmentlinkages.Thisstudyexaminestheimpactofthereductionofsuchbarriers.
Evenwheretheymightnotbedirectlytargetingcross-borderactivities,domesticrules
andregulationsneverthelesscanplaceacostontradeandinvestment.However,unlike
tariffs,itshouldalsobestressedthatmanyregulationscannotsimplyberemovedwhen
theyservelegitimatedomesticpurposes.Yetinsuchcasesthecostsinvolvedmaystill
bemitigatedorreducedthroughpartialregulatoryconvergenceandcross-recognition
ofstandards.Whilethisislikelytobeadifficultprocess,thepotentialbenefitsinterms
ofproductivityandincomesaresubstantial.
Thisstudyreviewstheimportanceofthebilateraleconomicrelationshipandprovides
computablegeneralequilibrium(CGE)-basedestimatesfortheeconomy-wideimpact
of reducing both tariff and non-tariff barriers (NTBs). Estimates are providedwith
regardstoexpectedchangesinGDP,sectoroutput,aggregateandbilateraltradeflows,
wages, and labour displacement, amongother issues.The analysis uses theGTAP8
database(projectedto2027),inconjunctionwithNTBestimatesreportedintheEcorys
(2009)study.Thestudyinvestigatesdifferentpolicyoptionsforthedeepeningofthe
bilateraltradeandinvestmentrelationshipbetweentheEUandUS.Theserangefrom
partialagreementsthatarelimitedinthescopeofbarrierstheywouldaddress(tariffs
only, or services only, or procurement only) to a full-fledged free trade agreement
Executive Summary

Reducing Transatlantic Barriers to Trade and Investment – An Economic Assessment
2
(FTA) with a comprehensive liberalisation agenda covering simultaneously tariffs,
procurement, NTBs for goods, and NTBs for services. The comprehensive option
includestwoscenarios:alessambitiousagreementthatincludesa10percentreduction
intradecostsfromNTBsandnearlyfulltariffremoval(98percentoftariffs)andan
ambitiousscenariothatincludestheeliminationof25percentofNTBrelatedcosts
and100percentoftariffs.Inbothscenariosmoreambitionisimposedonthelowering
ofprocurement-relatedNTBsthanforotherNTBsaffectinggoodsandservices.Itis
assumedthatNTBslinkedtoprocurementarereducedby25percentor50percent,
inthe“lessambitious”andinthe“ambitious”scenariosrespectively.Theimpactof
partialalignmentofglobalrulesandstandardswithanewsetofEU-USstandardsand
cross-recognitionagreementsisalsoincludedintheassessment.
The results indicate positive and significant gains for both economies. Under a
comprehensiveagreement,GDPisestimated to increasebybetween68.2and119.2
billioneuros for theEUandbetween49.5and94.9billioneuros for theUS(under
the less ambitious and more ambitious scenarios). However, if the FTA would be
limitedtotariffliberalisationonly,orservicesorprocurementliberalisationonly,the
estimatedgainswouldbe significantly lower.For example, anFTA limited to tariff
liberalisationwouldleadtoalower(23.7billioneuro)increaseinGDPfortheEUand
a9.4billioneurosincreasefortheUS.Thestudyalsoquantifiespotentialbenefitsfrom
NTBreductionaffectingFDI.Theoverallmessageisthatnegotiatinganagreementthat
wouldbeofacomprehensivenaturewouldbringsignificantlygreaterbenefitstoboth
economies.
Anothercoremessagethatfollowsfromourresultsisthatfocusingeffortsonreducing
NTBsiscriticaltothelogicoftransatlantictradeliberalization.Differentapproaches
tothesameregulatorychallengeshavetheunintendedconsequenceofincreasingcosts
for firms,which have to complywith two regulatory environments, dragging down
labourproductivity.NegotiationonNTBsprovidestheopportunitytopursueamixof
cross-recognitionandregulatoryconvergencetoreducethesebarriers.Comparedtoa
focusonNTBS,justlimitingtheexercisetotariffswouldleadtomuchmorelimited,

Executive Summary
3
thoughpositive effects. Furthermore, thegains to the transatlantic economies from
NTBreductionarenotprojectedtobeattheexpenseoftherestoftheworld,thoughthe
rest-of-worldimpacthingescriticallyonthepotentialforglobalconvergencetoward
EU-US standards, which could then become de facto global standards and have a
knock-oneffectloweringNTBsmultilaterally.Suchaprocessimpliesimprovementof
marketaccessforthirdcountries,helpingtooffsettradediversion.
Finally, this study also reports estimates on sustainability impacts -- changes in
emissionsandinnaturalresourceutilization.EliminationofNTBsimpliesimproved
productivity(i.e.lessprimaryinputsarerequiredforcurrentactivity).Theresultspoint
tonegligibleeffectsontherateofCO2emissionsandutilisationofnaturalresources.
Summary of Macroeconomic Effect
Limitedagreement:tariffsonly
Limitedagreement:servicesonly
Limitedagreement:procurement
only
Comprehensiveagreement:lessambitious
Comprehensiveagreement:ambitious
ChangeinGDP
EU,millioneuros 23,753 5,298 6,367 68,274 119,212
US,millioneuros 9,447 7,356 1,875 49,543 94,904
Bilateralexportsf.o.b.
EUtoUS,millioneuros
43,840 4,591 6,997 107,811 186,965
UStoEU,millioneuros
53,777 2,859 3,411 100,909 159,098
Totalexportsf.o.b.
extra-EU,millioneuros
43,740 5,777 7,136 125,232 219,970
US,millioneuros 57,330 5,488 5,942 142,071 239,543
Note: estimatestobeinterpretedaschangesrelativetoaprojected2027globaleconomy.


5
Thetransatlantictraderelationshipisadeepone,rootedincenturiesofsharedeconomic
history. In thepost-warperiod, this facthasbeen reflectednotonly in early shared
steps leadingultimately to themodernmultilateral tradingsystem,butalsoperiodic
initiativestoformaregionaltradeagreement.1Withtherisingimportanceofglobaland
regionalproductionchainsandinternationalfirms,thelogicforaregional,transatlantic
agreement seemscompelling.Together, the twoeconomiesaccount for roughlyhalf
of world output and world trade. They are, mutually, each other’s most important
investmentpartnersaswell.
In 2012, a comprehensive dialoguewas initiated between the EuropeanUnion and
UnitedStates,regardingpossibilitiesfordeepeningoftransatlantictradeandinvestment
relations.Thediscussionsregardingthepossibledeepeningoftheselinksareon-going.
This report offers quantification of the effects of a trade and investment agreement
underarangeofpossiblepolicyoptions.BoththeEUandtheUShaverelativelylow
MFNtariffs.But,giventhemagnitudeofbothtradeandinvestmentflowsbetweenthe
EUandtheUS,removingevenrelativelyminorimpedimentstotheseflowswillhavea
significantimpact,withpotentialsubstantivebenefitsforbotheconomies.Inaddition,
sincetheexistingnon-tariffbarriersalsoactasimpedimentstotradeandinvestment,
therearegoodreasonstobelievethattherearesignificantuntappedgainsfromadeeper
tradeandinvestmentrelationship.
1 Past initiativeshave includedboth theNAFTA(NorthAtlanticFreeTradeArea)and theTAFTA(TransatlanticFreeTradeArea).SeeBaldwinandFrancois(1997a,1997,1999)forbackgroundonearlierinitiatives.SeeBaldwin(2012)andFrancois,Manchin,andTomberger(2012)ontheriseinvaluechainsandglobalproduction.
1. Introduction

Reducing Transatlantic Barriers to Trade and Investment – An Economic Assessment
6
This report builds on an important previous study benchmarking the current level
of transatlanticNTBs.That report found that thepotentialgains for theEUandUS
were substantial (Ecorys, 2009). Since the Ecorys study was published, economic
conditionshavechanged,whilethelikelyfocusofapossibleagreementisnowbetter
defined.Workingwith new data (including theGTAP8 database,more recent trade
and tariff information and new investment income data fromEurostat), the present
reportprovidesanupdatedandmoreaccuratesetofestimates.WeprovidenewCGE-
basedestimatesfortheeconomy-wideimpactofremovingnotonlyNTBs(quantified
onthebasisoftheestimatesinEcorys(2009),2butalsotariffsaffectingtransatlantic
tradeflows.Inaddition,wehaveexpandedtheanalysisbyprovidinganassessmentof
theimpactofremovingbarrierstoforeigndirectinvestment(FDI)ontheactivityof
multi-nationalenterprises(MNEs)acrossthetransatlanticmarketplace.BoththeCGE
andinvestmentassessmentsbuildonthesurveyandeconometricworkoftheoriginal
Ecorysstudy.Thereportisstructuredasfollows.Chapter2providesthebackground
fortheeconomicassessment.ThisincludescurrenttradeandFDIflows,aswellasa
technical discussion, providing an overviewof howNTBshavebeen identified and
measured,basedonthe2009Ecorysreport.InChapters3-5wesetoutandemploya
CGEmodeltoexaminebotheconomicandsocio-economic(sustainability)impactsof
trade-relatedmeasures.Chapter6focusesonforeigninvestment.InChapter7weoffer
someconcludingcomments.
2 InEcorys(2009)study,non-tariffbarriersaredefinedas“allnon-priceandnon-quantityrestrictionsontradeingoods,servicesandinvestment,atfederalandstatelevel.Thisincludesbordermeasures(customsprocedures,etc.)aswellasbehind-thebordermeasuresflowingfromdomesticlaws,regulationsandpractices”.

7
WestartthischapterwithanoverviewofcurrenttradeandFDIrelationshipsbetween
theEUandUS,aswellastariffsandNTBsthatarecurrentlyinplace.Indoingso,we
definethecontextinwhichweestimatetheeffectsofliberalisingtradeandinvestment
betweenthetwoeconomies.
TheEUandtheUSarerelativelyopentowardseachotherintermsofinvestmentand
trade,asreflectedinrelativelylowlevelsfortariffs.However,variousNTBs(oftenin
the formofdomestic regulations)onboth sidesof theAtlantic constitute important
impedimentstotransatlantictradeandinvestmentflows.Eventhoughtheymightnot
bedirectlytargetingcross-borderactivities theyneverthelessdobearacostontrade
andinvestment.ThereductionofsuchbarrierscouldpotentiallybenefitboththeEU
andtheUS.However,unliketariffs,manyregulationscannotsimplyberemoved,as
theyoftenserveimportantandlegitimatedomesticobjectiveslikeproductsafetyand
environmentalprotection. Yetsuchcostsmaybereduced throughpartial regulatory
convergence and cross-recognition of standards. Still, some amount of regulatory
divergenceisinevitableandwillremain,asregulationsreflectdifferencesingeography,
language,preferences,culture,andhistory.Thus,inarealisticanalyticalexercise,while
itcanbeassumedthatsomeNTBscanbeeliminatedbymutualagreementandeffort,
their100percenteliminationshouldnotbeconsideredasarealisticoutcome.3
3 Atthesametime,asbothregionsarehighincomewithhighstandardsfordomesticobjectives,neithershouldregulatoryconvergencebeseenasaprocessforbilateralloweringofstandards,butratherasamechanismforreinforcementofcomparableobjectivesotherwisereachedthroughdifferentregulatorymeans.
2. Economic and Policy Background

Reducing Transatlantic Barriers to Trade and Investment – An Economic Assessment
8
2.1. CurrenttradeflowsandFDI
2.1.1. Trade
TheUS is themost important trade partner for theEU asmeasured by exports. In
2011,around17percentoftotalEUexportsweredestinedtotheUSmarket.TheUS
isalsoanimportantsourceofEUimports.Itisthethirdmostimportant(11percent
of total imports)afterChinaandRussia4.For theUS, theEUisalsoakeybilateral
tradepartner.TheEUwasthesecondmostimportantdestinationforUSexports(after
Canada),representing19percentoftotalexports.Itisalsothesecondmostimportant
importpartner(afterChina),supplying17percentoftotalUSimports.5
ThemagnitudeofthetraderelationshipbetweentheEUandtheUS,andtheimportance
of the two economies as bilateral partners, suggests that anFTA thatwould reduce
obstaclesandcoststotradebetweenthetwocouldhavesignificantimpactsontradeand
ontheireconomicperformance.
Figure1showsEUmerchandisetradewiththeUSdividedbymainsectorsfortheyear
2011.Mostimportsandexportstakeplaceinthemachineryandtransportequipment
sector.Thisamountedto70,850millioneurosofEUimportsfromtheUS,and104,429
millioneurosworthofEUsalestotheUS.Thesecondmostimportantsectorforgoods
tradebetweentheEUandtheUSischemicals.AlsointhissectortheEUexportsmore
thanitimports(around50percentmore).
4 Source:Eurostat.5 Source:Eurostat.

Economic and Policy Background
9
Figure 1 EUtradeingoodswiththeUSbysector(inmillioneuros),2011
Source: Eurostat
Giventhatgoods tradeaccountsforroughly65percentof totalbilateral trade, (see
Figure2), liberalisationefforts (if thesameacross theboard)are likely to lead toa
morepronouncedimpactintermsofexchangesofgoodsratherthanservicesbetween
theUSandEU.
Figure 2 Thebilateralcompositionoftradeinprojectedbenchmark(2027)
Source: modelbenchmarkdatabase.

Reducing Transatlantic Barriers to Trade and Investment – An Economic Assessment
10
2.1.2. FDI
NorthAmericaisthemostimportantdestinationforEUoutwardFDI,ascanbeseen
inFigure 3.The region hosts about one-third of totalEUoutwardFDI stocks.The
secondmost important region forEU’s outwardFDI stock is the so-called non-EU
EuroperegionthatincludestheformerSovietUnioncountries,Switzerland,Norway
andTurkey.Theseeconomiesholdaboutone-fourthofEUFDIstocks.Thethirdmost
important region forEU’sFDI isAsia,whichaccounts for14percentof totalFDI
outwardstocks.
Figure 3 EU27outwardstocksofFDI,2010
Source: Eurostat.
While inFigure 3we focused on regions, Figure 4 andFigure 5 (below) show the
breakdown of EU FDI partners by major country (instead of regions).Again, this
confirmstheimportanceoftheUS.Onacountrybasis,theUSstandsoutevenmoreas
themostimportantbilateralinvestmentpartnerfortheEU.EUoutwardFDIstocksin
theUSaremorethantwiceaslargeastothesecondmostimportanthostcountryfor
EUFDI,whichisSwitzerland.TherelativeimportanceoftheUSassourceofFDIin

Economic and Policy Background
11
theEUisevenmorepronouncedwhenviewedonacountrybasis,withtheUSowning
almostfourtimesmoreofEUinwardstocksofFDIthanthesecondmostimportant
partnercountry,Switzerland.GiventhemagnitudesoftheFDIbetweentheEUandthe
USanypolicyinfluencingthefurtherflowscouldhaveasignificantimpactonthese
economies.
Figure 4 ToptenhostsofEUoutwardFDIstocks,2010(in1000millioneuros)
Source: Eurostat
Figure 5 ToptensourcesofEUinwardFDIstocks,2010(in1000millioneuros)
Source: Eurostat

Reducing Transatlantic Barriers to Trade and Investment – An Economic Assessment
12
Figure6depictstheevolutionofoutwardandinwardFDItoandfromtheUS.Forthe
US,theEUisalsothemostimportantFDIpartner.ThestockofinwardFDIfromthe
EUexceedsthatfromtherestoftheworld.However,thestockofUSoutwardFDIto
theEUrepresentsanevenhigheramountthaninwardstockfromtheEU.
Figure 6 USoutwardandinwardFDItotheEUandtherestoftheWorld,2010(in
1000millioneuros)
Source: OECDandowncalculations
FDIactivitybetweenEUandUSsufferedtheconsequencesofthefinancialcrisisbutis
nowrebounding.Justbeforethefinancialcrisis,EUinvestmentflowstotheUSpeaked,
withalmost178,510millioneurosofEUinvestmentflowsgoingto theUSin2007
(seeFigure7).Thisrepresentedabout14percentofthetotaloftheEU’sinvestment
flowsgoingabroad.Duringthecrisis,EUinvestmentflowstotheUSdroppeddown
toalmost2004levels,withthelowestamountofbilateralflowstakingplacein2010.
Nevertheless,in2011,bilateralinvestmentflowspickedupagain,althoughnotreaching
yetpre-crisislevels.

Economic and Policy Background
13
Figure 7 EU’sdirectinvestmentflowstotheUS,2004-2011
Source: Eurostatandowncalculations.
InvestmentflowsfromtheUS(andfromtherestoftheworld)totheEUalsodropped
dramaticallyduringthecrisis(seeFigure8).Thehighestamountofinvestmentfrom
theUStookplacein2007,amountingto195,660millioneuros.In2010,theincoming
FDIflowswereonly114,763millioneuros.However,whilethevolumeofFDIinflows
fromtheUSisstillbelowthepre-crisislevel,theshareofinvestmentcomingfromthe
UShasreacheditspre-crisislevelasof2010.
Figure 8 EU’sdirectinvestmentflowsfromtheUS,2004-2011
Source: Eurostatandowncalculations.

Reducing Transatlantic Barriers to Trade and Investment – An Economic Assessment
14
GiventheimportanceandattractivenessoftheNorthAmericanregionforEUinvestors
andoftheEuropeanmarketforUSinvestorsanypolicyaimingtoremoveregulatory
barriers to transatlantic investmentscanbeexpected tohaveapotentiallyvery large
impact.
2.2. Current patterns of tariffs
Inthissectionwefocusonexistingtariffbarriers.Figure9showsthatthereissome
heterogeneityintermsoftariffprotectionsbetweentheEUandtheUS.Whileinmost
sectors, EU tariffs are slightly higher than those imposed by theUS, they are still
relativelylow.However,therearetwomainexceptions:motorvehicles,andprocessed
foods.TheEUaveragetariffsontheseproductsaresubstantiallyhigherthantheUS
tariffs.Formotorvehicles6theEUappliesanaveragetariff(8.0percent)thatisalmost
eighttimeshigherthantheUS.Forprocessedfoodproducts,EUaveragetariffs(14.6
per cent) aremore than four times higher thanUS average tariffs. For agriculture,
forestryandfisheriesaveragetariffsarealsorelativelyhigh(about3.7percent)butfor
theseproductsthereisnodifferencebetweentheEUandtheUS.
Figure 9 TradeWeightedApplied(MFN)averagetariffrates2007
Source: WTO,CEPII,UNCTADmappedtoGTAP8
6 Motorvehiclessectorinthiscaseincludesalsopartsandcomponents.

Economic and Policy Background
15
Giventhecurrenttariffstructure,thescopefortariffreductionstohaveasignificant
impactontradeflowsislimited.Indeed,formostsectors,afurtherreductionintariffs
impliesverysmallabsolutechangesinthelevelofprotection.Nevertheless,insome
sectors,suchasprocessedfoods,agriculture,forestryandfisheries,andmotorvehicles,
the impact is likely tobemoresubstantial.Forothersectors,NTBsare theprimary
driverofpotentialimpactaswillbeshowninthenextsection.
2.3. Non-tariff barriers
NTBs and regulatory divergence are complex issues to dealwith analytically.Even
the measurement of the importance of these barriers for trade and investment is a
difficultexercise.ThisstudyreliesontheearlierworkonthistopicintheEcorys(2009)
study.TheEcorys study remains themost comprehensive and detailed to date.The
methodologyincorporatedinthatstudyusedamulti-prongedapproachthatcombined
literaturereviews,businesssurveys,econometricanalyses(gravitymodellingtogether
with CGEmodelling), as well as consultations with regulators and businesses and
inputs by sector experts aiming to obtain a qualitative andquantitative estimates of
transatlanticNTBs.WhiletheEcoryssurveyfocusedonbothtradeandFDI,wefocus
hereontrade-relatedbarriers.WewillreturntoFDIbarriersinChapter6.

Reducing Transatlantic Barriers to Trade and Investment – An Economic Assessment
16
2.3.1. Indexes and econometrics
Toestimatethead-valoremequivalentofNTBs(theimpactonpricesandcosts)and
toquantifytowhatextentthoseareremovablebetweenthetwoeconomies,theEcorys
(2009)studyundertookacomplexsetofassessments.Wesummarizethosestepsbriefly
here.Theassessmentinvolvedsurveyscombinedwithgravity-basedeconometrics.7
7 ForfurtherdiscussiononthemethodologiesusedforNTBquantification,whichtechnicallyareknownasgravitymodelsseebothEcorys(2009)Chapter3.4,andalsoAnderson,Bergstrand,Egger,andFrancois(2008).Forgoods,selectionbasedgravitymodellingwasused. Servicesbarrierswerebasedon theNTBelasticityestimates fromFrancoisandHoekman(2010).
Box 1 NTBSandtheconceptsofcostandrents
NTBs and regulatory differences can have two main effects. NTBs can either
increase thecostofdoingbusinessfor firms,or theycanrestrictmarketaccess.
TraditionalNTBs,likeimportquotas,areanexamplewhereNTBsmarketaccess.
In contrast, regulations that require expensive reconfiguration of products (like
changing voltage or reconfiguration of an exhaust system) for export are an
exampleofcostraisingNTBs.Bothcanhavedifferentimpactsbychangingmarket
concentration and economic power (and thus profits) of companies. In order to
beabletomakeadistinctionbetweenthosetwotypesofNTBs,theconceptsof
‘cost’and‘rent’areincludedhereinmodellingofNTBs,followingthefindings
ofthefirmsurveys(andrelatedliterature)intheEcorys(2009)study.Thatstudy
foundthatabout60percentof theprice impactofNTBscouldbeclassifiedas
following from actual cost increases on average, while the creation of market
power(economicrent)wasresponsiblefortheother40percentofpriceincreases.
Thisisanaverage,andthereissomevariationacrossbothsectorsandcountries
inthisregard.InthecaseofNTB-relatedcostincreases,thisconstitutesawelfare
losstosociety.Incaseofanincreaseinmarketconcentration,consumerpricesmay
alsogoup.Howeverpartoftheincreaseisthenappropriatedbycompaniesasthey
reapincreasedrevenuesandprofits.Thusthereisaredistributionofwelfare,and
notsimplyareductionineconomicefficiency.

Economic and Policy Background
17
TheNTBestimatesinvolvedatwo-partsurveyasafirststep.Thesurveywasconducted
on firms in theEUandUSengaged in trade, and firms in theEUandUSengaged
in FDI.Theywere asked both detailed questions aboutNTBs, and amore general
setofquestionsaboutoverallmarketaccessconditions.8 IncaseswhereNTBswere
identified,companieswereaskedabouttherelativeimportanceofsuchbarriers.Firms
also provided a comprehensive generalmeasure ofNTB-relatedmarket access (the
combinedimpactofallbarriers)intheformofarankingscaledfrom0to100.With
theoverall rankingquestion, 0 indicated that therewerenoNTBsof any type, and
100meant therewere prohibitively highNTBs.The business survey restrictiveness
indicators were then crosschecked against OECD (2007) restrictiveness indicators
and against the ProductMarket Regulation (PMR) indexes. For the service sectors
the combinationof theOECD restrictiveness indicators and the survey resultswere
used.TheresultingmeasuresaresummarisedinTable1below.Thefirmrankingsare
bilateral(forexampleanAmericanfirminFrancemightgiveadifferentrankingthan
aGermanfirminFrance).
ThereportedNTBrankings(theNTBindex)ongoodsonbothsidesoftheAtlanticare
generallyhigherthanonservices,rangingfrom20percentto56percent.Thehighest
perceived NTB levels were found on the aerospace and space industry. On goods
exported to theUS,machinery also exhibits high levels ofNTBs,while the lowest
levelsarereportedforpharmaceuticals.ForgoodsexportedfromtheUS,highlevels
ofNTBswerereportedforchemicals,cosmeticsandbiotechnology.Lowerlevelsof
NTBswerereportedforelectronics,iron,steelandmetalproducts.
Ofcourse,thefirmrankingsofgeneralopennessarerelative.Theydonottranslateinto
actualimpactsoncostsandprices.Forthis,thesurveydatawasthenintegratedwith
asetofeconometricmodels(knownasgravitymodels)toestimatethecorresponding
ad-valoremofpercentpriceimpactofthevariationsinNTBlevels.Onthatbasis,the
8 Thegeneralrankingquestionsarereproducedasanannextothisreport.SeetheannextotheEcorys(2009)reportformoreinformationonthemoredetailedquestions.

Reducing Transatlantic Barriers to Trade and Investment – An Economic Assessment
18
Ecorys (2009) report alsoprovidesprice/cost estimatesof existingNTBs for traded
goodsandservicesinapercentageformthatcanbeinterpretedsimilarlytoad-valorem
tariffs.TheseestimatesarereportedinTable2below.Theyreflectthehigherpricesthat
resultbecauseofNTBs.9
Table 1 PerceivedNTBindexbybusiness(indexbetween0-100)
Sector EUexportstotheUS USexportstotheEUServices Sectors:Travel 35.6 17.6Transport 39.9 26.3FinancialServices 29.7 21.3ICT 20.0 19.3Insurance 29.5 39.3Communication 44.6 27.0Construction 45.0 37.3OtherBusinessServices 42.2 20.0Personal,CulturalandRecreationalServices
35.8 35.4
Goods Sectors:Chemicals 45.8 53.2Pharmaceuticals 23.8 44.7Cosmetics 48.3 52.2Biotechnology 46.1 50.2Machinery 50.9 36.5Electronics 30.8 20.0Office,InformationandCommunicationEquipment
37.9 32.3
Medical,MeasuringandTestingAppliances
49.3 44.5
AutomotiveIndustry 34.8 31.6AerospaceandSpaceIndustry 56.0 55.1FoodandBeverages 45.5 33.6Iron,SteelandMetalProducts 35.5 24.0Textiles,ClothingandFootwear
35.6 48.9
WoodandPaper,PaperProducts
30.0 47.1
Source: Ecorys(2009)
9 Thereadermaynotesomedifferencebetweenthesectorsinthetablesinthissection.WehavestartedinTable1withthefullsetofsectorsfromtheoriginalECORYSsurvey.Thesehavebeenconsolidatedwhenwemovetosectorsforthemodelling,bothintheoriginalECORYSstudyandinthisreport.

Economic and Policy Background
19
AccordingtotheestimatesinTable2,non-tariffbarriersarethehighestforfoodand
beverageproducts,withimportsfromtheUSfacinga56.8percenttariffequivalent,
whileEUexportstotheUSoftheseproductsfacea73.3percentextracost.Among
services,financialservicesareoneofthesectorswiththehighestestimatedNTBs.In
thissector,EUbarriersagainstUSexportsamountto11.3percent,whileUSbarriers
againstEUexports areestimated tobeabout31.7per cent.Barriers in the services
sectors arehigheron theEU side for thebusiness and ICT sector, communications
sector,construction,andpersonal,cultural,otherservices.OntheotherhandtheUS
barriersforEUexportersintheservicessectorsarehigherthanintheEUinthefinance
andinsurancesectors.
Itshouldbestressedthatincontrasttoreducingtariffs,theremovalofNTBsisnotas
straightforward.Infact,itisunlikelythatallareasofregulatorydivergenceidentified
actuallycanbeaddressed.Aspreviouslypointedout,therearemanydifferentsources
of NTBs and thus removing them may require constitutional changes, unrealistic
legislative changes, or unrealistic technical changes. Removing NTBsmay also be
difficultpolitically,e.g.becausethereisalackofsufficienteconomicbenefittosupport
theeffort;becausethesetofregulationsistoobroad;becauseofconsumerpreferences,
language and geography; or due to other political sensitivities. In recognition of
thesedifficulties,intheassumptionsofthescenarios,thedegreetowhichanNTBor
regulatorydivergencecan,potentiallyandrealistically,bereducedistakenintoaccount
whichisdiscussedinmoredetailsinthefollowingsubchapter.

Reducing Transatlantic Barriers to Trade and Investment – An Economic Assessment
20
Table 2 TotaltradecostestimatesfromNTBreductioninpercent,Ecorys(2009)
Sector Totaltradebarriers:EUbarriersagainstUSexports
Totaltradebarriers:USbarriersagainstEUexports
Foodandbeverages 56.8 73.3Chemicals 13.6 19.1Electricalmachinery 12.8 14.7Motorvehicles 25.5 26.8Othertransportequipment 18.8 19.1Metalsandmetalproducts 11.9 17.0Woodandpaperproducts 11.3 7.7Othermanufactures N/A N/A average goods 21.5 25.4TransportAir 2.0 2.0Water 8.0 8.0Finance 11.3 31.7Insurance 10.8 19.1BusinessandICT 14.9 3.9Communications 11.7 1.7Construction 4.6 2.5Personal,cultural,otherservices
4.4 2.5
average services 8.5 8.9
Source: Ecorys(2009),AnnexTableIII.1
At this stage, therearepatterns inTable2 thatwill carry forward in themodelling.
FollowingfromtheEcorys(2009)study,businessesperceivedtransatlanticNTBsas
substantiallylowerforservicesthanforgoods.Thismeansthat,forcomparablecuts
inbarriers inpercent terms, thedifferences inbarriers(combinedwith theabsolute
importanceingoodstraderelativetoservicestrade)implythatwecanexpectgreater
impactfromNTBreductionsingoodsthaninservices.

21
Thepurposeofthischapteristopresentanddiscussthemodelusedasbasisforthe
policyexperiments,includingthesectorandregionalaggregationthatwereused.
Inthisreport,theeconomicassessmentofatradeagreementbetweentheEUandUS
isbasedonacomputablegeneralequilibrium(CGE)modelofglobalworldtrade.The
CGEmodellingexerciseismeanttoestimatetheeffectsontheEUandUSeconomies.
CGEmodelsliketheonesusedherehelpanswerwhat-ifquestionsbysimulatingthe
price,incomeandsubstitutioneffectsinmarketequilibriumunderdifferentassumptions
aboutchangesinpolicy.Theeconomicoutcomesofthe“baseline”scenario(withno
policy change) can be compared to the different scenario associated with changes
in tradepolicy.The“baseline” for themodel is thus the equilibriumwithoutpolicy
change,andthe‘scenario’istheequilibriumafterthepolicychange.Theeffectofthe
policychangecanthenbebenchmarkedbythedifferencebetweenthetwo.
3.1. The model
TheCGEmodelemployedisbasedonthewidelyusedGTAPmodel(Hertel,1997),
with added features from theFrancois, vanMeijl, and vanTongeren (2005)model.
Moretechnicaldetailsofthemodelareprovidedintheannex.
Themostimportantaspectsofthemodelcanbesummarisedasfollows:
• Itcoversglobalworldtradeandproduction
• Itallowsforscaleeconomiesandimperfectcompetition
3. Technical Discussion on CGE Modelling Set Up

Reducing Transatlantic Barriers to Trade and Investment – An Economic Assessment
22
• Itincludesintermediatelinkagesbetweensectors
• It allows for trade to impact on capital stocks through investment effectswhich
allowstoobtainlonger-runimpactontheeconomy
ImperfectcompetitionintheFrancois,vanMeijl,andvanTongeren(2005)model,as
implementedhere,isexplainedinFrancois,Manchin,andMartin(2012).Itinvolves
firm level competition and supply of varieties of goods and services to both final
consumersanddownstreamfirmsunderwhatisknownasmonopolisticcompetition.
ThemodellingofinvestmenteffectsisbasedonFrancoisandMcDonald(1996).This
doesnotinvolvegrossforeigndirectinvestmentflows,butratherchangesinregional
andglobalcapitalstocks(machineryandequipment)asaresultofchangesinlevelsof
savingsandinvestment.
Box 2 Keyfeaturesofthemodel
Modelsimulationsarebasedonamulti-region,multi-sectorglobalCGEmodel.
Sectorsarelinkedthroughintermediateinputcoefficients(basedonnationalsocial
accountsdata)aswellascompetitioninprimaryfactormarkets.Themodelincludes
imperfectcompetition,short-runandlong-runmacroeconomicclosureoptions,as
wellasthestandardstatic,perfectcompetition,Armington-typeset-upasasubset.
Onthepolicyside,itofferstheoptiontoimplementtariffreductions,exporttax
and subsidy reduction, trade quota expansion, input subsidies, output subsidies,
andreductionsintradecosts.Internationaltradecostsincludeshippingandlogistic
services(thesourceoffob-cifmargins),butcanalsobemodelledasSamuelson-
typedeadweightcosts.Thiscanbeusedtocapturehighercostswhenproducingfor
exportmarkets,duetoregulatorybarriersorNTBsthatdonotgeneraterents(or
wheretherentsaredissipatedthroughrent-seeking).

Technical Discussion on CGE Modelling Set Up
23
In theCGEmodel, there is a single representative or composite household in each
region. Household income is allocated to government, personal consumption, and
savings. In each region the composite household owns endowments of the factors
of production and receives incomeby selling the services of these factors to firms.
It also receives income from tariff revenue and rents accruing from import/export
quotalicenses.Partoftheincomeisdistributedassubsidypaymentstosomesectors,
primarilyinagriculture.
Taxes are included at several levels in the model. Production taxes are placed on
intermediateorprimaryinputs,oronoutput.Tariffsareleviedattheborder.Additional
internal taxes are placed on domestic or imported intermediate inputs, andmay be
applied at differential rates that discriminate against imports.Where relevant, taxes
arealsoplacedonexports,andonprimaryfactorincome.Finally,whererelevant(as
indicatedbysocialaccountingdata)taxesareplacedonfinalconsumption,andcanbe
applieddifferentiallytoconsumptionofdomesticandimportedgoods.
Ontheproductionside,inallsectors,firmsemploydomesticproductionfactors(capital,
labourandland)andintermediateinputsfromdomesticandforeignsourcestoproduce
outputsinthemostcost-efficientwaythattechnologyallow.Inmostsectors,perfect
competition isassumed,withproducts fromdifferent regionsmodelledas imperfect
substitutes.
Heavymanufacturingsectorsaremodelledwithimperfectormonopolisticcompetition.
Monopolistic competition involves scale economies that are internal to each firm,
depending on its own production level.An important property of themonopolistic
competitionmodelisthatincreasedspecialisationatintermediatestagesofproduction
yields returns due to specialisation, where the sector as a whole becomes more
productivethebroadertherangeofspecialisedinputs.Inmodelsofthistype,partof
theimpactofpolicychangesinfinalconsumptionfollowsfromchangesinavailable
choices(thevarietyofgoodstheycanchoosefrom).Similarlyfirmsareaffectedby
changes in available choices (varieties)of intermediate inputs.Changes in available
Reducing Transatlantic Barriers to Trade and Investment – An Economic Assessment
24
varieties also involve changes in available foreign varieties, in addition to domestic
one.Asaresult,changesinconsumerandfirminputchoiceswill“spill-over”between
countriesastheytradewitheachother.
TariffsandtariffrevenuesareexplicitinthestandardGTAPdatabase,andthereforecan
bedirectlyincorporatedintothemodelusedheredirectlyfromthestandarddatabase.
However,NTBsaffectinggoodsandservicestrade,aswellascostsavingslinkedto
tradefacilitationarenotexplicitinthedatabaseandweneedtotakestepstocapture
these effects.Where NTBs leads to higher costs, we follow the standard approach
tomodelling icebergordead-weight tradecosts in theGTAP framework,originally
developedbyFrancois(1999,2001)withsupportfromtheECtostudytheMillennium
Round (nowknownas theDohaRound).10 Ithas featured in the jointEC-Canadian
governmentstudyonanEU-CanadaFTA,aswellasthe2009EcorysstudyonEU-US
non-tariffbarriers.Informalterms,wemodelchangesintheefficiencyofproduction
forsale inspecificmarkets. In thissense,wecancapture the impact thatNTBscan
haveinraisingcostswhenservingforeignmarkets.WhereNTBsinsteadinvolvehigher
pricesbecauseofrents,wemodelthisasadditionalmark-ups(higherprices)accruing
tofirms.AshighlightedalreadyinthediscussioninChapter2,thereisanapproximate
60:40splitbetweencostgeneratingNTBsandrentgeneratingNBTs,intermsofimpact.
3.2. Sectors and regions in the model
WhileintheGTAPdataabout60sectorsand130differentregionsareavailable,forthe
purposeofthisstudywehaveaggregatedsectorsandregionstoallowustoconcentrate
onthekeyresults.ThesectorandregionalaggregationsarepresentedinTable3.
10 TheoriginalFrancoisapproachhasgrownfromaspecializedextensioninearlyapplicationstoanowstandardfeatureoftheGTAPmodel,followingitsincorporationbyHertel,WalmsleyandItakura(2001).

Technical Discussion on CGE Modelling Set Up
25
Table 3 SectorsandregionsusedintheCGEmodel
Sectors RegionsAgrforestryfisheries EuropeanUnionOtherprimarysectors UnitedStatesProcessedfoods OtherOECD,highincomeChemicals EastEuropeElectricalmachinery MediterraneanMotorvehicles ChinaOthertransportequipment IndiaOthermachinery ASEANMetalsandmetalproducts MERCOSURWoodandpaperproducts LowIncomeOthermanufactures RestofWorldWatertransportAirtransportFinanceInsuranceBusinessservicesCommunicationsConstructionPersonalservicesOtherservices


27
In thischapterwesummarize thepolicyscenariosused in theCGEassessment that
followsinChapter5.Thisincludessomeexplanationofconcepts,suchas“policyspill-
overs,”thatareincludedinthescenarios.
4.1. Scenarios
Asdiscussed inChapter2,while it isconceivableforall tariffs toberemoved, it is
not realistic to assume that all NTBs and costs from regulatory divergence can be
removed.Thisisbecauseoftheunderlyingdifferencesinthenatureofthesemeasures.
AsaresultwhenmodellingtheliberalisationofNTBswemusttakeintoaccountthe
degree towhichNTB-related costs can realistically be reduced (via variousmeans
and techniques).On thebasis of theEcorys (2009) survey, a reasonableunderlying
ruleofthumbisthatapproximately50percentofthecost/priceimpactofNTBscan
beremoved–i.e. theyare“actionable.”While there issomevariationbysector, the
mappingfromoverallprice/costdifferencestothosethatcanbenegotiatedonreflects
thisfinding,whichisbasedonexpertopinions,cross-checkswithregulators,legislators
andbusinessessupportedbythebusinesssurveyfromtheEcorys(2009)study.Against
thisbackground,thestudyissetuparoundscenariosdifferingwithrespecttolevelsof
ambitionandscopeofcoverage.ThescenariosaresummarizedinTable4below.
Thescenariossummarizedinthetablearerelativelymodest.Startingfromthelevelof
barriersreportedinTable2,onlyabouthalfofthebarriersareconsideredasnegotiable
oractionable.Ofthese,halfarereducedinthemostambitiousscenario(or25percent
4. The Policy Options Considered

Reducing Transatlantic Barriers to Trade and Investment – An Economic Assessment
28
oftotalNTBsinTable2).Thisisthemostambitiousscenario.Themodestscenarios
assumeevenlessreductioninNTBs.Underboththeambitiousandmodestscenarios,it
isassumedthatmoreaggressiveliberalizationisappliedtoprocurement.Thescenarios
reported here are therefore far less ambitious than under the original Ecorys study,
wherefulleliminationofactionableNTBswasassumed.
Table 4 ScenarioSummaries
Narrow(limited)FTAScenariosTariffsonly 98percentoftariffseliminatedServicesonly 10percentofservicesNTBseliminatedProcurementonly 25percentofprocurementNTBseliminatedComprehensiveScenarios
Lessambitious
98percentoftariffseliminated
10percentofNTBseliminatedonbothgoodsandservices(20percentofactionable)
25percentofprocurementNTBseliminated
Ambitious
100percentoftariffseliminated
25percentofNTBseliminatedonbothgoodsandservices(50percentofactionable)
50percentofprocurementNTBseliminated
4.2. Spill-overs
Thesimulationsthatarecarriedoutalsotakeintoaccountconceptsofbothregulatory
convergenceandregulatoryspill-overs.Morespecifically,insettinguptheexperiments,
wehaveincludedtwosetsofpossibleeffectsbeyondbilateralliberalization.Theseare
definedasfollows.First,wehaveincludeddirect spill-overs.Thesearebasedonthe
assumptionthatimprovedregulatoryconditionsnegotiatedbetweentheEUandtheUS
willalsoresultinalimitedfallinrelatedtradecostsforthirdcountriesexportingtothe
EUandUS.Inotherwords,thiscapturestheextenttowhichthebilateralstreamlining
of regulationsandstandards,and reduction in regulatoryburdens,alsobenefitother
exporterstotheEUandUS.Thispositivemarketaccesseffectforthirdcountriesis
modelledasbeingaround20percentofthebilateralfallintradecostrelatedtoNTBs
forthecorescenarios.(Wehavealsoexamined10percentspill-oversasarobustness

The Policy Options Considered
29
check.)ThisconceptwasintroducedintheEU-JapanstudybyCopenhagenEconomics
(2009).Inpractice,itmeansthatifthereis5percentNTB-relatedtradecostreduction
betweentheEUandUS,therewillalsobea1percenttradecostreductionforthird
countriesexportingtotheEUandUS.Thelogicisthatfirmsinthirdcountriesmayfind
iteasiertomeeteitherEUorUSregulatoryrequirementsifbilateralnegotiationslead
to simplifications thatarenot inherentlydiscriminatory.KoxandLejour (2006), for
example,provideevidencethatdifferencesinregulationscanincreaseoperatingcosts
indifferentmarkets,reducingbilateraltrade.
Asecondindirecteffectinvolvingthirdcountriesisconsideredaswell:theindirect spill-
overs.Thesearemeanttogaugetheeconomicimplicationsifthirdcountriesadoptsome
ofthecommonstandardsagreedbetweentheEUandtheUS.Giventhat,collectively,
theEUandtheUSwouldstandastheworld’sbiggesttradingblock,thereisavery
realpossibilitythatmutualagreementonregulationsandstandardswouldbeadopted,
partially,alsobythirdcountries.Thus,wheretheEUandtheUSactasaregulatory
hegemon,thereisscopeforsettingdefactocommon,globalstandards.Thisimplies
thatthebilateralagreementwillgiveEUandtheUSimprovedmarketaccessinthird
marketsfromreducedNTBs.Inaddition,therewillbescopeforreductionsinNTBs
amongst third countries, as they converge further on common standards.Therefore,
indirectspill-overswillleadtolowercostsandgreatertradebetweenthirdcountriesas
well.Wehavemodelledindirectspill-oversas50percentofthedirectspill-overrate.
Thismeansthatforexamplefora5percenttradecostreductionbetweentheEUand
US,andwith20percentcorrespondingdirectspill-overs,wewillhavea1percent
(directspill-over)reductionforthirdcountriesexportingtotheUSorEU,anda0.5per
cent(indirectspill-over)reductionforEUandUSexportcoststothirdcountries,and
fortradebetweenthirdcountries.

Reducing Transatlantic Barriers to Trade and Investment – An Economic Assessment
30
4.3. Sectoral effects: Preliminary ranking
Atthisstage,wehavespelledout tradeflows, tariffbarriers,andnon-tariffbarriers.
InwhatfollowsinChapter5,wewillfocusoneffects.Beforedoingso,itisusefulto
benchmarkexpectations.Whatwemeanisthat,beforeweturntomodellingresults,
wewant toprovideanon-modelbased rankingof some important sourcesof likely
effects. This involves the data summarized inTable 5 below. In theTable, column
Asummarizes the totalvalueof tariffsandactionableNTBs(asdefinedbyEcorys)
appliedbytheUSagainstEUexports.Thenexttwocolumnssummarizetheimportance
ofeachsectortototalEUexportstotheUS.ColumnBisbasedongrossvalues,while
columnCisbasedinsteadonthevalueaddedcontainedinexports.11IncolumnC,we
seethatwhilechemicalsare12.38percentofexportsonagrossvaluebasis,theyare
somewhatlessimportantonavalueaddedbasis,accountingfor11.21percentofEU
valueaddedcontainedinexportstotheEU.Asacrudefirstpassatpossibleeffects,
columnEprovidesanimpact-rankingindex.Thisisbasedonthevalueaddedcontained
in exports by sector (C), the scope for liberalization (A), and theprice elasticityof
demandforimports(D).Together,theseprovidearoughestimateofincreasedexports,
onavalueaddedbasis,followingfromimprovedmarketaccesstotheUSforEUfirms.
Forexample,ofthetotalvalueaddedcontainedinEUexportstotheUS,columnEsays
thatfullliberalizationinchemicalscouldyieldan8.39percentincreaseintotalexports
totheUSonavalueaddedbasis.AsitisvalueaddedthattranslatesintoGDP,theindex
alsoprovidesacruderankingofoverallGDPimpactsofsector-specificliberalization.
11 SeeFrancois,Manchin,andTomberger(2012)forexplanationofthevalueaddedcalculations,whicharebasedonourCGEmodeldatabase

The Policy Options Considered
31
Table 5 Impactrankingindexes
A B C D E=.01*A*C*D
actionable
NTBs+tariffsgrossexport
shareexportvalueaddedshare
priceelasticity index
Agrforestryfisheries
3.70 1.73 2.09 4.77 0.37
Otherprimarysectors
0.00 1.36 1.70 12.13 0.00
Processedfoods 48.93 4.42 4.71 2.46 5.67Chemicals 14.69 12.38 11.21 5.09 8.39Electricalmachinery
9.91 1.09 0.94 9.65 0.89
Motorvehicles 22.49 8.81 7.11 10.00 15.99Othertransportequipment
8.63 5.31 4.94 7.14 3.04
Othermachinery 0.80 16.92 16.25 9.71 1.26Metalsandmetalproducts
6.69 2.75 2.53 13.91 2.36
Woodandpaperproducts
5.76 2.42 2.61 7.99 1.20
Othermanufactures
3.20 7.32 4.90 6.56 1.03
Watertransport 0.65 0.05 0.04 3.80 0.00Airtransport 2.35 3.12 2.41 3.80 0.22Finance 6.46 6.20 7.45 2.04 0.98Insurance 3.84 6.02 7.10 3.18 0.87Businessservices 1.58 10.07 12.28 3.18 0.62Communications 0.65 0.85 1.01 3.18 0.02Construction 0.90 0.35 0.36 4.21 0.01Personalservices 0.66 1.49 1.76 8.71 0.10Other(public)services
0.00 7.36 8.59 3.92 0.00
Source: CGEcalculations.
TheestimatesincolumnEofTable5areofcoursepartialequilibrium.Theymisscross-
sectoreffects,includinglabourmarketinteractionandintermediatelinkages.Theyalso
missconsumerbenefitsfromaccesstomoregoodsandservices.Evenso,theyprovide
aclearrankingoflikelyeffects.Thisrankingcarriesthroughtheestimatesinthenext
chapter, and so it isworth discussing the pattern for the impact indexes briefly, as
showninFigure10.Fromthefigure,wecanseethatforsomesectors,especiallymotor
vehicles, though they are not dominant on a value added basis, the combination of
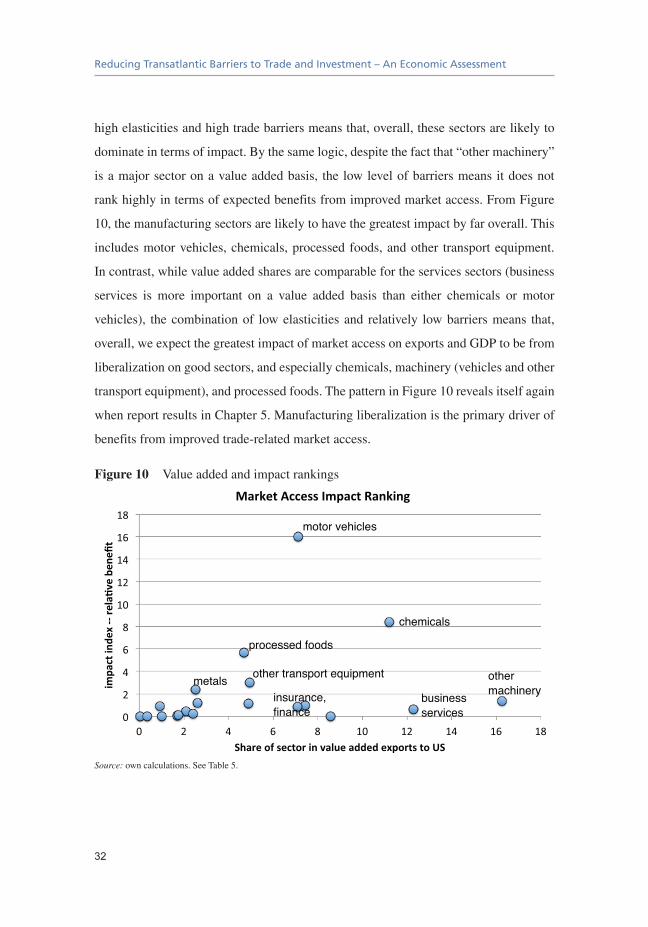
Reducing Transatlantic Barriers to Trade and Investment – An Economic Assessment
32
highelasticitiesandhightradebarriersmeansthat,overall,thesesectorsarelikelyto
dominateintermsofimpact.Bythesamelogic,despitethefactthat“othermachinery”
isamajorsectoronavalueaddedbasis, the lowlevelofbarriersmeansitdoesnot
rankhighlyintermsofexpectedbenefitsfromimprovedmarketaccess.FromFigure
10,themanufacturingsectorsarelikelytohavethegreatestimpactbyfaroverall.This
includesmotorvehicles,chemicals,processedfoods,andother transportequipment.
Incontrast,whilevalueaddedsharesarecomparablefortheservicessectors(business
services is more important on a value added basis than either chemicals or motor
vehicles), thecombinationof lowelasticitiesand relatively lowbarriersmeans that,
overall,weexpectthegreatestimpactofmarketaccessonexportsandGDPtobefrom
liberalizationongoodsectors,andespeciallychemicals,machinery(vehiclesandother
transportequipment),andprocessedfoods.ThepatterninFigure10revealsitselfagain
whenreportresultsinChapter5.Manufacturingliberalizationistheprimarydriverof
benefitsfromimprovedtrade-relatedmarketaccess.
Figure 10 Valueaddedandimpactrankings
Source: owncalculations.SeeTable5.

33
In this chapter we focus on the results of the CGE modelling of bilateral trade
liberalization.Theresultsarereportedwithrespecttoaneconomicbenchmarkprojected
outtotheyear2027,whichimpliesthatthattheycapturetheimpactoftheagreement
afulltenyearsaftertheimplementationoftheagreement,providingthelonger-term
impactofpolicychanges.First,wepresentresultsforthelimitedscenarios.Wethen
examinethecomprehensivescenarios,assumingthatanagreementwouldcollectively
covertariffs,services,andprocurement.Wethenmoveontoreportingestimatedeffects
on output and trade, first on an aggregate and then on amore disaggregate, sector
specific level.Wealsoprovideadiscussionof the effectsof removalofbarrierson
sustainability,i.e.effectsonlabour,CO2emissionsandtheuseofnaturalresources.
Thelastpartofthischaptersummarisestheresultingeffectsontherestoftheworld.
5.1. Limited Scenarios
Inthissection,wepresentresultsassumingthatalessambitious,limitedFTAwouldbe
implemented.Weanalysetheimpactassumingthatonlyasinglepolicypillar,i.e.only
tariffliberalisation,oronlyservicesliberalization,oronlyprocurementliberalisation
wouldbe implemented.Note that the liberalisationefforts thatarebeingconsidered
for each pillar are similar to those envisaged in the less ambitious scenario of the
comprehensiveFTAoption(seeTable4),including20percentspill-overs.12Forthe
tariffonlyagreementthereareobviouslynospill-overs.
12 Resultswith10percentspill-oversarereportedinseparateannextables.
5. Results

Reducing Transatlantic Barriers to Trade and Investment – An Economic Assessment
34
Thefirstconclusiontotakefromtheresultsofthepartialagreementsisthatliberalising
eachpolicypillarsseparatelyleadstorelativelysmall increasesinGDPforboththe
USandtheEU(seeTable6andTable7below).FortheEU,thetariffscutsleadtoa
GDP increaseof0.10percent (23,753millioneuros),while the reductionofNTBs
inservicesandinprocurementincreaseGDPbyonly0.02percent(5,298and6,367
millioneuros).FortheUS,thesechangesareevensmaller(rangingfrom0.01to0.04
percent).
Table 6 ChangesinGDP(inpercent),2027benchmark,limitedagreement,20per
centdirectspill-overs
TariffsOnly ServicesOnly ProcurementOnlyEuropeanUnion 0.10 0.02 0.02UnitedStates 0.04 0.03 0.01Other -0.01 0.00 0.00OtherOECD,highincome
-0.03 0.00 0.00
EastEurope -0.04 0.00 0.00Mediterranean -0.04 0.00 0.00China 0.01 -0.01 -0.01India -0.01 0.00 0.00ASEAN -0.02 0.01 -0.01MERCOSUR -0.01 0.00 0.00LowIncome -0.02 0.00 0.00RestofWorld -0.02 0.00 0.00
Source: CGEcalculations.

Results
35
Table 7 ChangesinGDP(inmillioneuros),2027benchmark,limitedagreement,
20percentdirectspill-overs
TariffsOnly ServicesOnly ProcurementOnlyEuropeanUnion 23,753 5,298 6,367UnitedStates 9,447 7,356 1,875Other -7,903 -117 -1,595OtherOECD,highincome
-5,065 726 -668
EastEurope -292 26 4Mediterranean -580 60 -8China 2,289 -1,713 -856India -489 137 79ASEAN -832 337 -263MERCOSUR -363 182 -5LowIncome -228 39 47RestofWorld -2,344 90 75
Source: CGEcalculations.
Therelativesizeoftheservicesimpactislinkedbothtothemagnitudeofunderlying
bilateralbarriersthatarereduced(seeTable2)andalsototherelativetradevolumes
(seeFigure2).NTBsareperceivedbybusinessesasroughly2.5timeshigheringoods
thanservices,asappliedintheexperiments.ThiscapturesthefactthatboththeEUand
USarerelativelyopen,byglobalstandards,intheservicesectors.Atthesametime,
goodstradeistwicethevalueofservicestrade.Thustherelativemagnitudesforgoods
andservicesNTBsareconsistentwiththebenchmarklevelsofprotectionandtrade.
Next,welookattheexpectedchangesintradefortheEUandtheUS.Theresultsare
presentedforeachmeasureseparatelyinTable8andTable9below.

Reducing Transatlantic Barriers to Trade and Investment – An Economic Assessment
36
Table 8 Changesintrade(inpercent),extra-EUtradefortheEU,2027benchmark,
limitedagreement,20percentdirectspill-overs
TariffsOnly ServicesOnly ProcurementOnlyExportsEuropeanUnion 1.18 0.16 0.19UnitedStates 1.91 0.19 0.23
ImportsEuropeanUnion 1.00 0.13 0.18UnitedStates 1.13 0.57 0.14
Terms of tradeEuropeanUnion -0.01 0.00 0.00UnitedStates 0.04 -0.01 -0.02
Source:CGEcalculations.
Table 9 Changesintrade(inmillioneuros),extra-EUtradeincaseoftheEU,2027
benchmark,limitedagreement,20percentdirectspill-overs
TariffsOnly ServicesOnly ProcurementOnlyExportsEuropeanUnion 43,740 5,777 7,136UnitedStates 57,330 5,488 5,942
ImportsEuropeanUnion 44,338 5,742 7,881UnitedStates 47,775 4,655 5,869
Source:CGEcalculations.
Amongthepartialagreementoptions, the tariffcutsareshowntodeliver thelargest
increase in trade flows. Here, both exports and imports are shown to increase by
between 1 and 2 per cent. Extra-EU exports are estimated to increase by 1.18 per
cent(correspondingto44billioneuros)whileimportsfromoutsideEUareexpected
toriseby1.00percent(correspondingalso toabout44billioneuros increase).The
changesareestimatedtobeslightlyhigherfortheUS.Liberalisingprocurementand
serviceswill leadtorelativelysmall, less than0.5percent(about6-7billioneuros)
increases inexportsand imports.Theresultingchanges in termsof tradeareshown
tobe insignificant.While theprocurementandservicesoptions leadtosimilarGDP
effects, the trade effects are larger overall for procurement.This traces back to the

Results
37
underlying trade elasticities.Goods are estimated to bemoreprice sensitive overall
(seethediscussioninChapter4)andthistranslatesintosomewhatlargertradevolume
effects.However,bothsetsoftradevolumeeffectsaremuchsmallerthantheestimates
discussedbelowlinkedtoamorecomprehensiveagreement.
ThetablesbelowshowtheimpactofthelimitedFTAonbilateralsectoraltradebetween
theEUandtheUS.Limitingtheliberalisationtoservicesorprocurementonlywould
haveaverymarginalimpactonsectoraltrade,withtheexceptionofsomeoftheservices
exportsand imports increasingasbarriers removedunder theservices liberalisation.
Nevertheless,onaverage,bothbilateralexportsandimportswouldincreasebyabout
1per centor less if only servicesorprocurement is liberalised.On theotherhand,
thecutsintariffswouldleadto6.6percentincreaseofEUexportstotheUSandto
a12.4percentincreaseinimports.Thedifferenceinthemagnitudeofchangeisdue
totheinitialtariffstructuresbetweenthetwoeconomies,withtheEUhavinghigher
barrierstowardstheUS.Thusthedifferenceintheseaveragechangesismainlydriven
bymotorvehicles.Inthissectortheimportswouldsignificantlyincreaseastariffsare
removedforUSexporters.Inabsoluteterms,thegreatestincreaseinbilateralservices
exportsunderservices-onlyliberalizationisinfinance,insurance,andbusinessservices
inthecaseoftheEU,andinfinanceandbusinessservicesinthecaseoftheUS.With
procurement only,we see bilateral trade growth primarily in goods (chemicals and
vehiclesexportsfortheEU,chemicalsandmetalsandfabricatedmetalproductsforthe
US).Thebilateraltradeeffectsoftariffsoutweighboththeprocurementandservices
only scenarios.There is substantial growth in bilateral trade in chemicals, vehicles,
machinery, and othermanufactures.Total trade (EU exports to theUS,US exports
totheEU)expandsbyalmost100billioneurosinthetariffonlyscenario.Thesector
patternreflectsthebasicpatternoftariffsinthetariffs-onlyscenario,asdiscussedin
Chapter2,alongwiththeunderlyingelasticitiesasdiscussedinChapter3.Forexample,
USmanufacturing tariffs are relatively low, and highest on othermanufactures and
processedfoods(Figure9).

Reducing Transatlantic Barriers to Trade and Investment – An Economic Assessment
38
Table 10 Changes in EU bilateral exports to US by sector (in per cent), 2027
benchmark,limitedagreement,20percentdirectspill-overs
TariffsOnly ServicesOnly ProcurementOnly
PercentMillioneuros
PercentMillioneuros
PercentMillioneuros
Agrforestryfisheries
17.53 2,024 0.00 0 -0.15 -17
Otherprimarysectors
0.37 33 0.05 4 0.00 0
Processedfoods 8.15 2,402 0.00 0 1.50 442Chemicals 5.46 4,509 -0.09 -77 2.59 2,140Electricalmachinery
3.08 225 -0.19 -14 -0.22 -16
Motorvehicles 13.70 8,048 -0.05 -29 5.69 3,345Othertransportequipment
1.84 653 -0.01 -4 1.50 531
Othermachinery 8.60 9,705 -0.11 -123 -0.11 -126Metalsandmetalproducts
20.40 3,744 0.01 2 4.13 757
Woodandpaperproducts
2.23 359 -0.02 -4 -0.19 -30
Othermanufactures
23.35 11,402 -0.02 -12 -0.05 -27
Watertransport 0.32 1 3.35 12 0.26 1Airtransport 0.24 50 0.79 164 0.03 7Finance 0.22 93 4.32 1,787 -0.03 -13Insurance 0.27 107 4.35 1,746 -0.06 -24Businessservices 0.43 288 1.23 825 0.13 87Communications 0.20 11 0.73 41 0.07 4Construction 0.45 10 1.73 40 0.48 11Personalservices 0.46 46 2.49 247 -0.26 -25Otherservices 0.27 130 -0.03 -13 -0.10 -50total 6.57 43,840 0.69 4,591 1.05 6,997
Source:CGEcalculations.

Results
39
Table 11 ChangesinUSbilateralexportstoEUbysector,2027benchmark,limited
agreement,20percentdirectspill-overs
TariffsOnly ServicesOnly ProcurementOnly
PercentMillioneuros
PercentMillioneuros
PercentMillioneuros
Agrforestryfisheries
19.33 978 0.03 1 0.15 8
Otherprimarysectors
0.50 51 -0.04 -4 0.00 0
Processedfoods 39.82 2,173 0.03 2 0.11 6Chemicals 12.45 9,927 0.16 129 0.54 430Electricalmachinery
3.39 639 0.91 171 1.07 201
Motorvehicles 109.50 20,808 0.11 20 0.67 127Othertransportequipment
7.61 2,823 0.05 18 0.32 118
Othermachinery 12.10 5,659 0.16 75 0.28 129Metalsandmetalproducts
23.43 4,995 0.03 6 9.29 1,980
Woodandpaperproducts
3.74 257 0.07 5 0.73 50
Othermanufactures
15.80 5,836 0.04 16 0.06 22
Watertransport -0.25 -1 2.90 17 0.11 1Airtransport -0.17 -29 0.74 125 0.08 14Finance -0.14 -35 2.16 546 0.66 166Insurance -0.24 -9 3.25 116 0.09 3Businessservices -0.36 -130 2.41 862 0.09 32Communications -0.18 -12 4.60 300 0.11 7Construction -0.31 -7 2.76 65 1.14 27Personalservices -0.42 -29 5.07 355 0.30 21Otherservices -0.23 -116 0.07 35 0.14 69total 12.36 53,777 0.66 2,859 0.78 3,411
Source:CGEcalculations.
Table12belowshowsthecorrespondingestimatedchangesintheEU’stotalexternal
trade (extra-EU). Overall, the tariff cuts are expected to cause total imports and
exports to increaseby1.18and1.00percentrespectively.Theinducedeffectsfrom
liberalisingtradeinservicesandprocurementaresmaller,rangingfrom0.13to0.19
per cent respectively.Nevertheless, exports in the insurance and finance sectors are
estimatedtoincreasebyabout2percentifservicesareliberalised.Meanwhile,finance,

Reducing Transatlantic Barriers to Trade and Investment – An Economic Assessment
40
communications,andpersonalservicesimportsareestimatedtoincreaseby1-1.8per
cent due to services liberalisation. Under tariff liberalisation, the highest increase
in importswould takeplace inmotorvehicleswitha9.21percent,while regarding
exportsthemostpronouncedincreaseisestimatedtotakeplaceinothermanufactures
witha5.50percentincrease.
Table 12 Changes in EU trade by sector (in per cent), 2027 benchmark, limited
agreement,20percentdirectspill-overs
Totalexports Totalimports
Tariffsonly ServicesonlyProcurement
onlyTariffsonly Servicesonly
Procurementonly
Percent
Mlneuros
Percent
Mlneuros
Percent
Mlneuros
Percent
Mlneuros
Percent
Mlneuros
Percent
Mlneuros
Agrforestryfisheries
0.58 1,303 0.00 3 -0.05 -102 2.64 1,342 0.10 52 0.17 85
Otherprimarysectors
-0.27 -363 0.03 35 0.01 11 0.52 3,643 0.01 98 0.01 47
Processedfoods 1.33 2,360 0.03 45 0.27 481 2.66 2,282 0.07 64 0.12 100
Chemicals 1.23 4,707 -0.01 -47 0.65 2,478 2.46 7,972 0.08 268 0.13 419
Electricalmachinery
-0.03 -26 -0.02 -15 -0.31 -292 0.39 1,357 0.01 23 0.01 24
Motorvehicles 3.70 8,399 -0.02 -43 1.47 3,340 9.21 16,799 0.11 193 0.22 404
Othertransportequipment
0.56 914 -0.02 -38 0.27 442 2.54 2,345 0.06 55 0.16 151
Othermachinery 1.73 10,359 -0.08 -487 -0.10 -611 0.82 3,969 0.14 685 0.03 126
Metalsandmetalproducts
2.70 3,720 -0.01 -18 1.15 1,589 1.18 4,156 0.06 214 1.45 5,111
Woodandpaperproducts
0.16 222 -0.01 -17 -0.05 -72 0.67 438 0.11 74 0.29 189
Othermanufactures
5.50 11,957 0.02 34 -0.02 -36 -0.03 -250 0.05 523 0.04 412
Watertransport 0.10 47 0.22 100 0.03 14 -0.02 -8 0.31 118 0.05 21
Airtransport 0.14 110 0.21 162 0.01 9 -0.09 -84 0.21 203 0.05 51
Finance 0.09 87 2.00 1,864 0.00 2 0.09 63 1.02 695 0.32 221
Insurance 0.09 86 2.03 1,849 -0.03 -27 0.12 20 0.94 160 0.07 12
Businessservices 0.04 183 0.36 1,500 0.02 77 -0.08 -144 0.62 1,127 0.06 103
Communications 0.00 0 0.47 127 0.02 6 0.09 35 1.15 420 0.08 29
Construction -0.02 -13 0.27 176 0.00 -1 0.09 20 0.47 110 0.22 52
Personalservices -0.13 -138 0.50 552 -0.11 -117 0.15 41 1.84 487 0.21 55
Otherservices -0.06 -173 0.00 -4 -0.02 -53 0.12 341 0.06 173 0.10 267
Total 1.18 43,740 0.16 5,777 0.19 7,136 1.00 44,338 0.13 5,742 0.18 7,881
Source:CGEcalculations.

Results
41
ThereductionoftariffswillleadUSimportsandexportstoincreaseby1.91and1.13
percentrespectively(Table13).Thebiggestincreasesareestimatedtotakeplacein
theexportofmotorvehicles (15.43percent),chemicals (4.05percent),metalsand
metalproducts(4.33percent).AscanbeseenfromtheTable,theestimatedeffectsof
theliberalisationofservicesandprocurementontradearemuchsmaller.Thebiggest
changes in imports are also attributable to the reduction of tariffs,with the highest
sectorspecificincreasesexpectedtotakeplaceinprocessedfoodsandmetalsandmetal
productions(2.37percentand2.43percentrespectively)andmotorvehicles(2.13per
cent).Theliberalisationoftheservicessectorsishoweverestimatedtoincreaseimports
offinanceandinsuranceservicesbyaround3percent.

Reducing Transatlantic Barriers to Trade and Investment – An Economic Assessment
42
Table 13 Changes inUS trade by sector (in per cent), 2027 benchmark, limited
agreement,20percentdirectspill-overs
Totalexports Totalimports
TariffsOnly ServicesOnlyProcurement
OnlyTariffsOnly ServicesOnly
ProcurementOnly
Percent
Mlneuros
Percent
Mlneuros
Percent
Mlneuros
Percent
Mlneuros
Percent
Mlneuros
Percent
Mlneuros
Agrforestryfisheries
0.29 1,386 0.00 -16 0.03 140 1.74 1,814 0.03 35 -0.08 -82
Otherprimarysectors
-0.09 -166 0.00 8 0.01 18 0.14 696 0.05 265 0.00 -2
Processedfoods 2.39 2,556 0.02 16 0.03 31 2.37 2,490 0.01 14 0.58 608
Chemicals 4.05 13,363 0.11 375 0.11 362 1.06 2,857 -0.06 -167 1.00 2,678
Electricalmachinery
-1.10 -1,534 0.76 1,061 0.59 826 0.94 3,994 -0.26 -1,106 -0.35 -1,467
Motorvehicles 15.43 23,826 0.05 80 0.31 477 2.13 8,879 0.01 25 0.91 3,773
Othertransportequipment
1.55 2,688 0.02 34 0.18 305 1.08 929 0.02 18 0.55 473
Othermachinery 1.77 4,854 0.08 220 0.17 466 1.46 10,363 0.01 72 -0.14 -1,012
Metalsandmetalproducts
4.33 5,171 0.01 10 2.14 2,553 2.43 4,716 0.08 165 0.69 1,339
Woodandpaperproducts
0.00 0 0.02 14 0.13 96 0.82 1,088 0.03 40 -0.11 -143
Othermanufactures
3.40 6,989 0.03 69 0.04 84 1.06 8,190 0.03 213 -0.03 -237
Watertransport 0.07 3 0.09 4 0.03 1 0.22 6 0.63 18 0.04 1
Airtransport 0.04 19 0.18 96 0.04 19 0.12 66 0.34 182 0.01 7
Finance -0.10 -78 0.98 736 0.27 203 0.26 156 3.14 1,903 -0.02 -13
Insurance -0.26 -85 0.68 222 0.03 9 0.31 191 2.81 1,716 -0.04 -26
Businessservices -0.29 -398 0.90 1,240 0.04 55 0.39 609 0.55 861 0.05 79
Communications -0.18 -36 2.07 411 0.05 11 0.24 36 0.32 48 0.02 3
Construction -0.33 -42 0.82 105 0.27 35 0.45 26 0.80 47 0.23 13
Personalservices -0.57 -429 0.95 712 0.13 98 0.60 124 1.43 298 -0.18 -38
Otherservices -0.28 -758 0.03 90 0.06 152 0.35 544 0.01 9 -0.06 -88
Total 1.91 57,330 0.19 5,488 0.23 5,943 1.13 47,775 0.57 4,655 0.14 5,868
Source:CGEcalculations.
Wenowturntoanalysingtheestimatedeffectsontheoutputofthedifferentsectors.
TheunderlyingchangesfortheEUandtheUSarepresentedinTable14andTable15
below.

Results
43
Table 14 Changes inEUoutputbysector(inpercent),2027benchmark, limited
agreement,20percentdirectspill-overs
Baselinesharesinvalueadded
TariffsOnly ServicesOnly ProcurementOnly
Agrforestryfisheries
0.040 0.03 0.00 0.00
Otherprimarysectors
0.019 0.00 0.00 0.00
Processedfoods 0.030 0.06 0.01 0.04Chemicals 0.028 -0.11 -0.01 0.12Electricalmachinery
0.004 -0.31 0.02 0.06
Motorvehicles 0.015 -0.65 -0.01 0.30Othertransportequipment
0.007 -0.26 -0.02 0.09
Othermachinery 0.037 0.35 -0.04 0.03Metalsandmetalproducts
0.021 0.03 -0.03 -0.39
Woodandpaperproducts
0.023 0.06 0.00 -0.01
Othermanufactures
0.029 0.60 -0.01 0.01
Watertransport 0.003 0.14 -0.04 0.03Airtransport 0.003 0.15 -0.01 0.01Finance 0.032 0.06 0.11 -0.02Insurance 0.010 0.06 0.32 0.01Businessservices 0.222 0.05 0.01 0.02Communications 0.023 0.05 -0.03 0.01Construction 0.083 0.12 0.03 0.02Personalservices 0.035 0.04 0.02 0.00Otherservices 0.338 0.05 0.01 0.01
Source:CGEcalculations.
AscanbeseenintheTable14,thecorrespondingestimatedchangesinsectorspecific
outputareverysmall.Noneofthesectorswillexpandorcontractbymorethan1per
centinthecaseoftheEU,andinmostsectorsoutputwillbasicallyremainunchanged.
Similarly,onlyslightchangesareexpectedtotakeplaceinUSsector-leveloutputasa
consequenceofthenon-comprehensiveFTAsthatweresimulated.Inonlytwosectors
theoutputisestimatedtochangebymorethan1percent:intheelectricalmachinery

Reducing Transatlantic Barriers to Trade and Investment – An Economic Assessment
44
sectoritisestimatedtodecreaseby1.40percent,whileinmotorvehiclesitisexpected
toincreaseby1.76percent(oncetariffsarecut).
Table 15 Changes inUSoutputbysector (inpercent),2027benchmark, limited
agreement,20percentdirectspill-overs
Baselinesharesin
valueaddedTariffsOnly ServicesOnly
ProcurementOnly
Agrforestryfisheries 0.031 -0.02 0.00 0.00Otherprimarysectors 0.023 -0.01 0.00 0.00Processedfoods 0.017 0.06 0.02 -0.06Chemicals 0.021 0.81 0.07 -0.27Electricalmachinery 0.003 -1.40 0.64 0.73Motorvehicles 0.010 1.76 0.05 -0.56Othertransportequipment
0.009 0.38 0.03 -0.07
Othermachinery 0.027 -0.38 0.07 0.13Metalsandmetalproducts
0.014 0.15 0.05 0.07
Woodandpaperproducts
0.023 -0.05 0.03 0.02
Othermanufactures 0.010 0.05 0.02 0.00Watertransport 0.002 0.04 0.03 0.02Airtransport 0.004 0.00 0.00 0.02Finance 0.074 0.00 -0.11 0.01Insurance 0.020 -0.04 -0.27 0.01Businessservices 0.099 -0.01 0.01 0.00Communications 0.019 0.00 0.06 0.01Construction 0.080 0.09 0.04 0.01Personalservices 0.036 -0.01 0.04 0.02Otherservices 0.480 -0.02 0.00 0.00
Source:CGEcalculations.
Whilethenon-comprehensiveFTAoption,whichwouldbelimitedtoeithertariff,or
servicestrade,orprocurementliberalization,wouldresultinpositivechangesinsector-
leveloutputandtradepatterns,thesebenefitswouldberelativelysmall.Atanaggregate
level,thechangeswouldbeevensmaller.Whencomparingtheimpactofthesenon-
comprehensiveFTAswithacomprehensiveFTAthatwillbediscussedinthefollowing
section,itisclearthattheoverallbenefitswouldbeofmuchlargermagnitudeinthe
caseofatradeagreementthatcoversmorepolicypillarssimultaneously.

Results
45
5.2. Full FTA
5.2.1. Macro Results
Here,weturntothediscussionofeffectsonmacroeconomicvariables,resultingfrom
a reductionofbarriers to tradeand investmentbetween theEUand theUSundera
comprehensiveFTA(seeTable4fordetails).Insodoing,wepresenttheresultswith
regards to GDP.13As indicated above two FTA scenarios are considered: one less
ambitiousandonemoreambitious(asdescribedinTable4).
Table16andTable17belowshowtheestimatedeffectonGDPbothfortheambitious
andlessambitiousscenariosfortheEUandtheUS.Theresultsarepresentedforthe
totalimpactandalsodecomposedintothedifferentsubcomponentsthatcorrespondto
theseveralpolicypillars,namelytariffs,totalNTBsongoods,totalNTBsonservices,
directandindirectspill-overs,andprocurement.Procurementrelatedbarriersareinfact
capturedbytheNTBsingoodsandinservices.Aprocurementcolumnisintroduced
inthetablebelowinordertohighlighttheimportanceofthistypeofbarriersinthe
negotiations.However,itisimportanttonotethattheimpactofreducingprocurement
barriersshouldnotbeaddedtotheeffectsfromotherpillarsasitwouldmeandouble-
counting.
AscanbeseenTable16,theestimatedimpactonGDPfortheEUandUSrangebetween
0.2 and 0.5 per cent, for the less ambitious and ambitious scenarios respectively.
BecausewearedealingwithNTBsratherthantariffs,changesintradevolumesalone
arenotnecessarilyindicativeofthenetimpactonGDP,andsothereaderiscautioned
whencomparingTable16toTable20(changesinexports)below.Thisisbecause,as
13 Theannextablesalsoreportchangesinrealnationalincome.GDPisreportedherebecauseitisaconceptthatwillbemorefamiliartothereader.GDPisthevalueofafixedbasketoffinalgoodsandservicesproducedbytheeconomy.Realnationalincome,ontheotherhand,isameasureoftheactualpurchasingpoweravailableforfinalconsumption,givenchangesinbothoutputandprices. Realnational incomebettercapturesshifts in theeconomytowardamoreefficientbasketofgoodsandservices,aswellaschanges in finalconsumptionprices. Usually these twomeasurestrackeachotherclosely.However,whenthecurrentpatternofGDPreflectsstrongunderlyingdistortions,realnationalincomeisabettermeasureofthebenefitstotheagentsintheeconomy.

Reducing Transatlantic Barriers to Trade and Investment – An Economic Assessment
46
discussedearlierinthereport(seeChapters2and3),NTBsinvolvehighercostsand
solowerproductivity.TheimpactonGDPwillthereforehinge,inpart,oncostsavings
linkedtoremovingNTBs.Basically,withNTBsthatraisecoststheopportunitycosts
ofnewexportsresultingfromNTBreductionarelowerthanwithtariffs,sothatthecost
sideofthecost-benefitanalysisofincreasedtradeislower.TheimpactonGDPwill
alsohingeonthevalueaddedcompositionofexports.Assuch,eveniftradevolume
effects arenot relatively large in aparticular sector (recall ourdiscussionofFigure
10), theymaystillyield relatively largegainsoverall.The indirectspill-overeffects
aremorecomplexstill(thoughsmallinabsoluteterms).Therewillbebothincreased
incomeandtradeinthirdcountries(fromtheothersetsofresultsdiscussedhere),along
with improvedaccessconditions to thirdmarkets. However, there isalso scope for
somediversionoftradeawayfromtheUSandEUandtowardintra-thirdcountrytrade.
Thetotalimpactdependsonallthesethings,andthedirectionisunknownapriori.
Table 16 ChangesinGDP(inpercent),2027benchmark,20percentdirectspill-
overs
A=B+C+D+E+F
B C D E F G
Total
Stemmingfromtheliberalisationof
tariffstotalNTBsgoods
totalNTBsservices
directspill-overs
indirectspill-overs
procurement
Less ambitious experiment EuropeanUnion 0.27 0.10 0.12 0.01 0.03 0.01 0.02UnitedStates 0.21 0.04 0.11 0.03 0.03 0.00 0.01Ambitious experimentEuropeanUnion 0.48 0.11 0.26 0.03 0.07 0.02 0.05UnitedStates 0.39 0.04 0.23 0.06 0.06 0.00 0.03
Source:CGEcalculations.

Results
47
Analternativemeasure of aggregate results is provided inTable 18below,where a
comparisonisprovidedacrossscenariosofhouseholdincomeeffectsfortheEUand
US.14Startingwiththelimitedscenarios,atariffonlyscenarioyields€12.9billionin
disposable incomegainsacrossEuropeanhouseholds,and€5.1billionindisposable
income gains for US households. The services and procurement agreements yield
substantiallylessforEuropeanhouseholds,whiletheservicesonlyagreementyieldsthe
mostforUShouseholdsunderthelimitedscenarios.Theseeffectsarefaroutweighed
underboththelessambitiousandmoreambitiouscomprehensivescenarios.Herewe
have estimated gains to disposable income acrossEuropean households of between
€39.8billionand€70.82billion.IntheUS,householddisposableincomeincreaseby
between€29.9and€58.4billion.Forafamilyof4thecomprehensivescenariosyield
disposableincomegainsbetween€306and€545annuallyintheEUandbetween€336
and€655intheUS.
Table 17 ChangesinGDP(inmillioneuros),2027benchmark,20percentdirect
spill-overs
A=B+C+D+E+F
B C D E F G
Total
Stemmingfromtheliberalisationof
tariffstotalNTBsgoods
totalNTBsservices
directspill-overs
indirectspill-overs
procurement
Less ambitious experiment EuropeanUnion 68,274 25,394 29,250 3,482 7,984 2,164 6,069UnitedStates 49,543 9,784 25,505 6,899 7,404 -72 3,341Ambitious experiment EuropeanUnion 119,212 27,409 64,344 7,014 16,291 4,154 12,312UnitedStates 94,904 10,120 56,202 14,014 14,760 -216 6,707
Source:CGEcalculations.
14 Householddisposableincomeisasubsetoftotalincome(itislessthantotalnationalincome).Itrepresentstheincomeavailabletospendonfinalconsumption(food,clothing,transport,housing),afterallocationstothegovernmentandforsavings.Changesinthisvariablethereforemeasurethechangesinprivateconsumptionvaluedatcurrentprices.”

Reducing Transatlantic Barriers to Trade and Investment – An Economic Assessment
48
Table 18 Householddisposableincome,millioneuro,2027benchmark
limited
agreement:tariffsonly
limitedagreement:servicesonly
limitedagreement:procurement
only
comprehensiveagreement:low
ambition
comprehensiveagreement:
highambition
totalEU,mill.euro 12,934 3,089 4,295 39,813 70,820US,mill.euro 5,081 4,122 2,246 29,982 58,434EU,percent 0.09 0.02 0.02 0.28 0.49US,percent 0.03 0.02 0.01 0.18 0.35EU,€perhousehold
99 41 49 306 545
US,€perhousehold
57 82 21 336 655
Source:CGEcalculations.Perhouseholdestimatesareforafamilyof4.
Theexactamountoverall,asreportedinTable16,dependsonthecombinationofvalue
added,barrier levels, andunderlyingelasticities. It alsohingeson linkagesbetween
sectors, and final demand responses to price changes. Indeed this is the reason for
workingwithaCGEframework–wearethenbetterabletocapturethecombinationof
theseeffectsacrosssectors.InthecaseoftheEU,ifwereferbacktoTable2,combined
withtheunderlyingbilateraltradebalancebysector(Figure1),theEUhasastrong,
positivebalanceingoodssectorswithrelativelyhighNTBlevels.Thismeansthaton
averageEuropeanfirmsfaceahighercostburdenlinkedtotransatlanticNTBsthando
USfirms,sothatthereductioninthecostburdenlinkedtoNTBswillbesomewhat
disproportionateaswell,benefitingEuropeanfirmsmoreonaverage.Assuch,wecan
expectsomewhatgreaterbenefitsfromimprovedmarketaccessfortheEUthanforthe
US.ThisisreflectedintheresultinTable16andTable17.Indeed,wherewehavea
similarchangeintradevolumes,thispositivebalancemeanstheEUwillbenefitmore
intermsofGDP.ThisisreflectedintherelativemagnitudesoftradeandGDPeffects
inTable16(above)andTable20(below).
For the US, around three quarters of the estimated increase in GDP, across both
scenarios, stemfrom the loweringofNTBs.For theEU,NTBs ingoodsare shown
tobeaccountableforaroundhalfof the increase,while lowering tariffs isshownto
belessimportant.Again,thisisconsistentwiththepatternoftrade,NTBsandtariffs

Results
49
asdiscussed inChapter2.Whenviewing these tables, it is alsouseful to recall the
observationmade in Chapter 4 about the relatively low level of perceived bilateral
barriers in services, combinedwith a 65 per cent share of goods in bilateral trade.
Together,thehigherbarriersandtradeshareforgoodsimplythatmostgainswillfollow
fromNTBsandtariffsongoods.Similarly,theoriginalEcorys(2009)studycovered
limitedaspectsofprocurement,andthebarriersidentifiedwererelativelyminorasa
shareoftotalprotection.Assuch,itisnotsurprisingthattheprocurementestimatesare
relativelysmallasashareofthetotal.
Insummary,theseresultshighlightthatthepotentialmainimpactfromliberalization
stemsmorefromNTBliberalization(especiallyincludingspill-overs)ratherthanjust
reducingtariffbarriers.
5.2.2. Output and Trade
Next,wetakeacloserlookatthecorrespondingchangestotradeandoutputforthe
EUandtheUS.First,welookattheoveralleffectsonimportsandexportsandthenwe
moveontostudyingtheeffectsonamoredisaggregate,sectorspecificlevel.
5.2.2.1. Aggregate Effects
AscanbeseenfromTable19below,liberalisingtradewouldimplysomesignificant
increasesinEU-UStrade.Inthelessambitiousscenario,EUexports to theUSwill
increaseby16percentwhileUSexports to theEU increaseby23percent. In the
ambitiousscenario,thecorrespondingfiguresare28and37percent.Abouttwothirds
oftheincreaseinbilateraltradeintheambitiousexperimentisattributabletoreducing
NTBsingoodssectors.Changesintariffsarealsoimportant,thoughasdiscussedabove
agivenchangeintradetranslatesintogreaterGDPeffectswithNTBs.

Reducing Transatlantic Barriers to Trade and Investment – An Economic Assessment
50
Table 19 Changesinbilateralexportstothepartnercountry(inpercentandmillion
euros),2027benchmark,20percentdirectspill-overs
A=B+C+D+E+F
B C D E F G
Total
Stemmingfromtheliberalisationof
tariffstotalNTBsgoods
totalNTBsservices
directspill-overs
indirectspill-overs
procurement
InpercentLess ambitious experiment EuropeanUnion 16.16 7.06 9.34 0.69 -0.76 -0.15 1.04UnitedStates 23.20 13.67 8.80 0.67 0.01 0.02 0.78Ambitious experiment EuropeanUnion 28.03 7.67 21.00 1.40 -1.73 -0.34 2.13UnitedStates 36.57 15.34 19.93 1.37 -0.08 0.03 1.62
InmillioneurosLess ambitious experiment EuropeanUnion 107,811 47,083 62,289 4,598 -5,089 -989 6,957UnitedStates 100,909 59,476 38,284 2,934 57 77 3,410Ambitious experiment EuropeanUnion 186,965 51,185 140,106 9,332 -11,525 -2,243 14,211UnitedStates 159,098 66,720 86,698 5,966 -335 151 7,043
Source:CGEcalculations.
Table20andTable21provideestimatesfortotal(asopposedtobilateral)trade.For
theEU,totalexportsareexpectedtoincreaseby3.37to5.91percentundertheless
ambitiousandambitiousscenariosrespectively.Similartotheresultspresentedinthe
previoussection, the loweringofNTBs ingoods isshowntobe themost important
factorinincreasingexports,followedbytheloweringoftariffsonexportstotheUS.

Results
51
Table 20 Changesinvalueoftotalexports(inpercentandmillioneuros),extra-EU
exportsincaseoftheEU,2027benchmark,20percentdirectspill-overs
A=B+C+D+E+F
B C D E F G
Total
Stemmingfromtheliberalisationof
tariffstotalNTBsgoods
totalNTBsservices
directspill-overs
indirectspill-overs
procurement
InpercentLess ambitious experiment EuropeanUnion 3.37 1.28 1.43 0.11 0.25 0.28 0.19UnitedStates 4.75 2.11 1.69 0.16 0.52 0.27 0.23Ambitious experiment EuropeanUnion 5.91 1.41 3.23 0.23 0.48 0.56 0.42UnitedStates 8.02 2.34 3.79 0.33 1.01 0.54 0.48
InmillioneurosLess ambitious experiment EuropeanUnion 125,232 47,577 53,341 4,211 9,442 10,564 7,163UnitedStates 142,071 63,219 50,600 4,717 15,505 8,031 5,943Ambitious experiment EuropeanUnion 219,970 52,327 120,313 8,523 18,010 20,959 15,620UnitedStates 239,543 70,265 113,630 9,624 30,042 15,982 14,202
Source:CGEcalculations.
FortheUS,thecorrespondingeffectonexportsislarger.Theyareestimatedtoincrease
by4.75and8.02percent respectively for the two liberalizingscenarios. In the less
ambitiousscenario,theloweringoftariffsisaccountableforaroundhalfofthatincrease.
Inthecaseofthemoreambitiousscenariothemostimportantcontributioncomesfrom
theloweringofNTBsingoods.Meanwhile,theloweringoftariffsisstillshowntobe
animportantfactorinrealizingtheseincreasesintrade.It is important torecall that
theEUhashightariffsonmotorvehiclesandprocessedfoods.Thisdrivespartofthe
largerexportgainfortheUSinthetablesabove.Theestimatedeffectsalsotellusthat
spill-overeffectsaremoreimportantfortheUSthantheyarefortheEU.(Seecolumns
E inboth tables). Thisdifference isdue inpart todifferences in the importanceof
tradewiththirdcountriesfortheUSandtheEU.Whenwelookatunderlyingbaseline
tradeflows,fortheUSthefirstmostimportantimportpartnerisChina.TheEUcomes
secondasasourceofimports.Furthermore,NAFTAcountriesarealsoveryimportant

Reducing Transatlantic Barriers to Trade and Investment – An Economic Assessment
52
tradingpartners for theUSoverall. IncolumnE inboth tables,givendifferences in
tradecompositiontheNTB-relateddirectspilloversyieldfallingcostsfromspill-overs
foralargershareofimportsinthecaseoftheUScomparedtotheEU.Thisiswhy
weseeahigherimpactduetothesespill-oversfortheUS.FortheEU,theestimated
changesintotalimportsaresimilartotheestimatedchangesinexports.Theincrease
isexpectedtobeintherangeof2.91and5.11percent,withNTBsingoodsbeingthe
mostimportantliberalizingmeasure.OnelastpointonthepatternofresultsinTable20
andTable21relatestoexportexpansionlinkedtodirectspillovers.Itisacommon(and
evenexpectedresult)insuchmodellingexercisesthatincreasedimports(incolumnE,
forexample,forreductionin tradecostsfor thirdcountriesexportingto theUSand
EU)therewillalsobeincreasedexports.Withmoredirectcompetitionfromimports,
domesticfirmsfindforeignmarketsrelativelymoreattractive,suchthatexportsreflect
arelativeshifttowardoverseasmarkets.
Table 21 Changesinvalueoftotalimports(inpercentandmillioneuros),extra-EU
importsincaseoftheEU,2027benchmark,20percentdirectspill-overs
A=B+C+D+E+F
B C D E F G
Total
Stemmingfromtheliberalisationof
tariffstotalNTBsgoods
totalNTBsservices
directspill-overs
indirectspill-overs
procurement
InpercentLess ambitious experiment EuropeanUnion 2.91 1.09 1.22 0.10 0.23 0.27 0.18UnitedStates 2.81 1.25 1.00 0.09 0.31 0.16 0.14Ambitious experiment EuropeanUnion 5.11 1.20 2.75 0.20 0.44 0.52 0.36UnitedStates 4.74 1.39 2.24 0.19 0.60 0.32 0.28
InmillioneurosLess ambitious experiment EuropeanUnion 128,424 48,239 53,892 4,259 10,207 11,827 7,907UnitedStates 118,840 52,678 42,231 4,011 13,081 6,839 5,868Ambitious experiment EuropeanUnion 225,899 53,071 121,548 8,624 19,544 23,113 15,953UnitedStates 200,519 58,543 94,830 8,183 25,351 13,611 11,896
Source:CGEcalculations.

Results
53
For theUS, importswill increaseby2.81and4.74percentrespectively.In the less
ambitiousscenario,thetariffcutsareshowntobethemostimportantdrivingfactor.
Meanwhile,inthemoreambitiousscenario,loweringofNTBsingoodsprovidesthe
biggestcontributiontothechangesinimports.
Termsoftradeforacountryreflecthowmuchitsexportsareworthintermsofimports.
Thusanimprovement(orapositivechange)inacountry’stermsoftradewillimplythat
itcanaffordtobuymoreimportsforeveryunitofitsexportssold.Thecorresponding
changesintermsoftradearesummarizedinTable22below.
Table 22 Changesintermsoftrade(inpercent),2027benchmark,20percentdirect
spill-overs
A=B+C+D+E+F
B C D E F G
Total
Stemmingfromtheliberalisationof
tariffstotalNTBsgoods
totalNTBsservices
directspillovers
indirectspillovers
procurement
Less ambitious experiment EuropeanUnion 0.00 -0.01 0.04 0.00 -0.05 0.02 0.00UnitedStates -0.08 0.05 -0.04 -0.01 -0.11 0.03 -0.02Ambitious experiment EuropeanUnion 0.01 -0.02 0.09 0.00 -0.10 0.03 0.00UnitedStates -0.19 0.07 -0.08 -0.02 -0.21 0.05 -0.04
Source:CGEcalculations.
AscanbeseenfromTable22, the resultingchanges in termsof tradeare relatively
small.For theEU,termsof tradeareexpectedtoremainessentiallyunchanged.For
theUS,termsoftradeareshowntodecreasesomewhat.Inthelessambitiousscenarios
they are expected to decrease by 0.08 per cent. Under the ambitious scenario, the
Americantermsoftradeareexpectedtodecreaseby0.19percent.Asdiscussedabove
withrespecttoTable20,thisdecreaseislargelyattributabletodirectspill-overs,and
is linked to the underlying estimated trade volume effects.TheUS has a relatively
largerimportsharewiththirdcountries(especiallyChinaandCanada)ingoodssectors
affectedbyNTBreductionsthandoestheEU.Thisleadstoagreaterimpactwhenwe

Reducing Transatlantic Barriers to Trade and Investment – An Economic Assessment
54
examinedirectspill-overs.AsNTBsarereducedalsointradewiththesethirdcountries,
increasedUSdemanddrivestheslightdeteriorationintermsoftrade.
Lowering of tariffs naturally implies that tariff revenues in the EU will decrease
somewhat.AscanbeseenfromthefirstrowofTable23,the2027benchmarkvalueof
tariffscollectedis78.7billioneuros.Reducingtariffsalonewouldcausetheserevenues
todecreaseby7.3billioneuros,relativetobaselinesituationin2027.Ontheotherhand
undertheambitiousandlessambitiousscenarioswithfullliberalisation,tariffrevenues
woulddecreasesbyless–5.4billioneurosand6.4billioneuros,respectively.Thisis
duetoincreasedtradewiththirdcountriesfromfurtherliberalisation(withspill-over
effects,orinotherwordstheloweringofpartoftheNTBsonaMFNbasis)relativeto
tariffsonly,whichwouldresultinadditionaltariffrevenues.
Table 23 ChangeinEUtariffrevenue(inmillioneuros),2027benchmark
changeBenchmark 78,733 ambitious,20percentspill-overs
73,340 -5,393
lessambitious,20percentspill-overs
72,372 -6,361
tariffsonly 71,386 -7,347
Source:CGEcalculations.
Anotherpotential impactof theTransatlanticFTAis that the lowerbarriers to trade
withtheUSwillcauseashift inrelativecosts leadingtodivertingsometradeaway
fromintra-EUpartnerstowardsnewtradepartners(seeTable24).Inthetable,wehave
definedtradediversionasthechangeinintra-EUtradefollowingimplementationofan
FTA.Thischangewillamountto72.1billioneurosunderfullliberalization,ofwhich
26.0and23.6billioneurosarecausedbyspill-oversandNTBsingoodsrespectively.
Meanwhile,NTBsinservices,indirectspill-oversandprocurementhaveaminorrole
inredirectingtrade.Halfoftheestimatedtradediversioneffect(thechangeinintra-EU
tradeflows) isattributable to themotorvehiclessector.For thissector, the lowering
oftariffsisshowntobethemostimportantcontributingfactor,togetherwithNTBsin

Results
55
goodsanddirectspill-overs.Sometradediversionisalsovisibleinchemicals,electrical
machineryandmetalsandmetalproducts.
Table 24 Tradedivertedfromintra-EUtrade(inmillioneuros),2027benchmark,20
percentdirectspill-overs,ambitiousexperiment
A=B+C+D+E+F
B C D E F G
Total
Stemmingfromtheliberalisationof
tariffstotalNTBsgoods
totalNTBsservices
directspillovers
indirectspillovers
procurement
Agrforestryfisheries
269 -101 319 17 -50 84 50
Otherprimarysectors
345 234 -89 0 278 -78 11
Processedfoods -425 -164 425 65 -851 98 131Chemicals -13,208 -3,641 -2,356 -214 -7,282 286 214Electricalmachinery
-12,829 -376 -2,847 61 -9,073 -594 206
Motorvehicles -36,517 -13,423 -10,551 -59 -12,016 -469 996Othertransportequipment
-2,468 -583 -1,572 -8 -262 -42 25
Othermachinery 492 -431 -3,692 -308 6,583 -1,661 431Metalsandmetalproducts
-11,464 -1,196 -4,185 -176 -4,642 -1,266 -4,114
Woodandpaperproducts
-799 183 -365 23 -685 46 0
Othermanufactures
2,087 1,131 -261 -43 2,174 -913 174
Watertransport -35 41 26 -19 -118 35 10Airtransport 76 97 35 -62 14 -7 14Finance 129 60 103 0 -51 17 -51Insurance 84 18 36 20 5 5 8Businessservices 1,068 276 827 0 -138 103 172Communications 53 25 53 -25 -8 8 8Construction 131 36 77 8 0 11 11Personalservices 124 39 79 -28 17 17 17Otherservices 795 179 308 26 154 128 51Total -72,092 -17,596 -23,631 -722 -25,952 -4,192 -1,636
Source:CGEcalculations.

Reducing Transatlantic Barriers to Trade and Investment – An Economic Assessment
56
Overall,EUexportstonon-US,extra-EUdestinationsareexpectedtoincreaseby33.3
billioneuros(seeTable25).Fromthemodelestimatesreportedinthetable,thisincrease
isattributabletospill-overeffects(directandindirect).(Thepositiveoveralltradeeffect
fromremovingtariffsis1.1billioneuros,whichisessentially0.0percent).Thebilateral
loweringofNTBsingoodscausesexportstonon-US,extra-EUpartnerstoshrinkas
tradeisdivertedawayfromthesepartnerstowardtheUSwithEUexportsbecoming
relativelymore competitive in theUSmarket due the reduction in trade costs (that
wouldstillapplyinthirdcountries).Nevertheless,withdirectandindirectspill-overs,
thecostsofexportingtothirdcountrieswillalsofallandwillleadtoincreasedtrade
beyondthetransatlanticmarket.Asaconsequence,withtheexceptionofagriculture,
forestryandfisheriesandelectricalmachinery,exportsinallsectorsareestimatedto
increasetowardsdestinationsoutsidethepotentialFTA.

Results
57
Table 25 ChangeinEUexportstonon-US,extra-EUdestinations(inmillioneuros),
2027benchmark,20percentdirectspill-overs,ambitiousexperiment
A=B+C+D+E+F
B C D E F G
Total
Stemmingfromtheliberalisationof
tariffstotalNTBsgoods
totalNTBsservices
directspillovers
indirectspillovers
procurement
Agrforestryfisheries
-1,270 -736 -1,562 -51 1,180 -100 -154
Otherprimarysectors
250 -416 -5 30 211 430 95
Processedfoods 3,247 -51 404 27 79 2,789 98Chemicals 5,591 346 1,753 -15 -503 4,009 331Electricalmachinery
-2,551 -82 -1,352 3 -2,018 898 73
Motorvehicles 7,559 552 -2,333 -20 3,475 5,886 -58Othertransportequipment
1,074 359 -1,050 -64 1,210 619 -146
Othermachinery 1,422 1,075 -9,718 -547 13,680 -3,068 382Metalsandmetalproducts
4,139 85 -1,575 -53 3,391 2,292 620
Woodandpaperproducts
2,454 -119 -995 -49 1,312 2,305 -58
Othermanufactures
2,243 620 -518 68 1,915 158 108
Watertransport 951 58 230 0 279 384 52Airtransport 810 67 56 -53 278 462 21Finance 552 -12 222 11 -94 424 44Insurance 406 10 -143 5 199 334 -9Businessservices 2,808 -75 -529 16 1,311 2,086 34Communications 295 -6 7 2 42 250 14Construction 336 -17 -357 -21 480 251 -1Personalservices 898 -143 -1,540 -64 1,313 1,332 -139Otherservices 2,065 -374 -789 -31 1,797 1,461 106Total 33,277 1,142 -19,794 -809 29,535 23,202 1,409
Source:CGEcalculations.

Reducing Transatlantic Barriers to Trade and Investment – An Economic Assessment
58
EUimportsfromnon-US,extra-EUsourcesareestimatedtoincreasebytwiceasmuch
asexports,i.e.66.9billioneuros(seeTable26).Halfofthisincreaseoriginatesfrom
theloweringofNTBsingoods.Spill-oversarealsoshowntobeimportantcontributors.
As noted abovewith respect toTable 20 andTable 21, increased competition from
importscanbeexpectedtopushdomesticfirmstofocusmoreonoverseasmarkets,
at least inrelativeterms.Ontheotherhand, loweringoftariffsbetweentheEUand
US decreases the imports from outside the FTA, switching imports towards intra-
FTApartners.Importsinallsectors(withtheexceptionofothermachineryandother
manufactures) increase.Thebiggest increases in totalareestimated to takeplace in
electricalmachinery,motorvehiclesandmetals.15
15 Onapercentbasis,rankingoftotalchangesissomewhatdifferent.Thegreatestincreasesareinmotorvehicles(7.83percent),woodandpaper(7.53percent)andprocessedfoods(5.72percent).

Results
59
Table 26 ChangeinEUimportsfromnon-USextra-EUsources(inmillioneuros),
2027benchmark,20percentdirectspill-overs,ambitiousexperiment
A=B+C+D+E+F
B C D E F G
Total
Stemmingfromtheliberalisationof
tariffstotalNTBsgoods
totalNTBsservices
directspillovers
indirectspillovers
procurement
Agrforestryfisheries
1,538 390 1,081 53 -344 358 153
Otherprimarysectors
7,282 3,830 345 86 3,151 -131 98
Processedfoods 4,579 102 1,388 70 2,448 570 189Chemicals 1,831 -2,481 -5,227 197 8,688 654 -35Electricalmachinery
12,006 646 -4,452 -363 14,433 1,742 -338
Motorvehicles 12,781 -6,391 2,514 288 13,816 2,553 550Othertransportequipment
6 -529 -275 53 341 416 84
Othermachinery -330 -2,097 15,419 961 -19,126 4,513 13Metalsandmetalproducts
15,705 -1,343 3,710 285 9,846 3,207 6,197
Woodandpaperproducts
4,366 153 1,544 105 1,906 659 271
Othermanufactures
-36 -6,456 10,162 736 -10,628 6,151 783
Watertransport 527 -10 315 -10 62 169 42Airtransport 492 -52 670 -39 -326 239 71Finance 735 100 603 -28 -118 178 113Insurance 237 28 216 12 -72 53 18Businessservices 1,094 -73 1,816 -5 -1,286 641 129Communications 482 46 396 -10 -61 112 48Construction 257 24 341 21 -203 74 51Personalservices 581 52 657 23 -271 121 68Otherservices 2,732 411 3,628 222 -2,376 847 404Total 66,864 -13,649 34,850 2,658 19,879 23,127 8,910
Source:CGEcalculations.

Reducing Transatlantic Barriers to Trade and Investment – An Economic Assessment
60
5.2.2.2.SectorSpecificEffects
Wenowturntotakeacloserlookatthesector-specificeffectsunderlyingtheaggregate
economicimpactsreportedabove.First,welookatthechangesinoutputandthenwe
moveontotheestimatedchangesintrade.
Table 27 ChangesinEUoutputbysector(inpercent).2027benchmark,20percent
directspill-overs
Scenario/SectorBaselinesharesin
valueaddedLessambitious Ambitious
Agrforestryfisheries 0.040 0.05 0.06Otherprimarysectors 0.019 0.01 0.02Processedfoods 0.030 0.30 0.57Chemicals 0.028 0.09 0.37Electricalmachinery 0.004 -3.74 -7.28Motorvehicles 0.015 0.24 1.54Othertransportequipment 0.007 -0.17 -0.08Othermachinery 0.037 0.40 0.37Metalsandmetalproducts 0.021 -0.71 -1.50Woodandpaperproducts 0.023 0.08 0.08Othermanufactures 0.029 0.69 0.79Watertransport 0.003 0.55 0.99Airtransport 0.003 0.30 0.44Finance 0.032 0.23 0.42Insurance 0.010 0.44 0.83Businessservices 0.222 0.15 0.25Communications 0.023 0.10 0.17Construction 0.083 0.31 0.53Personalservices 0.035 0.15 0.26Otherservices 0.338 0.16 0.28
Source:CGEcalculations.
The results reported inTable27 show that the sector output changes in theEUare
ingeneralsmall.Productionin theprimarysectors isalmostunaffected,while there
isasmall increaseacrossallservicessectors.Inmanufacturingthereisalsoasmall
increaseinoutputwithsomeexceptions.Themostnotablecanbefoundinelectrical
machinery,whereoutputisexpectedtodeclineby3.74and7.28percentintheless
ambitiousandthemoreambitiousscenariosrespectively.(Wereturntotheelectrical

Results
61
machineryestimateswhenwediscussFigure11.)Incontrast,theEUproductionof
motorvehiclesisexpectedtoincreaseby0.24and1.54percentinthelessambitious
andambitiousscenarios,respectively.IfwecompareTable27withTable14,itisclear
thatthereductionsofNTBsingoodsandinservicesareimportantdriversofchanges
atsectorlevel.Forexample,formotorvehicles,tariffreductionsaloneharmtheEU
motorvehiclesector,withfallingoutputlevels.Incontrast,withNTBreductions,the
sectorexpands.Thisisstrongestundertheambitiousscenario,withthedeepestNTB
reductions(halfofactionableor25%oftotalNTBs).
Table 28 ChangesinUSoutputbysector(inpercent),2027benchmark,20percent
directspill-overs
Scenario/SectorBaselinesharesinvalue
addedLessambitious Ambitious
Agr,forestryfisheries 0.031 -0.01 0.00Otherprimarysectors 0.023 0.02 0.05Processedfoods 0.017 -0.52 -1.13Chemicals 0.021 0.25 -0.40Electricalmachinery 0.003 -2.03 -2.04Motorvehicles 0.010 -0.57 -2.78Othertransportequipment
0.009 0.62 0.83
Othermachinery 0.027 0.71 1.66Metalsandmetalproducts
0.014 0.27 0.45
Woodandpaperproducts
0.023 -0.04 -0.02
Othermanufactures 0.010 0.17 0.26Watertransport 0.002 0.22 0.42Airtransport 0.004 0.19 0.39Finance 0.074 -0.06 -0.11Insurance 0.020 -0.24 -0.44Businessservices 0.099 0.03 0.07Communications 0.019 0.15 0.32Construction 0.080 0.23 0.39Personalservices 0.036 0.18 0.38Otherservices 0.480 0.09 0.18
Source:CGEcalculations.

Reducing Transatlantic Barriers to Trade and Investment – An Economic Assessment
62
FortheUS,thechangesinsectorspecificoutputarealsofoundtobesmall,withall
theservicessectorschanginglessthanonepercent(Table28).Financeandinsurance
sectorswillcontract,howeverthereductionislessthanhalfapercent,whichimplies
no significant change.Withinmanufacturing, processed foods, electricalmachinery
andmotorvehiclesareexpectedtoseeanoutputdecline,whileintheothersectorsit
willexpand,albeitquite limitedly.Overall theresultingpatternofoutputchanges is
similarinthetwoscenarioswiththesamesectorsexpandingandcontracting.
Figure11belowpresentsabreakdownofthesourcesofchangeacrossselectedsectors
for the EU, under the ambitious scenario.We have focused on some of the largest
changes,fulldetailisprovidedintheannextables.Thelargestnegativeimpactisin
electricalmachinery.16From the figure, almostallof thischange isdrivenbydirect
spill-overs.Ifwecontrastelectricalmachineryandmotorvehicles,wecanalsoseethat
bilateralNTBreductionandspill-oversworkinoppositedirectionsinthetwosectors.
In the electrical machinery sector, bilateral NTB reduction and direct spill-overs
reinforceeachother.Incontrast,inmotorvehicles,bilateralNTBreductionsleadtoan
expansionoftheEUmotorvehiclesector.Thisexpansionisverystrong,andoutweighs
negative effects linked to spill-overs. In other machinery, direct spill-overs support
expansionofthesector,inthiscaseoffsettingtheeffectsofbilateralNTBreductions.
Chemicalsaresimilar,intermsofthepatternofresults,tomotorvehicles.Inservices,
weseethatforfinancialservicesbilateralNTBreductionmatters.Fortransport,itis
indirectspill-oversthatmatterthemostduetoanexpansionofglobaltradevolumes
(withindirectspill-overs)thatbenefitstheEUshippingindustry.Itmustbestressed
thatthesearegeneralequilibriumeffects.Intheothermachinerysector,forexample,
changesinNTBsinothersectorsaredrivingthechangeinoutput.(SeetheNTBlevels
inTable2).Thisismissedcompletelyifwelookatthesectorinisolation(i.e.partial
ratherthangeneralequilibrium.)Withthecomplexmixofchangesinbarriersacross
sectors, combinedwith intermediate linkages, the finalmix of outcomeswill hinge
16 FromtheoriginalEcorysstudy,thissectormapsto“Electronics&OfficeInformation&CommunicationEquipment.”Therewillbeothermachinerymadebyaffectedfirmsthatiscoveredbythe“OtherMachinery”sectorinthemodel.

Results
63
oninteractionsacrosssectors.Hence,whilewecansaythatbilateralNTBsaremost
important in agiven case, thismay follow fromgeneral equilibriumchanges rather
than changes limited to a particular sector.Another exampleof this point relates to
electricalmachinery.TheestimatedimpactontheEUindustrywereporthereissimilar
inmagnitudetotheoriginalEcorysestimates.TheEcorysstudyprovidesadifferent
andvaluabledecomposition(sector-specificvs.overallliberalization),andreportsthat
thedrop inoutput in this sector is actuallydrivenby liberalization inother sectors,
whichthendrawsresourcesintoexpandingsectors.
Figure 11 DecompositionofEUoutputchanges,ambitiousscenario
Source: CGEcalculations.
Wenowmovetolookingatthecorrespondingchangesinsector-leveltrade.Insodoing,
wefirstpresentthechangesforsectorspecifictradefortheEU,whicharesummarized
inTable29below.Thefirstfourcolumnsdepictchangesinexportsandthelastfourfor
importsforthelessambitiousandambitiousscenariosrespectively.

Reducing Transatlantic Barriers to Trade and Investment – An Economic Assessment
64
Table 29 Changesinextra-EUexportsandimportsbysector(inpercentandmillion
euros),2027benchmark,20percentdirectspill-overs
Totalexports TotalimportsScenario/Sector Lessambitious Ambitious Lessambitious Ambitious
PercentMillioneuros
PercentMillioneuros
PercentMillioneuros
PercentMillioneuros
Agrforestryfisheries
0.41 936 0.22 490 3.84 1,953 5.22 2,657
Otherprimarysectors
-0.02 -29 0.24 313 0.78 5,424 1.05 7,322
Processedfoods 5.21 9,252 9.36 16,620 6.26 5,364 10.07 8,628Chemicals 5.07 19,368 9.26 35,405 5.67 18,376 9.01 29,183Electricalmachinery
0.04 35 -0.01 -10 3.10 10,706 5.87 20,298
Motorvehicles 20.11 45,699 41.75 94,857 24.14 44,039 43.11 78,626Othertransportequipment
3.26 5,357 6.10 10,032 6.72 6,208 11.21 10,353
Othermachinery 1.68 10,072 1.47 8,810 1.05 5,055 1.54 7,418Metalsandmetalproducts
7.15 9,875 12.07 16,656 5.25 18,552 9.76 34,483
Woodandpaperproducts
2.16 2,936 4.19 5,694 5.65 3,673 11.20 7,277
Othermanufactures
5.82 12,663 6.13 13,327 0.26 2,586 0.63 6,132
Watertransport 1.08 498 2.11 970 0.70 265 1.49 565Airtransport 0.79 621 1.45 1,142 0.35 339 0.86 832Finance 2.20 2,046 4.37 4,068 1.45 996 2.92 2,000Insurance 2.08 1,895 4.11 3,741 1.46 249 2.92 499Businessservices 0.55 2,290 1.04 4,354 0.76 1,366 1.68 3,024Communications 0.64 172 1.27 342 1.58 576 3.20 1,164Construction 0.33 211 0.64 410 0.87 203 1.79 416Personalservices 0.52 568 1.02 1,126 2.83 749 5.84 1,545Otherservices 0.26 767 0.55 1,623 0.64 1,745 1.27 3,476Total 3.37 125,232 5.91 219,970 2.91 128,424 5.11 225,899
Source:CGEcalculations.
FortheEU,overallimportsandexportsarebothestimatedtoincreaseby3.37and5.11
percentinthelessambitiousandambitiousscenarios,respectively.Withtheexception
ofelectricalmachinery,both importsandexportsare shown to increaseacrossboth
scenariosinallsectorsfortheEU.Someofthelargestchangesareinchemicals,motor
vehicles,andmetals.Asdiscussedearlier(Table27),paralleltothesechangesintrade,

Results
65
output in almost all sectors expands, electricalmachinerybeingone exception.The
resultsindicateanincreaseinimportsofelectricalmachinery,whichisaccompanied
byadeclineintheoutputinthissector(7.28percentintheambitiousscenario)asmore
competitiveimportedgoodsreplacesomeofthedomesticproduction.
Thebiggest relative increase in imports aswell as exports takesplace in themotor
vehiclessector.Heretradeisestimatedtoincreaseby43.11percentintheambitious
scenario.This isaccompaniedwithan increase in theoutputof this sector (by1.54
percentundertheambitiousscenario).Thisreflectstheimportantliberalisationeffort
thattheagreementwouldimplyduetotheinitialcombinationofhightariffsandhigh
NTBs. Inaddition, it reflects trade inparts andcomponents in themodel.This is a
sector characterized by two-way trade in both vehicles and parts.Total exports are
alsoestimatedtoincreasesignificantlyformetalsandmetalproducts(12.07percent),
processed foods (9.36 per cent), chemicals (9.26 per cent), and othermanufactures
(6.13percent).

Reducing Transatlantic Barriers to Trade and Investment – An Economic Assessment
66
Table 30 Changes inUS exports and imports by sector (in per cent andmillion
euros),2027benchmark,20percentdirectspill-overs.
Totalexports TotalimportsScenario/Sector Lessambitious Ambitious Lessambitious Ambitious
PercentMillioneuros
PercentMillioneuros
PercentMillioneuros
PercentMillioneuros
Agrforestryfisheries
0.67 3,261 1.07 5,204 1.18 1,228 0.59 614
Otherprimarysectors
0.09 166 0.30 526 0.43 2,095 0.70 3,412
Processedfoods 4.58 4,895 6.85 7,320 9.15 9,607 16.37 17,189Chemicals 7.71 25,448 11.49 37,938 6.10 16,395 11.56 31,081Electricalmachinery
3.35 4,650 8.86 12,307 2.39 10,136 3.65 15,458
Motorvehicles 34.36 53,071 59.47 91,856 10.73 44,709 20.81 86,693Othertransportequipment
4.98 8,631 8.57 14,853 5.55 4,758 10.33 8,855
Othermachinery 3.66 10,057 5.35 14,698 0.45 3,187 -0.37 -2,595Metalsandmetalproducts
12.79 15,254 22.45 26,783 5.49 10,655 9.04 17,530
Woodandpaperproducts
3.76 2,834 7.75 5,846 2.48 3,291 4.35 5,766
Othermanufactures
3.88 7,972 4.31 8,861 0.97 7,463 0.93 7,194
Watertransport 0.78 30 1.52 58 0.77 22 1.39 40Airtransport 0.78 413 1.52 808 0.41 221 0.75 403Finance 1.14 861 2.40 1,809 3.27 1,986 6.40 3,884Insurance 0.83 268 1.88 612 3.02 1,840 5.84 3,562Businessservices 0.98 1,363 2.24 3,102 0.74 1,147 1.16 1,799Communications 2.39 473 5.03 998 0.31 46 0.43 64Construction 0.95 122 2.20 282 0.99 57 1.62 94Personalservices 1.80 1,348 4.15 3,109 0.66 137 0.83 173Otherservices 0.35 954 0.94 2,571 -0.09 -142 -0.45 -697total 4.75 142,071 8.02 239,543 2.81 118,840 4.74 200,519
Source:CGEcalculations.
AscanbeseenfromTable30,tradeinallsectorsareexpectedtoincreaseintheUS.Here,
totalexportsareshowntoincreaseby4.75and8.02percentunderthelessambitious
andambitious scenarios, respectively.Formanyof themanufacturing sectors, these
changesarequitesignificant.AsinthecasefortheEU,motorvehiclesareexhibiting
thebiggestincreaseintrade.Here,totalexportsareestimatedtoincreasebyupto59.47

Results
67
percentundertheambitiousscenario,whiletotalimportswillgoupby20.81percent.
Inpart,thisisduetotheinitialstructureoftradebarriersbetweenthetwoeconomies,
with theEUhaving quite high initial protection in themotor vehicle sector.At the
sametime,thereaderisremindedtokeepinmindthediscussionfollowingTable27
andTable28aboutgeneralequilibriumeffects.Itisproblematictoassignoutcomesto
policychangesinindividualsectors,asthechangesinoutputandtradedependonwhat
happensacrossallsectors.
ChangesinbilateraltradeforthetwoliberalisationscenariosaresummarizedinTable
31andTable32below.Thefirstoneshowsestimatedchangesinsectorspecificbilateral
exportsfromtheEUtotheUS,andthesecondthebilateralexportsfromtheUStothe
EU.

Reducing Transatlantic Barriers to Trade and Investment – An Economic Assessment
68
Table 31 ChangesinbilateralexportsfromtheEUtotheUSbysector(inpercent
andmillioneuros),2027benchmark,20percentdirectspill-overs
Scenario/Sector Lessambitious AmbitiousPercent Millioneuros Percent Millioneuros
Agrforestryfisheries
16.30 1,882 15.10 1,743
Otherprimarysectors
0.50 45 0.60 55
Processedfoods 26.10 7,690 45.50 13,405Chemicals 20.00 16,517 36.20 29,895Electricalmachinery
18.30 1,336 35.00 2,555
Motorvehicles 71.00 41,711 148.70 87,358Othertransportequipment
13.20 4,678 25.50 9,037
Othermachinery 7.60 8,577 6.60 7,448Metalsandmetalproducts
42.40 7,781 68.20 12,516
Woodandpaperproducts
10.80 1,741 19.90 3,209
Othermanufactures
23.00 11,230 22.80 11,132
Watertransport 3.50 12 6.80 23Airtransport 0.90 187 1.60 333Finance 4.30 1,779 8.50 3,517Insurance 4.20 1,687 8.30 3,333Businessservices 1.40 940 2.30 1,545Communications 0.60 34 0.90 51Construction 1.80 41 3.10 71Personalservices 1.40 139 2.30 228Otherservices -0.40 -196 -1.00 -491Total 16.16 107,811 28.03 186,965
Source:CGEcalculations.
ThetotalexportsfromtheEUtotheUSareestimatedtoincreasesignificantlyby16.16
and28.03percent,respectively.Theincreaseisshowntobetakingplaceacrossalmost
allsectors(with theexemptionof‘OtherServices’),howeverwithsmaller increases
intheexportsofservicesandotherprimarysectorsthaninmanufacturedgoods.The
mostsignificantrelativeincreasesinexportsareshowntooccurinmetalsandmetal

Results
69
products(42.40and68.20percent,respectively)andmotorvehicles(71.00and148.70
percent).
Table 32 ChangesinbilateralexportsfromtheUStotheEUbysector(inpercent
andmillioneuros),2027benchmark,20percentdirectspill-overs
Scenario/Sector Lessambitious AmbitiousPercent Millioneuros Percent Millioneuros
Agrforestryfisheries
20.50 1,037 21.80 1,102
Otherprimarysectors
0.50 51 0.40 41
Processedfoods 56.50 3,084 74.80 4,083Chemicals 23.00 18,341 34.20 27,273Electricalmachinery
21.90 4,124 44.10 8,304
Motorvehicles 207.40 39,412 346.80 65,903Othertransportequipment
17.30 6,421 27.80 10,318
Othermachinery 14.40 6,734 16.70 7,810Metalsandmetalproducts
52.70 11,233 88.10 18,778
Woodandpaperproducts
21.70 1,490 42.50 2,918
Othermanufactures
16.30 6,022 16.70 6,170
Watertransport 3.40 20 7.10 42Airtransport 1.00 170 2.20 374Finance 2.40 607 4.90 1,240Insurance 3.50 125 7.40 264Businessservices 2.50 894 5.40 1,931Communications 5.00 326 10.50 685Construction 3.10 73 6.60 155Personalservices 6.40 447 13.80 964Otherservices 0.60 298 1.50 744Total 23.20 100,909 36.57 159,098
Source:CGEcalculations.
LookingattheestimatedincreasesinexportsfromtheUStotheEU,theincreasein
bilateralexportsinpercentagetermsisevenbigger(Table32).Thisisdrivenmainlyby
thedifferenceinincreaseinthemotorvehiclesector.ImportsfromtheUSinthissector
expandmorethanexportstotheUS.Inthelessambitiousscenariobilateralexportsto

Reducing Transatlantic Barriers to Trade and Investment – An Economic Assessment
70
theEUareshowntoincreaseby23.20percentandby36.57percentintheambitious
scenario.Theexpansionofexports ishigher inall sectors in theambitiousscenario
thaninthelessambitious.AswasthecasewithEU’sexportstotheUS,theincreaseis
mostsubstantialinthemanufacturingsectors.Theincreaseismostnotableformotor
vehicles,whereexportstotheEUareexpectedtoincreaseby207.40and346.80per
centrespectively.Significantrelativeincreasesarealsoexpectedtooccurintheexports
formetalsandmetalproductsandprocessedfoods.Despitethehighpercentincrease
ofUSexports,theFTAincreasesthepositiveEUtradebalanceofmotorvehicleswith
theUS.Inaddition,theincreaseinimportsfromtheUSonlycorrespondstoroughly
4.8percentoftotalsalesintheEUinthebaseline.
Wenextcomparetotaltradeeffectswithbilateraltradeeffectsforselectedsectors.In
bothcasesthestrongestchangesareinmotorvehicles.Here,wecanseethatthereis
asubstantialexpansionof tradebetweenthe transatlanticpartners(theEUandUS).
Indeed,thisimpliesrelativelydeepchangesintheintegrationofthetransatlanticmotor
vehiclesector.This reflectsa relatively largeshareofpartsandcomponents in total
sectortrade,aswellasthehightariffs(andsolargetariffcuts)forthesector.Thehigh
tariffsareontheEUside(seeFigure9)whileNTBsarehighonbothsides(seeTable
2).
5.2.3. Sustainability Impacts
Inthissubchapter,weconcentrateonsustainabilityimpactsresultingfromthetwoFTA
scenarios.First,wefocusontheresultingeffectsonthelabourmarketwithrespectto
changesinwagesanddisplacements.ThenwediscusstheestimatedeffectsonCO2-
emissionsandtheuseofnaturalresources.

Results
71
5.2.3.1. Labour
First, we look at the corresponding estimated changes in wages for less andmore
skilledlabourasaresultofliberalizingtradebetweenthetwoeconomies.Theseeffects
aresummarizedinTable33below.
Table 33 Changes inwages for lessandmore skilled labour, total effects (inper
cent),2027benchmark,20percentdirectspill-overs
Lessskilled MoreskilledLess ambitious experiment EuropeanUnion 0.30 0.29UnitedStates 0.22 0.21Ambitious experimentEuropeanUnion 0.51 0.50UnitedStates 0.38 0.36
Source:CGEcalculations.
TheresultingeffectsonwagesfortheboththeEUandtheUSarepositive.Allestimated
changesareequaltoorlessthan0.5percentofthewagerate.Thechangesinwages
are shown tobe similar forboth skilledandunskilled labourwith the impactbeing
marginallylowerforskilledworkers.Theambitiousexperimentresultsinsomewhat
higherchangesfortheEU.ThewageeffectsareinlinewithchangesinGDPinTable
6andTable16,andsoareconsistentwithaninterpretationofgeneralcostsavingsthat
leadtoproductivitygainsasfirmsoperatewithlowertariffandNTB-relatedcostsfor
transatlanticcommerce.Itshouldbestressedthatthemodelisalong-runmodel,where
sourcesofemploymentandunemploymentare“structural” (rather thancyclical). In
thissense,changesinlabourdemandarecapturedthroughwagechanges(inthiscase
risingwages).Aswagesincreaseintheexperiments,thismeansarisingdemandfor
labour,sothatunderaflexiblelaboursupplyspecification,employmentwouldincrease
instead.
Table34,Table35,Table35,andTable37reportdetailedemploymenteffectsacross
sectorsundertheambitiouscomprehensivescenario.Aswearenotmodelinglongrun

Reducing Transatlantic Barriers to Trade and Investment – An Economic Assessment
72
unemploymentrates,thesearereallocationeffectsacrosssectors.IntheEU,themotor
vehiclesectorseesemploymentexpandby1.28percentforskilledlabor,and1.27per
centorlessskilledlabor.Incontrast,thereisasignificantcontractionintheelectrical
machineryandmetalssectors.Mirroringthispattern,intheUSthemotorvehiclesector
seesfallingemployment,andthemetalsandmetalproductssectorseesarise.Inthe
US, like theEU, the electricalmachinery sector contracts in terms of employment.
Combinedwithrisingwages,thepatterninthetablessuggeststhattheexpansionof
othersectors(motorvehiclesintheEUforexample,andothermachineryandtransport
equipmentintheUS)pullsworkersoutofthesectorsthatthencontract,byoffering
higherwages.

Results
73
Table 34 Change inmore skilled employment in theEUby sector (in per cent),
2027benchmark,ambitiousscenario,20percentdirectspill-overs
A=B+C+D+E+F
B C D E F G
Baselinesharesin
moreskilledemployment
Total
Stemmingfromtheliberalisationof
tariffstotalNTBsgoods
totalNTBsservices
directspillovers
indirectspillovers
procurement
Agrforestryfisheries 0.005 0.07 0.04 -0.06 -0.01 0.09 0.01 0.00
Otherprimarysectors 0.004 -0.01 0.00 -0.12 -0.01 0.11 0.00 -0.01
Processedfoods 0.016 0.28 0.01 0.39 -0.01 -0.21 0.10 0.04
Chemicals 0.024 0.08 -0.13 0.87 -0.06 -0.73 0.14 0.20
Electricalmachinery 0.004 -7.00 -0.18 -1.29 0.00 -5.36 -0.17 0.08
Motorvehicles 0.013 1.28 -0.92 3.74 -0.04 -1.73 0.23 0.56
Othertransportequipment
0.007 -0.23 -0.25 0.03 -0.04 0.02 0.01 0.16
Othermachinery 0.043 0.18 0.34 -1.06 -0.09 1.36 -0.38 0.03
Metalsandmetalproducts
0.015 -1.61 0.00 -0.61 -0.06 -0.76 -0.18 -0.76
Woodandpaperproducts
0.016 -0.16 0.02 -0.17 -0.02 -0.12 0.13 -0.04
Othermanufactures 0.018 0.52 0.54 -0.21 -0.03 0.42 -0.20 0.00
Watertransport 0.002 0.43 0.03 -0.10 -0.04 0.20 0.34 0.00
Airtransport 0.002 0.11 0.09 -0.20 0.00 0.13 0.08 -0.02
Finance 0.041 0.12 0.00 -0.04 0.21 -0.05 0.02 -0.07
Insurance 0.015 0.57 0.02 -0.07 0.56 0.03 0.03 -0.01
Businessservices 0.166 -0.16 -0.04 -0.09 -0.02 -0.02 0.00 -0.01
Communications 0.026 -0.14 -0.02 -0.06 -0.07 -0.02 0.02 -0.01
Construction 0.045 0.18 0.06 0.12 0.00 -0.01 0.02 0.01
Personalservices 0.043 -0.04 -0.02 -0.18 -0.03 0.11 0.08 -0.02
Otherservices 0.496 0.06 0.00 0.03 -0.01 0.02 0.01 0.00
Displacement Index 0.55 0.15 0.53 0.09 0.53 0.10 0.12
Note:Displacementindexistheweightedmeandeviation(squarerootoftheweightedmeansquaredvariation).

Reducing Transatlantic Barriers to Trade and Investment – An Economic Assessment
74
Table 35 ChangeinmoreskilledemploymentintheUSbysector(inpercent),2027
benchmark,ambitiousscenario
A=B+C+D+E+F
B C D E F G
Baselinesharesin
moreskilledemployment
Total
Stemmingfromtheliberalisationof
tariffstotalNTBsgoods
totalNTBsservices
directspillovers
indirectspillovers
procurement
Agrforestryfisheries 0.002 -0.04 -0.08 -0.13 0.00 0.16 0.01 0.00
Otherprimarysectors 0.004 0.11 -0.04 -0.05 0.01 0.17 0.01 0.01
Processedfoods 0.008 -1.21 0.02 -0.97 0.03 -0.41 0.11 -0.13
Chemicals 0.018 -0.54 0.76 -0.87 0.13 -0.79 0.21 -0.52
Electricalmachinery 0.004 -2.06 -1.92 9.01 1.23 -8.76 -1.61 1.37
Motorvehicles 0.010 -2.76 2.58 -2.59 0.10 -3.16 0.30 -1.10
Othertransportequipment
0.010 0.74 0.33 -0.16 0.06 0.40 0.11 -0.14
Othermachinery 0.034 1.50 -0.50 -0.46 0.13 2.50 -0.16 0.24
Metalsandmetalproducts
0.010 0.35 0.20 0.29 0.11 -0.24 -0.01 0.14
Woodandpaperproducts
0.017 -0.13 -0.09 -0.18 0.05 -0.01 0.10 0.04
Othermanufactures 0.006 0.15 0.02 -0.15 0.06 0.42 -0.20 -0.01
Watertransport 0.001 0.18 0.00 0.04 0.09 -0.05 0.10 0.01
Airtransport 0.002 0.17 -0.05 0.07 0.03 0.05 0.07 0.03
Finance 0.132 -0.17 -0.01 0.07 -0.19 -0.05 0.00 0.02
Insurance 0.036 -0.49 -0.06 0.01 -0.51 0.05 0.02 0.02
Businessservices 0.177 0.00 -0.03 0.05 0.01 -0.03 0.00 0.00
Communications 0.017 0.05 -0.06 -0.02 0.09 0.03 0.01 0.01
Construction 0.059 0.31 0.09 0.19 0.09 -0.06 0.01 0.01
Personalservices 0.056 0.25 -0.04 0.09 0.05 0.12 0.03 0.03
Otherservices 0.399 0.00 -0.03 0.00 0.04 -0.01 0.00 0.00
Displacement Index 0.46 0.32 0.63 0.15 0.78 0.11 0.16
Note:Displacementindexistheweightedmeandeviation(squarerootoftheweightedmeansquaredvariation).

Results
75
Table 36 ChangeinlessskilledemploymentintheEUbysector(inpercent),2027
benchmark,ambitiousscenario
A=B+C+D+E+F
B C D E F G
Baselinesharesinlessskilledemployment
Total
Stemmingfromtheliberalisationof
tariffstotalNTBsgoods
totalNTBsservices
directspillovers
indirectspillovers
procurement
Agrforestryfisheries 0.054 0.07 0.04 -0.07 -0.01 0.09 0.01 0.00
Otherprimarysectors 0.006 -0.02 0.00 -0.12 0.00 0.12 0.00 -0.01
Processedfoods 0.037 0.28 0.00 0.36 0.00 -0.18 0.11 0.04
Chemicals 0.031 0.08 -0.14 0.83 -0.05 -0.71 0.15 0.20
Electricalmachinery 0.005 -7.01 -0.19 -1.33 0.01 -5.33 -0.16 0.08
Motorvehicles 0.024 1.27 -0.93 3.70 -0.03 -1.71 0.24 0.56
Othertransportequipment
0.012 -0.23 -0.26 0.00 -0.03 0.05 0.02 0.16
Othermachinery 0.052 0.17 0.33 -1.09 -0.08 1.39 -0.38 0.04
Metalsandmetalproducts
0.033 -1.62 -0.01 -0.64 -0.05 -0.73 -0.18 -0.76
Woodandpaperproducts
0.032 -0.17 0.01 -0.21 -0.01 -0.10 0.14 -0.04
Othermanufactures 0.044 0.51 0.52 -0.25 -0.02 0.45 -0.19 0.00
Watertransport 0.003 0.42 0.02 -0.15 -0.03 0.24 0.34 0.01
Airtransport 0.004 0.10 0.08 -0.24 0.01 0.16 0.09 -0.01
Finance 0.026 0.12 -0.01 -0.08 0.22 -0.03 0.02 -0.07
Insurance 0.009 0.56 0.00 -0.10 0.56 0.06 0.03 0.00
Businessservices 0.103 -0.17 -0.05 -0.12 -0.01 0.01 0.01 -0.01
Communications 0.017 -0.15 -0.03 -0.09 -0.06 0.01 0.02 -0.01
Construction 0.106 0.17 0.04 0.08 0.01 0.02 0.03 0.02
Personalservices 0.027 -0.05 -0.03 -0.21 -0.03 0.13 0.09 -0.02
Otherservices 0.375 0.05 -0.01 -0.01 0.00 0.05 0.02 0.01
Displacement Index 0.65 0.20 0.69 0.07 0.62 0.12 0.17
Note:Displacementindexistheweightedmeandeviation(squarerootoftheweightedmeansquaredvariation).

Reducing Transatlantic Barriers to Trade and Investment – An Economic Assessment
76
Table 37 ChangeinlessskilledemploymentintheUSbysector(inpercent),2027
benchmark,ambitiousscenario
A=B+C+D+E+F
B C D E F G
Baselinesharesinlessskilledemployment
Total
Stemmingfromtheliberalisationof
tariffstotalNTBsgoods
totalNTBsservices
directspillovers
indirectspillovers
procurement
Agrforestryfisheries 0.015 -0.04 -0.08 -0.13 0.00 0.16 0.01 0.01
Otherprimarysectors 0.007 0.10 -0.04 -0.04 0.00 0.17 0.01 0.02
Processedfoods 0.020 -1.23 0.01 -0.95 0.00 -0.39 0.11 -0.13
Chemicals 0.018 -0.56 0.74 -0.85 0.10 -0.77 0.21 -0.51
Electricalmachinery 0.003 -2.07 -1.94 9.03 1.20 -8.74 -1.61 1.38
Motorvehicles 0.012 -2.77 2.56 -2.57 0.07 -3.14 0.30 -1.09
Othertransportequipment
0.012 0.72 0.31 -0.15 0.03 0.41 0.11 -0.14
Othermachinery 0.029 1.49 -0.52 -0.44 0.09 2.52 -0.16 0.25
Metalsandmetalproducts
0.021 0.33 0.18 0.31 0.08 -0.22 -0.01 0.15
Woodandpaperproducts
0.031 -0.15 -0.11 -0.16 0.02 0.01 0.09 0.04
Othermanufactures 0.015 0.13 0.00 -0.13 0.03 0.44 -0.20 0.00
Watertransport 0.002 0.16 -0.03 0.07 0.05 -0.02 0.09 0.02
Airtransport 0.006 0.15 -0.08 0.10 -0.01 0.08 0.06 0.03
Finance 0.061 -0.19 -0.03 0.09 -0.22 -0.03 0.00 0.03
Insurance 0.017 -0.50 -0.08 0.03 -0.54 0.07 0.02 0.02
Businessservices 0.081 -0.01 -0.05 0.07 -0.02 -0.01 0.00 0.01
Communications 0.008 0.03 -0.08 0.00 0.06 0.05 0.01 0.01
Construction 0.135 0.30 0.07 0.21 0.06 -0.04 0.00 0.01
Personalservices 0.026 0.24 -0.06 0.11 0.02 0.14 0.02 0.03
Otherservices 0.483 -0.02 -0.05 0.02 0.01 0.01 -0.01 0.01
Displacement Index 0.48 0.33 0.62 0.12 0.75 0.11 0.17
Note:Displacementindexistheweightedmeandeviation(squarerootoftheweightedmeansquaredvariation).
InadditiontotheeffectsonwagesTable34,Table35,Table35,andTable37alsoreport
asummarystatisticontheeffectonmovementofthelabourforcebetweensectors–a
labourdisplacementindex.Wehavereportedasummaryoftheindexchangesunder
allthescenariosinTable38below.Thisisthe“acrossdisplacement”index,basedon
Francois(2004)andFrancois,Jansen,andPeters(2012).Informalterms,theindexis
definedasfollows:

Results
77
^ ^SL, across = Σ λj (lj – mL)2
j=1
n
FollowingthenotationofFrancois,Jansen,andPeters(2012),λjisthesectorjshare
oftotalemployment,îjisthepercentchangeinsectorjemployment,andm
∧
Listotal
per cent change in employment across all sectors. Sincewe do notmodel changes
intotalemploymentlevelshere,andemployalong-runclosurewhereoveralllabour
participation and employment levels are determined by factors outside the model,
m∧=0.Thismeansoutindexreducestothefollowing:
^SL, across = Σ λj (lj)
2
j=1
n
TheindexSL, across
givesusameasureofvariationofemploymentacrosssectorsandthus
ameasureoftheactualnumberofworkersthatchangejobsbymovingacrosssectors.
In essence, an index value of 0.5means, that roughly 5workers out of 1,000 have
movedacrosssectors.Theindexprovidesausefulindicatorfortheadjustmentstaking
placeinlabourmarketsfollowingtradeliberalisation.17
Table 38 Displacement of less andmore skilled labour in the EU andUS, total
effects(inpercent),2027benchmark,20percentdirectspill-overs
Lessskilled MoreskilledLessambitious Ambitious Lessambitious Ambitious
EU 0.33 0.65 0.28 0.55US 0.21 0.48 0.21 0.46
Source:CGEcalculations.
17 Theindexisalowerboundonlabourdisplacement,asitislikelytounderestimatetheactualamountofjobchurningthatoccurs.Workerswhochangejobsbutdonotchangesectorsarenotcapturedbytheabovemeasure.Inordertocapturethoseworkers,itwouldbenecessarytohaveinformationonemploymentchangesatthefirmlevel.Inthemodel,wetreatlabourasmobilebutnotperfectlymobile,eveninthelong-run.Thismeansthatthereisatransformationelasticityforlabourbetweensectorsthatislessthaninfinite.

Reducing Transatlantic Barriers to Trade and Investment – An Economic Assessment
78
Aswasshowntobethecaseforwages,theestimatedeffectonmovementoflabouris
relativelysmall.Here,nomorethan0.7percentofthelabourforceisexpectedtomove
acrosssectorsasaresultofmeasurestakentoliberalisetradebetweentheEUandUS.
Theimpactisestimatedtobesomewhatbiggerforlessskilledworkersthanformore
skilledworkers.TheresultingchangesaresomewhatbiggerfortheEUthanfortheUS,
buttheeffectsarestillquitesmall.Toputthisinperspective,thisisachangefollowing
fullimplementation.AccordingtoEurostat,theaverageannualchangeinemployment
intheEUinmanufacturingbeforethecrisis(2001-2007)was2.1percent,andinthe
yearsafterthecrisisthisincreasedto3.7percent.Takingthisasabenchmark,ifwe
assume just 2 per cent labour turnover per year through natural entry and attrition,
thenoverfiveyearswewouldhaveroughly10percentlabourturnover,suchthatthe
labourdisplacementfromFTAimplementationoverafiveyearphaseinperiodwillbe
minimalbycomparison.In thissenseitought tobeeasilyabsorbedthroughnormal
entry and attrition rates.Additionally, the FTA-related labour movement is largely
drivenby“pullfactors”(higherwages).Bythiswemeanthatwagesaregoingup,and
sothemechanicsoflabourreallocationwillinvolveattractionofworkersfromlowerto
higherpayingsectorsonnet.
5.2.3.2. CO2 Emissions
Next, we move on to discuss the estimated impact on CO2-emissions. These are
summarizedinTable39below.

Results
79
Table 39 ChangesinCO2-emissions(inthousandmetrictons),2027benchmark,20
percentdirectspill-overs
Lessambitious AmbitiousEuropeanUnion 2.7 3.6UnitedStates 2.9 3.9Other -1.5 3.8OtherOECD,highincome 0.1 0.9EastEurope -0.9 0.3Mediterranean -1.4 -1.6China 1.4 4.3India -0.1 0.1ASEAN -0.5 -0.4MERCOSUR -0.1 -0.2LowIncome 0.2 0.8RestofWorld -0.2 -0.3Total, thousand metric tons 4.0 11.3Total, percentage share of annual rate 0.02 0.07
Source:CGEcalculations.
The lessambitiousFTAscenario isestimated to lead toa totalglobal increaseof4
and11 thousandmetric tonsunder the twodifferentexperiments respectively.CO2-
emissionsareexpectedtoincreaseintheEUandUSbyaround3and4thousandmetric
tons, respectively.On theotherhand, emissions are expected todecrease somewhat
acrosssomeothercountries.Lookingatthepercentageincrease,theestimatedchanges
areshowntobeverysmall,being0.02percentinthelessambitiouscaseand0.07per
centintheambitiouscase.Dependingonfuturechangesinthecoverageofemissions
tradingintheEU(increasedandmorebindingcoverage),andpossibilitiesforfuture
introductionofsuchaschemeintheUS,theneteffectwouldthenbeevensmallerthan
reportedhere.ItshouldbepointedoutthattheestimatesinTable39canbeconsidered
ascomprehensiveasthemodelconsidersalleconomicactivities,includinginternational
shippingandtransportthatareassociatedwithchangesintradeflows.Thelatterare
endogenouswithinthemodelasincreasesintradeflowsleadtochangesindemandfor
transportservices.Astransportactivitiesaremodelledexplicitly,thiswillleadinturn
tochangesinemissionslinkedtotheseactivities.

Reducing Transatlantic Barriers to Trade and Investment – An Economic Assessment
80
5.2.3.3. Natural Resource Usage (Land intensity)
Wenowtakea lookat the resultingeffecton the landuse. In themodel, land isan
explicit factor, likecapitaland labour. Increase invalueadded insectorsusing land
translatesintoitsmoreintensiveuse(moreoutputperunitofland).Alternatively,in
sectorswhereactivitiesfall,therewillbeadropinlanduseintensity.Bythiswemean
thereislesscapital,labour,andinputssuchasfertilizersinuseonagivenpieceofland
whenintensityfalls.Ourestimatesofchangesinlanduseintensity(basedontotalvalue
addedactivityforafixedstockofland)aresummarizedinTable40below.
Table 40 Changes in land use (in per cent), 2027 benchmark, 20 per cent direct
spill-overs
Lessambitious AmbitiousEuropeanUnion 0.05 0.06UnitedStates -0.01 0.00Other 0.00 0.01OtherOECD,highincome -0.01 -0.01EastEurope 0.02 0.03Mediterranean 0.03 0.04China 0.01 0.03India 0.00 0.01ASEAN -0.04 -0.07MERCOSUR 0.01 0.02LowIncome 0.00 0.00RestofWorld 0.01 0.01Total 0.00 0.01
Source:CGEcalculations.
TheresultingimpactfromremovingbarrierstotradebetweentheEUandtheUSon
theuseofnatural resources isnegligible.Theexpectedchangesarepracticallyzero
inallregions,includingtheEUandtheUS.Thesenegligibleresultsindicatethatthe
liberalisationmeasureswillnotimpactsignificantlyonlanduseinanyoftheeconomies

Results
81
5.2.4. Global Effects
Changing the conditions for trade between twomajor global trading partners, such
astheEUandtheUS,changesthetradingconditionsforothercountriesaswell.In
a traditional set-up,when tariffs are lowered, this implies trade diversion and trade
creationduetorelativeaswellasabsolutechangesintradingcosts.Inthisset-up,the
additionalmeasureof loweringofNTBsandassumptionofspill-oversaddsanother
channel throughwhichbilateral liberalisationpotentially affects third countries (see
Section4.2).
Overall, the rest-of-world impact hinges critically on the assumed potential for
streamliningofEUandUSregulationsintheprocessofnegotiationsandconvergence
ofEU-USstandards,linkedtoscopeforsomeresultingconvergenceonglobalstandards
andcross-recognitionaswell.Theseeffectsimplysomeimprovementofmarketaccess
forthirdcountries,helpingtooffsettradediversion.
Thepurposeofthissubsectionistotakeacloserlookhowliberalizingtradebetween
theEUandUSisexpectedtoaffecttherestoftheworld.TheestimatedimpactonGDP
issummarizedinTable41below.Ingeneral,theincreasedtradebetweentheEUand
theUSisestimatedtohaveapositiveimpactonotherpartsoftheworld.
Ascanbeseenfromthetable,underthelessambitiousscenario,theoverallgainfor
thirdcountries isestimated tobe46.6billioneuros,whichamounts toapercentage
increaseofGDPof0.07percent.Inthemoreambitiouscase,theincreasewouldbe
99.2billioneurosor0.14percentofworldGDP.18
18 ExcludingtheEUandtheUS.

Reducing Transatlantic Barriers to Trade and Investment – An Economic Assessment
82
Table 41 TotaleffectsonGDPforrestoftheWorld(inmillioneurosandpercent),
2027benchmark,20percentdirectspill-overs
Lessambitious AmbitiousMillioneuros Percent Millioneuros Percent
EuropeanUnion 68,274 0.27 119,212 0.48UnitedStates 49,543 0.21 94,904 0.39TotalOtherCountries 46,636 0.07 99,171 0.14Whereof:OtherOECD,highincome 15,942 0.08 36,322 0.19EasternEurope 1,019 0.14 2,328 0.33Mediterranean 237 0.02 1,063 0.08China 3,810 0.02 5,487 0.03India 946 0.02 2,338 0.04ASEAN 15,081 0.45 29,834 0.89MERCOSUR 624 0.01 1,545 0.03LowIncome 1,064 0.09 2,366 0.20RestofWorld 7,913 0.05 17,887 0.12
Source:CGEmodelling.
Lookingattheselectedregionsalittlemorecloselyrevealsthatallothereconomies
areexpectedtoexperiencewelfareincreases.Mostnotably,thisisthecaseforASEAN,
whereGDPisexpectedtoincreaseby15.1billioneurosand29.8billioneuros,or0.45
per cent and 0.89 per cent respectively.The driver forASEAN is the third-country
spill-overscombinedwithveryhigh trade toGDPratios in theASEANeconomies.
Basically, if there is a drop in global trade costs linked to indirect spill-overs, the
ASEANeconomiesbenefitgreatlyfromthis.
Table42showsaregionalbreakdownofthechangeinexports.Theseresultsprovide
insightregardingthepatternofresultsinTable41.Notsurprisingly,theprimaryeffects
arerealizedintheFTApartnerregions–theUSandEU.However,thespill-overeffects
alsocontributetoexportsgrowthinthirdcountries.ThisisespeciallytrueforASEAN,
whichisaregionwithahightradetoGDPratioandwithastructuralfocusinexportsin
thosesectorsthatseethegreatestNTBreductions.WithASEAN,strongerGDPeffects
alsosupportstrongtradeeffects.

Results
83
Table 42 Changeinexportsbyregion(inpercent),2027benchmark,20percent
directspill-overs
Lessambitious AmbitiousEuropeanUnion 3.37 5.91UnitedStates 4.75 8.02TotalOtherCountries 0.51 1.04Whereof:OtherOECD,highincome 0.50 1.00EasternEurope 0.42 0.95Mediterranean 0.28 0.59China 0.47 0.96India 0.43 0.94ASEAN 1.17 2.31MERCOSUR 0.47 0.97LowIncome 0.42 0.95RestofWorld 0.37 0.76


85
In this chapter,we focus onpossible benefits of reducingNTBs facing affiliates of
EuropeanfirmsoperatingintheUS,andaffiliatesofUSfirmsoperatinginEurope.This
involvesareviewofrecentbenchmarkNTBsurveyresultsforFDI,andaneconometric
mapping ofNTB levels to the activities of European firms (as captured by foreign
investment income, number of employees, and number of firms).19 To do this we
buildonanextendeddatabaseofmarketaccessrankingsforFDI,whichconsolidates
informationfromseveralrecentNTBsurveys,allbasedonthesamecorequestions.20
TheseNTBsurveydataarediscussedinmoredetailinChapter2.Theanalysisinthis
chapterisindependentoftheCGEanalysisinthepreviouschapters,whichisfocused
ontradeNTBsratherthaninvestmentNTBs.Thedifferenceintermsoftheunderlying
methodologiesdonotallowdirectcomparisonsbetweentheseresultsandtheresults
fromtheCGEanalysispresentedinthepreviouschapters.
6.1 Indexes and comparison of levels of openness
The original ECORYS (2009) study reported overall rankings ofmarket access for
operationsofMNEs,inadditiontorankingsofmarketaccessfordirecttradeingoods
and services. Like the trade-related questions in the firm survey, the FDI-related
19 ThesedatacomefrombothEurostatFATS(foreignaffiliatetradestatistics)andforeigninvestmentstatistics.EurostatdefinesFDIincomeastheincomeaccruingtodirectinvestors-i.e.EUfirms-includingreinvestedearnings,dividendsandnetbranchprofits,andinterestearned.‘Employees’isthenumberofemployeesworkinginalocalaffiliateofanforeignfirm,whilenumberofaffiliatesisreportedbilaterally.
20 SeeECORYS(2009),EuropeanCommissionandtheGovernmentofCanada(2009),andFrancois,Sunesen,andThelle(2009,2012).Theconsolidatedsurveycovers2,608individualfirmresponses.Theperiodcoveredis2007-2009,thoughessentiallyasacross-section.
6. FDI Barriers

Reducing Transatlantic Barriers to Trade and Investment – An Economic Assessment
86
questionsincludedbothdetailedquestionsaboutspecificbarriers,andamoregeneral
questiononlevelsofopennessforFDI.Thegeneralquestion,whichisavailableinthe
annex,requestedrespondentstoprovidebilateralrankingsofmarketaccess.TheFDI
responsesfromtheEcoryssurvey,scaledfrom0(=fullopenness)to100(=totallyclosed),
have sincebeen supplementedwith follow-up surveydata supportingECstudiesof
NTBsaffectingtradewithCanada,Japan,andChina.Thesedataareincorporatedin
thisanalysis.
Foranoverviewofthepatternofopennessindicatedbythesurveyresponses,Figure
12belowsummarizestheaveragelevelsoftheNTBindexesinoursurveydata.Inthe
figure, theaverage index levelsare reported forNTBs facing firmsoperating in the
EU,theUS,andinthirdcountries(labeledas“restofworld”index).Wehavefurther
splittheaverageindexvaluesintoindexesforNTBsfacingEUfirmsoperatinginthe
EU(the“intra-EU”index),andnon-EuropeanfirmsoperatingintheEU(extra-EU).
The figure illustrates a number of useful points. First, intra-EUNTBs (the ranking
ofmarket access restrictions facingEuropean firms operating affiliates in otherEU
MemberStates)areshowntobesubstantiallylowerthanNTBsreportedbynon-EU
firmswhenoperatinginthosesameEUmarkets.Thisfactreflectsthesuccessofthe
EuropeanUnion in reducing internalbarriers tocross-borderoperationofEuropean
firmswithinEurope.Hence,whiletheEUNTBindexforFDIaveragesapproximately
28forfirmsfromoutsidetheEU,itaveragesroughly18forfirmsinsidetheEU.The
differenceisaneffectivepreferencemargin(lowerNTBs)forintra-EUFDI.TheUS
levelissomewherebetweentheEUintra-andextra-levels,averagingapproximately24.

FDI Barriers
87
Figure 12 AverageValueofNTMIndexesforFDI
Source: Seetext.
Notes: Extra-EU(Intra-EU)referstoNTMsfacedbynon-EU(EU)firmsoperatinginEU.
Figure13andFigure14providefurtherbreakdownbysector.InFigure13,weagain
seetheintra-andextra-EUNTBindexvariationsfornon-EuropeanandEuropeanfirms
operatingaffiliateswithintheEU.IntermsofNTBrankings,thegreatestdifferences
forgoodsareapparentinaerospace,chemicals(includingdrugsandcosmetics),and
motorvehicles.Forservices,thegreatestdifferencesareintransport,travel,andICT
services.Ascanbeseenfromthefigure,however, thefinancialservicesindexesare
showntobemoreorlessthesameforintra-EUandextra-EUinvestment.Thisimplies
that there are similar levels of openness forEuropean and extra-EUbanks engaged
inFDIinEurope.Thesamemessageholdsforinsurance,construction,andbusiness
services.

Reducing Transatlantic Barriers to Trade and Investment – An Economic Assessment
88
Figure 13 AverageNTMindexvaluesforFDIlocatedintheEU
Source: Seetext.
Notes: Extra-EU(Intra-EU)referstoNTMsfacedbynon-EU(EU)firmsoperatingintheEU.
WhileFigure13abovefocusedontheEUasanFDIdestination,inFigure14wehave
adifferentdis-aggregation.Here,wehaveasector-by-sectorcomparisonbetweenthe
EU,US,andrestofworldallasFDIdestinations.Thissetupenablesacomparisonof
apparentlevelsofopennessinthetransatlanticeconomiestoFDI,withtheaveragelevel
fortherestoftheworld.Ascanbeseenfromthefigure,withafewexceptions,both
theUSandEUareshowntoberelativelyopenbythestandardofthirdcountries(i.e.
comparedtotherest-of-worldaverage).Thesectorspecificexceptionsareaerospace
(theUS andEU),motor vehicles (theEU), cosmetics (theEU), ICT (theEU), and
transport (theUS).The figure further shows that for processed foods, there is little
differencebetweentheUS,EU,andrestofworld.

FDI Barriers
89
Figure 14 BreakdownofNTBsforFDIbysector
Source: Seetext.
Notes: TheEUNTMindexisbasedonresponsesofnon-EUfirmsoperatingintheEU(extra-EU).
The impactofchanges inmarketaccess forMNEswillnaturallybeaffectedby the
sensitivityofMNEactivitiestomarketaccessrestrictions.Theimpactwillalsodepend
ontherelativemarketpotentialoftheEUforUSfirms,andtheUSforEUfirms.To
provideanoverviewof thispotential,Figure15presentsamappingofmarket size,
investment income (recall this is defined by Eurostat as the FDI-based earnings of
European-ownedaffiliates)andNTBrankings.
InFigure15,NTB index levels (whereahighnumbermeansmore restrictions) are
mappedonthehorizontalaxis,whileaverage2007-2009GDPisshownonthevertical
axis.Thesizeof thebubble in thefigure isscaledby thevalueofdirect investment
incomeineachmarket,againaveragedfortheyears2007-2009.

Reducing Transatlantic Barriers to Trade and Investment – An Economic Assessment
90
Figure 15 IncomefromFDI,marketsize,andopenness,2007-2009
Source: NTMsurveysandEurostatFATSstatisticsasexplainedintext,exculdingintra-EUFDI.
AscanbeseenfromtheleftpanelofFigure15,theUSmarketisshowntoberelatively
opentoFDIinvestments.Atthesametime,theUSmarketisalsorevealedtobethe
singlemostimportantsourceofincomeforEUforeigndirectinvestment.Therefore,
asinthediscussionofunderlyingactivityandNTBsintheearliertradeanalysis,the
simplesizeoftheUSmarketimpliespotentialgainsevenifrelativelysmallbarriersare
removed.Indeed,intermsofvalue,theUSmarketsdominates,byfar,bothJapanand
China.Assuch,andgiventhesizeofthebase,improvementsinmarketaccessarelikely
to implysubstantialchanges inFDI levelsand thuscorrespondingdirect investment
earningsofEuropeanfirms.Whileonemightbetemptingtoconcludefromthefigure
thatthereislittlescopeforfurtherliberalization,Figure12andFigure13belaythis.
The substantially bettermarket access conditions for intra-EU FDI shown in these
figures,point topotential roomformaneuver in loweringbarriers further.The right
handpanelofFigure15showsthatEuropeisthedominantsourceofinvestmentincome
forUS-owned affiliates.Asmadevisible in the figure, the transatlantic relationship
dominatestheinvestmentearningsreportedforaffiliatesinChinaandJapan.Whilethe
EUisrelativelyopen(comparedtoChina,forexample),thelevelofUSMNEactivity

FDI Barriers
91
asmeasuredbytheincomeofUS-ownedaffiliatesinEurope,viewedinconjunction
withtheNTBpreferencemarginsinFigure13,againsuggestsubstantialpotentialfor
absolute gains to direct investment earnings from reductions in regulatory barriers
facingUSfirmsintheEU.
6.2 ImpactofNTBsonforeignaffiliates
Next, in order to take a closer look and estimate the potential impacts from NTB
reductions for FDI we employ gravity regressions. Our gravity model has been
estimatedusingaset-upthatallowsforpairwiseobservations,andalsoforobservations
wherethereisnoforeigninvestmentincomeorMNEs’activity(i.e.asocalledPoisson-
basedmaximumlikelihoodestimator).Whilewefocusontheresultsofthemodeling
hereinthetext,thederivationoftheexactspecificationoftheestimatingequationis
providedintheannex.TheresultingNTBcoefficientprovidesanestimateoftheimpact
ofchangesintheleveloftheNTBindexonthreeindictors:(1)thelevelofinvestment
income(theelasticityofFDIincomewithrespecttotheNTBindex);(2)thenumber
ofaffiliatesfromahomecountryinagivenhostcountry(theelasticityofnumberof
affiliateswithrespecttotheNTBindex);and(3)thenumberofaffiliateemployees(the
elasticityofnumberofaffiliateswithrespecttotheNTBindex).Table43belowreports
regressionresultsforourgravitymodelfor2007-2009foreachoftheseindicators.

Reducing Transatlantic Barriers to Trade and Investment – An Economic Assessment
92
Table 43 RegressionestimatesforNTMsandFDI
PoissonMLestimatesFDIincome Numberofenterprises Numberofemployees
logdistance -0.5381*** -0.9525*** -0.9773***-(0.0011) -(.0049) -(0.0006)
logNTBindexforFDI -0.5057*** -0.3463*** -0.3136***(basedonEUmargin) -(0.0034) -(0.0095) -(0.0039)logNetworkindex 0.2188*** 1.1177*** 0.6728*** (0.0154) (0.6058) (0.0065)Obs 11,140 8,304 7,253chi2,Pr>chi2 2.41e+06,0.00 1.81e+04,0.00 2.14e+07,0.00Pseudo-R2 .8915 .8969 .8945 conditionalfixedeffects
Standarderrorsinparentheses.***denotessignificantat1percentlevel.logNTBmarginisthedifferencebetweenintra-andextra-EUNTBindexesforfirmsoperatingintheEUwithEUMembersashostcountries,asdiscussedintheannex.LogNetworkindexisanindexofoverlappingtradenetworks.
Source data:EurostatandNTBsurveydata,UNCOMTRADEdata(fornetworkindex).Datacover2007-2009.
TheNTBcoefficientsinthetablecanbeinterpretedasfollows.TakingtheFDIincome
coefficientthefirstcolumnofresults,forevery10percentincreaseintheNTBindex
(forexampleanincreaseinrestrictivenessfrom20to22),weestimate,onaverage,a
reductioninobservedincomefromforeigninvestment(meaningthenetincomeearned
byaffiliatesand reportedasa returnon foreign investment in that samemarket),of
5.057percent.
What does this mean in practical terms? Consider the level of market access in
Figure12,andthelevelofEUinvestmentincomeinFigure15.Togetsomesenseof
magnitudes, letusassume,hypothetically, thatnegotiations lead toagain inmarket
accessfortheaffiliatesofEuropeanfirmsintheUS,suchthatEUfirmsfacealevel
ofaccessintheUSsimilartotheaccesstheyenjoywithintheEUitself.Intermsof
Figure12,thiswouldimplyadropintheNTBindexfrom24to18,whichcorresponds
toarelativedropinNTBlevelsasmeasuredbytheindexof25percent(areductionof
6outof24).TakingthischangeinNTBlevels,andapplyingtheelasticityinthefirst
columnofTable43toEUFDIincomefromUSoperationsin2007(€65,980billion),
thisimpliesagaininincomeforaffiliatesofEuropeanfirmsofroughly10.3billion

FDI Barriers
93
euros.21Of course, actual effectswill vary dependingon level of ambition, but this
providesaroughorderofmagnitudefora25percentreductioninUSFDIbarriers
againstEUfirms.Fromthesecondandthirdcolumnofresults,thisincreasedincome
wouldbeaccompaniedbymoreEuropeanaffiliatesintheUS,andanapproximate9.44
percentincreaseinemploymentofUSworkersbyEuropeanfirms.Onasimilarbasis,
therewouldbea10.85percentincreaseinemploymentofEUworkersbyUSfirms.22
21 Thisfollowsfromtakinglogdifferencesintheaverageindex(from24to18),andapplyingtheFDIincomeelasticityfromTable43withrespecttotheNTBindex:
exp[(ln(18)-ln(24))*-0.5381+ln(65,980)]-65,980=investmentincomechange.
22 This followsfromtaking logdifferences in theaverage index(from24 to18for theUS,25 to18 for theEU),andapplyingtheFDIemploymentelasticitywithrespecttotheNTBindex.


95
This study provides new estimates of the economy wide impact of removing both
tariffandnon-tariffbarrierstotransatlantictradebetweentheEUandtheUS.Several
scenariosareanalysedinthereport.Ontheonehandspecifictradeliberalisationwith
regards to tariffsonly, servicesonlyorprocurementonly isdiscussed.On theother
hand, theoptionofcomprehensive tradeand investment liberalisation isscrutinised.
ThefirstFTAscenario,amoderatelyambitiousFTAassumeda10percentreductionin
NTBs-relatedcostsandan“almostfull”eliminationoftariffs.Thesecond,ambitious
FTAscenarioassumestheeliminationof25percentofcostslinkedtoNTBstogether
withfulltariffelimination.
TheresultsindicatepositiveandsignificantgainsforboththeEUandtheUS.GDP
is estimated to increaseby68-119billion euros forEUand50-95billion euros for
the US (under the less ambitious and the ambitious FTA scenarios, respectively).
However,ifthetradeinitiativewouldbelimitedtotariffliberalisationonly,orservices
orprocurementliberalisationonly,theestimatedgainswouldbesignificantlylower.An
FTAlimitedtotariffliberalisationwouldleadto24billioneurosincreaseinGDPfor
theEUand9billioneurosincreasefortheUS.Thusimplementingacomprehensive
FTAwouldbringgreaterbenefitstobotheconomies.
AcoremessagefollowingfromourresultsisthatafocusonNTBsiscriticaltothelogic
oftransatlanticliberalization.Differentapproachestothesameregulatorychallenges
canhave theunintendedconsequenceof increasingcosts for firms,andsodragging
down labour productivity.Negotiation onNTBs provides the opportunity to pursue
amixofcross-recognitionand regulatoryconvergence to reduce thesebarriers.The
7. Conclusions
Reducing Transatlantic Barriers to Trade and Investment – An Economic Assessment
96
estimatesreportedherepointtosubstantialgains,ifreductionsinthecostsofNTBs
canbeachieved.Limitingtheexercisetotariffsalonewouldleadtopositiveeffects,but
thesewouldbemuchmorelimitedleavingahugepotentialforeconomicandwelfare
gainsuntapped.
Intermsoflabourmarketimpacts,wageeffectsareinlinewithchangesinoutputand
soareconsistentwithaninterpretationofgeneralcostsavingsthatleadtoproductivity
gains as firms operatewith lowerNTB-related costs for transatlantic commerce. It
shouldbestressedthatthemodelisalong-runmodel,wheresourcesofemploymentand
unemploymentare“structural.”Inthissense,changesinlabourdemandarecaptured
throughwagechanges (in thiscase risingwages) rather thanaggregateemployment
levels.Aswagesincreaseintheexperiments,thismeansarisingdemandforlabour.At
sectorlevel,roughly0.2to0.5percentoftheEUlabourforce(intermsofallocation
acrosssectors)isde-located.However,thisisdueto“pullfactors”asexpandingsectors
(likemotorvehiclesinthecaseoftheEU)hireworkersawayfromothersectors(like
metals).
Theimpactontherestoftheworldisestimatedtobepositiveandamountstoatotal
ofapproximately99billioneurosasanupperboundintheambitiousFTAscenario.
TheEUandUS,collectively,areahugeeconomicforce.Totheextentthattheycan
work together to better promote establishment and recognition in standards, reduce
regulatory divergence, andotherwise reduce the impact on rules and regulations on
thecostofbusiness,itislikelythatpartsofsuchaframework(forexamplerecognized
productorsafetystandards)willbeadoptedelsewhere,reducingtradecostsforthird
markets,whichiscapturedinthemodelbyintroducingspill-overstothesimulations.
To the extent the EU andUS together drive global standards, this has potential to
promoteeconomicgainsacrosstheglobe.
Dependingontheapproachfollowed,EU-UStradeliberalisationhasthepotentialto
makeapositivecontributionnotonlytothetransatlanticeconomybutalsototheglobal
economy.

97
Aguiar, Angel H., McDougall, Robert A., and Narayanan, G. Badri (ed.), (2012),
“Global Trade, Assistance, and Production: The GTAP 8 Data Base”,CenterforGlobal
TradeAnalysis,PurdueUniversity.
Anderson, J. E., J. H. Bergstrand, P. Egger and J. Francois (2008), “Non- Tariff
Barrier Study Methodology”backgroundpaperpreparedforEcorysreport“Non-Tariff
Measures in EU-US Trade and Investment – An Economic Analysis.”
BaldwinR.E.andJ.Francois(1999),“IsittimeforaTRAMP?Quantitativeperspectives
ontransatlanticliberalization”,inO.G.MayerandH.E.Scharrer,eds.,“Transatlantic
Relations in a Global Economy”,Hamburg:NomosVerlagsgesellschaft,1999.
Baldwin R.E. and J. Francois (1997a), “Transatlantic Trade Liberalization--A
Computable General Equilibrium Analysis”,areportfortheUnitedKingdomForeign
andCommonwealthOffice.
BaldwinR.E.andJ.Francois(1997b),“PreferentialTradeLiberalizationintheNorth
Atlantic”,RichardBaldwinandJosephFrancois,CEPRDiscussionPaper1611.
Copenhagen Economics (2009), “Assessment of Barriers to Trade and Investment
Between the EU and Japan”,(TRADE/07/A2).ReportpreparedbyJ.F.Francois,E.R.
Sunesen,andM.H.ThelleforEuropeanCommission,Directorate-GeneralforTrade,
Reference:OJ2007/S180-219493.
8. References

Reducing Transatlantic Barriers to Trade and Investment – An Economic Assessment
98
Copenhagen Economics (2012), “EU-China Investment Study”, (TRADE/07/A2).
Report prepared by J.F. Francois, E.R. Sunesen, and M.H. Thelle for European
Commission,Directorate-GeneralforTrade.
Ecorys(2009),“Non-Tariff Measures in EU-US Trade and Investment – An Economic
Analysis”.ReportpreparedbyK.Berden,J.F.Francois,S.Tamminen,M.Thelle,andP.
WymengafortheEuropeanCommission,ReferenceOJ2007/S180-219493.
European Commission and ForeignAffairs and InternationalTrade Canada (2008),
“Assessing the Costs and Benefits of a Closer EU-Canada Economic Partnership.”
Jointreport,BrusselsandOttawa.
Francois, J.F. (1999), “Economic Effects of a New WTO Agreement Under the
Millennium Round”,reporttotheEuropeanCommissionTradeDirectorate.
Francois,J.F.(2001),“The Next WTO Round: North-South stakes in new market access
negotiations”, Centre for International Economic Studies,Adelaide, ISBN 0-86396
474-5.
Francois, J. F. (1998), “Scale Economies and Imperfect Competition in the GTAP
Model”,GTAPTechnicalPaperNo14.
Francois, J.F. and D.W. Roland-Holst (1997), “Scale economies and imperfect
competition”, inFrancois, J.F. andK.A.Reinert, eds. (1997), “Applied methods for
trade policy analysis: a handbook”,CambridgeUniversityPress:NewYork.
Francois,JosephandMcDonald,Brad(1996),“Liberalization and Capital Accumulation
in the GTAP Model”.GTAPTechnicalpaperNo:07,CenterforGlobalTradeAnalysis,
PurdueUniversity.
Francois, J.F. (2004), “Assessing the Impact ofTradePolicyonLaborMarkets and
Production”,Economie International.

References
99
Francois,J.F.,M.JansenandR.Peters,inM.JansenandR.Peterseds(2012),“Trade
AdjustmentCostsAndAssistance:“LabourMarketDynamics”,Trade and Employment:
From Myths to Facts,ILO:Geneva
Francois, J.F., H. van Meijl and F. van Tongeren (2005), “The Doha Round and
DevelopingCountries”,Economic Policy.
Francois, J.F.,M.MiriamandW.Martin (2012),“MarketStructure inCGEModels
ofInternationalTrade”,inP.DixonandD.Jorgenson,eds.,Handbook of Computable
General Equilibrium Modeling,1stEdition,Elsevier:Amsterdam.
Hertel, T.W., E. Ianchovichina, and B.J.McDonald (1997), “Multi-Region General
EquilibriumModeling”,Chapter 9 in J.F. Francois andK.A.Reinert, eds, “Applied
Methods for Trade Policy Analysis: a Handbook”, Cambridge University Press:
Cambridge.
Hertel, T.W., (ed.) (1997), “Global Trade Analysis: Modeling and Applications”,
Cambridge:CambridgeUniversityPress.
Kox,H.andA.Lejour(2006),“Regulatoryheterogeneityasobstacleforinternational
servicestrade”CPBdiscussionpaper49,theHague.
McDougall,R.M.(2002),“ANewRegionalHouseholdDemandSystemforGTAP”.
GTAPTechnicalPaperNo.20.
Narayanan,B.N.,Hertel,T.W.,andHorridge,M.,(2010),“LinkingPartialandGeneral
EquilibriumModels:AGTAPApplicationUsingTASTE”,GTAPTechnicalPaperNo
29.
Narayanan,G.Badri.,Hertel,ThomasW.andHorridge,J.Mark(2010),“Disaggregated
DataandTradePolicyAnalysis:TheValueofLinkingPartialandGeneralEquilibrium
Models”,Economic Modelling,27(3):755-66.

Reducing Transatlantic Barriers to Trade and Investment – An Economic Assessment
100
Nicoletti,Giuseppe,StephenGolub,DanaHajkova,DanielMirzaandKwang-Yeoul
Yoo (2003), “Policies and international integration: influences on trade and foreign
directinvestment”,OECDEconomicsDepartmentWorkingPapers,No.359.
Rutherford,T.andS.Paltsev(2000),“GTAPinGAMSandGTAP-EG:GlobalDatasets
for Economic Research and IllustrativeModels”, University of Colorado: Boulder,
workingpaper.

Annexes


103
Table A1 MappingofModelSectorstoGTAP
No.GTAPSector
ModelSector No.GTAPSector
ModelSector
1 pdr 1Agrforestryfisheries 30 lum 10Woodandpaperproducts2 wht 1Agrforestryfisheries 31 ppp 10Woodandpaperproducts3 gro 1Agrforestryfisheries 32 p_c 4Chemicals4 v_f 1Agrforestryfisheries 33 crp 4Chemicals5 osd 1Agrforestryfisheries 34 nmm 11Othermanufactures6 c_b 1Agrforestryfisheries 35 i_s 9Metalsandmetalproducts7 pfb 1Agrforestryfisheries 36 nfm 9Metalsandmetalproducts8 ocr 1Agrforestryfisheries 37 fmp 9Metalsandmetalproducts9 ctl 1Agrforestryfisheries 38 mvh 6Motorvehicles10 oap 1Agrforestryfisheries 39 otn 7Othertransportequipment11 rmk 1Agrforestryfisheries 40 ele 5Electricalmachinery12 wol 1Agrforestryfisheries 41 ome 8Othermachinery13 frs 1Agrforestryfisheries 42 omf 11Othermanufactures14 fsh 1Agrforestryfisheries 43 ely 20Otherservices15 coa 2Otherprimarysectors 44 gdt 20Otherservices16 oil 2Otherprimarysectors 45 wtr 20Otherservices17 gas 2Otherprimarysectors 46 cns 18Construction18 omn 2Otherprimarysectors 47 trd 20Otherservices19 cmt 3Processedfoods 48 otp 20Otherservices20 omt 3Processedfoods 49 wtp 12WaterTransport21 vol 3Processedfoods 50 atp 13AirTransport22 mil 3Processedfoods 51 cmn 17Communications23 pcr 3Processedfoods 52 ofi 14Finance24 sgr 3Processedfoods 53 isr 15Insurance25 ofd 3Processedfoods 54 obs 16Businessservices26 b_t 3Processedfoods 55 ros 19Personalservices27 tex 11Othermanufactures 56 osg 20Otherservices28 wap 11Othermanufactures 57 dwe 20Otherservices29 lea 11Othermanufactures
Annex 1: Mapping of model sectors

Reducing Transatlantic Barriers to Trade and Investment – An Economic Assessment
104
Table A2 MappingofModelSectorstoISICrev3.1
ModelSector ISICSectors1Agrforestryfisheries ISIC01-052Otherprimarysectors ISIC10-143Processedfoods ISIC15-164Chemicals ISIC24-255Electricalmachinery ISIC30-326Motorvehicles ISIC347Othertransportequipment ISIC358Othermachinery ISIC29,31,339Metalsandmetalproducts ISIC27-2810Woodandpaperproducts ISIC20-2211Othermanufacturing ISIC15-37,allremaining12Watertransport ISIC6113Airtransport ISIC6214Finance ISIC65,6715Insurance ISIC6616Businessservices ISIC70-7417Communications ISIC6418Construction ISIC4519Personalservices ISIC91-9320Otherservices ISIC40,41,50,51,52,63,75,80,85,90

105
In the computational model, the ”whole” economy, for the relevant aggregation of
economicagents,ismodelledsimultaneously.Thismeansthattheentireeconomyis
classified intoproductionandconsumptionsectors.Thesesectorsare thenmodelled
collectively. Production sectors are explicitly linked together in value-added chains
from primary goods, through higher stages of processing, to the final assembly of
consumptiongoodsforhouseholdsandgovernments.Theselinksspanbordersaswell
asindustries.Thelinkbetweensectorsisbothdirect,suchastheinputofsteelintothe
productionoftransportequipment,andalsoindirect,aswiththelinkbetweenchemicals
andagriculture through theproductionof fertilizers andpesticides.Sectors are also
linkedthroughtheircompetitionforresourcesinprimaryfactormarkets(capital,labour,
andland).ThedatastructureofthemodelfollowstheGTAPdatabasestructure,and
basicmodelsofthisclassareimplementedineitherGEMPACKorGAMS(Herteletal
1997,RutherfordandPaltsev2000).WeworkherewithaGEMPACKimplementation.
Production
Westartherewitharepresentativeproductiontechnologyusingabasic,constantreturns
toscalespecification.Wherewehavescaleeconomies,thisservesasthecoststructure
forcompositeinputbundles.Assumethatoutputq jinsectorjcanbeproducedwitha
combinationofintermediateinputsz jandvalueaddedservices(capital,labour,land,
etc.)va j.This is formalized inequation1.Assuminghomotheticcost functionsand
separability,wecandefinethecostofarepresentativebundleofintermediateinputsz j
forthefirmproducingq jandsimilarlythecostofarepresentativebundleva jofvalue
Annex 2: CGE model technical overview

Reducing Transatlantic Barriers to Trade and Investment – An Economic Assessment
106
addedservices.Theseareshowninequations2and3.Theydependonthevectorof
compositegoodspricesP~andprimaryfactorpricesw.Unitcostsforq thendepend
onthemixoftechnologyandpricesembodiedinequations1,2,3.Werepresentthisin
equation4,whichdefinesunitcostz j.Intheabsenceoftaxes,incompetitivesectorsz j
representsbothmarginalcostandprice.Ontheotherhand,withimperfectcompetition
on the output side (discussed explicitly later) z j can be viewed as measuring the
marginal cost side of the optimalmarkup equation,withmarkups driving awedge
betweenz jandPj.
To combine production technologies with data, we need to move from general to
specificfunctionalforms.WeemployanestedCESfunction,withaCESrepresentation
ofvalueaddedactivitiesva j,aCESrepresentationofacompositeintermediatez jmade
upofintermediateinputs,andanupperCESnestthatthencombinesthesetoyieldthe
finalgoodqj.Ourset-upisillustratedinFigure2below,ontheassumptionwehavei
primaryfactorsv,aswellasnproductionsectorsthatcanberepresentedintermsof
compositegoodsq~asdefinedbelow.
Figure 3 Representativenestedproductiontechnology
qj : ψj
va j : σ j
. . . v i,jv1,j
z j : φ j
. . . q̃n,jq̃2,jq̃1,j
These composites may (or may not, depending on the goods involved) be used as
intermediateinputs.InFigure2,wehavealsoshowntheCESsubstitutionelasticityfor
intermediateinputsf,thesubstitutionelasticityforvalueaddeds,andthesubstitution
elasticityforour”uppernest”aggregationofvalueaddedandintermediates,y.Inthe
absenceoftaxes,totalvalueaddedYwillbethesumofprimaryfactorincome,asin
equation5.

Annex 2: CGE model technical overview
107
GivenourassumptionofCEStechnologies,wecanrepresentvalueaddedinsectorjas
afunctionofprimaryinputsandtheelasticityofsubstitutioninvalueaddeds j.This
yieldsequation6,anditsassociatedCESpriceindexshowninequation7.Similarly,
wecanspecifytheCESpriceindexforcompositeintermediates,asinequation7.This
givesusequation8,wherethecoefficientf j istheelasticityofsubstitutionbetween
intermediate inputs.This is assumed to beLeontief (i.e.f j = 0). Finally, following
Figure2,wewillalsospecifyanaggregationfunctionforvalueaddedandintermediate
inputs,intermsofitsCESpriceindex.Thisisshownasequation9.Fromthefirstorder
conditionsforminimizingthecostofproduction,wecanmaptheallocationofprimary
factors to the levelofvalueaddedacrosssectors.This is formalized inequation10.
Wecanalsospecifythetotaldemandforcompositeintermediategoodsacrosssectors
q~int,i
asafunctionoftheproducerpricePz jofcompositeinputpriceineachsector,
thescaleofintermediatedemandacrosssectorsz j,andpricesofcompositegoodsP~
i.
Thisisshowninequation11.WiththeuppernestCESforgoodswecanalsomapvalue
addedva jandintermediatedemandz jintermsofequations7and8,outputq jandthe
elasticityofsubstitutiony jbetweeninputsandvalueadded.Thisyieldsequations12
and13,wherethetermsgaretheCESweights(similartothoseinequation6)whiley j
istheuppernestelasticityofsubstitutionintheproductionfunction.
We also model some sectors as being characterized by large group monopolistic
competition.Inreducedform,thiscanberepresentedbyanindustrylevelscaleeconomy
thatreflectsvarietyeffects.Wedefinethepriceofoutputatindustrylevelasinequation
14. In thiscase,z j isdefinedbyequation9and represents thepriceofabundleof
inputs, and equation14 followsdirectly fromaverage cost pricing, homothetic cost
functions,andDixit-Stiglitztypemonopolisticcompetition.(SeeFrancoisandRoland-
Holst1997,Francois1998,andFrancois,vanMeijl,andvanTongeren2005,Francois,
ManchinandMartin2012,forexplicitderivations.)
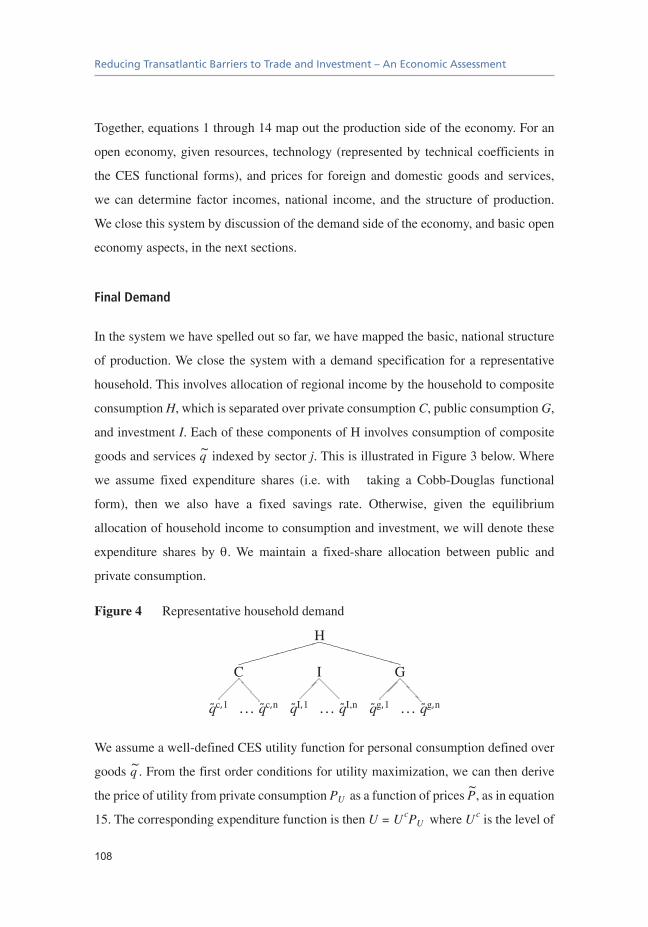
Reducing Transatlantic Barriers to Trade and Investment – An Economic Assessment
108
Together,equations1through14mapouttheproductionsideoftheeconomy.Foran
openeconomy,given resources, technology(representedby technicalcoefficients in
theCESfunctional forms),andprices for foreignanddomesticgoodsandservices,
we candetermine factor incomes, national income, and the structure of production.
Weclosethissystembydiscussionofthedemandsideoftheeconomy,andbasicopen
economyaspects,inthenextsections.
Final Demand
Inthesystemwehavespelledoutsofar,wehavemappedthebasic,nationalstructure
ofproduction.Weclose thesystemwithademandspecificationfora representative
household.Thisinvolvesallocationofregionalincomebythehouseholdtocomposite
consumptionH,whichisseparatedoverprivateconsumptionC,publicconsumptionG,
andinvestmentI.EachofthesecomponentsofHinvolvesconsumptionofcomposite
goodsandservicesq~indexedbysectorj.ThisisillustratedinFigure3below.Where
we assume fixed expenditure shares (i.e. with taking a Cobb-Douglas functional
form), then we also have a fixed savings rate. Otherwise, given the equilibrium
allocationofhouseholdincometoconsumptionandinvestment,wewilldenotethese
expenditure shares by q.We maintain a fixed-share allocation between public and
privateconsumption.
Figure 4 Representativehouseholddemand
H
G
. . . q̃g,nq̃g,1
I
. . . q̃I,nq̃I,1
C
. . . q̃c,nq̃c,1
Weassumeawell-definedCESutilityfunctionforpersonalconsumptiondefinedover
goodsq~.Fromthefirstorderconditionsforutilitymaximization,wecanthenderive
thepriceofutilityfromprivateconsumptionPUasafunctionofpricesP~,asinequation
15.ThecorrespondingexpenditurefunctionisthenU = UcPUwhereUcisthelevelof

Annex 2: CGE model technical overview
109
utilityfromprivateconsumption.Takingnationalincomeasourbudgetconstraint,then
combiningequation5withtheexpenditurefunctionyieldsequation16.From16,wecan
defineUcfromtheexpenditurefunctionandincome,asinequation17.Consumption
quantities,intermsofcompositegoods,canberecoveredfromequation17,asshown
inequation18.Likeprivateconsumption,thepublicsectorisalsomodelledwithaCES
demandfunctionoverpublicsectorconsumption.This impliesequations19-22.For
investmentdemand,intheshortrun,weassumeafixedsavingsrate.Inthelong-run,
themodelcanalternativelyincorporateafixedsavingsrate,oraratethatadjuststomeet
steadystateconditionsinabasicRamseystructurewithconstantrelativeriskaversion
(CRRA)preferences.Weemploy theCRRAversionhere. (Francois,McDonaldand
Nordstrom1996).Withfixedsavings,andassumingaLeontiefcompositeofinvestment
goods thatmakeup the regional investmentgood, investmentdemand isdefinedby
equation23.WithCRRApreferences,steady-stateconditionsimpliesequation24as
well,relatedtothepriceofcapitalwk.Where24holds,theadditionalequationallowsus
tomakethesavingsratecoefficientq Iendogenous.Inequation24ρistherateoftime
discountandδistherateofdepreciation.Withashort-runorstaticclosure,investment
demandmeansweapplyequation23.Withalong-runclosure,wealsoapplyequation
25.Whenwe imposeCRRApreferences in the long-run,we then employ all three
equationsonthemodel23-25,andsavingsratesareendogenous.Withafixedsavings
rate,wedropequation24andmakeq Iexogenous.
Cross-border linkages and taxes
Finally,individualcountries,asdescribedbyequations1-25above,arelinkedthrough
cross border trade and investment flows.With either monopolistic competition or
Armingtonpreferences,wecandefineaCEScompositegoodq~ in termsof foreign
anddomesticgoods.Thepriceindexforthiscompositegoodisdefinedbyequation
26.Givenequation26andtheenvelopetheorem,wecandefinedomesticabsorptionD
asinequation27,wherehindexeshomepricesandquantities.Thedifferencebetween
production qj and domestic absorptionDj in equilibrium will be imports (where a

Reducing Transatlantic Barriers to Trade and Investment – An Economic Assessment
110
negativevaluedenotesexports),asinequation28.Acrossallcountriesindexedbyr,
wealsohaveaglobalbalanced trade requirement, shown in equation29.Similarly,
balancingtheglobalcapitalaccountalsorequiresequations30and31(wherewenow
indexsourcerandhomedestinationh).
TradingcostsaremodelledasinEcorys(2009),andbenchmarkvaluesforNTBscome
fromthissource.Informationontheextenttowhichpoliciesaffectpricesandcostsis
importantforaccuratemodellingofpolicyreforms,includingwhetherpoliciescreate
”rents” as opposed to being resource-using (generating ”waste”), and the identity
(ownership)oftheentitiesandgroupstowhomanyrentsaccrue.Thisisawell-known
issuethatcanhaveamajorbearingonthemagnitudeofthewelfareimpactsofpolicies
andpolicyreforms.Forexample,ifapolicygeneratesrentsfordomesticgroupsand
liberalizationresults inashareof these rentsaccruing to foreignentrants, the result
may be lower national welfare. Recent work supported by the EC (Ecorys 2009,
CopenhagenEconomics2009)hasbeenfocusedexplicitlyonthisdistinction,andthe
resultsofthisanalysisfeedintotheestimatedreportedinthisstudy.Intheestimates
below,wedistinguishbetweencostandrentgenerationunderNTBson thebasisof
Ecorys(2009),assuming2/3ofrentsaccruetoimporterinterests,and1/3toexporter
interests.Rentsaremodelled,ineffect,likeexportandimporttaxes.Forcost-raising
barriers,we follow thenowstandardapproach tomodelling icebergordead-weight
trade costs in theGTAP framework, originally developedbyFrancois (1999, 2001)
withsupport fromtheECtostudy theMillenniumRound(nowknownas theDoha
Round).This approachhasgrown fromanextension in early applications to anow
standardfeatureoftheGTAPmodel,followingHertel,WalmsleyandItakura’s(2001)
integrationoftheFrancoisapproachintothestandardGTSPmodel.Ithasfeaturedin
the jointEC-CanadiangovernmentstudyonaEU-CanadaFTA,aswellas the2009
EcorysstudyonEU-USnon-tariffbarriers.Informalterms,changesinthevalueofthis
technicalcoefficientcapturetheimpactofnon-tariffmeasuresonthepriceofimports
fromaparticularexporterduetodestination-specificreducedcostsforproductionand

Annex 2: CGE model technical overview
111
delivery.ThishasbeenfurthermodifiedtosplitNTBwedgesintothoselinkedtocosts
andthosethatgeneratefromrents.
Thebasicsystemoutlinedaboveprovidesthecoreproductionanddemandstructureof
eachregion,aswellasthebasicrequirementsforbilateralimportdemand,globalmarket
clearingfor tradedgoodsandservices,andglobalcapitalaccountbalancing.Within
thisbasicstructure,wealsointroducetaxes,transportservices,iceberg(deadweight)
non-tariffbarriers,andrent-generatingnon-tariffbarriers.Thesedriveawedgebetween
theex-factorypriceoriginatingincountryrandthelandedpricesincountryhinclusive
ofdutiesandtransportcosts.Taxesandrent-generatingtradecostsmeanthatYisalso
inclusiveoftaxrevenuesandrents.Intheshort-runwefixB,whileinthelong-runthis
isendogenous(suchthatthedistributionofrelativeglobalreturnsismaintained).All
ofthisaddsadditionalcomplexitytothesystemoutlinedabove,butthecorestructure
remainsthesame.
Macroeconomic Projections
Themacroeconomicprojectionsdiscussedinthecoretextandusedtobenchmarkthe
modelto2027aresummarizedinthetablebelow.
Table A3 AnnualizedGDPgrowthrates
2001-2007 2007-2016 2007-2027EuropeanUnion 2.28 0.70 1.17USA 3.30 1.74 1.90OtherOECD 2.54 1.84 2.02EasternEurope 6.55 2.03 3.20Mediterranean 4.98 3.55 3.93China 11.21 9.06 8.24India 7.91 7.53 6.19ASEAN 5.70 5.01 5.19MERCOSUR 4.28 3.86 3.97LowIncome 5.94 5.43 5.56RestofWorld 6.12 3.81 4.41
Note:2007-2027areusedforprojections

Reducing Transatlantic Barriers to Trade and Investment – An Economic Assessment
112
Assessment of a Reduction of Barriers to Trade and Investment between the EU and the US
101
qj = f j�zj , vaj
�(1)
Pz = g⇣P̃
⌘(2)
Pva = h (⌦)(3)⇧j = c (Pz, Pva)(4)
Y =X
i
⌦ivi(5)
vaj =
"X
i
αijv⇥j1
⇥j
ij
# 1
⇥j1
(6)
Pvj =
"X
i
α⇥j
ij ⌦1−⇥j
i
# 1
1⇥j
(7)
Pzj =
"X
i
⇥⇤j
ij P̃ 1−⇤j
i
# 1
1⇤j
(8)
Pj =⇣⇤⌅j
vj P 1−⌅j
vaj + ⇤⌅j
zj P 1−⌅j
zj
⌘ 1
1⌅j(9)
vi ≥X
j
vaj
✓αvj
⌦i
◆⇥j
Pvaj(10)
q̃int,i =X
j
zj
✓⇥ij
P̃i
◆⇤j
Pzj(11)
vaj = qj
✓⇤vi
Pvj
◆⌅j
Pj(12)
z̄j = qj
✓⇤zi
Pzj
◆⌅j
Pj(13)
Pj = q⌅j
⇣⇤⌅j
vj P 1−⌅j
vaj + ⇤⌅j
zj P 1−⌅j
zj
⌘ 1
1⌅j(14)
where 1 > > 0
PUc =
nX
i=1
αηc
c,iP̃1−ηc
i
! 11ηc
(15)
where 0 <⌃c − 1
⌃c< 1
U c
nX
i=1
αηc
c,iP̃1−ηc
i
! 11ηc
= Y ⌥c(16)
U c =
nX
i=1
αηc
c,iP̃1−ηc
i
! 1ηc1
Y ⌥c(17)
q̃c,i = U cP ηc
Ucαηc
c,iP̃−ηc
i(18)
PUg =
nX
i=1
αηg
g,iP̃1−ηg
i
! 11ηg
(19)
where 0 <⌃g − 1
⌃g< 1
Ug
nX
i=1
αηg
g,iP̃1−ηg
i
! 11ηg
= Y ⌥g(20)
Ug =
nX
i=1
αηg
g,iP̃1−ηg
i
! 1ηg1
Y ⌥g(21)
q̃g,i = U cP ηg
Ucαηg
g,iP̃−ηg
i(22)0
@nX
j=1
αI,jP̃j
1
A = Y ⌥I(23)
⌦k = P c (ρ + ⌅)(24)dK/K = dI/I(25)
P̃j =
RX
r=1
bsj
r,jP1−sj
r,j
! 1
1sj
(26)
where 0 <sj − 1
sj< 1
Dj =�q̃c,j + q̃I,j + q̃g,j + q̃int,i
�P̃ s
j bsh,jP
−sh,j(27)
Mj = Dj − qj(28)
rrX
r=1
Mr,j
!= 0(29)
0
@X
j
X
r 6=h
Pr,jMr,h,j
1
A = Bh(30)
X
r
Br
!= 0(31)
5

113
Table A4 HS-2Classification,top2percentoftarifflines
HS-2 descriptionshareoflines
totalshare tariffrate
U.S.top2percentoftarifflines 24 Tobaccoandmanufacturedtobaccosubstitutes 0.383 0.383 43.223 Residues&wastefromthefoodindust;preprani 0.172 0.554 23.24 Dairyprod;birds’eggs;naturalhoney;ediblepr 2.160 2.714 17.9
EUtop2percentoftarifflines23 Residues&wastefromthefoodindust;preprani 0.531 0.531 71.02 Meatandediblemeatoffal 1.033 1.563 46.64 Dairyprod;birds’eggs;naturalhoney;ediblepr 1.353 2.916 46.3
Annex 3: High tariff sectors, ranked by HS2 applied tariff rates


115
Inthisannex,weprovidetheanalyticalderivationsbehindtheestimatingequationfor
foreign investment income inChapter 6. We startwith the basic gravitymodel in
equation (1), focusingon the first specificationwhere thevalueof sales/turnoverof
MNEs from source country i in host country j, represented asvi,j , is specified as a
functionofsourcecountryvariablesS,hostcountryvariablesX,andbilateralvariables
Z.
vi , j ,t = sSs,i ,ts
+ hXh, j ,th
+ kZi , j ,tk
(1)
Notethatwecangroupthesource-specificandhost-specificvariablesandrepresent
themwithexporterandimporterfixedeffects. Thisleavesuswithfixedeffectsand
pairwisevariablesZasinequation(2).
vi , j = sSs,is
FDI source fixed effect
+ hXh, jh
FDI host fixed effect
+ kZi , jk
pairwise variables
(2)
Togofurther,weassumethatthesetofpairwisevariablesincludestheeffectofnon-
tariffmeasures.NTMsarerepresentedbytheindexINTMwithcorrespondingcoefficient
gNTM. WhileNTMsmayvarybetween source andhost, as in the left hand sideof
equation(3),wecanre-writethisasafunctionofaverageNTMsandthedifference
betweenaverageandpair-wiseNTMs.Thisistherighthandsideofequation(3).
NTM ln INTM( )i , j= NTM ln INTM( )
j+ ln INTM( )
i , jln INTM( )
j( )(3)
Next,wesubstituteequation(3)intoequation(2),whichyieldsequation(4)below.
Annex 4: Derivation of foreign investment income equation

Reducing Transatlantic Barriers to Trade and Investment – An Economic Assessment
116
vi , j = sSs,is
FDI source fixed effect
+ h Xh, j + NTM ln INTM( )j
h
FDI hostfixed effect
+ kZi , jk
+ NTM ln INTM( )i , j
ln INTM( )j( )
pairwise variables
(4)
Finally,weassumeaverageNTMlevelsapply inmostcases,exceptwherewehave
estimatestothecontraryforintra-EUFDI.Inparticular,fromtheNTMsurveydata
forFDI,wehaveestimatesoftheterm NTM ln INTM( )i , j
ln INTM( )j( ) forFDINTMsapplied
betweenEUMemberstates,intermsofthedifferencefromaveragelevelsappliedto
thirdcountries.Thismeansourfinalregressionequationtakestheform:
vi , j = Si
FDI source fised effect
+ X j
FDI hostfixed effect
+ kZi , jk
+ NTM ln INTM( )i , j
ln INTM( )j( )
pairwise variables
(5)
Under this specification, and with the assumption that third-country j NTMs can
be represented by the average level in equations (3) and (4) (so that in general
NTM ln INTM( )i , j
ln INTM( )j( ) = 0 when j≠ EUMember) we use intra-EU variation from
NTMsappliedbyEUMemberStatesagainstthirdcountries,inequation(5),toestimate
theNTMcoefficientgNTM.