Embed Size (px)
Citation preview

11
Reducing the Energy Consumption ofNetworked Devices
IEEE 802.3 tutorial – July 19, 2005 (San Francisco)
Ken ChristensenComputer Science and Engineering
University of South FloridaTampa, FL 33620
Bruce NordmanEnergy Analysis
Lawrence Berkeley National LaboratoryBerkeley, CA [email protected]
7/15

22
Acknowledgement
We would like to thank Bob Grow for inviting us
We hope that you will get useful informationfrom this tutorial

33
Topics
Energy use by IT equipment
Overview of power management
Reducing network induced energy use
Reducing network direct energy use
Potential energy savings
Summary and next steps
Part 1
Part 2
Part 3
Part 4
Part 5
Part 6

44
Background - Key Terms
Networked Device
An electronic product with digital network connection, either apiece of network equipment or end use device.
Network Equipment
Products whose only function is to enable networkcommunications (Switches, routers, firewalls, modems, etc.)
Energy
Direct electricity consumed by electronic devices. Does notinclude extra space conditioning energy, UPS, etc.
All $ figures based on $0.08/kWh• 1 TWh = $80 million• $1 billion = 12.5 TWh• 1 W/year = 70 cents

55
Energy use by IT equipment
Welcome to Part #1
In this part…the energy consumption of IT generally and PCs specifically.

66
Current IT energy use: All IT equipment
“Big IT” – all electronics PCs/etc., consumer electronics, telephony
• Residential, commercial, industrial
200 TWh/year
$16 billion/year
Nearly 150 million tons
of CO2 per year
One central baseloadpower plant(about 7 TWh/yr)
PCs and etc. already digitallynetworked — Consumer Electronics (CE) will be soon

77
Current IT energy use: All IT equipment continued
“ Little IT” — office equipment, telecom, data centers 97 TWh/year (2000) [Roth] — 3% of national electricity;
9% of commercial building electricity
Chart figures in TWh/year
Commercial buildings only

88
Current IT Energy Use: Huber / Mills “Analysis”
1999: Forbes, Dig more coal -- the PCs are coming Claim: “Internet” electricity 8% in 1998 and growing
to 50% over 10 years
Year: ‘89 ‘90 ‘90 ‘98 ‘99 ‘00 ‘00
Huber/Mills compared to other studies
Shown to be not credible

99
PC energy use
PCs
Computing box only — not including displays
PCs: 31 TWh/year (2000) $2.4 billion/year
Servers: 12 TWh/year (2002)
PC energy use could be 46 TWh/year by nowand is rising steadily
$3.7 billion/year

1010
PC energy use: 24/7 PC example
Bruce’s home PC and display*
Display can power manage – On 20 hours/week; Sleep 148
Computer can’t (and stay on network) – On 168 hours/week
Annual consumption 540 kWh/year ~$70/year
2 2 17 Display 6.0 W 7.5 W 57.5 W Computer
OffSleepOn
16% of current annual electricity bill
* Bruce doesn’t leave the PC on 24/7
1111
Active use is a small part of week Energy use is not closely related to activity
Most commercial PCs are on continuously Increasingly true for residential PCs Most of time, highly powered but doing little or no work
PC energy use: How PCs use energy
Savings opportunity!

1212
PC energy use: Factors
Annual PC energy consumption is a function of
Power levels — in each major operating mode Usage patterns — % of year by mode
Unit annual energy use The stock of PCs
National energy use
All factors vary with
Residential vs. commercial Now vs. future Desktop vs. notebook
Many figures here are not well known,but conclusions do not rely on precision

1313
PC energy use: Structure
Typical Commercial PC Annual Energy Use
Pon >> Psleep
Psleep = Poff ~
Consumption is driven by on-times, not by usage

1414
PC energy use: Numbers
Power levels 70 W in On (notebooks 20); 5 W in Sleep; 2 W in Off
Usage
Most home PCs in homes with >1 PC Home broadband penetration rising (~50%)
> 50% on 24/7
Stock Roughly 100 million each residential and commercial
46 TWh/year
~10% ?~20% (2001) and rising*Residential6%About 2/3 (2003)Commercial
% SleepingPortion of Stock “Continuous On”
* Half of these on 40-167 hours/week

1515
PC energy use: “Waste” / Savings opportunity
Most of time when idle, could be asleep;PC savings potential is most of current consumption

1616
EPA Energy Star program
1992 — Began with PC and monitor power mgmt. Capability to PM; sleep/off levels
1999 — Reduced power levels; addressed network connectivity
Current specification revision process Power supply efficiency Limits on system “idle” power Network connectivity in Sleep
Could play a key role in reducing energy usefrom networks

1717
Network equipment energy use
pp. 19-26
At SIGCOMM 2003…

1818
Network equipment energy use continued
Switches, Hubs, Routers (commercial sector only)
6.05 TWh/year — 2000 [Singh] ~$500 million/year
Telecom equipment (mobile, local, long distance, PBX)
6.1 TWh/year — 2000 [Roth] ~$500 million/year
NICs alone — Quick Estimate
300 million products with NICs; NIC at both ends 1 W per NIC; Continuous use
600 MW NIC power; 5.3 TWh/year > $400 million/year

1919
Network direct and induced energy use
Network Direct NICs Network Products
• Switches, Routers, BroadbandModems, Wireless Access Points, …
Network Induced Increment for higher power state
of devices needed to maintainnetwork connectivity (usually Oninstead of Sleep or Off)
Common causes:• Can’t maintain needed connectivity• Too cumbersome to set up or use
Product(e.g. PC)
Network Int.
NetworkProduct

2020
IT from an energy perspective
IT in general, and PCs in particular Consume a lot of power Consumption is increasing Many inefficiencies that can be removed (savings
opportunities) Networks increase consumption — direct and induced
Energy for “traditional” uses is declining Heating, cooling, lighting, appliances
Electronics and Miscellaneous are rising Absolute and % of total Only now getting attention from energy community
Needs attention from the networking community!

2121
Overview of power management
Welcome to Part #2
In this part… an overview of power management,wake on LAN, and current technology directions.

2222
Power and energy
Some quick definitions…
Power is W = V x A• For DC this is correct, for AC we have a power factor
Energy is Wh = Power x Time
Consumed energy produces useful work and heat Silicon has an operational heat limit – too hot and it fails Generated heat must be removed via cooling
• Cooling is needed within the PC and also within the room
For mobile devices, energy use is a critical constraint Battery lifetime is limited

2323
Power and energy continued
In a clocked CMOS chip…
Power is (to a first order) ACV2f• A is activity factor and C is capacitance• Power is proportional to the square of voltage
V is linear with f• We can scale frequency (and voltage) to reduce power• Power (P) is thus proportional to the cube of frequency
P = Pfixed + c*f3
Where Pfixed is the fixed power (not frequency dependent)and c is a constant (which comes from A and C above)

2424
Power and performance
Key performance metrics for IT services…
Response time for a request
Throughput of jobs
We have a trade-off…
Reducing power use may increase response time
Trade-off is in energy used versus performance
A response time faster than “fast enough” is wasteful
Mean and 99 percentile

2525
Power and utilization
Power use should be proportional to utilization But it rarely is!
0% 100%Utilization
Max
0
Power
Good
ActualThe goal is toachieve atleast linear
Best?

2626
Basic principles of power management
To save energy we can: Use more efficient chips and components Better power manage components and systems
To power manage we have three methods:
Do less work (processing, transmission) - Transmitting is very expensive in wireless
Slow down - Process no faster than needed (be deadline driven)
Turn-off “stuff” not being used - Within a chip (e.g., floating point unit) - Within a component (e.g., disk drive) - Within a system (e.g., server in a cluster)

2727
Basic principles of power management continued
Time scales of idle periods
Nanoseconds – processor instructions
Microseconds – interpacket
Milliseconds – interpacket and interburst
Seconds – flows (e.g., TCP connections)
Hours – system use

2828
Basic principles of power management continued
The key challenges for power management are:
Predicting, controlling, and making the best use of idle times
Increasing the predictability of idle times
Creating added idle time by bunching and/or eliminating processing and transmission

2929
Power management in PCs
PCs support power management For conserving batteries in mobile systems For energy conservation (EPA Energy Star compliance)
How it works …
Use an inactivity timer to power down
Power down monitor, disks, and eventually the entire system• Sleep (Windows Standby) and Hibernate
Resume where left-off on detection of activity• Mouse wiggle or key stroke to wake-up

3030
Power management in PCs continued
Advanced Configuration and Power Interface (ACPI) ACPI interface is built-in to operating systems
• An application can “veto” any power down
G3 -Mech
Off
Legacy
Wake
Event
G0 (S0) -
Working
G1 -
Sleeping
S4
S3S2
S1
Power
Failure/
Power Off
G2 (S5) -
Soft Off
BIOS
Routine
C0
D0
D1
D2D3
Modem
D0
D1
D2D3HDD
D0
D1D2
D3CDROM
C2
C1
Cn
Performance
State PxThrottling
C0
CPU
* From page 27 of ACPI Specification (Rev 3.0, September 2, 2004)
Lots of states!

3131
Power management in PCs continued
Wake events
User mouse wiggle or keystroke
Real time clock alarm
Modem “wake on ring”
LAN “wake on LAN” (WOL)
LAN packet pattern match
Time to wake-up is less of an issue than it used to be

3232
Wake on LAN
Wake on LAN (WOL) A special MAC frame that a NIC recognizes
(MAC address repeated 16 times in data field)• Developed in mid 1990’s• Called Magic Packet (by AMD)• Intended or remote administration of PCs
Cable and connector for auxiliary power and wake-up interrupt lines
Ethernet controller
Bus connector
LAN medium
All this is now on the motherboard and PCIbus.

3333
Wake on LAN continued
WOL has shortcomings…
✖ Must know the MAC address of remote PC
✖ Cannot route to remote PC due to last hop router timing-out and discarding ARP cache entry
✖ Existing applications and protocols do not support WOL• For example, TCP connection starts with a SYN
WOL implemented in most Ethernet and some WiFi NICs

3434
Directed packet wake-up
A better WOL Wake on interesting packets and pattern matching*
* From page 31 of Intel 82559 Fast Ethernet Controller datasheet (Rev 2.4)

3535
Directed packet wake-up continued
Directed packet wake-up has shortcomings…
Wake-up on unnecessary or trivial requests• “Wake on Junk”
Not wake-up when need to
Needs to be configured
A pattern match is “unintelligent” — no concept of state

3636
Current research and development
There are current efforts to reduce energy use in … Power distribution Processors Wireless LANs Supercomputers Data centers Corporate PCs (central control) Displays LAN switches NICs Universal Plug and Play (UPnP) protocols ADSL2

3737
Reducing energy in LAN switches
Over 6 TWh/year used by LAN switches and routers
Turning switch core off during interpacket times• Keep buffers powered-up to not lose packets• Prediction (of idle period) triggers power-down• Arriving packets into buffer trigger wake-up
NSF funded work at Portland State University (Singh et al.)
Interesting idea, more work needs to be done
About $500 million/year

3838
Reducing energy in NICs
NICs are implemented with multiple power states D0, D1, D2, and D3 per ACPI
Intel 82541PI Gigabit Ethernet Controller*• 1 W at 1 Gb/sec operation• Smart power down – Turns-off PHY if no signal on link• Power save mode – Drops link rate to 10 Mb/sec if PC on battery
* From Intel 82641PI product information web site (2005)
Typical notebook NIC

3939
Reducing energy in UPnP
UPnP may become widespread in homes
UPnP uses distributed discovery (SSDP)• Every device must periodically send and receive packets
UPnP Forum developing a standard for a proxy• Single proxy per UPnP network• Proxy sends and receives on behalf of sleeping devices• Due out in summer 2006
Developed and tested a similar UPnP proxy at USF• Available at http://www.csee.usf.edu/~christen/upnp/main.html
The UPnP proxy is protocol specific

4040
Reducing energy in ADSL2
ADSL2 is a last mile “to the home” technology 30 million DSL subscribers worldwide
ADSL2 is G.992.3, G.922.4, and G.992.5 from ITU Standardized in 2002
ADSL2 supports power management capabilities Link states L0 = full link data rate
Link state L2 = reduced link data rate
Link state L3 = link is offSymbol based handshake
How might this apply to Ethernet?

4141
Reducing energy in ADSL2 continued
ADSL2 energy savings…This is utilizationbased control
* From M. Tzannes, “ADSL2 Helps Slash Power in Broadband Designs,” CommDesign.com, January 30, 2003.
Orange region is savings from ADSL2 versus ADSL
4242
Reducing network-induced energy use
Welcome to Part #3
In this part… the “sleep-friendly” PC – its motivation,requirements, design, and next steps.
Goal is to reduce network induced energy use

4343
Disabling of power management
Why is power management disabled in most PCs?
Why are many PCs fully powered-on “all the time”? Historically this was for reasons of poor performance
• Crash on power-up, excess delay on power-up, etc. Today increasing for network-related reasons
Increasing number of applications are network-centric

4444
This is not acartoon

4545
Disabling for protocols
Some protocols require a PC to be fully powered-up
Some examples…
ARP packets – must respond• If no response then a PC becomes “unreachable”
TCP SYN packets – must respond• If no response then an application is “unreachable”
IGMP query packets – must respond• If no response then multicast to a PC is lost
DHCP lease request – must generate• If no lease request then a PC will lose its IP address

4646
Connections are everywhere
Permanent connections are becoming common At TCP level – “keep alive” messages are exchanged At app. level – app. “status” messages are exchanged
• Must respond at either level or connection can be dropped
PC goes to sleep
Dropped connection returns user tolog-in screen (and messages lost!)

4747
Disabling for applications
Some applications require a PC to be fully powered-up Permanent TCP connections are common
Some examples… Remote access for maintenance Remote access for GoToMyPC or Remote Desktop File access on a remote network drive P2P file sharing Some VPN Some IM and chat applications
Some applications disable sleep No way to know power status of a remote PC No way to guarantee wake-up of a remote PC
4848
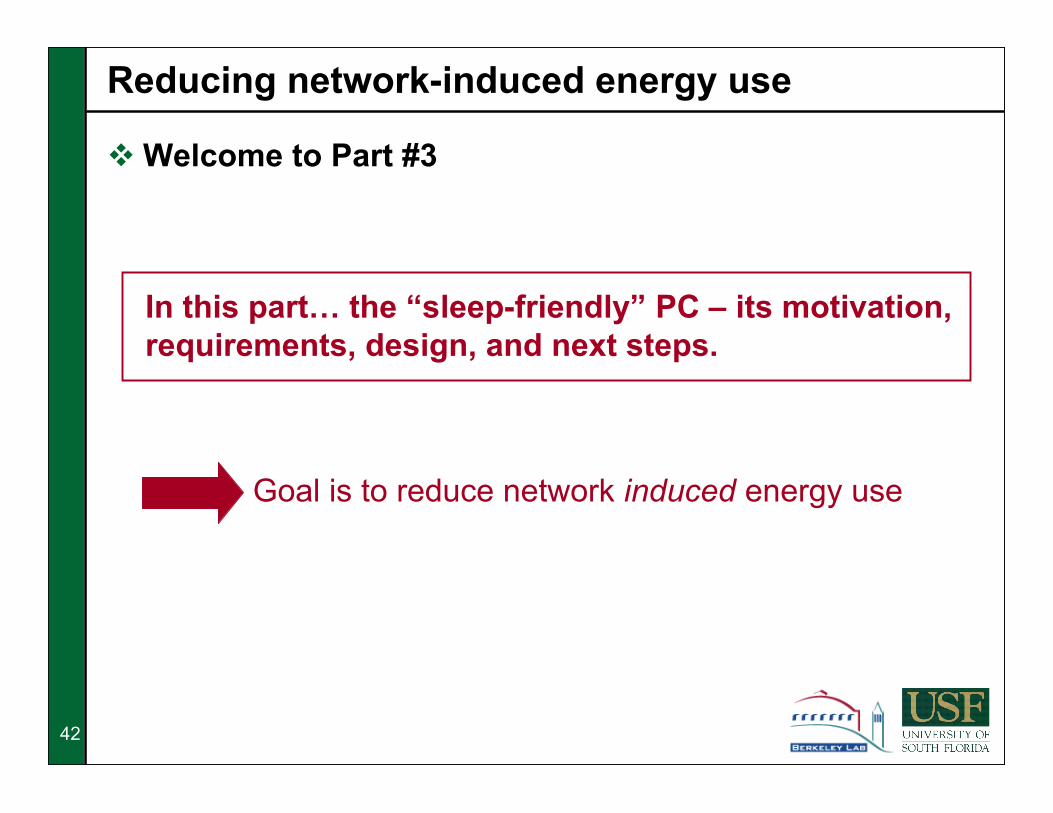
A traffic study
We traced packets arriving to an idle PC at USF (2005) Received 296,387 packets in 12 hours and 40 minutes
Remaining 2.7% and less than 1% each we found RIP, SMB, BOOTP, NTP, ICMP, DEC, X display, and many others
1.0 IP Multicast 1.2 DHCP 1.6 OSPF 1.8 Banyan System 3.6 NetBIOS Name Service 4.4 NetBIOS Datagram 6.9 Cisco Discovery 7.8 Bridge Hello16.5 UPnP
52.5 % ARP% in traceProtocol
This is 6 pkts/sec
4949
Another reason fordisabling power management?

5050
A traffic study continued
Four categories of packets were identified:
1) Ignore• Packets intended for other computers
2) Require a simple response• e.g., ARP and ICMP ping
3) Require a simple response and a state update• e.g., some NetBIOS datagrams
4) Require a response and application activity• e.g., TCP SYN
Fifth category would be “originated by protocol or application” (e.g., DHCP lease)
Majority
Wake event

5151
A sleep-friendly PC
No changes to existing protocols• Only minimal changes to applications
No change in user experience
Maintain network presence with little or no wake-up of PC
Generate routine packets as needed
Reliably and robustly wake-up PC when needed
Not wake-up PC when not needed
Provide for exposing power state to network
What capabilities would a sleep-friendly PC need?

5252
A sleep-friendly PC continued
Key capabilities
1) Ignore• Ignore and discard packets that require no action
2) Proxy• Respond to trivial requests without need to wake-up PC
3) Wake-up• Wake-up PC for valid, non-trivial requests
4) Handle TCP connections• Prevent permanent TCP connections from being dropped
5353
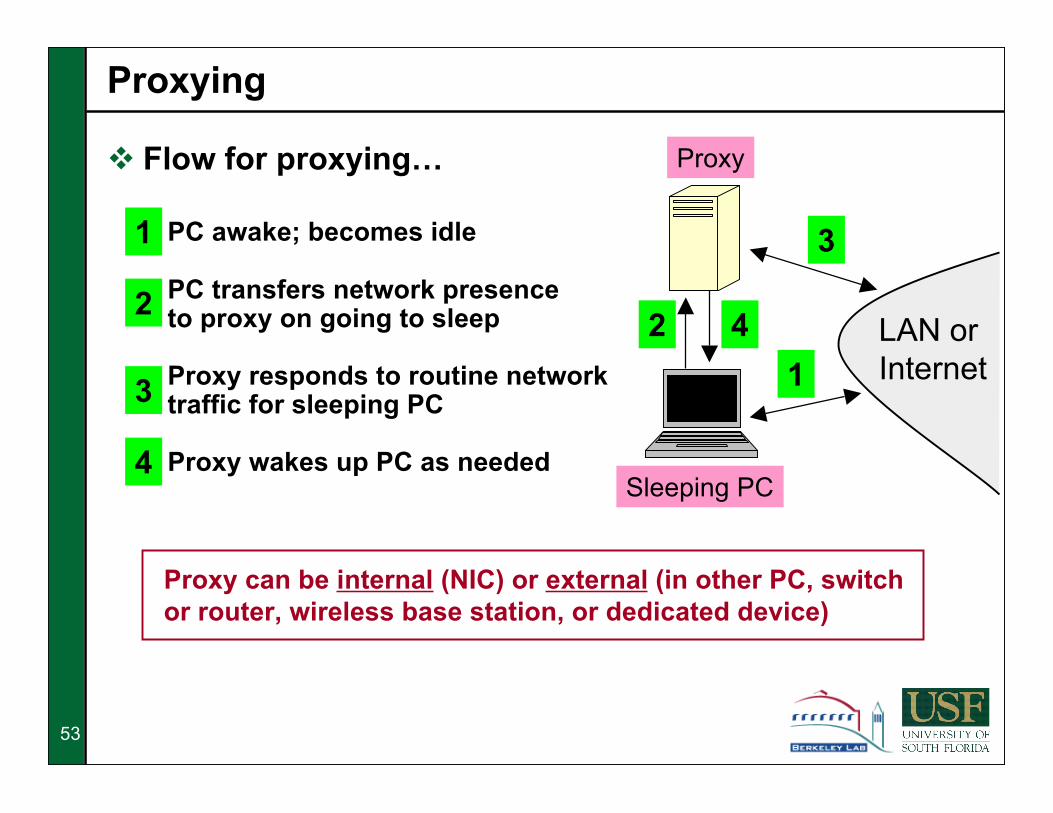
Proxying
Flow for proxying…
PC awake; becomes idle
PC transfers network presence to proxy on going to sleep
Proxy responds to routine network traffic for sleeping PC
Proxy wakes up PC as needed
LAN orInternet
Sleeping PC
Proxy
1
3
42
1
2
3
4
Proxy can be internal (NIC) or external (in other PC, switchor router, wireless base station, or dedicated device)

5454
Wake-up
Is a better wake-up needed?
We may need:
A more stateful (or intelligent) wake-up decision
Wake-up as an application semantic• Applications may have standard wake-up templates• Current wake-up packet pattern is established by the OS

5555
Handling TCP connections
How to handle permanent TCP connections?
We may need:
TCP connections that are “split” within a PC• NIC can answer for keep-alive while PC is sleeping
Wake-up for TCP keep-alive messages
Applications to not use permanent TCP connections• Possibly could only connect when actively sending/receiving data

5656
Energy aware applications
Can applications increase the enabling of powermanagement?
We may need:
Applications that maintain state to drop TCP connections
Applications that are power aware in entirely new ways
Should it be “Green application” in addition to “Green PC”?

5757
Options for a Sleep Friendly PC
Four possible options…
1) Selective wake-up NICs• Such as WOL or direct packet wake-up
2) Proxy internal to a NIC• We call this a SmartNIC (and includes wake-up)
3) Central proxy in a switch, access point, etc.• Build on UPnP proxy idea
4) Very low power fully-operational mode of PC• OS and processor active, but operate slowly
SmartNIC is most promising, (3) and (4) can have a role

5858
SmartNIC concept
A SmartNIC contains Proxy capability (new) Wake-up capability (as today and improved) Ability to advertise power state (new)
When a PC is powered-down the SmartNIC… Remains powered-up “Covers” or “proxies” for the PC Wakes-up the PC only when needed Communicates power state as needed
Can we add capability to a NIC such that a PC can remainin a low-power sleep state more than it can today?

5959
SmartNIC requirements
Need to better understand what is needed
Categorize network traffic• No response needed• Trivial response needed• Non-trivial response needed• Routine packet generation
Understand application and OS state changes• Incoming packets that cause a state change• Outgoing packets that cause a state change
Understand likely needs of future devices and applications• Wireless, mobile, etc.
Assess security implications
How much time to respond?When can we lose “first one”?
6060
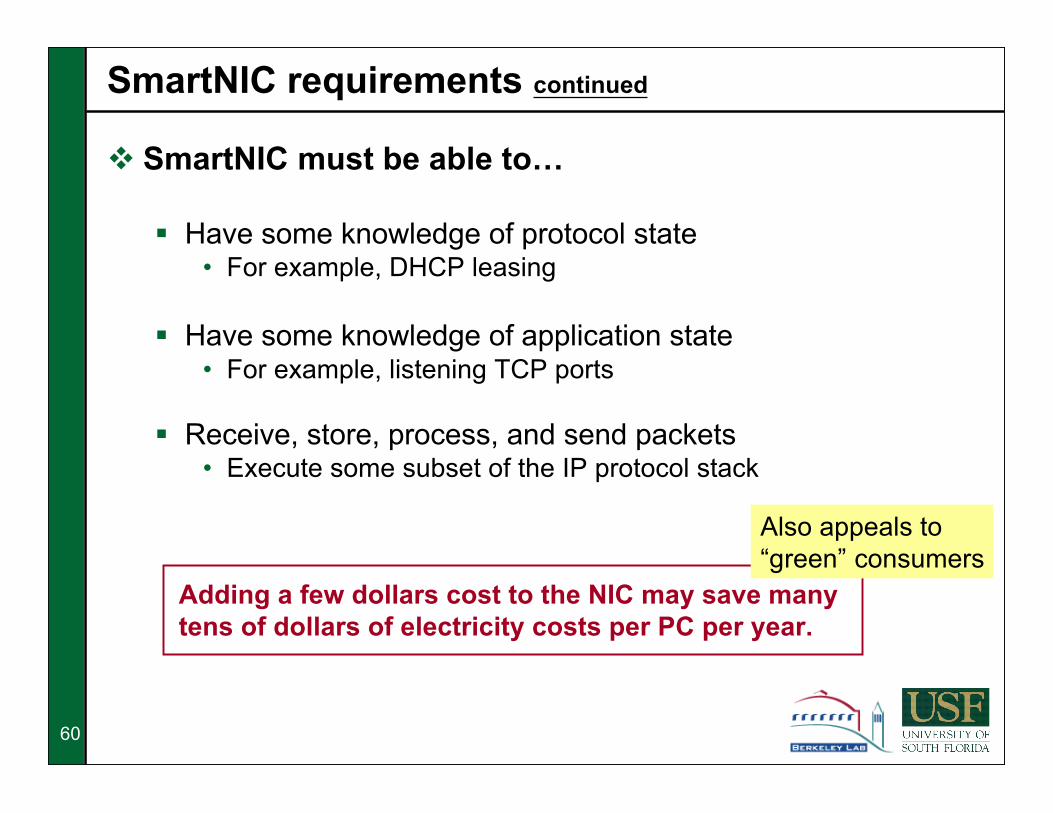
SmartNIC requirements continued
SmartNIC must be able to…
Have some knowledge of protocol state• For example, DHCP leasing
Have some knowledge of application state• For example, listening TCP ports
Receive, store, process, and send packets• Execute some subset of the IP protocol stack
Adding a few dollars cost to the NIC may save manytens of dollars of electricity costs per PC per year.
Also appeals to “green” consumers

6161
Reducing network direct energy use
Welcome to Part #4
In this part… a discussion of how to reduce direct energy use with adaptive link rate.
Goal is to reduce network direct energy use

6262
Power management of a link
Can we trade-off performance and energy? High data rate = high performance (low delay)
Low data rate = low performance (high delay)
If idle or low utilization, do not need high data rate Can we switch link data rate?
How fast can we switch link data rates?
What policies do we use to switch data rates?
Can we power manage an Ethernet link and NICs?

6363
Low utilization periods
Low utilization is time periods with “few” packets
We measure low utilization as Less than 5% utilization (in bits/sec) in a 1 millisec sample
Low utilization period = count of successive low samples
Possibly can partially power down for idle periods andswitch link to lower data rate for low utilization periods.

6464
Low utilization periods continued
Low utilization in a stream of packets Packets are variable in length (64 to 1500 bytes)
Low utilization Low utilization High utilization
Sampling interval
Stream of packets on a link
Low utilization period
High utilization

6565
Power measurements
We study power consumption due to Ethernet links
We measure… Cisco Catalyst 2970 LAN switch
Intel Pro 1000/MT NIC
We study the specifications for… Intel 82547GI/82547EI Gigabit Ethernet Controller (NIC)
Chelsio N210 10GbE Server Adapter (NIC)
How much power use is direct from the network?

6666
Power measurements continued
Power use measurement* Catalyst 2970 24-port LAN switch
83.771.971.98
80.271.171.66
76.770.071.14
72.970.170.22
69.1 W 69.1 W 69.1 W0
1000 Mb/sec100 Mb/sec10 Mb/sec# ports
Measured at wall socket (AC)
* By Chamara Gunaratne from University of South Florida (August 2004)
At 1000 Mb/sec it is about1.8 W added per active link
Active configured links
10 and 100 Mb/sec are about the same

6767
Power measurements continued
Power use measurements* For Intel Pro 1000/MT NIC
Idle Link (no activity)
.6645.1113010
1.145.11224100
3.915.087701000
Power(W)
Voltage(V)
Current(mA)
Rate(Mb/s)
Active Link (file transfer)
.6335.1112410
1.145.11224100
3.905.087681000
Power(W)
Voltage(V)
Current(mA)
Rate(Mb/s)
Difference between 1000 and 10 Mb/sec is about 3.2 W
* By Brian Letzen from University of Florida (February 2005)
Measured at PCI bus (DC)
No significant difference betweenidle and active link

6868
Power measurements continued
Power use specifications for 1 Gb/sec* For Intel 82547GI/82547EI Gigabit Ethernet Controller
* From page 15 of Intel 82547GI/82547EI datasheet (Rev 2.1, November 2004)
Difference between 1000 and 10 Mb/sec is about 1 W
Typical PC NIC
6969
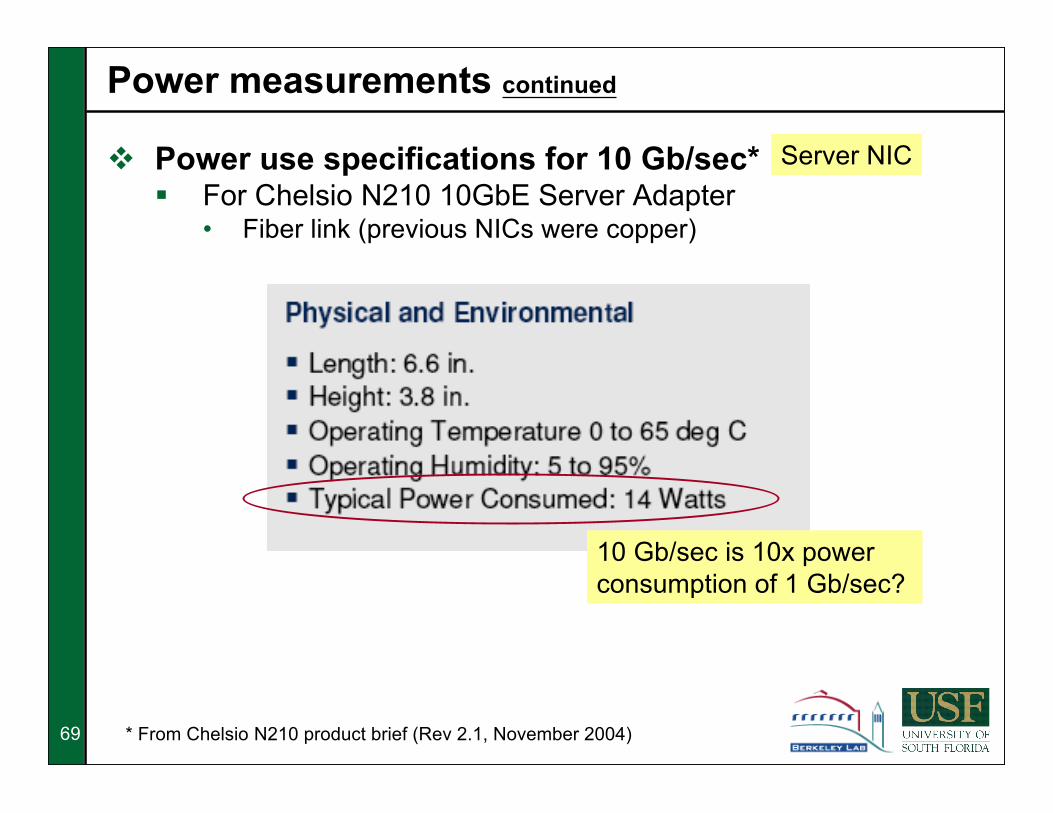
Power measurements continued
Power use specifications for 10 Gb/sec* For Chelsio N210 10GbE Server Adapter
• Fiber link (previous NICs were copper)
* From Chelsio N210 product brief (Rev 2.1, November 2004)
10 Gb/sec is 10x powerconsumption of 1 Gb/sec?
Server NIC

7070
Power measurements continued
Summary of power measurements Bar graph showing averages of all measurements
0
5
10
15
Link speed (Mb/sec)
Pow
er u
se (W
)
10 100 1000 10000
10 Gb/sec is a concern
g00.xls

7171
Adaptive link rate (ALR)
Automatic link speed switching* For 82547GI/82547EI Gigabit Ethernet Controller
* From Intel 82547GI/82547EI product information (82547gi.htm)
Drops link speed to 10 Mb/secwhen PC enters low-power state
Motivates dropping link data rate if low utilization
Typical PC NIC

7272
Adaptive link rate (ALR) continued
Change (or adapt) data rate in response to utilization Use 10 or 100 Mb/sec during low utilization periods Use 1 or 10 Gb/sec during high utilization periods
Need new mechanism Current auto-negotiation is not suitable (too slow)
• Designed for set-up (e.g., boot-up time), not routine use
Need policies for use of mechanism Reactive policy possible if can switch link rates “quickly” Predictive policy is needed otherwise
Goal: Save energy by matching link data rate to utilization
Independent of PCpower management

7373
Policies for ALR
Can use queue length and utilization (reactive policy) In a NIC (within PC or a LAN switch)
Packets arrive
Packets queue in bufferwaiting for link
High threshold
Packets are transmitted and counted

7474
Policies for ALR continued
For reactive policy two new processes execute Check for threshold crossing Check for utilization is low
if (link rate is low) if (buffer exceeds threshold) wait for current packet transmission to finish handshake for high link ratetransmit the next queued packet
if (link rate is high) if (utilization is low) wait for current packet transmission to finish handshake for low link ratetransmit the next queued packet
Executes on an arriving packet…
Executing at all times…

7575
Traffic characterization
We collect and characterize traffic “in the wild”
We are interested in understanding… Low utilization periods
We are also interested in understanding… Idle periods
How much time is there for power management?

7676
Traffic characterization continued
Traffic collection at University of South Florida (USF) Three traces from dormitory LAN (3000+ users) in mid-2004
• USF #1 – The busiest user• USF #2 – 10th busiest user• USF #3 – Typical user
Traffic collection details All are 100 Mb/sec Ethernet links USF traces are 30 minutes captured with Ethereal

7777
Traffic characterization continued
Summary of the traces continued
1799
1571
1415 s
Total low utiltime
0.031801 0.55USF #3
2.63177147USF #2
4.11 % 1759 s 75 sUSF #1
Utilization at100 Mb/sec
Total idle time
Total busy timeTrace
Utilization is low

7878
Traffic characterization continued
Summary of the traces continued
0.1100
0.0020
0.0011 s
Mean idleperiod
13.957.221.0892USF #3
2.211.500.0094USF #2
1.790.91 0.0060 sUSF #1
CoV of idleperiod
CoV of lowutil period
Mean lowutil periodTrace
Large variability

7979
Traffic characterization continued
Fraction of low utilization periods for USF traffic For USF #1 and #2, most low utilization less than 100ms
0%
20%
40%
60%
80%
100%
0.001 0.01 0.1 1 10 100 1000
Time (s)
Fra
ction o
f to
tal tr
ace tim
e
= USF #1
= USF #2
= USF #3
Much variability
g04.xls

8080
0%
20%
40%
60%
80%
100%
0.001 0.01 0.1 1 10 100 1000
Time (s)
Fra
ction o
f to
tal tim
e
USF #1
= idle
= low util
USF #3
Traffic characterization continued
Idle and low utilization periods together Example of busiest (USF #1) and typical (USF #3)
Extreme variability among links
g10.xls

8181
Energy and performance metrics
Need performance metrics that include energy
Define E is energy consumed with no power management enabled Es is energy consumed with power management enabled Dbound is target mean delay bound Ds is mean delay with power management enabled
Singh et al. energy savings metric (α)
Our green energy-performance metric (γ)
α = E / Es
(E / Es)(Dbound / Ds) if Ds > Dboundγ = (E / Es) if Ds < Dbound

8282
Simulation evaluation of ALR
Need to study performance of reactive policy
Simulate a NIC (or switch port) buffer A single server queue Packet arrivals are from traces Packet service is 10 Mb/sec or 100 Mb/sec
Key control variables Target delay threshold (Dbound) Time to switch between data rates Energy used at 10 Mb/sec Energy used at 100 Mb/sec
Response variables Delay (mean and 99%) Green metric
Results should be representativefor 1 Gb/sec case

8383
Simulation evaluation of ALR continued
Experiment to evaluate effect of time to switch rates
Control variable settings: Queue threshold = minimum of 10 pkts or number of packets that can arrive in a switching time at 5% utilization Utilization measurement period = 100 milliseconds
• Sampling interval = 0.01 millisecond Time to switch data rate ranging from 0 to 50 milliseconds Energy used at 10 Mb/sec = 4.0 W Energy used at 100 Mb/sec = 1.5 W Dbound = 5 milliseconds
Response variables collected: Mean and 99% packet delay (from queueing) Green metric (γ)

8484
Simulation evaluation of ALR continued
Cases for simulation experiment
100-Mbps link rate (no power management
10-Mbps link rate (no power management)
ALR case (power management)
For each case we collect
Mean and 99% delay
CoV of delay
Metrics α and γ

8585
Simulation evaluation of ALR continued
Results for USF traces with no ALR For fixed 10 or 100 Mb/sec link speed
0.261.37 0.05USF #3
0.290.93 0.08USF #2
0.461.16 0.09USF #1
919.241.68196.30USF #3
60.072.62 3.95USF #2
77.46 ms2.03 7.60 msUSF #1
99% delayCoV of delayMean delayTrace
10 Mb/sec
100 Mb/sec

8686
Simulation evaluation of ALR continued
Results for energy metrics for USF traces
g21.xls
0.00
0.50
1.00
1.50
2.00
2.50
3.00
0 10 20 30 40 50
Switching time (ms)
En
erg
y m
etr
ics
= Green metric
= Alpha metric USF #1
USF #2
USF #3
γ = 2.67 is theoretical max
8787
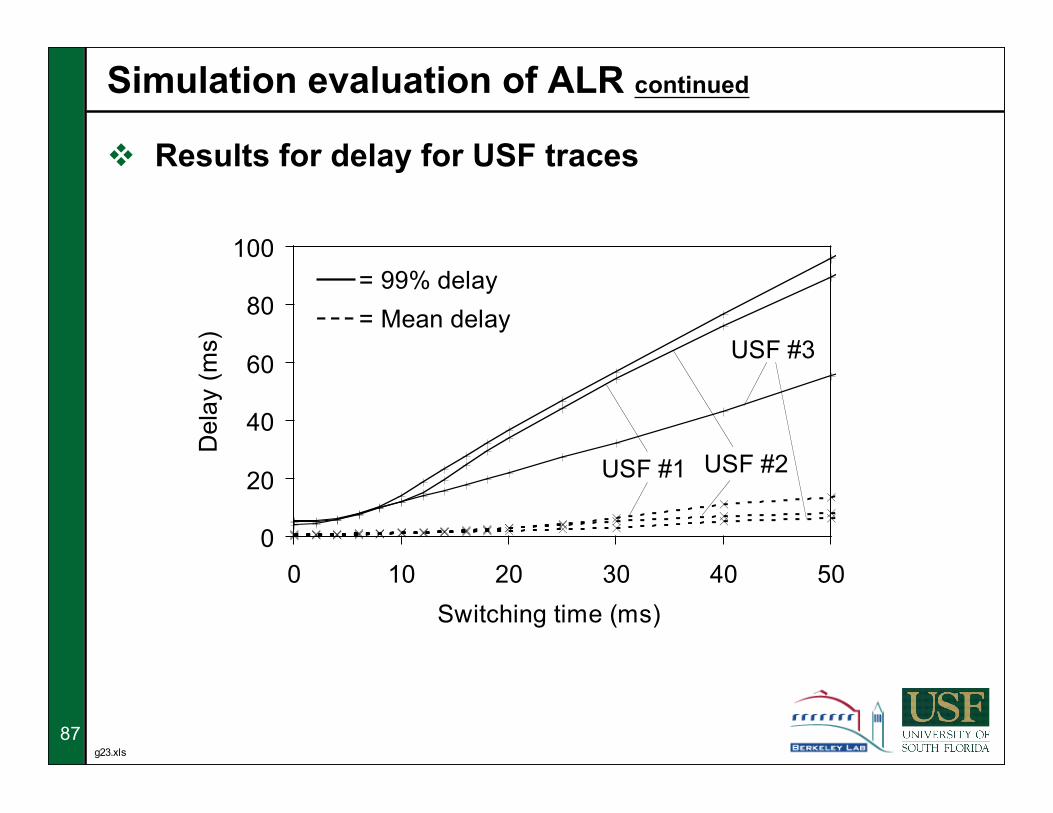
Simulation evaluation of ALR continued
Results for delay for USF traces
g23.xls
0
20
40
60
80
100
0 10 20 30 40 50
Switching time (ms)
De
lay (
ms)
= 99% delay
= Mean delay
USF #1 USF #2
USF #3

8888
Simulation evaluation of ALR continued
Utilization and link speed graphic Sample USF trace (USF #1)
0%
20%
40%
60%
80%
100%
0 500 1000 1500
Time (s)
Utiliz
atio
n
0%
20%
40%
60%
80%
100%
0 500 1000 1500
Time (s)
Utiliz
atio
n
1.0% of time in 100 Mb/s
g32.xls

8989
Simulation evaluation of ALR continued
Discussion of results…
Great variation in length of low utilization periods
Can achieve energy savings and low delay for all traces
Expect that these results will hold for 1 Gb/sec
Need to consider energy cost of transition between rates
As with ADSL2, may be very important for MetroEthernet

9090
Potential Energy Savings
Welcome to Part #5
In this part… energy savings calculations for theSmartNIC and Ethernet Adaptive Link Rate.

9191
Savings Estimates
All factors — stock, power levels, usage — not wellknown and changing
Conclusions rely on magnitude of savings Not on precise figures
Assumptions
100 million commercial PCs half desktops 100 million residential PCs half notebooks
Today’s power levels
Usage patterns — rising # of PCs left on continuously

9292
SmartNIC savings
First, consider one Continuous-on PC 40 hours/week in-use 128 hours/week asleep (was fully-on before SmartNIC)
Unit Savings Desktop / Notebook Annual Electricity kWh/year 470 / 100 Annual Electricity $ $37 / $8 4-year lifetime $ $150 / $32

9393
SmartNIC Savings continued
Stock-wide Savings Use unit savings for half of stock
28 TWh/year; $2.3 billion/year
EPA/Energy Star estimate
If all power managed, US would annually save 25billion kWh, equivalent to:
Saving $1.8 billionLighting over 20 million homes annually (all the homes in NY and CA combined)Preventing 18 million tons of carbon dioxide (emissions of over 3 million cars)

9494
SmartNIC Savings continued
Stock-wide average savings
Desktop: $75; Notebook: $16 “Budget” for retail cost of SmartNIC hardware
• Except for notebooks — SmartNIC adds to functionality
If SmartNIC adds $5 to system cost, averagepayback time:
Desktop: About 3 months Notebook: 15 months
Highly Cost-effective.

9595
Adaptive Link Rate savings
“Success” rate: Should be nearly 100% At least once the stock of network equipment turns over Does not rely on system sleep status
Average on- or asleep-time of whole stock almost 70% Take 80% of this as low-traffic time
55% potential reduced data rate time
High data rate 1Gb/s - 80% of commercial; 20% of residential (50% average) 100Mb/s - 10% commercial; 70% residential (40% average)
9696
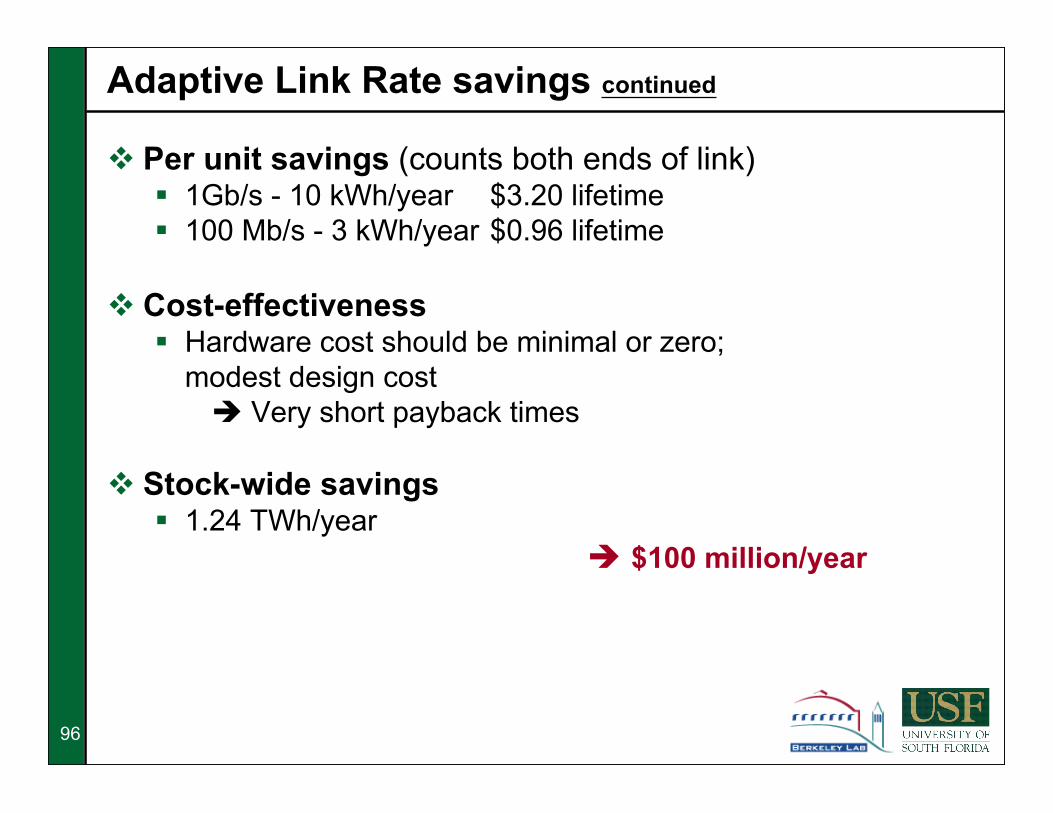
Adaptive Link Rate savings continued
Per unit savings (counts both ends of link) 1Gb/s - 10 kWh/year $3.20 lifetime 100 Mb/s - 3 kWh/year $0.96 lifetime
Cost-effectiveness Hardware cost should be minimal or zero;
modest design cost Very short payback times
Stock-wide savings 1.24 TWh/year
$100 million/year

9797
Summary and next steps
Welcome to Part #6
In this part… we summarize the key points and discuss the next steps needed to energy savings.

9898
IT equipment uses a lot of energy
All electronics about $16 billion/year of electricity
PCs about $3.7 billion/year
… and both growing …

9999
Networks induce energy use
Many products must stay in a higher power state thanotherwise needed to maintain connectivity
802 networks USB (some implementations) TV set-top boxes (many) and more…
Network applications increase on-times
… and growing …

100100
Networks directly use energy
Network interfaces and network products
Combined about $1 billion/year
… and growing …
101101
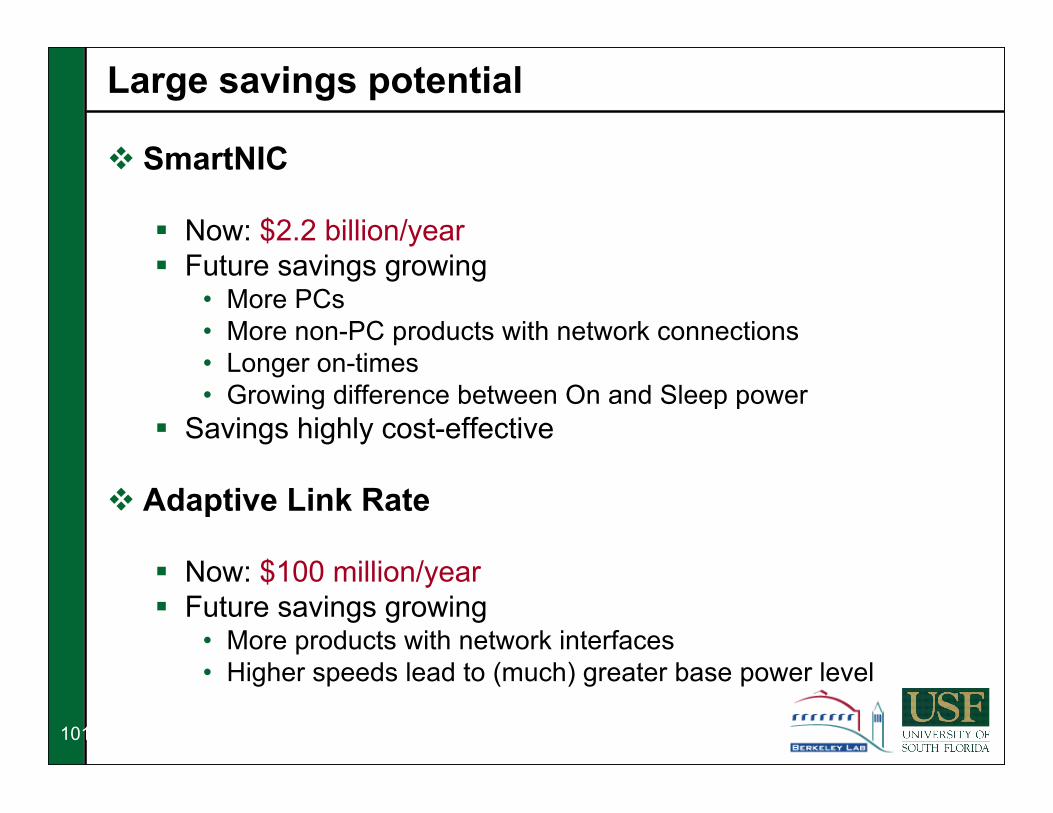
Large savings potential
SmartNIC
Now: $2.2 billion/year Future savings growing
• More PCs• More non-PC products with network connections• Longer on-times• Growing difference between On and Sleep power
Savings highly cost-effective
Adaptive Link Rate
Now: $100 million/year Future savings growing
• More products with network interfaces• Higher speeds lead to (much) greater base power level
102102
IETF for sleep friendly systems
IETF (or similar organization) should: Create a study group on the topic Define generic proxy functionality (internal and external) Define data exchange standards between OS and NIC Create guidelines for sleep-friendly software
Implementation Energy Star could help educate consumers, transform
markets

103103
IEEE 802.3 for adaptive link rate
Form study group 1G NICs 10G NICs (copper and fiber) Assess implications for wireless (or different study group)
Implementation Roll capability into all NIC products

104104
Do PCs dreamwhen in sleep?

105105
Questions / Comments
Ken ChristensenComputer Science and Engineering
University of South FloridaTampa, FL 33620
Bruce NordmanEnergy Analysis
Lawrence Berkeley National LaboratoryBerkeley, CA [email protected]

106106
BACKUP SLIDES

107107
Reducing energy in power distribution
Power distribution is the first point of inefficiency
UPS causes loss• Use of UPS is increasing
Type of power supply matters• Switching versus series regulated
Number of power supplies matter• More efficient may be one DC supply per rack• Power over Ethernet may improve efficiency in this way
Substantial savings still possible in the “analog” realm

108108
Reducing energy in processors
Processor is the main energy consumer in a PC
Within a chip can turn-off and/or scale clock to components• Nanosecond time scale• Use predictive strategies
AMD PowerNow, Intel PowerStep, and Transmeta LongRun
“… delivering just enough performance to satisfy the workloadat hand.”
• Transmeta LongRun brochure
Processor level has no “view” of long time scale events
Graphics unit may be mainenergy user in a game unit.

109109
Reducing energy in wireless networks
Wireless networks can be mobile and ad hoc
Very expensive to transmit (wireless is non-directional)• Processing and storage require much less power
New routing protocols
New data distribution methods
New approaches for data fusion
Does not apply to existing Internet protocols
From sensor network research community

110110
Reducing energy in supercomputers
Energy use is the limiting factor in supercomputers
“If current trends continue, future petaflop systems will require100 megawatts of power…”
• Cameron et al. at USC (2005)
100 MW is $8000 per hour!• This does not include cooling costs!
Current work is in characterizing program execution• Goal is smarter program scheduling
Does not apply to “ordinary” desktop applications

111111
Reducing energy in data centers
Energy use is a major cost component in data centers
Cooling is 25% of operating cost
Data centers use clusters of mirrored Web servers
Exploring ways to power on/off servers as a function ofrequest rate
• Keeping response time below a threshold is the goal
NSF funded work at several universities
Does not apply to “ordinary” desktop applications

112112
Reducing energy in corporate PCs
Central control of Windows power management
Use a centralized management PC to control Windows powermanagement settings in desktop PCs
• Lock-out users from disabling power management
At night use “aggressive” power management settings• Short delay to sleep and possibly even turn-off PCs
During the day use “lite” power management settings• Long delays to sleep and no use of off
Verdiem Surveyor and other products
Does not address root problems and not useful for residential PCs

113113
Reducing energy in displays
Displays are proliferating, but are not always watched
LCD displays require less power than CRTs, howevermultiple displays per desktop is becoming normal
Can use camera to detect if person is watching display• Camera is an “occupancy sensor”
“FaceOff” at Duke University to power manage a notebook• Dalton and Ellis
User context need to play a role in power management
114114
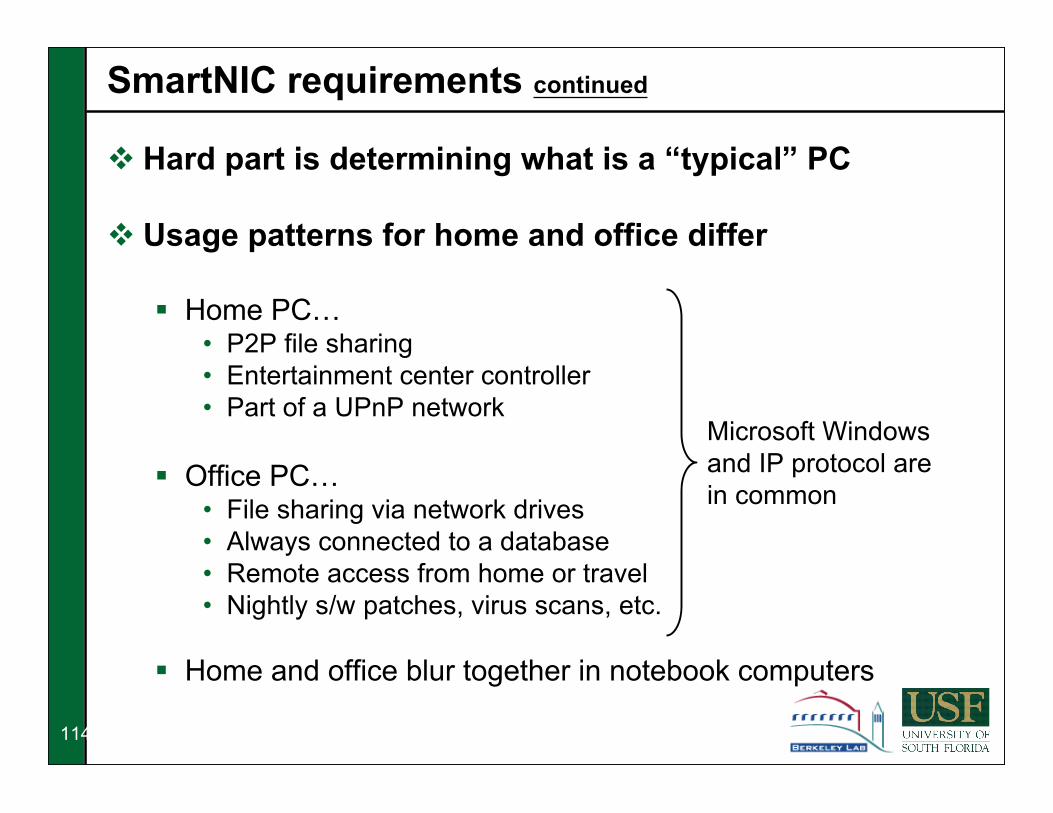
SmartNIC requirements continued
Hard part is determining what is a “typical” PC
Usage patterns for home and office differ
Home PC…• P2P file sharing• Entertainment center controller• Part of a UPnP network
Office PC…• File sharing via network drives• Always connected to a database• Remote access from home or travel• Nightly s/w patches, virus scans, etc.
Home and office blur together in notebook computers
Microsoft Windowsand IP protocol arein common