Embed Size (px)
Citation preview
7/31/2019 Reducing Runtime Values in Minimum Spanning Tree Based Clustering by Visual Access Tendency
http://slidepdf.com/reader/full/reducing-runtime-values-in-minimum-spanning-tree-based-clustering-by-visual 1/12
International Journal of Data Mining & Knowledge Management Process (IJDKP) Vol.2, No.3, May 2012
DOI : 10.5121/ijdkp.2012.2302 11
REDUCING RUNTIME VALUES IN MINIMUM
SPANNING TREE BASED CLUSTERING BY VISUAL
ACCESS TENDENCY
Dr. B. Eswara Reddy1
and K. Rajendra Prasad2
1Associate Professor , Head of CSE Department, JNTUA College of Engineering
Anantapur, Andhra Pradesh, [email protected]
2Research Scholar, JNTUA College of Engineering
Anantapur, Andhra Pradesh, [email protected]
A BSTRACT
Clustering has been widely used in data analysis. Dissimilarity assesses the distance between objects and
this is important in Minimum Spanning Tree (MST) based clustering. An inconsistent edge is identified and
removed without knowledge of prior tendency in MST based clustering, which explore the results of
clusters in the form of sub-trees. Clustering validity is to be checked at every iterated MST clusters by
Dunn’s Index. Higher Dunn’s Index imposes the exact clustering. The existing system takes more run time
when there are several iterations where as the proposed system takes single step with very less run time.
Key contribution of the paper is to find prior tendency in MST Based Clustering by Visual Access Tendency
(VAT) and to find clustering results in a single step instead of several trails. The proposed method extends
the MST based clustering algorithm with VAT procedure, called as VAT-Based-MST-Clustering. Results
are tested on synthetic data sets, and real data sets to conclude the clustering results are improved by
proposed method with respect to the runtime.
K EYWORDS
Clustering Analysis, Clustering Tendency, Histograms, FFT, VAT
1. INTRODUCTION
An unsupervised approach of clustering aims to find related objects for different groups bymeasuring the features of intra cluster similarity and inter cluster similarity between data objects
[3]. Partitional, hierarchical [16], density-based [20], and model based approaches [21] have beendeveloped for clustering analysis [19] and these methods do not perform as expected when the
shape of clusters are irregular. But, MST-based clustering algorithm exhibits well even though the
shapes of the clusters are complex. Irregular boundaries are handled smoothly in MST-based
clustering algorithms [5]. Euclidean distance between every pair of objects introduces the resultsof dissimilarity matrix. The graph G(V, E) is constructed after finding the dissimilarity matrix
from given data objects. The MST is a graphical tree analysis and it is derived from graph bystandard approaches of either Kruskal’s or Prim’s algorithm. MST is a fully connected graph of
an arbitrary set of data objects. Each dissimilarity value represented as distance between
respected data objects; it will act as edge weight between data points in the spanning tree. Clusterseparations were effectively formed from MST representation by identifying and removing
inconsistent edges. In MST, all longer weighted edges are considered as inconsistent edges. MST-

7/31/2019 Reducing Runtime Values in Minimum Spanning Tree Based Clustering by Visual Access Tendency
http://slidepdf.com/reader/full/reducing-runtime-values-in-minimum-spanning-tree-based-clustering-by-visual 2/12
International Journal of Data Mining & Knowledge Management Process (IJDKP) Vol.2, No.3, May 2012
12
based clustering algorithms [17], [18] create cluster definitions without knowledge of clusteringtendency. Because of this reason, the MST algorithm is refined with VAT procedure. VAT
computes the reordered dissimilarity matrix for features of data objects. The image of VATvisualizes the tendency value for given dataset [4]. IVAT [1] is extension of VAT approach; it isbest suited for finding the clustering tendency on tight clustered datasets. We also make use of
different similarity measures for the purpose of finding distance between any two distinguishable
objects [6].
VAT and IVAT procedures are made use of the same logic of MST. These procedures reorder the
dissimilarity values according to the order of visited vertices during the construction of MST.Clustering assessment is retrieved from VAT image by detecting the number of dark blocks along
the diagonal. These dark blocks assess the number of clusters as input of MST based clustering
algorithm.
This paper contributes the proposed work on extensive ideas of MST based clustering aiming to
extract the tight clusters in order to get two benefits; first is to reduce the time ,and second is toimprove the time values since, we use the known tendency value in MST clustering algorithms.
The major objective of our proposed research is to make best usage of tendency value in MSTbased clustering algorithms for improving performance values.
Assessment of tendency is one of the important criteria during clustering analysis. Exact tendencyvalues are inferred from VAT techniques.
Related work of MST-based clustering algorithms is presented in Section 2. Concept of Visual
Access Tendency is discussed in Section 3. Proposed work is described in Section 4. Section 5describes the datasets and its validation. Results analysis is discussed in Section 6, and conclusion
and future work is presented in Section 7.
2. RELATED WORK
MST based clustering is graph theoretical promising approach for unlabelled data sets. MST is
constructed using classical algorithms, namely, either Prim’s or Kruskal’s. The following sections
discussed the construction of MST and their subtree clustering results from dissimilarity features.
2.1. Deriving MST from unlabeled data
A spanning tree is to add single edge at a time from the data of graph G with given set of ‘n’
number of vertices and ‘e’ number of edges. The edge weight value is obtained from thecalculation of Euclidean distance between respective pair of data objects from the unlabelled data.The traditional algorithms either Prim’s or Kruskal’s are constructed spanning tree from the graph
G. They [5] discussed another generic spanning tree algorithm, named REVERSE-DELETE, thisalgorithm is processed the edges in opposite direction of Prim’s or Kruskal’s algorithm.
REVERSE-DELETE algorithm is to construct the minimum spanning tree from fully connectedgraph by deleting edges in sorted descending order. The observed cost of these traditional
algorithms is O(m logn) [7],[8].
2.2. Overview for MST-Based Clustering
Removing of an inconsistent edge in MST gives the results of two separated subtrees, which is
considered as resulting of two-cluster group. Applying same procedure recursively for eachsubtree, and ‘K’ clusters are retrieved from the MST. Standard approach of MST-based clustering
is reported in Zahn’s work [9]. According to Zahn’s work, first is to check whether edge weightsare larger than sum of average weight of edges and standard deviation of edges, which edges are
7/31/2019 Reducing Runtime Values in Minimum Spanning Tree Based Clustering by Visual Access Tendency
http://slidepdf.com/reader/full/reducing-runtime-values-in-minimum-spanning-tree-based-clustering-by-visual 3/12
International Journal of Data Mining & Knowledge Management Process (IJDKP) Vol.2, No.3, May 2012
13
inconsistent edges. Zahn’s used the following equation in MST clustering for the purpose of removing inconsistent edges.
W> Wavg+Wσ,
Where W is inconsistent edge weight, Wavg be the average weight of edges, and Wσ be the
standard deviation of edge weights.
Xu[10] derives MST for representing the gene expression data; Using his approach, we
understand that MST-clustering strategy doesn’t assume always regular geometric shape. Due tothis reason, Xu[10] describes three objective functions. First objective says simply removing of
(K-1)-longer edges, which results total weight of ‘K’ subtrees is minimized. Second objective
function states that sum of total distance between pair of center position (center(Ti), Ti is ith
sub-cluster) and data points(d) is minimized.
(,())
Third objective function presents the optimal solution of clustering problem by detecting the best
representative of the data set; this function minimize the distance between selected representativeand data points in the cluster.
Another approach of MST-based clustering algorithm is proposed by Laszlo and Mukherjee[11],generally this is referred as LM algorithm. They carried out constraint on the clustering size
instead of number of clusters. Removing of edges is applied only in case of reaching minimumclustering size.
Vathy-Fogarssy[12] experiments MST-clustering with three basic criterion functions. Theobjective of this work is to reduce external interference on MST clustering results; First criteria
states that delete edge if the edge satisfies the value of attraction threshold.
The Attraction threshold is as follows
Tatth=0.5* () /(,)
N is number of input objects, and the distance between any two objects d(x1,x2) is calculated byEuclidean formula. Second criteria detect the hidden separations by recognizing the inconsistent
edge, which uses the following condition for detecting inconsistent edge.
d(xi,xj)>Tatth
Third criteria propose largest fuzzy hyper volume is used for the purpose of evaluating good
clustering validity. Fuzzy hyper volume is given by the equation
; Vi= det ( )
FUZi= ( )( )
Grygorash [13] proposed Hierarchical Euclidean distance based MST clustering algorithm(HEMST) and the Maximum Standard Deviation Reduction Clustering Algorithm (MSDR).
MSDR does not require any input value for termination. MSDR removes edge only when all
7/31/2019 Reducing Runtime Values in Minimum Spanning Tree Based Clustering by Visual Access Tendency
http://slidepdf.com/reader/full/reducing-runtime-values-in-minimum-spanning-tree-based-clustering-by-visual 4/12
International Journal of Data Mining & Knowledge Management Process (IJDKP) Vol.2, No.3, May 2012
14
clusters standard deviation is maximized. This is recursive process and it is continued until theobtained standard reduction is within threshold, but the problem of MSDR is requiring high cost
for large datasets. HEMST algorithm generates the clustering results from MST until reaching therequired number of clusters. User is giving the input as number of clusters without idea of clustering tendency, which is used as constraint of HEMST algorithm during runtime. Three
important limitations are identified in present system. These are clustering tendency is unknown,
it doesn’t generate the exact number of clusters without knowledge of tendency, and it requires
external interference for specifying termination condition.
Therefore, the purpose of assessing tendency, we propose the specific visualization methods inMST based clustering algorithms for detecting exact tendency value. This method is discussed in
following sections.
3. VISUAL ACCESS TENDENCY (VAT) AND IMPROVED VAT (IVAT)
METHODS
VAT is best when the dissimilarity features are available for unlabeled data set. The effective
values of dissimilarity results the clarity of tendency in their visual representation. The tendency
of data determines itself the cluster numbering from their visual representation by the detectingthe number of square shaped dark blocks along the diagonal in the regulating image of VATalgorithm [4]. The following algorithm describes the procedure of VAT.
VAT (int diss[ ][ ],int n-objects)
Step1:Initialize I= Φ ;J={0,1,.....n-1}
Find max of diss[ ] [ ], and its cell is(i,j)
P(0)=i; I={i},J=J-{I};Step2:
for (s=1;s<n;s++)
{
Find(i,j) from min {dis[i][j], where i∈I, j∈J}I=I∪ {j}; J=J-{I};P(s)=j;
}
Step3:
/*Compute Reordered Dissimilarity Matrix*/ for(i=0;i<n;i++)
for(j=0;j<n;j++)
print (diss(P[i],P[j]);
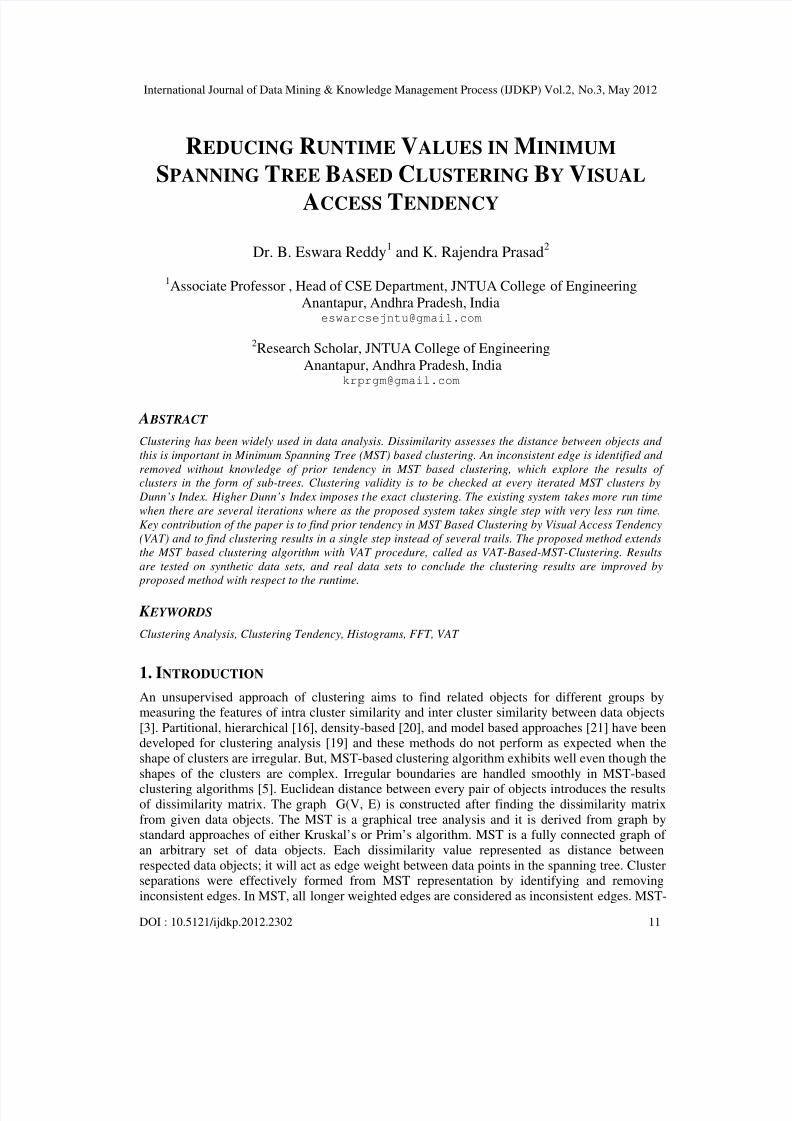
The VAT algorithm visualizes the VAT image of reordered dissimilarity data(diss) from Step3.The results are observed from the following sample dissimilarity data (D).
D=[0.0 0.78 0.54 0.22 0.57 0.68 0.54 0.09 0.63 0.66;0.78 0.0 0.61 0.99 0.37 0.67 0.59 0.69 0.52 0.7;
0.54 0.61 0.00 0.61 0.1 0.48 0.56 0.51 0.25 0.56;
0.22 0.99 0.61 0.0 0.63 0.74 0.62 0.31 0.69 0.73;
0.57 0.37 0.1 0.63 0.0 0.45 0.58 0.54 0.14 0.46;
0.68 0.67 0.48 0.74 0.45 0.0 0.7 0.66 0.47 0.09;
0.54 0.59 0.56 0.62 0.58 0.7 0.0 0.77 0.63 0.47;
0.09 0.69 0.51 0.31 0.54 0.66 0.77 0.0 0.59 0.63;
0.63 0.52 0.25 0.69 0.14 0.47 0.63 0.59 0.0 0.5;
0.66 0.7 0.56 0.73 0.46 0.09 0.47 0.63 0.5 0.00];
7/31/2019 Reducing Runtime Values in Minimum Spanning Tree Based Clustering by Visual Access Tendency
http://slidepdf.com/reader/full/reducing-runtime-values-in-minimum-spanning-tree-based-clustering-by-visual 5/12
International Journal of Data Mining & Knowledge Management Process (IJDKP) Vol.2, No.3, May 2012
15
Fig.1. VAT Image for Dissimilarity Matrix (D)
The VAT image results are described in Fig.1. Dissimilarity matrix ‘D’ is derived from unlabeled
data set. Fig. 1 illustrates the clustering tendency value (i.e. number of clusters is 5) with the helpof number of square shaped dark blocks along the diagonal. This tendency value is used during
the process of MST based clustering.
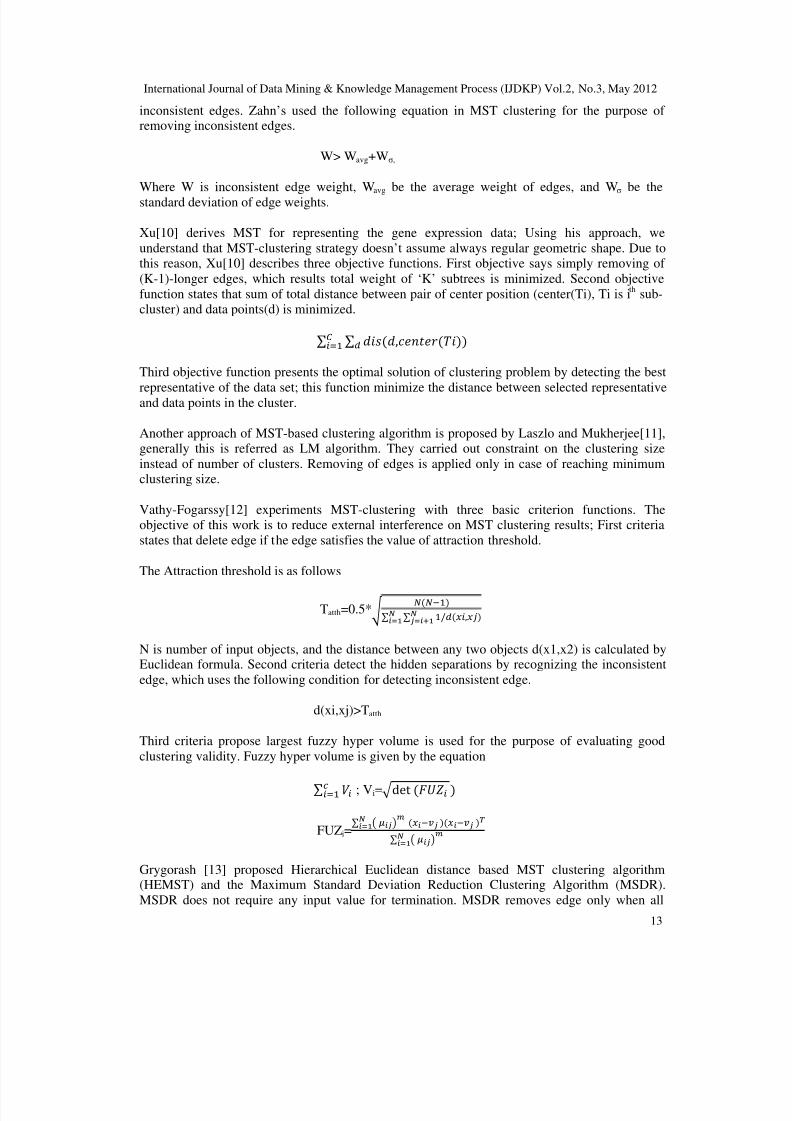
VAT has some limitations before finding the clustering tendency. It performs well when the
clustered data is not in complex. The authors of [2] formulate another procedure called as IVAT,which uses graph theoretic distance transform to improve the accuracy of visual clustering
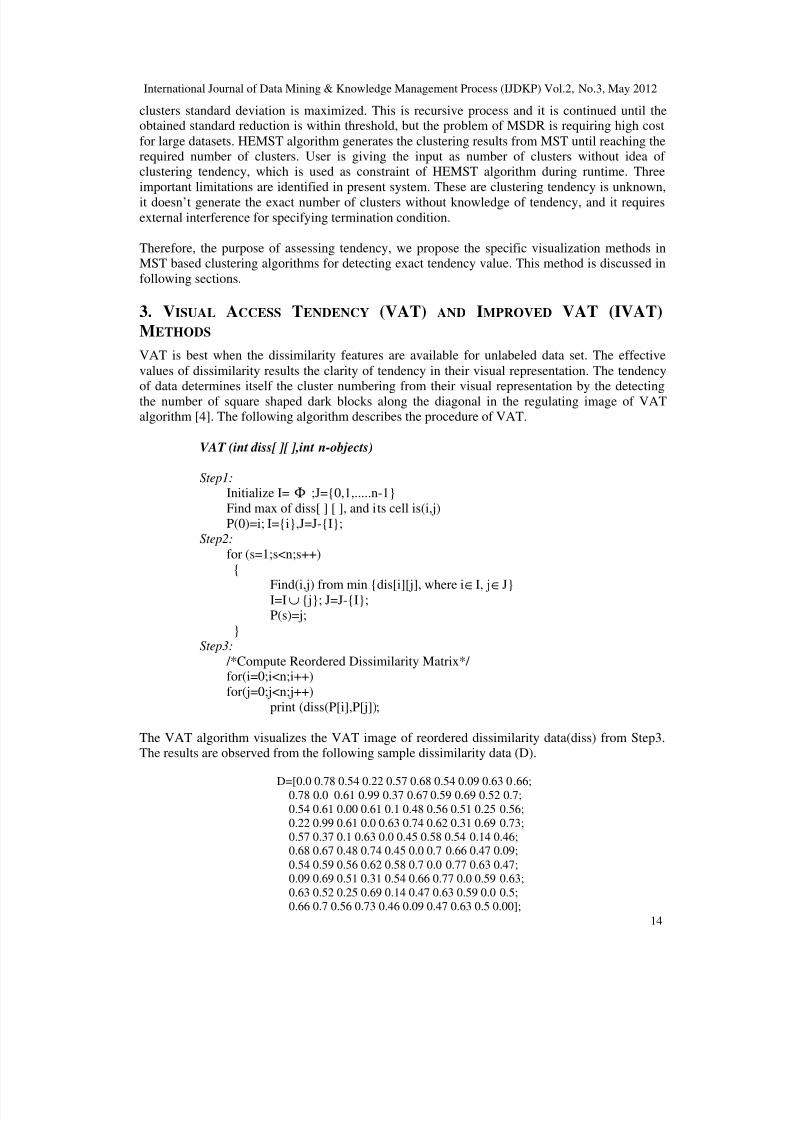
tendency. Visual results of VAT and IVAT are presented in the Fig.3 and Fig.4 for the 5-clusterd
synthetic data in Fig.2.
Fig. 2 Five-Clustered Data
5-clustered synthetic data is created in MATLAB editor. VAT and IVAT algorithms are appliedon 5-clusterd data sets. MST based clustering algorithm is improvised with IVAT for extracting
of correct tendency. Since clarity of visual results are obtained using IVAT version for toughcases data set.
Fig. 3 VAT Image for 5-Clustered Data
7/31/2019 Reducing Runtime Values in Minimum Spanning Tree Based Clustering by Visual Access Tendency
http://slidepdf.com/reader/full/reducing-runtime-values-in-minimum-spanning-tree-based-clustering-by-visual 6/12
International Journal of Data Mining & Knowledge Management Process (IJDKP) Vol.2, No.3, May 2012
16
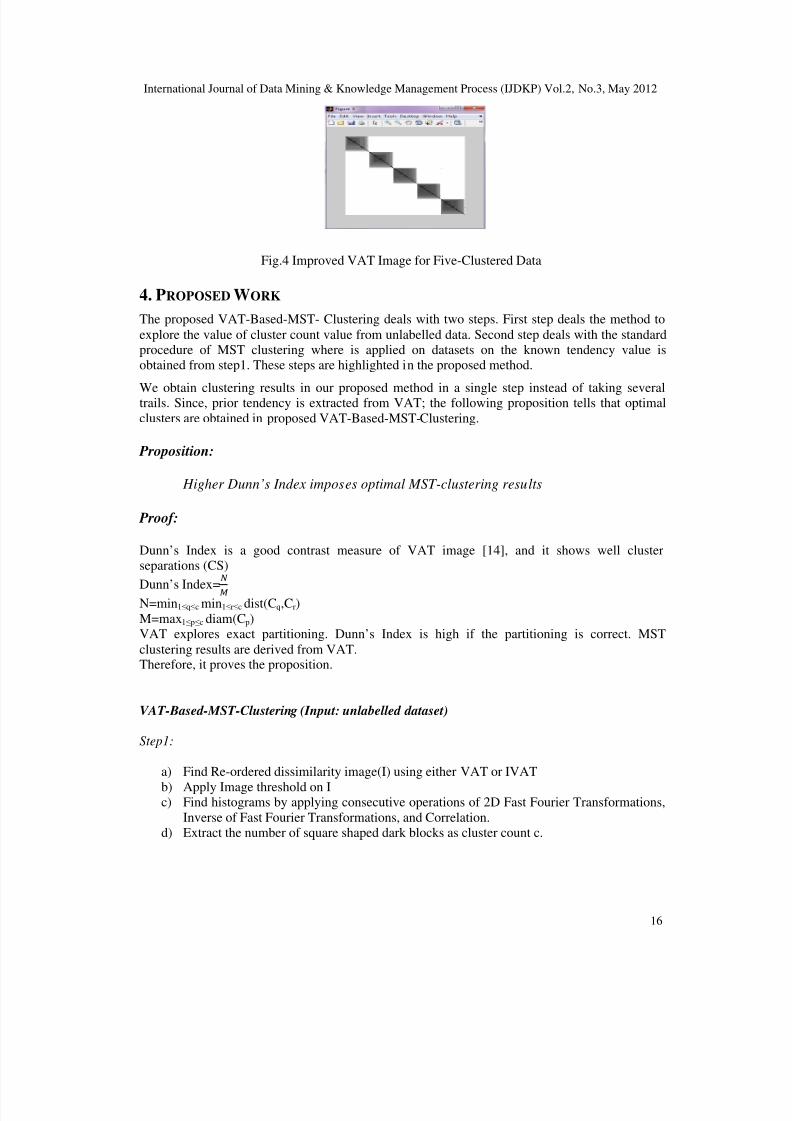
Fig.4 Improved VAT Image for Five-Clustered Data
4. PROPOSED WORK
The proposed VAT-Based-MST- Clustering deals with two steps. First step deals the method to
explore the value of cluster count value from unlabelled data. Second step deals with the standardprocedure of MST clustering where is applied on datasets on the known tendency value isobtained from step1. These steps are highlighted in the proposed method.
We obtain clustering results in our proposed method in a single step instead of taking severaltrails. Since, prior tendency is extracted from VAT; the following proposition tells that optimal
clusters are obtained in proposed VAT-Based-MST-Clustering.
Proposition:
Higher Dunn’s Index imposes optimal MST-clustering results
Proof:
Dunn’s Index is a good contrast measure of VAT image [14], and it shows well clusterseparations (CS)
Dunn’s Index=
N=min1≤q≤c min1≤r≤c dist(Cq,Cr)
M=max1≤p≤c diam(Cp)VAT explores exact partitioning. Dunn’s Index is high if the partitioning is correct. MST
clustering results are derived from VAT.Therefore, it proves the proposition.
VAT-Based-MST-Clustering (Input: unlabelled dataset)
Step1:
a) Find Re-ordered dissimilarity image(I) using either VAT or IVAT
b) Apply Image threshold on Ic) Find histograms by applying consecutive operations of 2D Fast Fourier Transformations,
Inverse of Fast Fourier Transformations, and Correlation.d) Extract the number of square shaped dark blocks as cluster count c.
7/31/2019 Reducing Runtime Values in Minimum Spanning Tree Based Clustering by Visual Access Tendency
http://slidepdf.com/reader/full/reducing-runtime-values-in-minimum-spanning-tree-based-clustering-by-visual 7/12

7/31/2019 Reducing Runtime Values in Minimum Spanning Tree Based Clustering by Visual Access Tendency
http://slidepdf.com/reader/full/reducing-runtime-values-in-minimum-spanning-tree-based-clustering-by-visual 8/12
International Journal of Data Mining & Knowledge Management Process (IJDKP) Vol.2, No.3, May 2012
18
(a) S-1 (b) S-2 (c) S-3
Fig. 7: Synthetic Datasets
In evaluation of result analysis, the existing system doesn’t have the prior value of clustering
tendency. External interference is required for clustering tendency. Because of this cause, theobtained results of existing system may or may not have good Dunn’s Index. The higher value of
Dunn’s Index indicates the good number of valid clusters for given data. Dunn’s Index is a metricfor evaluating of correct partitioning [14]. MST clustering algorithm is experimented severaltimes until getting the good Dunn’s Index. So, the problem of existing system is runtime.
Therefore, the proposed work first solves the problem of tendency by extracting of obtainedsquare shaped dark blocks, secondly it retrieves MST based clustering results based on tendency.
This procedure output the VAT image for input dataset. After that we apply 2D FFT, IFFT, and
correlation on getting VAT image. These steps are described by the authors of [15], and then weobtained histogram in Fig 8. Finally, the clustering number is extracted; it is referred as clustering
tendency.
Fig. 8: Histogram for Five Clustered Data
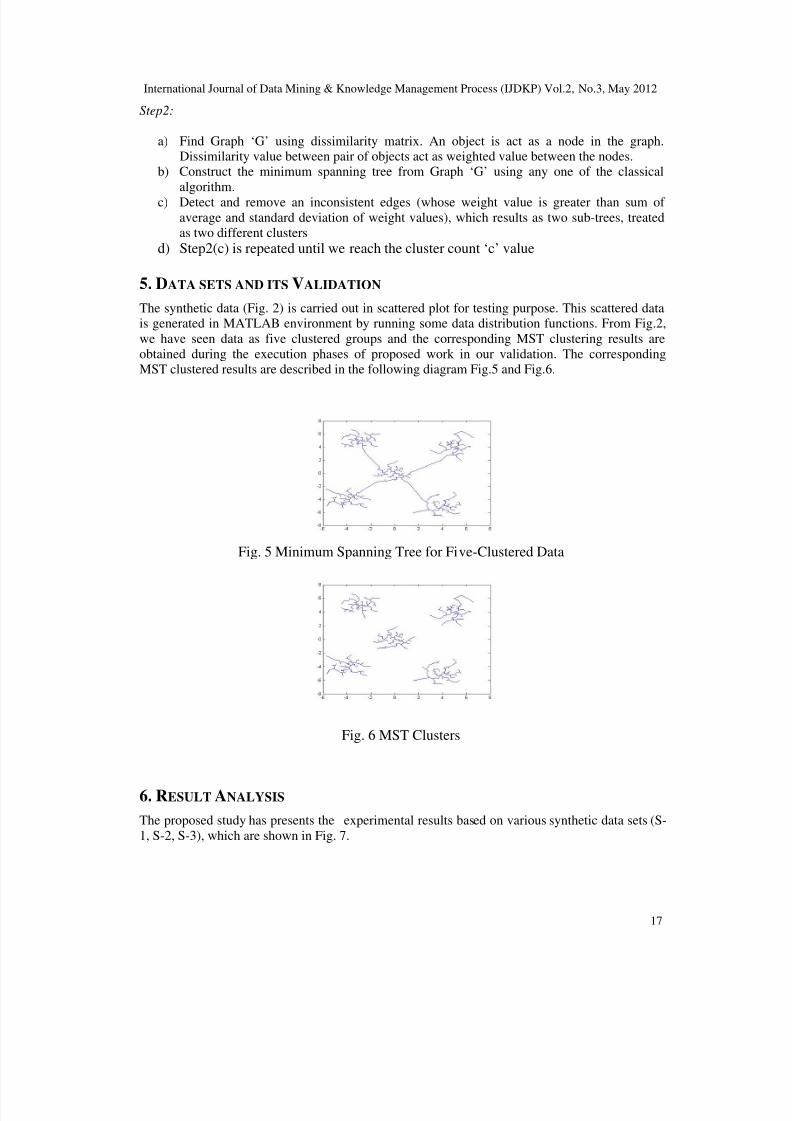
Basic MST clustering procedure uses this tendency value and form sub-tree shaped clusters. Eachsub tree cluster has collection of similar objects. These are described in Fig. 6
Fig.9a Iris-VAT Image Fig.9b Wine-VAT Image
7/31/2019 Reducing Runtime Values in Minimum Spanning Tree Based Clustering by Visual Access Tendency
http://slidepdf.com/reader/full/reducing-runtime-values-in-minimum-spanning-tree-based-clustering-by-visual 9/12
International Journal of Data Mining & Knowledge Management Process (IJDKP) Vol.2, No.3, May 2012
19
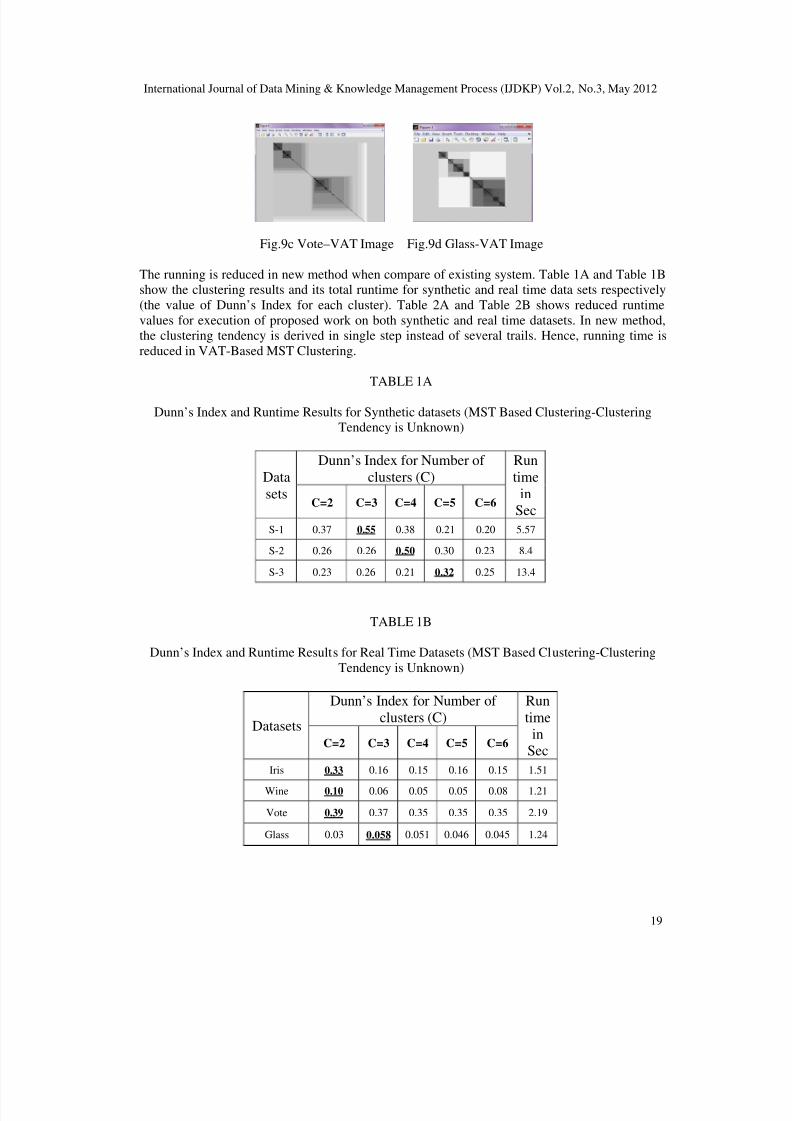
Fig.9c Vote–VAT Image Fig.9d Glass-VAT Image
The running is reduced in new method when compare of existing system. Table 1A and Table 1Bshow the clustering results and its total runtime for synthetic and real time data sets respectively
(the value of Dunn’s Index for each cluster). Table 2A and Table 2B shows reduced runtime
values for execution of proposed work on both synthetic and real time datasets. In new method,the clustering tendency is derived in single step instead of several trails. Hence, running time is
reduced in VAT-Based MST Clustering.
TABLE 1A
Dunn’s Index and Runtime Results for Synthetic datasets (MST Based Clustering-ClusteringTendency is Unknown)
Data
sets
Dunn’s Index for Number of
clusters (C)
Run
time
in
SecC=2 C=3 C=4 C=5 C=6
S-1 0.37 0.55 0.38 0.21 0.20 5.57
S-2 0.26 0.26 0.50 0.30 0.23 8.4
S-3 0.23 0.26 0.21 0.32 0.25 13.4
TABLE 1B
Dunn’s Index and Runtime Results for Real Time Datasets (MST Based Clustering-Clustering
Tendency is Unknown)
Datasets
Dunn’s Index for Number of
clusters (C)
Run
time
in
SecC=2 C=3 C=4 C=5 C=6
Iris 0.33 0.16 0.15 0.16 0.15 1.51
Wine 0.10 0.06 0.05 0.05 0.08 1.21
Vote 0.39 0.37 0.35 0.35 0.35 2.19
Glass 0.03 0.058 0.051 0.046 0.045 1.24
7/31/2019 Reducing Runtime Values in Minimum Spanning Tree Based Clustering by Visual Access Tendency
http://slidepdf.com/reader/full/reducing-runtime-values-in-minimum-spanning-tree-based-clustering-by-visual 10/12
International Journal of Data Mining & Knowledge Management Process (IJDKP) Vol.2, No.3, May 2012
20
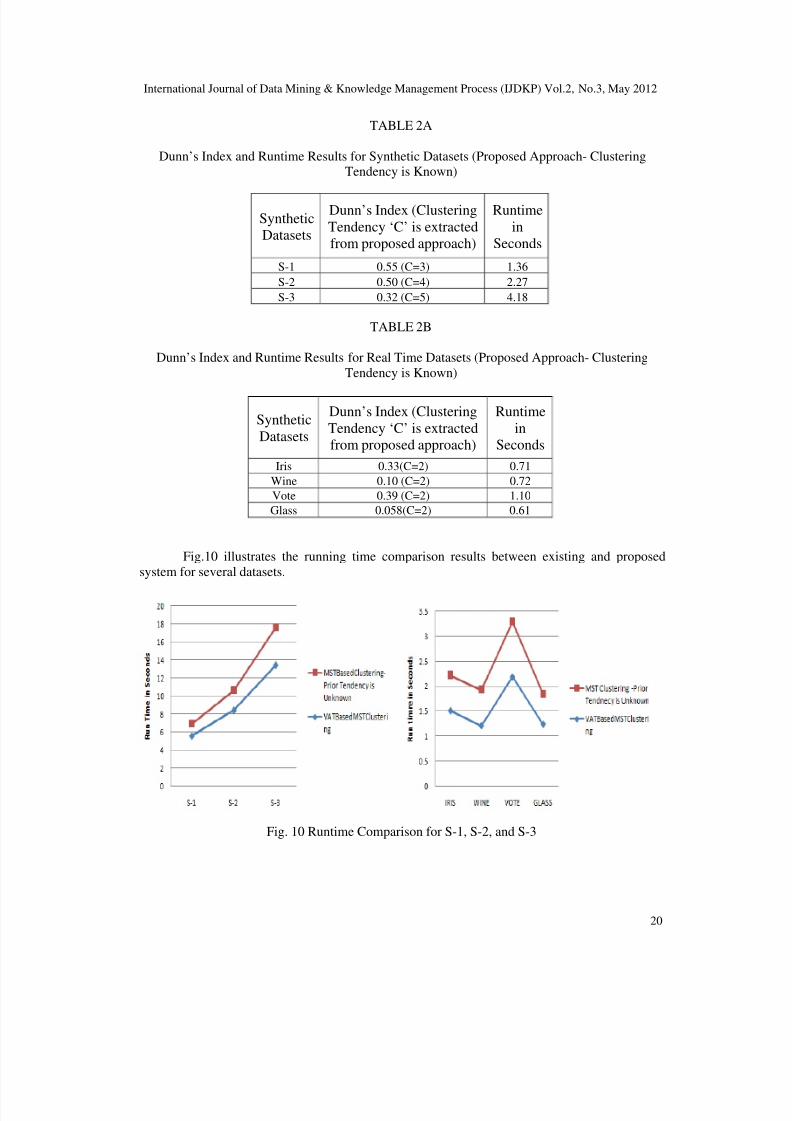
TABLE 2A
Dunn’s Index and Runtime Results for Synthetic Datasets (Proposed Approach- ClusteringTendency is Known)
Synthetic
Datasets
Dunn’s Index (Clustering
Tendency ‘C’ is extracted
from proposed approach)
Runtime
in
Seconds
S-1 0.55 (C=3) 1.36
S-2 0.50 (C=4) 2.27
S-3 0.32 (C=5) 4.18
TABLE 2B
Dunn’s Index and Runtime Results for Real Time Datasets (Proposed Approach- Clustering
Tendency is Known)
Synthetic
Datasets
Dunn’s Index (Clustering
Tendency ‘C’ is extracted
from proposed approach)
Runtime
in
Seconds
Iris 0.33(C=2) 0.71
Wine 0.10 (C=2) 0.72
Vote 0.39 (C=2) 1.10
Glass 0.058(C=2) 0.61
Fig.10 illustrates the running time comparison results between existing and proposed
system for several datasets.
Fig. 10 Runtime Comparison for S-1, S-2, and S-3
7/31/2019 Reducing Runtime Values in Minimum Spanning Tree Based Clustering by Visual Access Tendency
http://slidepdf.com/reader/full/reducing-runtime-values-in-minimum-spanning-tree-based-clustering-by-visual 11/12
International Journal of Data Mining & Knowledge Management Process (IJDKP) Vol.2, No.3, May 2012
21
7. CONCLUSION
Experimental results are tested on various synthetic datasets. Runtime and Dunns Index valuesare evaluated and compared in both existing and proposed systems. According to the results
analysis, we studied that proposed system requires less time than existing work and also concludethat proposed work produces high quality of clustering results after observing of Dunn’s Index
value. Dunn’s Index measures inter and intra distance values between pair of objects. Highervalue of Dunn’s Index concludes the good clustering results.
This proposed study majorly includes the ideas of finding tendency and clusters on synthetic data.
Spectral approach gives high quality clustering results on complex datasets such as high
dimensional data sets. Spectral approach requires high computational cost, but sampling methodsreduces this cost. The future scope of the work is to obtain best indexed clustering results by
techniques of sampling method and spectral approach in our proposed method.
REFERENCES
[1] L. Wang, T.Nguyen, J.Bezdek, C. Leckie , and K.Rammohanarao, “iVAT and aVAT: Enhancedvisual analysis for clustering tendency assessment” in Proc PAKDD,India, Jun 2010
[2] Timothy C. Havens, James C. Bezdek, “ An efficient formulation of the improved visual
assessment of cluster tendency” IEEE Trans on Knowledge and Data Engineering,Nov,2011
[3] A. Jain and R.Dubes, “Algorithms for clustering data”, Prentice-Hall,1988
[4] J.Bezdek and R.Hathaway, “VAT: A tool for visual assessment (cluster) tendency”, in Proc.
IJCNN, Honolulu, Hi,2002, pp.2225-30
[5] Wang,D.Mitchell, “ A Divide-and Conquer Approach for Minimum Spanning Tree-Based
Clustering”, Vol21,No 7, July 2009, pp:945-958
[6] M.Kendall and J.D Gibbons, “Rank correlation methods”,Newyork,oxford university press,1990
[7]
R.Prim, “Shortest Connection Networks and Some Generalization”, Bell systems technicalJournal, vol. 36,pp. 1389-1401,1957
[8] J. Kruskal, “On the Shortest Spanning Subtree and the Travelling salesman Problem:,
Proc.Am.Math.Soc.,pp 48-50,1956
[9] C.T. Zahn. “Graph theoretical methods for detecting and describing gestalt clusters”, IEEE Trans.
Computers,vol. 20,no.1, pp. 68-86, Jan. 1971
[10] Ying Xu, Victor Olman, Dong Xu, “Minimum spanning trees for gene expression data clustering”,
Genome Informatics 12:pg 24-33,2001
[11] M.Laszlo, and S.Mukerjee, “Minimum spanning tree partitioning algorithm for
microaggregation” , IEEE Trans. Knowledge and Data Engineering, vol 17, no 7, pp 902-911, July
2005
[12] A. Vathy-Fogarassy , A.Kiss, and J.Abnoyi,”Hybrid Minimal Spanning tree based clustering and
mixture of Gaussians based clustering algorithm”, Foundations of Information and Knowledgesystems, pp 313-330, Springer, 2006.
[13] O.Grygorash, Yan Xhpu, Zach Jorgenson, “ Minimum spanning tree based clustering algorithms”
[14] T.C. Havens, J.C.Bezdek, J.M.Keller,M. Popescu, “ Dunn’s Cluster Validity Index as Contrast
Measure of VAT Images” Int Conf IEEE 2008
[15] I.J.Sledge, J.M Huband, J.C. Bezdek, “(Automatic) Cluster Count Extraction from Unlabeled Data
Sets”, Fifth International Conf. On Fuzzy Systems and Knowledge Discovery, IEEE computer
society, pg3-13
7/31/2019 Reducing Runtime Values in Minimum Spanning Tree Based Clustering by Visual Access Tendency
http://slidepdf.com/reader/full/reducing-runtime-values-in-minimum-spanning-tree-based-clustering-by-visual 12/12
International Journal of Data Mining & Knowledge Management Process (IJDKP) Vol.2, No.3, May 2012
22
[16] J.Han and M.Kamber (2002) : Data Mining: concepts and techniques, Elsever
[17] J.L Bentley and J.H Friedman, “Fast algorithms for constructing minimal spanning trees in
coordinate spaces”, IEEE Trans computers vol 27 no 2, pp 97-105
[18] R. R.Shamir; D.Tsur,” Cluster graph modification problems. In LNCSI ,pp379-390,springer
[19] ArunK.Pujari:DataMining Techniques”, Universities Press,2001
[20] M.Ester; P. Kriegel; J. Sander; X.xu,” A density based algorithm for discovering clusters in large
databases with noise” ,Int Conference on knowledge discovery and data mining 1996 ,pp 226-231
[21] W. Wang; J. Yang; R. Muntz,” STING: A statistical information grid approach to spatial datamining”, Int Conf on very large data bases, pp 186-195
Authors Biography
Dr. B. Eswara Reddy Graduated in B.Tech.(CSE) from Sri Krishna Devaraya
University in 1995. He received Masters Degree in M.Tech.(Software Engineering),
from Jawaharlal Nehru Technological University, Hyderabad, in 1999. He received
Ph.D in Computer Science & Engineering from Jawaharlal Nehru TechnologicalUniversity, Hyderabad, in 2008. He served as Assistant Professor from 1996 to 2006.
He is working as Associate Professor in CSE Dept., since 2006 and currently acting as
Head of CSE Dept at Jawaharlal Nehru Technological University Anantapur,
Anantapur. He has more than 30 Publications in various International Journals and
Conferences. He is one of the author’s of the text book titled Programming with Java published by
Pearson/Sanguine Publishers. His research interests include Pattern Recognition & Image Analysis, Data
Warehousing & Mining and Software Engineering. He is a life member of ISTE, IE, ISCA and member of
CSI and IEEE
Mr. K. Rajendra Prasad Graduated in B.Tech(CSE) from Jawaharlal Nehru
Technological University, Hyderabad in 1999. He received Masters Degree in
M.Tech(CSE) from Visvesvaraya Technological University, Belgaum ,in 2004.Presently, he is a research scholar at JNTUA, Anantapur. He is a life member of
CSI. His research interests are data mining &data warehousing, and databases.