Embed Size (px)
Citation preview

A summary of findings and quantitative investigation targeted at:
Reducing Infant Mortality in Indiana
December 2014

Contents
I Summary of Findings 21.1 Introduction . . . . . . . . . . . . . . . . . . . . . . . . . . . . . . . . . . . . . . . . . . . . 3
1.1.1 Data Sourcing . . . . . . . . . . . . . . . . . . . . . . . . . . . . . . . . . . . . . . 3
1.1.2 Predictive Models . . . . . . . . . . . . . . . . . . . . . . . . . . . . . . . . . . . . 3
1.2 Findings . . . . . . . . . . . . . . . . . . . . . . . . . . . . . . . . . . . . . . . . . . . . . . 4
1.2.1 Number of Prenatal Visits the Key Predictor of Birth Outcomes . . . . . . . . . . 4
1.2.2 The Effects of Maternal Age, Medicaid status, and Prenatal Visits on the Risk ofBirth Outcomes . . . . . . . . . . . . . . . . . . . . . . . . . . . . . . . . . . . . . . 5
1.2.3 Fiscal Impacts in High-Risk subpopulation . . . . . . . . . . . . . . . . . . . . . . 6
1.2.4 Negated Predictive Power of Other Variables . . . . . . . . . . . . . . . . . . . . . 6
1.3 Applying the Findings: Birth Outcome Risk Quantification . . . . . . . . . . . . . . . . . 7
II Quantitative Investigation Methodology 92.1 Introduction . . . . . . . . . . . . . . . . . . . . . . . . . . . . . . . . . . . . . . . . . . . . 10
2.2 Methods . . . . . . . . . . . . . . . . . . . . . . . . . . . . . . . . . . . . . . . . . . . . . . 10
2.2.1 Data Collection . . . . . . . . . . . . . . . . . . . . . . . . . . . . . . . . . . . . . . 10
2.2.2 Logistic Regression Modeling . . . . . . . . . . . . . . . . . . . . . . . . . . . . . . 11
2.2.3 Self-Organizing Maps . . . . . . . . . . . . . . . . . . . . . . . . . . . . . . . . . . 11
2.2.4 Identification of High-Risk Clusters . . . . . . . . . . . . . . . . . . . . . . . . . . . 12
2.2.5 Analysis of High-Risk Cluster Populations . . . . . . . . . . . . . . . . . . . . . . . 12
2.3 Results of Technical Analysis . . . . . . . . . . . . . . . . . . . . . . . . . . . . . . . . . . 12
2.4 Summary and Conclusions . . . . . . . . . . . . . . . . . . . . . . . . . . . . . . . . . . . . 14
List of Figures
1.1 Estimated low birth weight probability due to number of prenatal visits . . . . . . . . . . 4
1.2 Estimated probability of mother’s Medicaid enrollment at birth . . . . . . . . . . . . . . . 5
1.3 Estimated probability of fewer than 10 prenatal visits . . . . . . . . . . . . . . . . . . . . 6
1.4 Calculated risk of low birth weight by county . . . . . . . . . . . . . . . . . . . . . . . . . 8
2.5 Marginal estimated probability of low birth weight as a function of maternal age, prenatalvisits, and Medicaid illustrated as a boxplot factored by maternal age. . . . . . . . . . . . 15
ii

Infant Mortality Stakeholder Impact List of Figures
2.6 Marginal estimated probability of low birth weight as a function of maternal age, prenatalvisits, and Medicaid illustrated as a boxplot factored by prenatal visit count. . . . . . . . 16
2.7 Empirical density distributions of mothers age at time of birth, separated by Medicaidstatus. . . . . . . . . . . . . . . . . . . . . . . . . . . . . . . . . . . . . . . . . . . . . . . . 17
2.8 Marginal estimated probability of a mother receiving fewer than 10 prenatal visits as afunction of age of Medicaid status. . . . . . . . . . . . . . . . . . . . . . . . . . . . . . . . 17
2.9 Marginal estimated probability of a mother recieving Medicaid benefits as a function of age. 182.14 Distribution of factors within the high risk subpopulations identified via SOM. . . . . . . 23
iii

Infant Mortality Stakeholder Impact Executive Summary
Executive Summary
At the direction of Governor Mike Pence, reducing infant mortality became the top priority of the IndianaState Department of Health (ISDH) in January 2013. Indiana falls at the bottom 20% of all states forthis frontline measure of health [1]. In 2011, Indiana’s infant mortality rate was 7.7 deaths per 1,000 livebirths, well below the Healthy People 2010 goal of 6.0 deaths per 1,000 live births and the subsequentHealthy People 2020 goal of 4.5 deaths per 1,000 live births [2]. While the nationwide infant mortalityrate declined 12% from 2005 through 2011, Indiana was among the states the Centers for Disease Control& Prevention classified as showing “no significant change” during that time [1].
To address this situation, the state of Indiana commissioned a data-driven analysis centered on infantmortality that unified information from previously unlinked sources across state agencies. The KSMConsulting (KSMC) team utilized sophisticated machine learning techniques on the available data toidentify highly granular at-risk subpopulations and provide actionable insights for stakeholders andpolicy makers.
Findings from this analysis included:
• Infant mortality risk in the state of Indiana is not randomly distributed, but exhibits statisticallysignificant patterns that could be used for targeted investment of resources to improve outcomes.
• Inadequate prenatal care, Medicaid enrollment, and young maternal age were shown to be thestrongest predictors for adverse birth outcomes.
• While the identified high-risk subpopulations account for only 1.6% of all births in Indiana, theyaccount for nearly 50% of infant deaths, suggesting that the identified subpopulations are not onlysignificant, but could be used as the basis for targeted interventions.
Empowered with the results of analysis, the KSMC team developed a set of predictive algorithms thatquery data, predicts birth outcome risk for various levels of granularity, and writes the quantitative resultsback to a database. This “Birth Outcome Risk Quantification” tool is dynamic in nature, allowing futureanalysts to explore a multitude of questions related to infant mortality by including new variables orfocusing on specific subpopulations. By applying this tool to available data, the state of Indiana canperform continuous analysis and find new ways to connect at-risk mothers with the resources that willsupport a positive birth outcome.
This document is structured in two main sections: a non-technical section explaining findings and atechnical section providing mathematical background on the algorithmic approach taken to gain a morecomplete, fundamental understanding of the underlying causes of infant mortality.
1

Part I
Summary of Findings
2

Infant Mortality Stakeholder Impact 1.1. Introduction
1.1 Introduction
This document will detail findings and explain analytical methods for identifying demographically andspatially stratified subpopulations with risk factors associated with adverse birth outcomes. The inte-grated datasets contained information on health, financial history, demographics, insurance, criminalhistory, maltreatment, and domicile and treatment locations. The KSMC team employed statisticalmachine learning techniques, as described in detail in Part II, to build predictive models that estimaterisk for adverse birth outcomes as a function of available data.
1.1.1 Data Sourcing
Infant mortality has been studied extensively by public health researchers and many of its contributingfactors are well known, including low birth weight [3], premature births [4, 5], smoking while pregnant[6], Sudden Infant Death Syndrome (SIDS)/unsafe sleep [7], and lack of prenatal care [8]. Thoughresearchers have thoroughly investigated infant mortality and related health issues, previous efforts werebased on narrow datasets focusing solely on one or two previously known phenomenon. After completinga thorough literature review in the area of infant mortality, infant morbidity, and child death, the KSMCteam was able to identify recurring conclusions drawn and gaps in existing scientific and clinical research.These aided in defining the direction and course of investigation informed the data selection methodologyemployed.
After evaluating a large collection of state data resources, the KSMC team narrowed scope to examinevariables from 17 integrated datasets (from 5 agencies and 4 public sources). Due to the fact that low birthweight and preterm birth is highly correlated with infant deaths in Indiana, the KSMC team expandedthe population of infants with adverse birth outcomes to include not only deaths, but also to includeinfants born with low birth weight and preterm birth [3, 5]. After profiling and single-source data analysiswas completed, variables or fields were selected and data extraction jobs were built to normalize andload data into an advanced analytics environment and table schema designed for integrated (horizontal)analysis. The KSMC team then analyzed integrated data to determine that 7 datasets contained variableswith predictive power that could enable targeted interventions. For an in-depth description of the dataused in this analysis, consult the Data Collection section of Part II.
1.1.2 Predictive Models
By applying machine learning and logistic regression techniques, described in detail in Part II, to inte-grated data, the KSMC team identified models for estimating the risk of adverse birth outcomes basedon maternal age, Medicaid status, and use of prenatal care with regional and demographic stratificationat the ZIP code level. As a result of this analysis, high-risk subpopulations were identified that, whileaccounting for only 1.6% of the population, account for nearly 50% of all infant deaths.1 The identifiedsubpopulations were statistically significant, and can likely form the basis for targeted demographic andregional interventions.
1Deaths that fall in the other 50% are largely due to unpreventable congenital/chromosomal abnormalities or accidents.
3

Infant Mortality Stakeholder Impact 1.2. Findings
1.2 Findings
1.2.1 Number of Prenatal Visits the Key Predictor of Birth Outcomes
Of all factors studied, number of prenatal visits was the most significant predictor of adverse birthoutcomes. Figure 1.1 shows the risk of low birth weight was highest for individuals with 0-5 visits anddecreased steadily to a minimum at 15-20 visits. The data indicate that 64.9% of infant deaths were tomothers with fewer than 10 prenatal visits.
Figure 1.1: Estimated low birth weight probability due to number of prenatal visits
4
Infant Mortality Stakeholder Impact 1.2. Findings
1.2.2 The Effects of Maternal Age, Medicaid status, and Prenatal Visits onthe Risk of Birth Outcomes
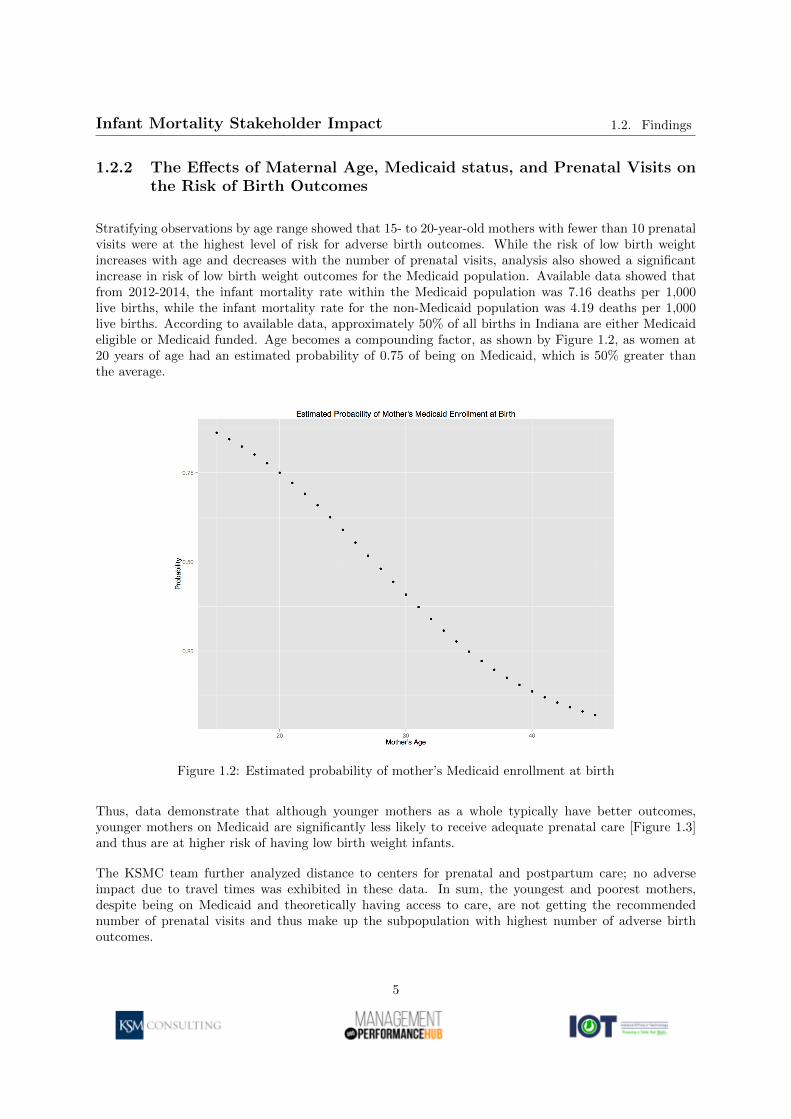
Stratifying observations by age range showed that 15- to 20-year-old mothers with fewer than 10 prenatalvisits were at the highest level of risk for adverse birth outcomes. While the risk of low birth weightincreases with age and decreases with the number of prenatal visits, analysis also showed a significantincrease in risk of low birth weight outcomes for the Medicaid population. Available data showed thatfrom 2012-2014, the infant mortality rate within the Medicaid population was 7.16 deaths per 1,000live births, while the infant mortality rate for the non-Medicaid population was 4.19 deaths per 1,000live births. According to available data, approximately 50% of all births in Indiana are either Medicaideligible or Medicaid funded. Age becomes a compounding factor, as shown by Figure 1.2, as women at20 years of age had an estimated probability of 0.75 of being on Medicaid, which is 50% greater thanthe average.
Figure 1.2: Estimated probability of mother’s Medicaid enrollment at birth
Thus, data demonstrate that although younger mothers as a whole typically have better outcomes,younger mothers on Medicaid are significantly less likely to receive adequate prenatal care [Figure 1.3]and thus are at higher risk of having low birth weight infants.
The KSMC team further analyzed distance to centers for prenatal and postpartum care; no adverseimpact due to travel times was exhibited in these data. In sum, the youngest and poorest mothers,despite being on Medicaid and theoretically having access to care, are not getting the recommendednumber of prenatal visits and thus make up the subpopulation with highest number of adverse birthoutcomes.
5

Infant Mortality Stakeholder Impact 1.2. Findings
Figure 1.3: Estimated probability of fewer than 10 prenatal visits
1.2.3 Fiscal Impacts in High-Risk subpopulation
Infants born in the high-risk subpopulations who do not die still have significant related medical costs thatcould be reduced. Nearly 60% of low birth weight outcomes occurred within the Medicaid population,while only 40% occurred in the non-Medicaid population. Although these low birth weight infantsonly account for 5% of births, they account for approximately 35% of annual Medicaid expenses forinfants.
1.2.4 Negated Predictive Power of Other Variables
Although results of data science showed prenatal visits, Medicaid status, and mother’s age exhibited themost predictive power, the KSMC team explored and can report on the significance of other known riskfactors.
Early analysis showed that while significant racial disparities in birth outcomes exist, this disparity isdriven primarily by socio-economic factors. Young, low-income women, on Medicaid, regardless of race,tended to have poor birth outcomes. Additionally, no spatial clustering effects could not be explainedwith available data; thus, strictly environmental factors such as air quality or groundwater contaminationwere not analyzed due to the unlikelihood of significant findings.
While ISDH expressed interest in the impact of birth order, no method could consistently and accuratelydetermine birth order in the data. Analysis of the available birth order data yielded no significantfindings on the impact of birth order. Smoking was determined to be statistically significant as afactor influencing birth outcomes. However, the KSMC team identified no specific subpopulation overly
6

Infant Mortality Stakeholder Impact1.3. Applying the Findings: Birth Outcome Risk
Quantification
correlated with smoking in the available data. Deaths related to asphyxiation, including S.I.D.S., co-sleeping, and maltreatment show only a random trend, meaning the available data provides no variableswith predictive power.
1.3 Applying the Findings: Birth Outcome Risk Quantifica-tion
Results of extensive analysis enabled the KSMC team to create a dynamic tool that allows users to definevariables (e.g., age, ZIP code, number of prenatal visits) and calculate the risk of birth outcomes (e.g.,low birth weight). Users can also use group individuals into high-risk subpopulations, uniquely providingpublic health experts and policy officials the ability to digest information about risk, understand wherethese at-risk populations live, investigate factors as they wish, and target interventions (who, where, andwhy). The tool offers a level of granularity that allows the state to operate in a more precise way - ZIPcodes permit more policy differentiation than that offered by county-level analysis. It is clear that notall ZIP codes within a city are equal in terms of risk, indicating interventions can and should be muchmore targeted.
One key feature of this tool is that while a basic assessment of risk can be done with traditional statisticalmethods, neither the rigorous calculations nor the grouping of individuals into subpopulations can.Analysts now have a way to look at things in rigorously defined “buckets,” each of which provides valuableinformation about at-risk subpopulations. Inferences about causal relationships between characteristicsof the individual and the subpopulation to which the individual belongs can be made with much morestatistical validity than before. Researchers are now empowered to learn about trends over time andrigorously examine the efficacy of programs.
The machine learning algorithm both determines the significance of user-specified inputs, and calculatesthe risk of low birth weight. KSMC then integrated the results of calculations with SAP Lumira togenerate dynamic dashboards, such as the county-level risk calculation information displayed in Figure1.4 to help analysts, policy-makers, and other stakeholders better understand the distribution of riskamong a variety of subpopulations.
Furthermore, the tool’s predictive power can grow as one defines new parameters: the model easilyallows researchers to iterate by adding additional, relevant information over time. One could identifytrends over time, understand the effects of a new program, and/or identify new high-risk subpopulations.This particular project examined all mothers regardless of age, race, location, Medicaid status, etc. Butresearchers using the tool can also create a subset of interest beforehand (Medicaid only, certain age group,certain county, etc.) and then the algorithm will group subpopulations of that subset into distinct high-risk buckets. For example, currently the risk profile of women on Medicaid is significantly different thanthe population at large. In sum, even the risk tool itself goes beyond a generic approach, as changingpopulation inputs allow future users to address specific research questions.
7

Infant Mortality Stakeholder Impact1.3. Applying the Findings: Birth Outcome Risk
Quantification
Figure 1.4: Calculated risk of low birth weight by county
8

Part II
Quantitative InvestigationMethodology
9

Infant Mortality Stakeholder Impact 2.1. Introduction
2.1 Introduction
This study concerned the development of a robust methodology for identifying demographically andspatially stratified subpopulations with risk factors for adverse birth outcomes, and was commissionedby the State of Indiana as part of an ongoing effort to reduce its high infant morality rate. The quantity,high dimensionality, heterogeneity, and varying quality and completeness of the data available mademany of the traditional statistical tools of epidemiology ill suited for the task at hand. The statisticalproblem was twofold: 1) use clustering techniques to identify population segments (principal components)associated with known risk factors and 2) quantify the probability of an adverse outcome for eachidentified cluster.
Standard methods within principal component analysis (PCA), which is a widely used class of techniquesfor dimensionality reduction in high-dimensional datasets, are weakly founded on assumptions of systemlinearity and are unable to directly handle multi-scale and categorical data. Kohonen’s self-organizingmap (SOM) algorithm is a neural-network-based, nonlinear generalization of PCA capable of handlinghigh-dimensional and multi-scale datasets by producing a two-dimensional mapping of data while main-taining the topological structure of the input feature space [9, 10]. The two-dimensional representationof the input data promotes exploratory visual analysis of high-dimensional datasets, which allows forthe development of a meaningful portrait of the latent multivariate patterns and clustering behaviorexpressed in the data [10, 11].
SOMs have found numerous applications in academia and industry alike, from the analysis of DNAmicro-arrays in cancer research to demographic and behavioral population segmentation in consumermarketing [10, 11]. The ease with which SOMs handle multi-scale, nonlinear systems make them idealtools for epidemiological analysis, and in recent years a small number of applications papers have beenpublished on the topic [12].
This report details the application of the SOM technique to the identification of high-risk subpopulationsreflected in the State of Indiana data. These datasets consisted of individual vital records, Medicaidclaims, income tax records, and census information. While the high-risk population clusters accounted for1.6% of the sample population, they accounted for nearly 50% of all deaths, which suggested that the SOMtechnique was a viable mechanism for the identification of at-risk populations and individuals.
2.2 Methods
2.2.1 Data Collection
The data selection process began by conducting guided discovery sessions with state agency leadership,subject matter experts, program directors, and system administrators from the following agencies withinthe State of Indiana: Department of Health, Family and Social Services Administration, Departmentof Child Services, Department of Revenue, Department of Local Government Finance, Department ofCorrections, Department of Workforce Development
These discovery sessions were designed to gain a high-level understanding of the data collected by theagencies, collection methodologies, source data systems, potential data quality issues, and to obtainrelevant system and data documentation. From this initial information gathering process, it was possibleto determine the breadth of data available, system interconnectivity, and areas in which informationcontained in these systems overlapped.
10

Infant Mortality Stakeholder Impact 2.2. Methods
Based on these interactions, a subset of the systems and data sources expected to deliver the highestlevel of diverse information content from those available was selected for further analysis. This furtheranalysis consisted of data profiling and statistical analysis. Data profiling is a set of automated processesdesigned to build a better understanding of data quality, data formats, ranges of content in each field, anddatabase table schema. The type and range of statistical analysis performed was data set dependent, butgenerally consisted of various types of value field distribution analysis, comparisons of distribution shapesto external research publications, correlation analyses among variables in the datasets, and comparisonof geospatially or similar count-level data to published population distributions.
After profiling and single-source data analysis was complete, variables or fields were selected and dataextraction jobs were built to normalize load data into the advanced analytics environment and tableschema for integrated (horizontal) analysis. The following datasets constituted the corpus of data thatincluded individuals born within the period from 2012 to 2014: vital records and maternal and childhealth (MCH), both maintained by the Indiana Department of Health; Medicaid claims data, maintainedby the Family and Social Services Administration; tax data, maintained by the Indiana Department ofRevenue; and open source data including 2012 Census data.
These datasets encompassed commonly collected birth information, demographic information about theparents, Medicaid claims information for mothers from 3 months prior to pregnancy to 2 years afterpregnancy, and Medicaid claims information for children from birth to 2 years after birth. Informationon the mothers 2011, 2012, and 2013 taxable income, where available, came from the Department ofRevenue. In total, the available database contained 216,488 records. Census population statistics on aZIP code level provided insight into the spatial variation of risk factors.
2.2.2 Logistic Regression Modeling
Given the quantity of data available and the large number of potential features, analysis began bymodeling the probability of high-risk birth outcomes as a function of their known risk factors with logisticregression, which is a statistical classification and modeling technique for predicting the probability of abinary outcome [13]. Coefficients of each fitted model are interpreted as odds coefficients that can be usedto compute the marginal probability of a binary outcome as a function of a set of independent variables.The intent of this analysis was to ensure that the data available demonstrated trends consistent withthe current scientific and clinical literature regarding known risk factors for infant mortality and otheradverse birth outcomes.
Statistical analysis of the data commenced with logistic regression to model the probability of 1) abirth below 2500 grams based upon maternal age, the number of prenatal visits, and Medicaid status,2) the probability that a mother will receive fewer than the minimum recommended 10 prenatal visitsbased upon her age and Medicaid status, and 3) the probability that a mother will be on Medicaid asa function of her age. The statistical modeling tools within the generalized linear modeling packages inthe R statistical library computed fitted residuals, power calculations, and confidence intervals on thefitted coefficients for each of the fitted models.
2.2.3 Self-Organizing Maps
Self-organizing maps are a form of neural network that can be used to identify a two-dimensional em-bedding of a set of high-dimensional observations while preserving the topological properties of the inputspace [9]. The technique maps discrete observations to a pre-determined grid of nodes based upon mutualsimilarity, which is assessed using an arbitrary norm or distance metric. Elements mapping to the same
11

Infant Mortality Stakeholder Impact 2.3. Results of Technical Analysis
nodes are more similar to each other than to observations mapping to disparate nodes; adjacent nodesare more similar to each other than to others. This mapping affects a nonlinear, spatially constrainedform of k-means clustering on the data [9]. SOMs permit visualization by mapping an ordered grid ofelements and coloring nodes in the grid by vector units corresponding with the input feature of interest.In this manner, patterns expressed across variables may be easily observed.
2.2.4 Identification of High-Risk Clusters
Due to varying recommendations for prenatal care levels and clinical opinions on cutoff levels for birthweight and gestational age defining high-risk births, a trained SOM was used to identify clusters in thecontinuum of all three factors that could be used to identify high-risk subpopulations. The KSMC teamused R statistical programming language and the kohonen R package to carry out the entirety of theSOM analysis [11].
The SOM first initialized a 20x20 grid of nodes and then trained over the course of 100 iterations at alearning rate from 0.05 to 0.01, controlling the rate of convergence and preventing over-fitting [11]. Ahierarchical cluster analysis performed on the set of code vectors permitted the representation of theaverage vector within each node in the SOM grid.
This procedure resulted in the identification of eight distinct clusters with varying expression levels forboth the training factors and other independent variables. Kruskal-Wallis tests (non-parametric analogsto ANOVA) on these clusters yielded statistically significant values for the variability between clusters.Upon computing intra-cluster distributions of mortality rates and other factors, the plotting functionsin R were used to create visualizations of them using color-coded hexagonal maps of SOM factors andbox plots.
2.2.5 Analysis of High-Risk Cluster Populations
An additional SOM was used to extract a subset of 4161 individual observations belonging to the high-risk clusters identified in the previous section, using prenatal visits, maternal age, estimated gestation,birth weight, Medicaid status, mother’s ZIP code, census population, census income, and distance to thenearest hospital by ZIP code as features. The intent of this secondary SOM analysis was to reduce thesignal-to-noise ratio inherent in such high-dimensional datasets.
The second SOM was initialized to a 10x10 grid of nodes and then trained over the course of 100iterations at a learning rate from 0.05 to 0.01, preceding a hierarchical cluster analysis on the set ofcode vectors extracted by the SOM for each node. This analysis concluded with the identification ofsix distinct clusters representing different at-risk subpopulations with higher spatial and demographicgranularity. SOM mapping techniques produced inter- and intra-cluster distributions of these factors ina visual format.
2.3 Results of Technical Analysis
Logistic regression analysis performed on the set of known risk factors for adverse birth outcomes identi-fied empirical probability density estimates. Figures 2.5 and 2.6 show estimates of the probability of lowbirth weight (defined as a birth weight below 2500 grams) as conditionals of maternal age and prenatalvisits, respectively. Figure 2.5 specifically shows a box plot of the probability of low birth weight as
12

Infant Mortality Stakeholder Impact 2.3. Results of Technical Analysis
a function of maternal age, with the probabilities over the range of prenatal visits shown at each agelevel; the inverse of this is true for Figure 2.6. In each case, Medicaid and non-Medicaid populations aredenoted as distinct curves with separate bars. Table 2.1 reports the estimates of the model coefficientsalong with their p-value estimates and 95% confidence intervals. These results indicate that the risk oflow birth weight increases with age and decreases with the number of prenatal visits; it is also clear fromthese results that there is a significant increase in risk of low birth weight outcomes for the Medicaidservice population.
Table 2.1: Logistic regression of low birth weight odds as a function of maternal age, prenatal visits, andMedicaid status.
Variable Odds Ratio Std. Err. z-score p-value Lower 2.5% Upper 97.5%Maternal Age 1.014 1.148e−3 9.442 < 2e−16 1.011 1.017Prenatal Visits 0.8874 2.091e−3 -57.13 < 2e−16 0.8838 0.8911Medicaid Status 1.396 1.768e−3 18.87 < 2e−16 1.348 1.445
Figure 2.8 shows estimates of the probability of inadequate prenatal care (defined as having fewer than10 prenatal care visits) as a function of maternal age and Medicaid status.
Table 2.2: Logistic regression of odds of a mother receiving adequate prenatal care as a function ofmaternal age and Medicaid status.
Variable Odds Ratio Std. Err. z-score p-value Lower 2.5% Upper 97.5%Maternal Age 0.9896 1.117e−3 -16.67 < 2e−16 0.9887 0.9914Medicaid Status 1.617 13.49e−3 8.515 < 2e−16 1.583 0.8911
These findings indicate that younger mothers, particularly those within the Medicaid population, aresignificantly less likely to receive adequate prenatal care and thus have low birth weight infants, whichled to an additional analysis of the age distribution of the Medicaid and non-Medicaid populations.Figure 2.7 shows a histogram of the age distribution of all mothers in the available dataset overlaid withkernel density estimates of the age distributions of the Medicaid and non-Medicaid populations; visualinspection of these figures reveals that the age distribution of the Medicaid population follows a rightskewed normal distribution, suggesting that younger mothers are more likely to be on Medicaid.
To test this notion, a logistic regression on the data estimated the probability that a mother would beenrolled in Medicaid at the time of birth as a function of age; Figure 2.9 shows this estimated probabilitydistribution. Table 2.3 reports the estimates of the model coefficients along with their p-value estimatesand 95% confidence intervals. The mean and median age of mothers in the available dataset was 27 yearsand the estimated probability of a mother being on Medicaid was approximately 0.5. This is consistentwith the fact that nearly half of all births in both Indiana and the United States as a whole are coveredby Medicaid. In contrast, women aged 20 had an estimated probability of 0.75 of being on Medicaid,which is 50% greater than the average. The 2012 Indiana Natality Report completed by the IndianaDepartment of Health corroborates these findings [17].
Table 2.3: Logistic regression of odds of a mother recieving Medicaid benefits at the time of birth as afunction of age.
Variable Odds Ratio Std. Err. z-score p-value Lower 2.5% Upper 97.5%Maternal Age 0.8632 9.075e−4 -162.1 < 2e−16 0.8617 0.9914
13

Infant Mortality Stakeholder Impact 2.4. Summary and Conclusions
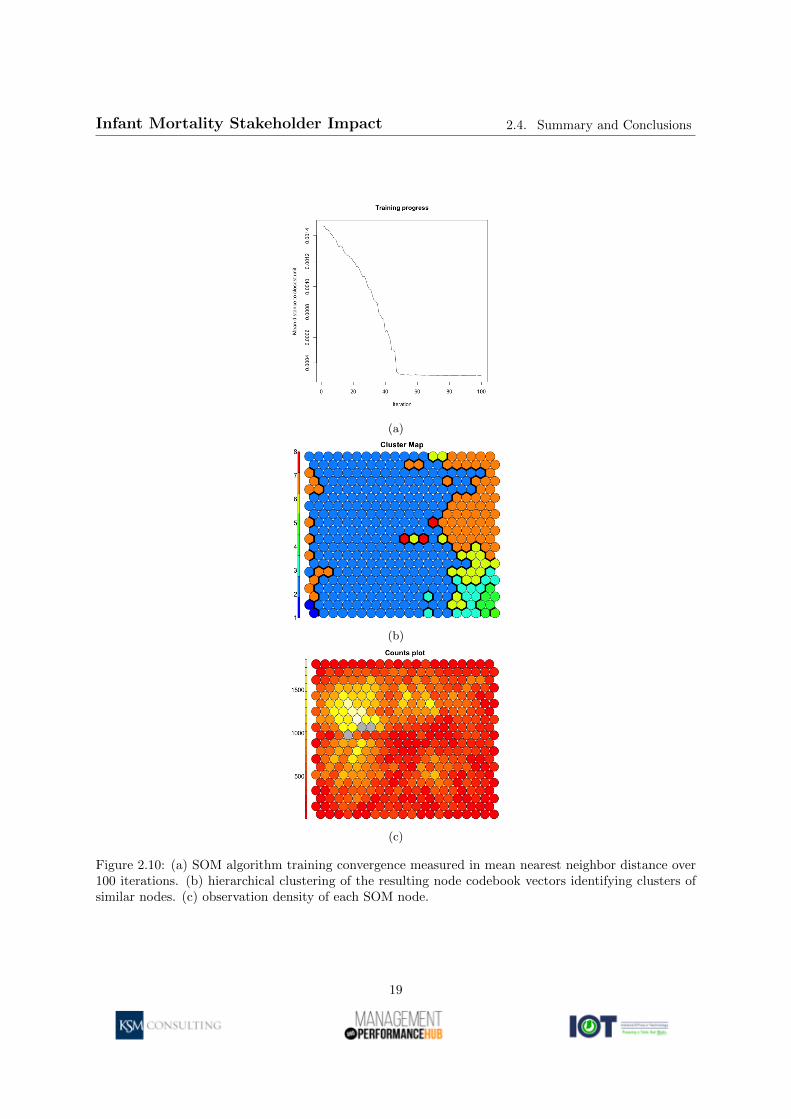
Rather than define risk factors through a set of binary conditionals (birth weight less than 2500 grams,gestational age under 37 weeks, fewer than 10 prenatal visits) as was required in the logistic regressionanalysis, the machine learning process of the SOM independently identified eight distinct subpopulationsexpressing different distributions of all three risk factors simultaneously via a hierarchical cluster analysison the code vectors mapping to each SOM node. The convergence rate of the SOM, which is measuredin terms of the inter-node average distance, indicates the increasing similarity of observations mappingto the same node over each iteration; Figure 2.10a demonstrates this metric and shows that a highdegree of clustering is achieved within the first 50 iterations, half of the total available. Hierarchicalcluster analysis of the node vector averages identified eight distinct node clusters, shown in Figure 2.10b,representing distinct groups having mutually similar distributions of birth weight, gestational age, andprenatal visits. The total number of observations mapping to each node and cluster were generallyuniform with an average node cardinality exceeding 500 distinct observations, the distribution of whichis shown in Figure 2.10c. Due to the stochastic nature of the SOM algorithm, the x- and y-axes ofSOM visualizations have no statistical significance other than to denote similarity between adjacentnodes.
The interpretation and exploratory value of SOM plots is apparent when viewed on a factor expressionlevel, whereby the color of each node correlates with the expected value of a particular variable for theobservations mapping to that node. Inspection of Figure 2.11a, which shows the (scaled) expected birthweight of observations mapping to each node, clearly shows that observations in clusters 3, 4, and 8correspond with low birth weight outcomes; the corresponding box plot in Figure 2.11b shows distinctintra-cluster birth weight distributions between clusters and accompanying Kruskal-Wallis test resultssupporting the clustering effects.
Figures 2.12a, 2.12b, 2.13a and 2.13b present this same general behavior for gestational age and prenatalvisits, respectively. Analysis of the individual outcomes associated with these three clusters revealedthat while comprising only 1.6% of the sample population, these clusters contained samples representing49.8% of all infant deaths.
An additional SOM using data including individual counts of prenatal visits, maternal age, estimatedgestation, birth weight, Medicaid status, ZIP code, census population, census income, and distance tonearest hospital by ZIP code analyzed the subset of 4161 individual observations belonging to these high-risk clusters. Due to the large number of samples in the entire dataset, it was necessary to work from thissubset to minimize the signal-to-noise ratio issues that come from such asymmetric group sizes. The hi-erarchical cluster analysis on the resulting code vectors identified six distinct subpopulations within thishigh-risk group, which is shown with factor distributions in 2.14. These results signal significant strati-fication of risk factors, demographics, and regional attributes within the high-risk subpopulation.
2.4 Summary and Conclusions
The results presented demonstrate the efficacy of the SOM approach for identifying statistically signifi-cant demographically and spatially stratified subpopulations with risk factors for adverse birth outcomes.The subpopulations identified by the SOM algorithm accounted for 1.6% of the sample population butnearly 50% of all infant deaths, which implies that those subpopulations could be the focus of highly tar-geted interventions. The preliminary logistic regression analyses of risk factors and the results of the SOMalgorithm signify that infant deaths are overwhelmingly correlated with low birth weight, preterm birth,and access to prenatal care, facts that are all supported by the clinical and scientific literature.
14

Infant Mortality Stakeholder Impact 2.4. Summary and Conclusions
Figu
re2.5:
Margin
al
estimated
pro
bab
ilityof
lowb
irthw
eight
as
afu
nctio
nof
matern
al
age,p
renatal
visits,
and
Med
icaidillu
stratedas
ab
oxp
lot
factoredby
matern
alage.
15

Infant Mortality Stakeholder Impact 2.4. Summary and Conclusions
Figu
re2.6:
Margin
al
estimated
pro
bab
ilityof
lowb
irthw
eight
as
afu
nctio
nof
matern
al
age,p
renatal
visits,
and
Med
icaidillu
stratedas
ab
oxp
lot
factoredby
pren
atal
visit
cou
nt.
16

Infant Mortality Stakeholder Impact 2.4. Summary and Conclusions
Figure 2.7: Empirical density distributions of mothers age at time of birth, separated by Medicaid status.
Figure 2.8: Marginal estimated probability of a mother receiving fewer than 10 prenatal visits as afunction of age of Medicaid status.
17

Infant Mortality Stakeholder Impact 2.4. Summary and Conclusions
Figure 2.9: Marginal estimated probability of a mother recieving Medicaid benefits as a function of age.
18
Infant Mortality Stakeholder Impact 2.4. Summary and Conclusions
(a)
(b)
(c)
Figure 2.10: (a) SOM algorithm training convergence measured in mean nearest neighbor distance over100 iterations. (b) hierarchical clustering of the resulting node codebook vectors identifying clusters ofsimilar nodes. (c) observation density of each SOM node.
19

Infant Mortality Stakeholder Impact 2.4. Summary and Conclusions
(a)
(b)
Figure 2.11: (a) The distribution of scaled birth weights on the SOM learned from birthweight, gestationalage, and prenatal visits across all individuals. Cluster regions are separated by black lines. (b) Box-plotshowing intra-cluster birth weight distributions. Kruskal-Wallis test with 7 degrees of freedom performedon data resulted in p-value < 2.2e−16.
20

Infant Mortality Stakeholder Impact 2.4. Summary and Conclusions
(a)
(b)
Figure 2.12: (a) The distribution of scaled prenatal visits on the SOM learned from birthweight, gesta-tional age, and prenatal visits across all individuals. Cluster regions are separated by black lines. (b)Box-plot showing intra-cluster prenatal visit count distributions. Kruskal-Wallis test with 7 degrees offreedom performed on data resulted in p-value < 2.2e−16.
21
Infant Mortality Stakeholder Impact 2.4. Summary and Conclusions
(a)
(b)
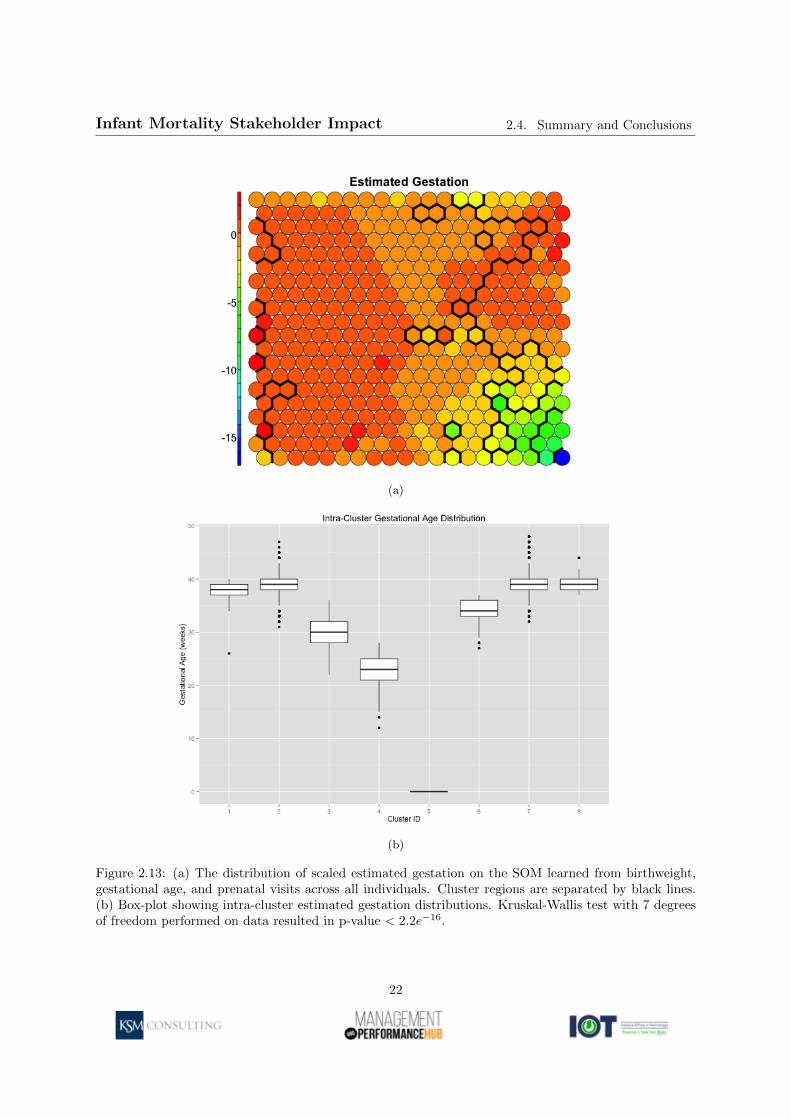
Figure 2.13: (a) The distribution of scaled estimated gestation on the SOM learned from birthweight,gestational age, and prenatal visits across all individuals. Cluster regions are separated by black lines.(b) Box-plot showing intra-cluster estimated gestation distributions. Kruskal-Wallis test with 7 degreesof freedom performed on data resulted in p-value < 2.2e−16.
22

Infant Mortality Stakeholder Impact 2.4. Summary and Conclusions
Fig
ure
2.14:D
istribu
tionof
facto
rsw
ithin
the
hig
hrisk
sub
pop
ula
tions
iden
tified
via
SO
M.
23

Bibliography
[1] MacDorman MF, Hoyert DL, Mathews TJ. Recent Declines in infant Mortality in the United States,2005-2011. NCHS Data Brief (120). National Center for Health Statistics, 2013.
[2] Association of Maternal and Child Health Programs. Celebrating the legacy, shaping the future: 75years of state and federal partnership to improve maternal and child health. Washington, DC., 2010.
[3] Chang, H., et al., Preventing Preterm Births: Analysis of Trends and Potential Reductions withInterventions in 39 Countries with Very High Human Development Index. Lancet, 2013. 381(9862):223-34.
[4] ChildTrends DataBank. Preterm Births: Indicators on Children and Youth (Issue brief). 2014.
[5] Rubens, C.E., et al., Prevention of preterm birth: Harnessing science to address the global epidemic.Science translational medicine, 2014. 6(262): 262-5.
[6] Wisborg K, Kesmodel U, Henriksen T, Olsen S, & Secher N. Exposure to Tobacco Smoke in Uteroand the Risk of Stillbirth and Death in the First Year of Life. American Journal of Epidemiology,2011. 154(4): 322-327.
[7] Centers for Disease Control and Prevention. 10 Leading Causes of Death by Age Group, UnitedStates - 2012.
[8] Fiscella K. Does Prenatal Care Improve Birth Outcomes? A Critical Review. Obstetrics and Gyne-cology, 1995. 85(3).
[9] Kohonen T. Self-Organized Formation of Topologically Correct Feature Maps. Biological Cybernetics1982; 43:59-69.
[10] Lynn S. Self-Organizing Maps for Customer Segmentation. Deloitte Analytics Talk for Dublin RUsers Group; 1/20/2014; Dublin, Ireland.
[11] Wehrens R, Buydens LMC. Self- and Super-organizing Maps in R: The kohonen Package. Journalof Statistical Software 2007; 21(5).
[12] Basara H, Yuan M. Community health assessment using self-organizing maps and geographic infor-mation systems. International Journal of Health Geographics 2008; 7:67.
[13] Hastie T, Tibshirani R, Friedman J. The Elements of Statistical Learning: Data Mining, Inference,and Prediction, 2nd Edition. New York, New York, 2009.
[14] Gorban A, Zinovvyev A. Principle Manifolds and Graphs in Practice: From Molecular Biology toDynamical Systems. International Journal of Neural Systems 2010; 20(3):219-232.
24

Infant Mortality Stakeholder Impact Bibliography
[15] Khashu M, Narayanan M, Bhargava S, & Osiovich H. Perinatal Outcomes Associated With PretermBirth at 33 to 36 Weeks Gestation: A Population-Based Cohort Study. Pediatrics, 2009; 123(1): 109-113.
[16] Wears R. Advanced Statistics: Statistical Methods for Analyzing Cluster and Cluster-randomizedData. Academic Emergency Medicine 2002; 9:4.
[17] Indiana Natality Report Table 22. Number and Percent of Mothers Who Were on Medicaid by Ageand Race of Mother. Indiana Department of Health, Epidemiology Resource Center, 2012.
25


