Embed Size (px)
Citation preview
Reducing environmental risk by improving N management in intensiveChinese agricultural systems
Ju, X. T., Xing, G. X., Chen, X. P., Zhang, S. L., Zhang, L. J., Liu, X. J., ... Zhang, F. S. (2009). Reducingenvironmental risk by improving N management in intensive Chinese agricultural systems. Proceedings of theNational Academy of Sciences, 106(9), 3041-3046. https://doi.org/10.1073/pnas.0813417106
Published in:Proceedings of the National Academy of Sciences
Queen's University Belfast - Research Portal:Link to publication record in Queen's University Belfast Research Portal
General rightsCopyright for the publications made accessible via the Queen's University Belfast Research Portal is retained by the author(s) and / or othercopyright owners and it is a condition of accessing these publications that users recognise and abide by the legal requirements associatedwith these rights.
Take down policyThe Research Portal is Queen's institutional repository that provides access to Queen's research output. Every effort has been made toensure that content in the Research Portal does not infringe any person's rights, or applicable UK laws. If you discover content in theResearch Portal that you believe breaches copyright or violates any law, please contact [email protected].
Download date:02. Jan. 2020

Reducing environmental risk by improvingN management in intensive Chineseagricultural systemsXiao-Tang Jua,1, Guang-Xi Xingb, Xin-Ping Chena, Shao-Lin Zhangb, Li-Juan Zhangc, Xue-Jun Liua, Zhen-Ling Cuia,Bin Yinb, Peter Christiea,d, Zhao-Liang Zhub, and Fu-Suo Zhanga,1
aKey Laboratory of Plant and Soil Interactions, Ministry of Education, China, and College of Resources and Environmental Sciences, China AgriculturalUniversity, Beijing 100193, China; bState Key Laboratory of Soil and Sustainable Agriculture, Institute of Soil Science, Chinese Academy of Sciences,Nanjing 210008, China; cCollege of Agricultural Resources and Environmental Sciences, Hebei Agricultural University, Baoding 071001, China; anddAgri-Environment Branch, Agri-Food and Biosciences Institute, Belfast BT9 5PX, United Kingdom
Communicated by G. David Tilman, University of Minnesota, St. Paul, MN, January 3, 2009 (received for review July 3, 2008)
Excessive N fertilization in intensive agricultural areas of China hasresulted in serious environmental problems because of atmospheric,soil, and water enrichment with reactive N of agricultural origin. Thisstudy examines grain yields and N loss pathways using a syntheticapproach in 2 of the most intensive double-cropping systems in China:waterlogged rice/upland wheat in the Taihu region of east Chinaversus irrigated wheat/rainfed maize on the North China Plain. Whencompared with knowledge-based optimum N fertilization with 30–60% N savings, we found that current agricultural N practices with550–600 kg of N per hectare fertilizer annually do not significantlyincrease crop yields but do lead to about 2 times larger N losses to theenvironment. The higher N loss rates and lower N retention ratesindicate little utilization of residual N by the succeeding crop inrice/wheat systems in comparison with wheat/maize systems. Peri-odic waterlogging of upland systems caused large N losses by deni-trification in the Taihu region. Calcareous soils and concentratedsummer rainfall resulted in ammonia volatilization (19% for wheatand 24% for maize) and nitrate leaching being the main N losspathways in wheat/maize systems. More than 2-fold increases inatmospheric deposition and irrigation water N reflect heavy air andwater pollution and these have become important N sources toagricultural ecosystems. A better N balance can be achieved withoutsacrificing crop yields but significantly reducing environmental risk byadopting optimum N fertilization techniques, controlling the primaryN loss pathways, and improving the performance of the agriculturalExtension Service.
intensive agriculture � synthetic N fertilizer � denitrification �nitrate leaching � N deposition
The last 40 years have seen an extraordinary change in the globalN cycle (1). As recently as the 1960s, N availability in most parts
of the world was controlled by natural processes, but the expandedproduction of synthetic N fertilizer and release of N from fossil fuelcombustion now matches the natural rate of formation of reactiveN on a worldwide basis (2). The rate of change has been spectacularwith half of the synthetic N fertilizer ever used having been appliedduring the last 15 to 20 years (3). Furthermore, because of thedifficulty in accurately predicting N fertilizer requirements, ratesexceeding plant requirements are often applied, thus inducingunintended environmental consequences such as leaching of nitrateand emission of nitrous oxide and ammonia. This has become amajor concern for scientists, environmental groups, and agricul-tural policymakers worldwide.
From 1977 to 2005, total annual grain production in Chinaincreased from 283 to 484 million tons (a 71% increase) and theaverage grain production per unit area increased from 2,348 to4,642 (a 98% increase). However, synthetic N fertilizer applicationincreased from 7.07 to 26.21 million tons (a 271% increase) over thesame period. This resulted in a partial factor productivity fromapplied N (PEPN) that decreased from 55 to 20 kg/kg (4, 5). Large
amounts of external N inputs with decreasing N use efficiency havecontributed to severe environmental degradation since the 1990s(6, 7). For example, the annual application rate of synthetic N forconventional agricultural practices in east and southeast Chinaas well as the North China Plain now ranges from 550 to 600 kgof N per hectare for typical double-cropping systems (5, 8).
The Taihu region and the North China Plain are 2 of the mostintensive agricultural regions in China and the most economicallydeveloped areas (5, 9). Large inputs of synthetic N fertilizer, rapiddevelopment of intensive livestock production systems, and rapidlyincreasing consumption of fossil fuels have severely disturbedregional biogeochemical N cycling and led to a series of environ-mental problems including eutrophication of surface waters, nitratepollution of groundwater, acid rain and soil acidification, green-house gas emissions, and other forms of air pollution. There havealso been effects on human health and normal functioning ofecosystems (9, 10), details of which are given in SI Text.
Here, we provide the actual grain yields and total N lossesassociated with knowledge-based optimum fertilization strategiescompared with experience-based N management practices fromnumerous on-farm field experiments. The ‘knowledge-based opti-mum N fertilization’ (11) hereafter refers to using large numbers offield-based academic research results or soil tests on quantity andtiming of synthetic N fertilizer practically, using regional meanoptimal N (RMON) application rate in rice/wheat systems andin-season N management based on the soil mineral N test inwheat/maize systems (5, 8, 12, 13). We use an integrated approachto measure the fate of 15N fertilizer and to document the major losspathways in situ rather than by using individual measurements ofloss processes reported in other studies to understand N behaviorin these 2 rotations and thus attempt to control the environmentalrisk. We explain the reasons for the large external N inputs currentlypracticed in these intensive management systems and suggeststrategies for balancing N management by applying knowledge-based optimum N fertilization techniques.
This study examines double-crop rotations, which are 2 of themost intensive agricultural systems worldwide and are widelypracticed in Asian countries. The frequent alternation betweenflooding and draining the rice/wheat rotations led to significantchanges in soil N transformations as compared with upland croprotation. In addition, the extremely high external synthetic N inputs
Author contributions: X.-T.J., X.L.-Z., and F.-S.Z. designed research; X.-T.J., G.-X.X., X.-P.C.,S.-L.Z., L.-J.Z., X.-J.L., Z.-L.C., and B.Y. performed research; X.-T.J. and G.-X.X. analyzed data;and X.-T.J. and P.C. wrote the paper.
The authors declare no conflict of interest.
Freely available online through the PNAS open access option.
1To whom correspondence may be addressed. E-mail: [email protected] or [email protected].
This article contains supporting information online at www.pnas.org/cgi/content/full/0813417106/DCSupplemental.
www.pnas.org�cgi�doi�10.1073�pnas.0813417106 PNAS � March 3, 2009 � vol. 106 � no. 9 � 3041–3046
AG
RICU
LTU
RAL
SCIE
NCE
S

used in these two rotations during the last decade provided a uniqueopportunity to study the effects of N on environmental degrada-tion. A detailed knowledge of N cycling and environmental impactsof these two intensive agricultural regions may also provide optionsfor more rational N management practices in other intensivemanagement cropping systems around the world.
Results and DiscussionWe developed knowledge-based optimum N management tech-niques in rice/wheat systems in south China and wheat/maize systemin north China during the last decade. The regional mean optimalN (RMON) application rate was calculated from the average ofeconomically optimum N rates (i.e., the point of the N rate wherethe marginal grain production value is equal to the marginal Nfertilization cost) based on large numbers of on-farm field exper-iments in the rice-based rotations and in-season N managementbased on the soil mineral N (Nmin: NH4
�-N � NO3�-N) test
previously developed for upland crop rotations. In principle,RMON recommends a regional rational N rate in combination withfine tuning according to specific field conditions, taking intoconsideration the relative uniformity of climate, soil N fertility, andabsence of a satisfactory soil N test index for rice-based rotations (5,12). RMON gives the mean of economically optimum N rates andcan be used as a reference for extension technicians. This recom-mendation method can be easily adapted to rural areas of Chinawhere soil testing facilities are usually not available and the croppingindex is high. The short time interval between harvest of the firstcrop and sowing of the second makes soil testing impractical.
The improved Nmin method is based on synchronization of cropN demand and soil Nmin supply, and is considered to be a soil Nsupply index because of the high amounts of Nmin (mostly nitrate)frequently found in the root zone and its high availability forsubsequent crop growth in the next phase of upland rotations. Wefound that high potential rates of mineralization and nitrificationcontribute to this high accumulation of nitrate in soils of the NorthChina Plain (14). This method has been well established in wheat/maize rotations in recent years (8, 13, 15, 16) and can be easilyadapted to individual fields because the nitrate test has become easyto perform in the laboratory and may even be feasible in the field(17). In the present study, we also evaluated the agronomic per-formance and potential environmental risk of these knowledge-based strategies in comparison with the farmer’s experience-basedpractices.
We conducted numerous on-farm field experiments (Field Study1) with different N levels in Taihu region and the North China Plainfrom 2003 to 2006. With the sole exception of wheat in Taihu region,the optimum N rate as determined using the regional mean optimal
N application rate in Taihu region and the improved Nmin methodon the North China Plain appeared to give slight increases in cropyield compared with farmers’ current practices (Table 1). However,no significant differences (P � 0.05) were found, indicating thatsimilar high crop yields can be achieved with lower N fertilizer ratesbecause of increased soil indigenous N supply (18, 19). In contrast,total N losses (including NH3 volatilization, denitrification andleaching from the top 1 m of the soil profile) increased significantlywith increasing N inputs, indicating high environmental costs werecaused by exceeding optimum N fertilizer rates.
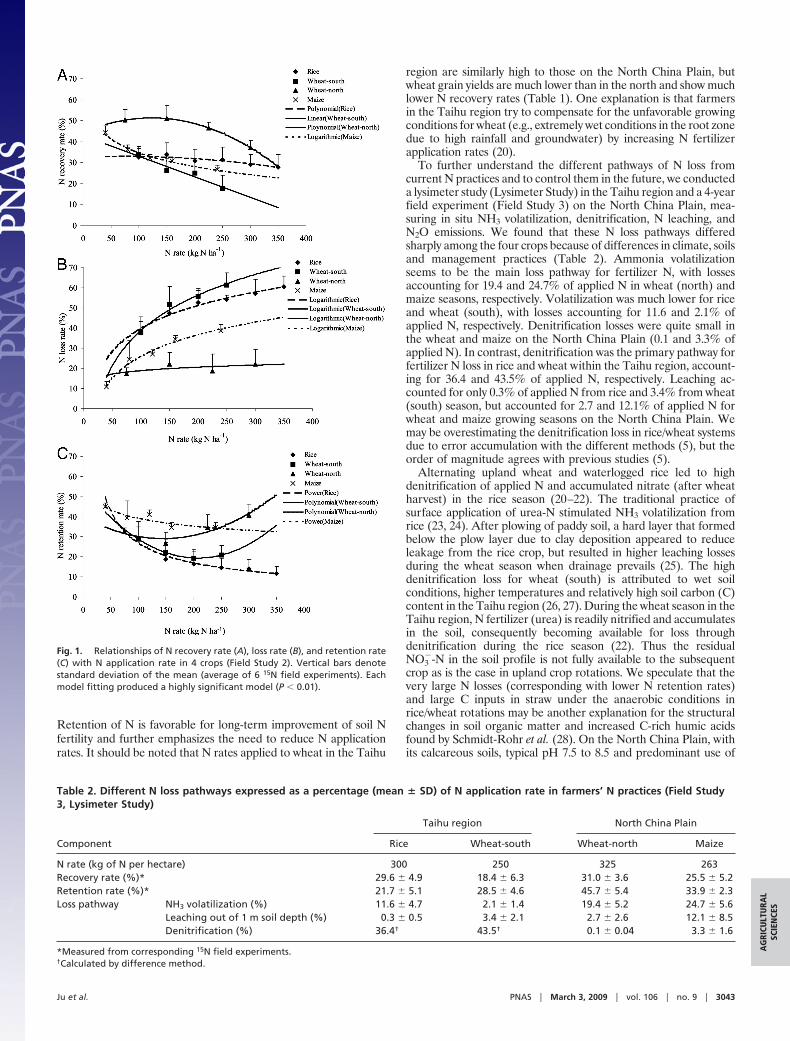
We used 15N in some of the field experiments (Field Study 2) toquantify differences in fertilizer N fate at different application ratesamong the four crops. We found that N recovery rates decreasedwith increasing N application rate for all of them (Fig. 1A). N ratesshowed polynomial, linear, polynomial, and logarithmic relation-ships with N recovery by rice, wheat (south), wheat (north) andmaize, respectively. Each fitting produced a highly significant model(P � 0.01). At lower N input levels (�125 kg of N per hectare), theorder was: wheat (north) � maize � wheat (south) � rice. At higherN input levels (�125 kg of N per hectare) the order was: wheat(north) � rice � maize � wheat (south), indicating that ricerecovered more N at high N application rates. N loss rates increasedwith increasing N application rate in all four crops (Fig. 1B). Alogarithmic model satisfactorily simulated the correlations betweenN rate and N loss rates for the four crops (P � 0.01). Rice and wheat(south) in the Taihu region showed much higher N loss rates thandid wheat (north) and maize on the North China Plain. The trendsof the N retention rates with increasing N rate differed among thefour crops. The rice and wheat systems in the Taihu region showedlower N retention rates than wheat and maize systems on the NorthChina Plain. Moreover, N retention rates in wheat (south) andwheat (north) decreased first and then increased with furtherincrease in N rate, showing typical polynomial relationships (P �0.01). However, N retention rates in rice and maize decreased bypower function relationships when N rate increased (P � 0.01).These findings indicate that the upland wheat and maize rotationsystem has significantly higher N recovery rates, higher N retentionrates, and lower N loss rates than the waterlogged rice and uplandwheat rotation in the Taihu region under current soil N fertility andfarmers’ management practices. Moreover, on the North ChinaPlain wheat has significantly higher N recovery rates, higher Nretention rates, and lower N loss rates than maize, and in the Taihuregion, rice has significantly higher N recovery rates and lower Nloss rates than wheat. Rice/wheat rotations show high ‘leakage’ ofexternal N inputs with resulting pollution threats to water and air.However, wheat/maize rotations show strong retention of externalN inputs that can remain available for use by subsequent crops.
Table 1. Average grain yields and total N losses of the optimum N fertilization (ON) compared with farmers’ N practices (FN) (FieldStudy 1 and 2).
Crop and site of field experiment N fertilization
N rate Grain yield Total fertilizer N loss*
Rate, kg ofN per hectare
Ratio of FNto ON
Yield,kg�ha�1
Ratio of FNto ON
Total loss, kg ofN per hectare
Ratio of FNto ON
Rice in Taihu (n � 26) ON† 200 8,270 102FN 300 1.5 8,012 0.97 174 1.7
Wheat in Taihu (n � 9) ON† 153 3,700 76FN 250 1.6 4,084 1.10 155 2.0
Wheat in NCP‡ (n � 121) ON§ 128 6,024 25FN 325 2.5 5,764 0.96 71 2.8
Maize in NCP‡ ( n � 148) ON§ 158 8,900 52FN 263 1.7 8,500 0.95 108 2.1
*Total fertilizer N losses calculated with the models of Fig. 1B simulated from 15N field experiments.†Regional mean optimal N application rate calculated from the mean of economically optimum N rates of field experiments in Taihu regain (5, 12).‡Data including Field Study 1 and also summarized from ref. (15, 16); NCP, North China Plain.§In-season nitrogen management based on soil Nmin test on the NCP (8, 13, 15, 16).
3042 � www.pnas.org�cgi�doi�10.1073�pnas.0813417106 Ju et al.
Retention of N is favorable for long-term improvement of soil Nfertility and further emphasizes the need to reduce N applicationrates. It should be noted that N rates applied to wheat in the Taihu
region are similarly high to those on the North China Plain, butwheat grain yields are much lower than in the north and show muchlower N recovery rates (Table 1). One explanation is that farmersin the Taihu region try to compensate for the unfavorable growingconditions for wheat (e.g., extremely wet conditions in the root zonedue to high rainfall and groundwater) by increasing N fertilizerapplication rates (20).
To further understand the different pathways of N loss fromcurrent N practices and to control them in the future, we conducteda lysimeter study (Lysimeter Study) in the Taihu region and a 4-yearfield experiment (Field Study 3) on the North China Plain, mea-suring in situ NH3 volatilization, denitrification, N leaching, andN2O emissions. We found that these N loss pathways differedsharply among the four crops because of differences in climate, soilsand management practices (Table 2). Ammonia volatilizationseems to be the main loss pathway for fertilizer N, with lossesaccounting for 19.4 and 24.7% of applied N in wheat (north) andmaize seasons, respectively. Volatilization was much lower for riceand wheat (south), with losses accounting for 11.6 and 2.1% ofapplied N, respectively. Denitrification losses were quite small inthe wheat and maize on the North China Plain (0.1 and 3.3% ofapplied N). In contrast, denitrification was the primary pathway forfertilizer N loss in rice and wheat within the Taihu region, account-ing for 36.4 and 43.5% of applied N, respectively. Leaching ac-counted for only 0.3% of applied N from rice and 3.4% from wheat(south) season, but accounted for 2.7 and 12.1% of applied N forwheat and maize growing seasons on the North China Plain. Wemay be overestimating the denitrification loss in rice/wheat systemsdue to error accumulation with the different methods (5), but theorder of magnitude agrees with previous studies (5).
Alternating upland wheat and waterlogged rice led to highdenitrification of applied N and accumulated nitrate (after wheatharvest) in the rice season (20–22). The traditional practice ofsurface application of urea-N stimulated NH3 volatilization fromrice (23, 24). After plowing of paddy soil, a hard layer that formedbelow the plow layer due to clay deposition appeared to reduceleakage from the rice crop, but resulted in higher leaching lossesduring the wheat season when drainage prevails (25). The highdenitrification loss for wheat (south) is attributed to wet soilconditions, higher temperatures and relatively high soil carbon (C)content in the Taihu region (26, 27). During the wheat season in theTaihu region, N fertilizer (urea) is readily nitrified and accumulatesin the soil, consequently becoming available for loss throughdenitrification during the rice season (22). Thus the residualNO3
�-N in the soil profile is not fully available to the subsequentcrop as is the case in upland crop rotations. We speculate that thevery large N losses (corresponding with lower N retention rates)and large C inputs in straw under the anaerobic conditions inrice/wheat rotations may be another explanation for the structuralchanges in soil organic matter and increased C-rich humic acidsfound by Schmidt-Rohr et al. (28). On the North China Plain, withits calcareous soils, typical pH 7.5 to 8.5 and predominant use of
Fig. 1. Relationships of N recovery rate (A), loss rate (B), and retention rate(C) with N application rate in 4 crops (Field Study 2). Vertical bars denotestandard deviation of the mean (average of 6 15N field experiments). Eachmodel fitting produced a highly significant model (P � 0.01).
Table 2. Different N loss pathways expressed as a percentage (mean � SD) of N application rate in farmers’ N practices (Field Study3, Lysimeter Study)
Component
Taihu region North China Plain
Rice Wheat-south Wheat-north Maize
N rate (kg of N per hectare) 300 250 325 263Recovery rate (%)* 29.6 � 4.9 18.4 � 6.3 31.0 � 3.6 25.5 � 5.2Retention rate (%)* 21.7 � 5.1 28.5 � 4.6 45.7 � 5.4 33.9 � 2.3Loss pathway NH3 volatilization (%) 11.6 � 4.7 2.1 � 1.4 19.4 � 5.2 24.7 � 5.6
Leaching out of 1 m soil depth (%) 0.3 � 0.5 3.4 � 2.1 2.7 � 2.6 12.1 � 8.5Denitrification (%) 36.4† 43.5† 0.1 � 0.04 3.3 � 1.6
*Measured from corresponding 15N field experiments.†Calculated by difference method.
Ju et al. PNAS � March 3, 2009 � vol. 106 � no. 9 � 3043
AG
RICU
LTU
RAL
SCIE
NCE
S

urea or ammonium bicarbonate as fertilizer (accounting for 80%),NH3 volatilization is generally considered to be the major pathwayof N loss, especially in the hot maize growing season (29–31). Dueto lower soil water content and soil organic matter (1.0–1.5%), mostexperimental results on the North China Plain have shown themagnitude of N loss by denitrification is no more than 10 kg of Nper hectare and that denitrification accounts for less than 5% of thefertilizer N, most of which occurs during the hot and humid summerseason (30, 32). We found that nitrate accumulation in the soilprofile and gradual leaching below the root zone were the impor-tant N loss pathways in wheat and maize rotations under conven-tional agricultural N management practices due to concentratedrainfall in summer and flood irrigation (8, 33), contradicted con-ventional thinking that leaching losses are not an important path-way for N loss in semi-humid upland agricultural systems of theNorth China Plain.
Field Study 1 and the Lysimeter Study also showed that NH3volatilization increased rapidly and represented the major pathwayfor loss in response to increasing N rate, but N2O emission andleaching did not increase dramatically with increasing N rate duringthe rice growing season (Fig. S1, rice). Leaching did increase rapidlyand accounted for most of the reactive N loss with increasing Nfertilizer rate, while N2O emissions and NH3 volatilization in-creased very little in response to N rate during the wheat season inthe Taihu region (Fig. S1, wheat-south). Ammonia volatilizationand NO3-N leaching increased significantly with increasing N rateand N2O emissions also showed an upward trend in the wheatgrowing season on the North China Plain (Fig. S1, wheat-north).During the maize growing season, NH3 volatilization, NO3-Nleaching, and N2O emissions all increased significantly, with Nleaching showing a particularly strong increase (Fig. S1, maize).These results confirm that emissions of reactive N to the environ-ment will increase after N fertilization exceeds the optimum rate.However, we did not find large N2O emissions among the fourcrops. The total N2O emissions in rice, wheat (south), wheat(north), and maize with different N application rates were 0.13 to0.50, 0.27 to 0.63, 0.13 to 0.24, and 0.16 to 0.65 kg of N per hectare,respectively. Expressed as average emission factors, this accountedfor 0.20, 0.30, 0.12, and 0.23%, respectively, close the IPCC 2006guideline of 0.3% for paddy rice soil and much lower than theguideline of 1% for upland soil (27, 34, 35). We explain these resultsby the low ratio of N2O to N2O�N2 from denitrification products(36, 37) under waterlogged rice conditions, low available carbonsources and low water-filled pore space (WFPS) for denitrificationin most semi-humid upland soils on the North China Plain (14).
To quantify atmospheric and irrigation water contributions(hereafter ‘environmental N inputs’) to agricultural systems in theTaihu region and the North China Plain, we measured depositionand N inputs from irrigation water (Monitoring Study). Totalenvironmental N inputs reached about 89 kg of N per hectare in theTaihu region and about 104 kg of N per hectare on the North ChinaPlain. Comparisons with observations made from both regions inthe 1980s shows more than 2-fold greater environmental N inputswith time. N deposition increased from 15 to 33 kg of N per hectareand irrigation water N inputs from 15 to 56 kg of N per hectare inTaihu region (Fig. S2) (38). During the same period, N depositionincreased significantly from 21 to 89 kg of N per hectare andirrigation water N inputs from 8 to 15 kg of N per hectare (Fig. S2)(38, 39) on the North China Plain. Inorganic N and soluble organicN are the primary environmental N sources that can be useddirectly by crops or after transformation in the soil (40). Theabsence of crop yield response to N application in most fieldexperiments since the 1990s (5, 8, 15, 16, 20) is not only attributableto increased indigenous soil N supply, but also to high environ-mental N inputs (41, 42). Moreover, high N deposition may alsocontribute to surface water eutrophication, acid rain, and soilacidification (43) in these regions. High total N concentrations (7to 8 mg�N�L�1) in the irrigation surface water in the Taihu region
and high NO3�-N concentrations in the irrigation shallow ground-
water on the North China Plain also reflect the heavy N pollutionof water resources in both areas.
We calculated annual N balance for both rotations using twoscenarios: conventional N practice versus optimum N fertilization(Tables S1 and S2). We computed an annual N surplus of 87 kg ofN per hectare for current practices with large losses by denitrifi-cation for the rice/wheat system. Synthetic N fertilizer was theprimary input followed by N in irrigation water, biological N2fixation, and N deposition. A better N balance can be achieved byadopting optimum N fertilization strategies designed to maintainrelatively high yields but reduce environmental risk. However,dinitrification could be further reduced by improving carbon man-agement and controlling the water regime (25–27). We also com-puted a 212 kg of N per hectare surplus for current practice withlarge losses by NH3 volatilization within the wheat/maize system. Alarge proportion of surplus N accumulated as nitrate in the soilprofile after harvest (33), and partly existed as N in organic formdue to manure application. However, the unusually large quantityof annual surplus N might also be caused by underestimating theleaching loss due to drought conditions in our observation yearswith 24–46% reduction in rainfall (8). Previous studies showed thatstrong N leaching losses only occurred in some years with heavysummer rainfall (33), leading to high nitrate accumulation in thedeep subsoil (8, 33) and the groundwater (43). In the future, aslightly negative N balance could be achieved using an optimum Nrate of about 286 kg of N per hectare to maintain relatively highyields (15, 16). The slightly negative balance would be conducive tomaking sure the plants fully use accumulated nitrate and furtherreduce nitrate leaching (8, 33). A high N retention rate is conduciveto maintenance of soil N fertility. Changing the N applicationtechniques and using deep placement of urea or ammoniumbicarbonate could substantially reduce NH3 volatilization lossesfrom calcareous soils (29).
A question that needs to be addressed is why farmers in Chinacontinue to use such excessively high rates of N fertilizer. Before the1990s, scientists, government and extension staff encouraged farm-ers to increase synthetic fertilizer inputs to increase yields and feedan increasing population. As a result, synthetic fertilizer inputsincreased continually throughout the country, especially in theTaihu region and North China Plain. By 2000, the rates were fargreater than crop demand and serious environmental degradationhad begun. Although this trend has been recognized by thescientific community since the late 1990s, on-farm practices aredifficult to reverse after 10 to 15 years of effort (43). Persuadingfarmers to limit fertilizer inputs is difficult because many of themstill hold to now traditional opinions that higher crop yield will beobtained with more fertilizer. Application rates of N therefore ofteninclude an extra ‘insurance’ component to prevent yield loss ratherthan matching inputs to crop demand. The high off-farm incomesand relatively low retail prices for N fertilizers (with governmentsubsidies for production and transportation) compared with U.S.and European prices are also important factors (43, 44). A thirdmajor reason is the poor infrastructure of the Extension Servicesand poor transfer of knowledge to farmers (43). A critical objectiveof the optimum N techniques developed using our studies are tosubstantially lower fertilizer N application rates by accounting forindigenous soil N and environmental N inputs for maintenance ofthe yields needed to feed an increasing population. This strategyalso limits losses of total N to the water and atmosphere with theaim of establishing sustainable agricultural systems (8, 11, 12).
Crop production in intensive agricultural practice currently reliestoo heavily on synthetic N fertilizer inputs and cereal monocrop-ping, especially in Asian countries under pressure to feed large andgrowing populations. It is now time to change this situation bybalancing yield and environmental consequences. Integrated man-agement packages need to be developed for major cropping systemsthat include efficient recycling of manures and crop residues, the
3044 � www.pnas.org�cgi�doi�10.1073�pnas.0813417106 Ju et al.
use of legume crops in rotations to increase internal N cycling andfurther reduction in the reliance on synthetic N fertilizers (45).
ConclusionsIt took nearly 50 years to achieve food sufficiency in China. Anunanticipated cost has been that massive fertilizer inputs have ledto significant environmental degradation (6). Over-fertilization is aserious problem in intensive agricultural production areas in China,resulting in enrichment of reactive N in the air, soil and water withconsequent impairment of ecosystem services. Our studies showthat more efficient use of N fertilizer can allow current N applica-tion rates to be reduced by 30 to 60%. This would still maintain cropyields and N balance in rotations, while substantially reducing Nlosses to the environment. The over-application of N also representsan unnecessary economic expenditure for farmers. The new rec-ommendations should fully take into account the N supplyingcapacity of the soil and N deposited from air and irrigation water.The characteristics of N behavior among the 4 crops were sharplydifferent depending on climatic, soil and management practices.This must be taken into consideration to further reduce N losses.Only by reducing fertilizer N inputs can degraded environments begradually restored, enhanced and protected. Although severalenvironmental standards have been set in the past, there are still nolegislative controls in China equivalent to those in the EuropeanUnion (33). China would benefit from adopting and enforcingrelevant agricultural regulations (7). All these goals could beachieved by removing government subsidies, introducing an Nfertilizer tax, improving local Extension Services, educating farmersfor environmental awareness, and employing practices that avoidserious environmental degradation (43).
Materials and MethodsStudy Areas. Two different representative intensive agricultural regions wereselected as study areas: (1) the Taihu region in east China (30–32 °N, 119–122 °E)inthealluvialdeltaoftheYangtzeRiverand(2) theNorthChinaPlain innortheastChina (32–41 °N, 113–120 °E) in the alluvial plain of the Yellow River (Fig. S3).Details of the climate, soils, and crops are given in SI Text.
Field Study 1. In the Taihu region, 26 rice (8 or 9 locations each year) and 9 wheat(3 locations each year) on-farm field experiments with 7 (rice) or 5 (wheat) N rateswere conducted from 2003 to 2006. The 7 rice N treatments were 0, 100, 150, 200,250, 300, and 350 kg of N per hectare and the 5 wheat N treatments were 0, 100,150, 200, and 250 kg of N per hectare. The plots (42 m2 in area, 7 � 6 m) werearranged in a randomized complete block experimental design with 4 replicates.
On the North China Plain 6 winter wheat and 6 summer maize on-farm fieldexperiments with 5 (winter wheat) or 6 (summer maize) N rates were conductedfrom October 2003 to October 2005 at Dongbeiwang near Beijing, HuiminCounty in Shandong province, and Baoding County in Hebei province. The 5winter wheat N treatments were 0, 75, 150, 225, and 300 kg of N per hectare andthe 6 summer maize N treatments were 0, 40, 80, 120, 160, and 240 kg of N perhectare. The plot size was 63 m2 (9 � 7 m). The plots were arranged in arandomized complete block experimental design with 3 replicates. The fertilizertypes and application times are given in the SI Text. Except for fertilizer applica-tionandgrainharvest,eachexperimentalfieldwasmanagedusingthe individualfarmer’s current management practices in both rotations. Aboveground biomasswas measured by hand in all plots. The central area of 16 m2 (4 � 4 m) in each plotwas harvested to determine grain dry matter yield.
Field Study 2. In the Taihu region, 6 rice (2 locations per year) and 6 wheat (2locations per year) field experiments were selected to conduct 15N studies inmicroplots to determine the fate of N fertilizer at different N levels. On the NorthChina Plain, the 15N study was carried out in microplots in the on-farm fieldexperiments (SI Text). In both rotations plant and soil sampling and analysis fortotal N and 15N abundance are described as in (44). The N recovery rate isexpressed as the percentage of applied 15N fertilizer taken up by theaboveground plant parts and the N retention rate as the percentage of applied15N fertilizer recovered in the top 100 cm of the soil profile. The loss rate wascalculated by subtracting the recovery rate and retention rate from 100. Themean and standard variation was calculated across all of the experimental yearsand sites in same crop species.
Lysimeter Study. Twenty-four lysimeters containing undisturbed soil pro-files were used at the research station at Changshu, Jiangsu province (31°31.93� N, 120° 41.88� E) in the Taihu region. They contained a TypicEpiaquept (46) formed on alluvial loess with a silty clay loam (46) texture.A steel cylinder 1-m deep with 1.14-m inner diameter was pushed into thesoil, cut at the base, and then removed. After collection, the lysimeterswere prepared for free drainage by replacing approximately 0.08 m of soilat the base of each column with a nylon mesh, a gravel layer, and a porousplastic sheet (47). The lysimeters were then placed in plots permanentlyinstalled belowground at the station. Each lysimeter was used to grow awaterlogged summer rice/upland winter wheat rotation from October2003 to October 2005 with 2 rice and 2 wheat growing seasons. Details oftreatments are given in SI Text. Water leaching through the soil columnswas collected in plastic containers placed in an underground measuringstation. The leachate volume was measured at 3-day intervals and sub-samples were taken from the accumulated leachate and stored at �18 °Cbefore chemical analysis. During the winter wheat growing seasons,leachate could be collected only during rainfall periods. Leachate NO3
�,NH4
�, and total N concentrations were determined using a continuous flowanalyzer (TRAACS 2000, Bran and Luebbe Inc.). The amount of N leached ateach collection time was calculated by multiplying the volume and the Nconcentration of leachate. The total amount of N leached over the wholegrowing period was obtained by summing the individual amounts of Nleached at the different collection times. The N leached from fertilizer wascalculated as the difference in leached N between fertilized treatments andunfertilized controls. The mean and standard variation of each N treatmentwas calculated across 3 replicates over 2 years.
NH3 volatilization and N2O measurements were conducted in both rice andboth wheat growing seasons from October 2003 to October 2005. Ammoniavolatilization rate was measured with a continuous airflow enclosure method(48). The total amount of NH3 volatilized over the whole growing period wasobtained by summing NH3 volatilization measured each day. N2O fluxes wereusually measured once a week throughout each crop growing period with staticclosed chambers, and measurements were made more frequently after basalfertilization and topdressing. Detail measurements and calculations are de-scribed in (49). Similar NH3-volatilization and N2O measurements at different Nlevels were conducted in the on-farm field experiment at Baoding County inHebei province (Field Study 1). The amount of fertilizer derived NH3 volatilizationor N2O emission was calculated as the difference between volatized NH3 or N2Oin fertilized and unfertilized treatments. The mean and standard variation ofeach N treatment was calculated across 3 replicates over 2 years.
Field Study 3. A field experiment was conducted from September 2000 toSeptember 2004 at Dongbeiwang research station near Beijing (40.08 °N, 116.28°E) on a calcareous alluvial soil [Fluvaquents (46)] considered typical of the NorthChina Plain. Eight successive crops (4 winter wheat and 4 summer maize) weregrown on the same plots over the 4-year period. Detailed descriptions of the fieldexperiment were reported previously (8).
15N studies in microplots were also conducted in the conventional N andoptimized N fertilization treatments from September 2002 to September 2004.NH3 volatilization was measured from September 2002 to September 2004 withan automatic wind tunnel system that covered an experimental soil area of 0.7 �1.5 m (1.05 m2) (50). Field denitrification was monitored by a soil core incubationsystem using the C2H2-inhibition method (51) during the 2-year study fromSeptember 2002 to September 2004 (32). Nitrate leaching was quantified usingTerrAquat passive samplers filled with ion-exchange resin. These were used toquantify the total annual amount of leached nitrate below the rooting zone withten replicates per plot (52). The mean and standard variation of NH3, N2O, andnitrate leaching were calculated across 4 replicates over 2 years.
Monitoring Study. Measurements of wet and dry deposition were conductedfrom October 2003 to October 2005 in the 3 representative locations of the Taihuregion, that is, Changshu, Nanjing, and Hangzhou. Three automatic wet-onlysamplers (APS series, Wuhan Tianhong Inc.), which collected precipitation sam-ples only during precipitation events (controlled by sensors) were separatelyinstalled at the above 3 sites for the collection of wet-only deposition (53).Particulate dry N samples were collected using a 0.5-m2 polyethylene sheet-basedsampler (41). Before sunrise (about 6:00 AM in winter and around 5:00 AM insummer), 250 mL of 2 M KCl solution was used to collect deposited dew and theparticles in the collector. In the present experiment, the N in dry deposition isdefined as only the part of the inorganic N adsorbed to particles and exchange-able with 2 M KCl.
Precipitation samples were collected from 11 monitoring sites located on theNorth China Plain during the period 2003–2006. Bulk deposition (wet depositionplus sedimenting dry deposition such as dust during dry periods) was collected
Ju et al. PNAS � March 3, 2009 � vol. 106 � no. 9 � 3045
AG
RICU
LTU
RAL
SCIE
NCE
S

(41,53). Themeanof thebulkdepositionwascalculatedacrossallof the sitesoverthe measuring years. Total deposition was determined by the ITNI system atDongbeiwang, Beijing and Wuqiao and Quzhou in Hebei province. The ITNIsystem is based on 15N isotope dilution and allows the inclusion of direct N uptakeby the plant as well as the absorption of gaseous N compounds by the soil-plantsystem (40, 54, 55).
The N inputs from irrigation were calculated from the sum of the amounts ofwater in the periods of irrigation and the corresponding concentrations ofammonium and nitrate in the irrigation water. The measurements were con-ductedfromOctober2003toOctober2005at12 locations intheTaihuregionand10 locations on the North China Plain. The mean value was calculated across all ofthe years and sites.
Statistical Analysis. Most of the data are presented as mean � SD (standarddeviation) in the Tables and Figures. All data were analyzed using the SASsoftware package (SAS Institute). Means were compared using LSD (Least Signif-icant Difference) by one-way ANOVA analysis. Regression analysis of N fertilizerrate vs. recovery rate, retention rate, and loss rate was performed using the PROCREG procedure.
ACKNOWLEDGMENTS. We thank Professor D. Tilman and three anonymousreviewers for their valuable comments and suggestions that have greatly im-proved the manuscript. This work was supported by the National Natural ScienceFoundation of China (Grant Nos 30390080, 30821003, 40771098, & 40571072),BMBF Germany No. 0339712A and the Program for Changjiang Scholars andInnovation Research Teams in Universities (IRT 0511).
1. Galloway JN, et al. (2008) Transformation of the nitrogen cycle: Recent trends, ques-tions, and potential solutions. Science 320:889–892.
2. Galloway JN, et al. (2004) Nitrogen cycles: Past, present, and future. Biogeochemistry70:153–226.
3. Erisman JW, Bleeker A, Galloway JN, Sutton MS (2007) Reduced nitrogen in ecologyand the environment. Environ Pollut 150:140–149.
4. Editorial Committee of China Agricultural Yearbook. China Agricultural Yearbook1980–2006 (in Chinese). (China Agricultural Press, Beijing).
5. Zhu ZL, Chen DL (2002) Nitrogen fertilizer use in China - contributions to foodproduction, impacts on the environment and best management Strategies. Nutr CyclAgroecosyst 63:117–127.
6. Liu JG, Diamond J (2005) China’s environment in a globalizing world. Nature 435:1179–1186.
7. Liu JG, Diamond J (2008) Revolutionizing China’s environmental protection. Science319:37–38.
8. Zhao RF, et al. (2006) Fertilization and nitrogen balance in a wheat-maize rotationsystem in North China. Agron J 98:938–945.
9. Zhu ZL, Xiong ZQ, Xing GX (2005) Impacts of population growth and economicdevelopment on the nitrogen cycle in Asia. Sci China C life Sci 48:729–737.
10. Jin XC, Xu QJ, Huang CZ (2005) Current status and future tendency of lake eutrophi-cation in China. Sci China C life Sci 48:948–954.
11. Matson PA, Naylor R, Ortiz-Monasterio I (1998) Integration of environmental, agro-nomic, and economic aspects of fertilizer management. Science 280:112–115.
12. Zhu ZL (2006) On the methodology of recommendation for the application rate ofchemical fertilizer nitrogen to crops (in Chinese with English abstract). Plant Nutri FertSci 12:1–4.
13. Chen XP, et al. (2006) Synchronizing N supply from soil and fertilizer and N demand ofwinter wheat by an improved Nmin method. Nutr Cycl Agroecosyst 74:91–98.
14. Wan YJ, et al. (2008) Gross nitrogen transformations and related N2O emissions in anintensively used calcareous soil. Soil Sci Soc. Am. J doi:10.2136/sssaj2007.0419.
15. Cui ZL, et al. (2008) On-farm evaluation of an in-season nitrogen management strategybased on soil Nmin test. Field Crops Res 105:48–55.
16. Cui ZL, et al. (2008) On-farm evaluation of the improved soil Nmin-based nitrogenmanagement for summer maize in North China Plain. Agron J 100:517–525.
17. Schmidhalter U (2005) Development of a quick on-farm test to determine nitrate levelsin soil. J Plant Nutr Soil Sci 168:1–7.
18. Cui ZL, et al. (2008) On-farm estimation of indigenous nitrogen supply for site-specificnitrogen management in the North China Plain. Nutr Cycl Agroecosyst 81:37–47.
19. Peng SB, et al. (2002) Research strategy in improving fertilizer nitrogen use efficiencyof irrigated rice in China (in Chinese with English abstract). Agri Sci China (Chineseversion) 35:1095–1103.
20. Roelcke M, et al. (2004) Recent trends and recommendations for nitrogen fertilizer inintensive agriculture in Eastern China. Pedosphere 14:449–460.
21. Richter J, Roelcke M (2000) The N-cycle as determined by intensive agriculture—examples from Central Europe and China. Nutr Cycl Agroecosyst 57:33–46.
22. Fan MS, et al. (2007) Nitrogen input, 15N balance, and mineral N dynamics in arice-wheat rotation in southwest China. Nutr Cycl Agroecosyst 79:255–265.
23. Lin DX, Fan XH, Hu F, Zhao HT, Luo JF (2007) Ammonia volatilization and nitrogenutilization efficiency in response to urea application in rice fields of the Taihu lakeregion, China. Pedosphere 17:639–645.
24. Cai GX, et al. (1992) Gaseous loss of nitrogen from fertilizers applied to a paddy soil insoutheastern China. Pedosphere 2:209–217.
25. Xing GX, Zhu ZL (2000) An assessment of N loss from agricultural fields to theenvironment in China. Nutr Cycl Agroecosyst 57:67–73.
26. Xing GX, et al. (2002) Denitrification in underground saturated soil in a rice paddyregion. Soil Biol Biochem 34:1593–1598.
27. Xiong ZQ, et al. (2002) Measurement of nitrous oxide emissions from two rice-basedcropping systems in China. Nutr Cycl Agroecosyst 64:125–133.
28. Schmidt-Rohr K, Mao JD, Olk DC (2004) Nitrogen-bonded aromatics in soil organicmatter and their implications for a yield decline in intensive rice cropping. PNAS101:6351–6354.
29. Cai GX, Fan XH, Yang Z, Zhu ZL (1998) Gaseous loss of nitrogen from fertilizers appliedto wheat growing on a calcareous soil in North China Plain. Pedosphere 8:45–52.
30. Zhang YM, et al. (2004) Ammonia volatilization and dinitrification losses from anirrigated maize-wheat rotation field in the North China Plain. Pedosphere 14:533–540.
31. Zhang SL, et al. (1992) Losses of urea-nitrogen applied to maize on a calcareousfluvo-aquic soil in North China Plain. Pedosphere 2:171–178.
32. Zou GY, Zhang FS, Ju XT, Chen XP, Liu XJ (2006) Study on soil denitrification inwheat-maize rotation system. Agri Sci China (English version) 5:45–49.
33. Ju XT, Liu XJ, Zhang FS, Roelcke M (2004) Nitrogen fertilization, soil nitrate accumu-lation, and policy recommendations in several agricultural regions of China. Ambio33:300–305.
34. Akiyama H, Yagi K, Yan X (2005) Direct N2O emissions from rice paddy fields: Summaryof available data. Global Biogeochem Cycles 19. GB1005. DOI:10.1029/2004GB002378.
35. IPCC (2006) IPCC 2006 Guidelines for National Greenhouse Gas Inventories Volume 4:Agriculture, Forestry, and Other Landuse. (OECD, Paris), pp. 475–505.
36. Firestone M, Firestone R, Tiedje J (1980) Nitrous oxide from soil denitrification: Factorscontrolling its biological production. Science 208:749–751.
37. Weier KL, Doran JW, Power JF, Walters DT (1993) Denitrification and the dinitrogen/nitrous oxide ration as affected by soil water, available carbon and nitrate. Soil SciSocAmJ 57:66–72.
38. Zhu ZL (1997) Nitrogen balance and cycling in agroecosystems of China. In Nitrogen inSoils of China, eds Zhu ZL, Wen QX, Freney JR (Kluwer Academic Publishers, Dordrecht/Boston/London), pp 323–338.
39. Shen SM (1998) in Soil Fertility in China, eds Shen SM, Wan HF, Xie JC (ChinaAgricultural Press, Beijing), pp 64–80.
40. He CE, Liu XJ, Fangmeier A, Zhang FS (2007) Quantifying the total airborne nitrogeninput into agroecosystems in the North China Plain. AgricEcosystem Env 121:395–400.
41. Zhang Y, Liu XJ, Fangmeier A, Goulding KTW, Zhang FS (2008) Nitrogen inputs andisotopes in precipitation in the North China Plain. Atmos Env 42:1436–1448.
42. Zhang Y, et al. (2008) Evidence for organic N deposition and its anthropogenic sourcesin China. Atmos Env 42:1035–1041.
43. Zhu ZL, Norse D, Sun B (2006) in Policy for Reducing Non-point Source Pollution fromCrop Production in China. (China Env. Sci. Press, Beijing), pp 135–299.
44. Ju XT, Liu XJ, Pan JR, Zhang FS (2007) Fate of 15N-labeled urea under a winterwheat/summer maize rotation on the North China Plain. Pedosphere 17:52–61.
45. Ju XT, Zhang FS, Bao XM, Romheld V, Roelcke M (2005) Utilization and managementof organic wastes in Chinese agriculture: Past, present, and perspectives. Sci China C lifeSci 48:965–979.
46. United States Department of Agriculture (1994) Keys to Soil Taxonomy. (Soil Conser-vation Service), 6th Ed.
47. Persson L, Bergstrom L (1991) A drilling method for collection of undisturbed soilmonoliths. Soil Sci Soc AmJ 55:285–287.
48. Tian GM, Cao JL, Cai ZC, Ren LT (1998) Ammonia volatilization from winter wheat fieldtop-dressed with urea. Pedosphere 8:331–336.
49. Xiong ZQ, et al. (2002) Field study on nitrous oxide emissions from upland croppingsystems in China. Soil SciPlant Nutri 48:539–546.
50. Braschkat J, Mannheim T, Horlacher D, Marschner H (1993) Measurement of ammoniaemissions after liquid manure application: Construction of a wind tunnel system formeasurement under field conditions. Z Pflanzenernahr Bodenk 156:393–396.
51. Ryden JC, Skinner JH, Nixon DJ (1987) Soil core incubation system for the fieldmeasurement of denitrification using acetylene-inhibition. Soil Biol Biochem 19:753–757.
52. Mack UD, Feger KH, Gong YS, Stahr K (2005) Soil water balance and nitrate leachingin winter wheat-summer maize double-cropping systems with different irrigation andN fertilization in the North China Plain. J Plant Nutr Soil Sci 168:454–460.
53. Liu XJ, et al. (2006) Nitrogen deposition in agroecosystems in the Beijing area. AgricE-cosystem Env 113:370–377.
54. Russow R, Boehme F, Neue HU (2001) A new approach to determine the total airborneN input into the soil/plant system using 15N isotope dilution (ITNI): Results for agricul-tural areas in Central Germany. Science World 1:255�260.
55. Russow R, Boehme F (2005) Determination of the total nitrogen deposition by the 15Nisotope dilution method and problems in extrapolating results to field scale. Geo-derma 127:62–70.
3046 � www.pnas.org�cgi�doi�10.1073�pnas.0813417106 Ju et al.

Supporting InformationJu et al. 10.1073/pnas.0813417106SI TextWater pollution, especially eutrophication, has become an in-creasingly serious problem (1). A survey of eutrophication in themajor lakes in China revealed that about 50% of the lakesinvestigated were eutrophic (2). As controls of point sources ofpollution have been gradually introduced, non-point sourceshave become the major factor contributing to the eutrophicationof Chinese lakes. Emissions of reactive N compounds to theatmosphere from agriculture, industry, and motor traffic ex-hausts all contribute to the eutrophication of water bodies afterdeposition (3). The annual N loading in the Yangtze River Deltahas reached 3.39 million tons, with one-half of the inputs in theform of synthetic N fertilizers in 2002 (4). Currently, the annualapplication rate of synthetic N is about 550–600 kg of N perhectare in summer rice/winter wheat double-cropping systems inthe Taihu region. Total N concentrations in major rivers in thisregion have already reached 7–8 mg of N per liter. On the NorthChina Plain the annual application rate of synthetic N has alsoreached 550–600 kg of N per hectare in winter wheat andsummer maize rotation systems, leading to a significant increasein nitrate concentrations in soil profiles and groundwater (5, 6).According to our measurements of soil nitrate after harvest in47 winter wheat fields, 56 vegetable greenhouses, and 34 appleorchards in Huimin county, Shandong province in 2003, nitrateconcentrations in the top 90 cm of the soil profile were 52–609,270–5,038, and 32–2,406 kg of N per hectare, respectively. Thecorresponding ranges of values at 90–180-cm depth were 224–3,273, 68–1,047, and 228–2,430 kg of N per hectare. The amountsof nitrate in the 0–90- and 90–180-cm depth zones in vegetablegreenhouse soils were significantly higher than in the other 2cropping systems (7). Meta-analysis of 800 records in 120publications in the literature showed that the average amount ofnitrate in the top 100 cm of the soil profile of agricultural fieldson the North China Plain has reached about 200 kg of N perhectare, the highest so far recorded among agricultural regionsin China. A survey of groundwater nitrate-N concentrationsconducted in the provinces of Beijing, Tianjin, Hebei, Shandong,and Shanxi showed that about 45% of 800 groundwater samplesexceeded the WHO and European limit for nitrate in drinkingwater of 11.3 mg of N per liter (50 mg of NO3
� per liter), with thehighest nitrate-N concentration reaching 113 mg of N per liter(8, 9). The enrichment of N in soils, water, and air has broughtabout serious environmental problems in both regions.
Materials and Methods. Study areas. The first study area is insouthern Jiangsu province at the juncture between the northernand central subtropical monsoon climatic zones. The averageelevation is about 3–7 m above sea level (asl) and the meanannual number of sunshine hours is 1,800–2,200 h. The annualmean temperature is 15–17 °C and the annual cumulative meantemperature (days with mean temperatures over 10 °C) is 4,500–5,300 °C. The annual precipitation of 1,000–1,800 mm occursmainly from May to September. The main soil type is TypicEpiaquept paddy soil (10). Current agricultural practice is a veryintensive double-cropping system with waterlogged summer riceand upland winter wheat (or rapeseed) rotations. Rice is sownat the beginning of June and harvested at end of October, andthen wheat is immediately sown and harvested at the end of Maythe following year. Application of organic manures (e.g., water-logged compost) has been virtually abandoned, mainly due tohigh labor costs and rising incomes from off-farm activities.Production of winter green manures has been abandoned in
favor of cash crops. Straw is partly returned to the fields. MineralN fertilizer application rates are very high, leading to averageannual surpluses of 217–335 kg of N per hectare (11). Due to thealternating water regime, transformation losses of N are high,resulting in low N recovery rates by crops of 28–41% (12).
The North China Plain includes the city of Tianjin, most partsof Beijing, Hebei, and Shandong provinces, and parts of Anhui,Jiangsu, and Henan provinces. It has a warm-temperate subhumid continental monsoon climate with cold winters and hotsummers. Average elevation is around 20 to 40 m asl. The annualcumulative mean temperature for days with mean temperaturesover 10 °C is 4,000–5,000 °C and the annual frost-free period is175–220 days. Because of the abundance of solar radiation andrelatively high temperatures, shortages of water and nutrientsare the main factors limiting crop yields (13). The annualprecipitation is 500–700 mm with 60–70% of the rainfall occur-ring during summer (July-September). The amount and distri-bution pattern of rainfall vary widely among years as affected bythe continental monsoon climate. The calculated annual poten-tial evaporation is close to 800 mm. The climatic water budgetduring the winter wheat growing period is almost always negativeand during the summer maize season it is positive in some humidyears. The soils are formed from alluvial loess transported to theNorth China Plain by the Yellow river and its tributaries.According to the soil classification of the World Reference Basefor Soil Resources (WRB) of the FAO, most soils are calcaricFluvisols or calcaric Cambisols with silt texture or Fluvaq-uentsin the USDA (1994) classification (10). Soils are calcareous witha pH of 7.5–8.5 and organic matter content of around 1.0–1.5%.Current agricultural practice is a very intensive double-croppingsystem with irrigated winter wheat and rain-fed summer maizerotations. Winter wheat is sown at the beginning of October andharvested at beginning of June the following year and thensummer maize is immediately sown and harvested at the end ofSeptember. Application of organic manures has declined inrecent years, mainly due to high labor costs and rising incomesfrom off-farm activities. Straw is partly returned to the fields.Farmers in this region usually irrigate with large amounts ofwater and apply large amounts of N fertilizer to obtain highyields (6). These practices lead to substantial accumulation ofnitrate in the soil profile (5, 7). The residual nitrate is readilyleached down to deeper soil layers during the summer maizegrowing season during heavy rainfall, resulting in pollution ofshallow groundwater bodies (8, 9).Field study 1. In the rice growing seasons 50% of the N fertilizerwas applied before transplanting and incorporated into the soil,20% was broadcast before irrigation at the tillering stage, and30% was broadcast before irrigation at the earing stage as urea.In the wheat growing season N fertilizer was applied beforesowing (50% of total, incorporated into the soil) and at shoutingstage (50% of total, broadcasted before rain). All plots received60 kg of P2O5 per hectare as superphosphate and 60 kg of K2Oper hectare as potassium chloride before planting in eachgrowing season based on soil P and K test results.
On the North China Plain, N fertilizer was applied beforewheat planting (40% of total, incorporated into the soil) and atshooting stage (60% of total, broadcast before sprinkler irriga-tion) as urea in all experiments. Half of the N was band appliedat the 3-extended-leaf stage (early July) and the remainder wastop-dressed before rainfall or sprinkler irrigation at the 10-extended-leaf stage (early August) in summer maize. All plotsreceived 90 kg of P2O5 per hectare as superphosphate and 60 kg
Ju et al. www.pnas.org/cgi/content/short/0813417106 1 of 7

of K2O per hectare as potassium sulfate before wheat plantingbased on soil P and K test results.Field study 2. In the Taihu region, the microplots (PVC cylinders60-cm long with 50-cm inner diameter in the center of each mainplot of the field experiments) were inserted into the soil to adepth of 40 m with a collar of 20-cm aboveground. On the NorthChina Plain, the microplots (1 � 1 m, set up in the center of eachmain plot of the on-farm field experiments) were delineated withzinc-galvanized iron sheet to a depth of 0.35 m with anaboveground collar of 5 cm. All microplots were left unfertilizedwhen the main plots received the N fertilizer treatments. Exceptfor the N fertilizer using 15N-labeled urea (abundance 10.32atom%, produced by the Institute of Chemical Industry, Shang-hai) and the conduct of all of the operations by hand, the
microplots were managed in the same way as the main plots ofthe field experiments.Lysimeter study. In the rice growing seasons, 12 of the lysimetersreceived 4 N levels, that is, 0, 100, 200, and 300 kg of N perhectare as 15N-labeled urea, arranged in a randomized completeblock design with 3 replicates. The remaining 12 were treated ascontrols with the local N rate to investigate the leaching ofapplied N during each rice season. During the wheat growingseasons the remaining 12 lysimeters received 4 N levels, that is,0, 100, 200, and 250 kg of N per hectare as15N-labeled urea,arranged in a randomized complete block with 3 replicates, andthe 12 rice lysimeters received the local N rate to investigate theleaching of applied N in the wheat season.
1. Liu JG, Diamond J (2008) Revolutionizing China’s environmental protection. Science319:37–38.
2. Jin XC, Xu QJ, Huang CZ (2005) Current status and future tendency of lake eutrophi-cation in China. Sci China C life Sci 48:948–954.
3. Zhu ZL, Norse D, Sun B (2006) in Policy for Reducing Non-point Source Pollution fromCrop Production in China. (China Env. Sci. Press, Beijing), pp 135–299.
4. Deng MH, Xie YX, Xiong ZQ, Xing GX, Yan XY (2007) Nitrogen budgets of the Yangtzedelta region and their effect on the environment (in Chinese with English abstract).Acta Scientiae Circumstantiae 27:1709–1716.
5. Ju XT, Liu XJ, Zhang FS, Roelcke M (2004) Nitrogen fertilization, soil nitrate accumu-lation, and policy recommendations in several agricultural regions of China. Ambio33:300–305.
6. Zhao RF, et al. (2006) Fertilization and nitrogen balance in a wheat�maize rotationsystem in North China. Agron J 98:938–945.
7. Ju XT, Kou CL, Zhang FS, Christie P (2006) Nitrogen balance and groundwater nitratecontamination: comparison among three intensive cropping systems on the NorthChina Plain. Environ Pollut 143:117–125.
8. Zhang WL, Tian ZX, Zhang N, Li XQ (1996) Nitrate pollution of groundwater inNorthern China. AgricEcosystem Env 59:223–231.
9. Zhang WL, Wu SX, Ji HJ, Kolbe (2004) The current situation and controlling manures ofnon-point source pollutions in China (in Chinese with English abstract). Agri Sci China37:1008–1017.
10. United States Department of Agriculture (1994) Keys to Soil Taxonomy. (Soil Conser-vation Service), 6th Ed.
11. Richter J, Roelcke M (2000) The N-cycle as determined by intensive agriculture—examples from Central Europe and China. Nutr Cycl Agroecosyst 57:33–46.
12. Zhu ZL (1997) Nitrogen balance and cycling in agroecosystems of China. In Nitrogen inSoils of China, eds Zhu ZL, Wen QX, Freney JR (Kluwer Academic Publishers, Dordrecht/Boston/London), pp 323–338.
13. Zhu ZX, Stewart BA, Fu XJ (1994) Double cropping wheat and corn in a sub-humidregion of China. Field Crops Res 36:175–183.
14. Shen SM (1998) in Soil Fertility in China, eds Shen SM, Wan HF, Xie JC (ChinaAgricultural Press, Beijing), pp 64–80.
15. Zhu ZL, Chen DL (2002) Nitrogen fertilizer use in China - contributions to foodproduction, impacts on the environment and best management Strategies. Nutr CyclAgroecosyst 63:117–127.
16. Zhao RF (2006) N balance of winter wheat–summer maize rotation in the North ChinaPlain. In Integrated Nutrient Management in Winter Wheat–Summer Maize RotationSystem, eds Chen XP, Zhang FS (China Agric Univ Press, Beijing), pp 27–42.
Ju et al. www.pnas.org/cgi/content/short/0813417106 2 of 7
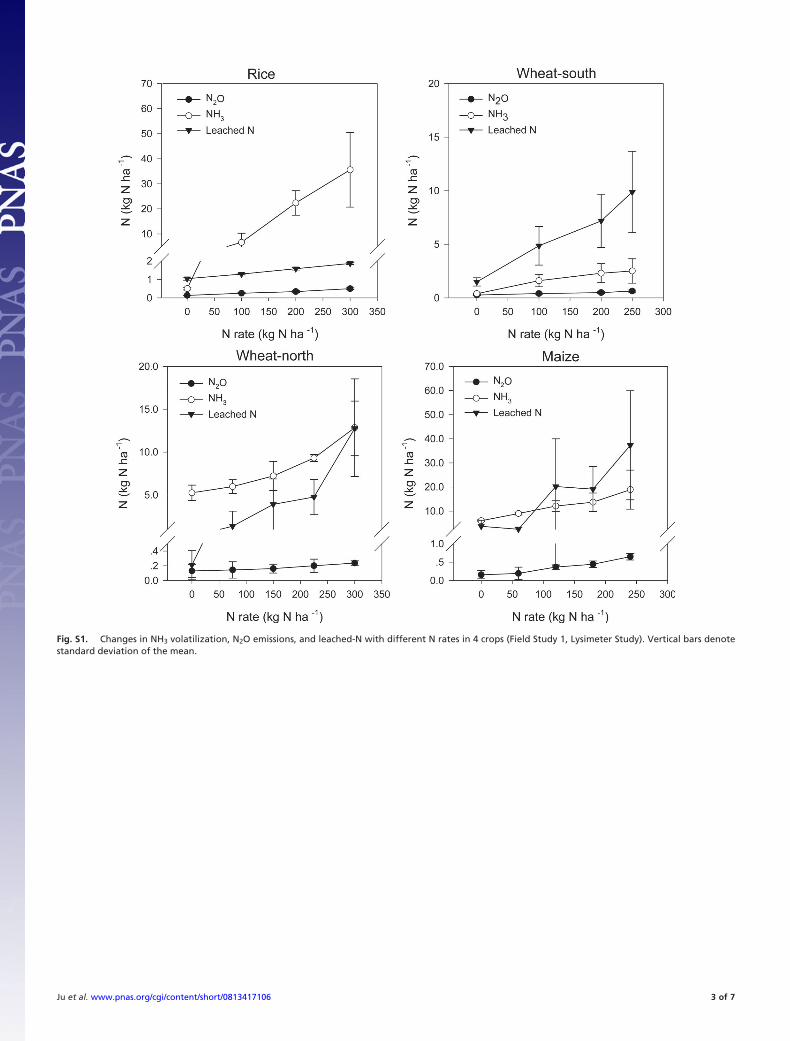
Fig. S1. Changes in NH3 volatilization, N2O emissions, and leached-N with different N rates in 4 crops (Field Study 1, Lysimeter Study). Vertical bars denotestandard deviation of the mean.
Ju et al. www.pnas.org/cgi/content/short/0813417106 3 of 7
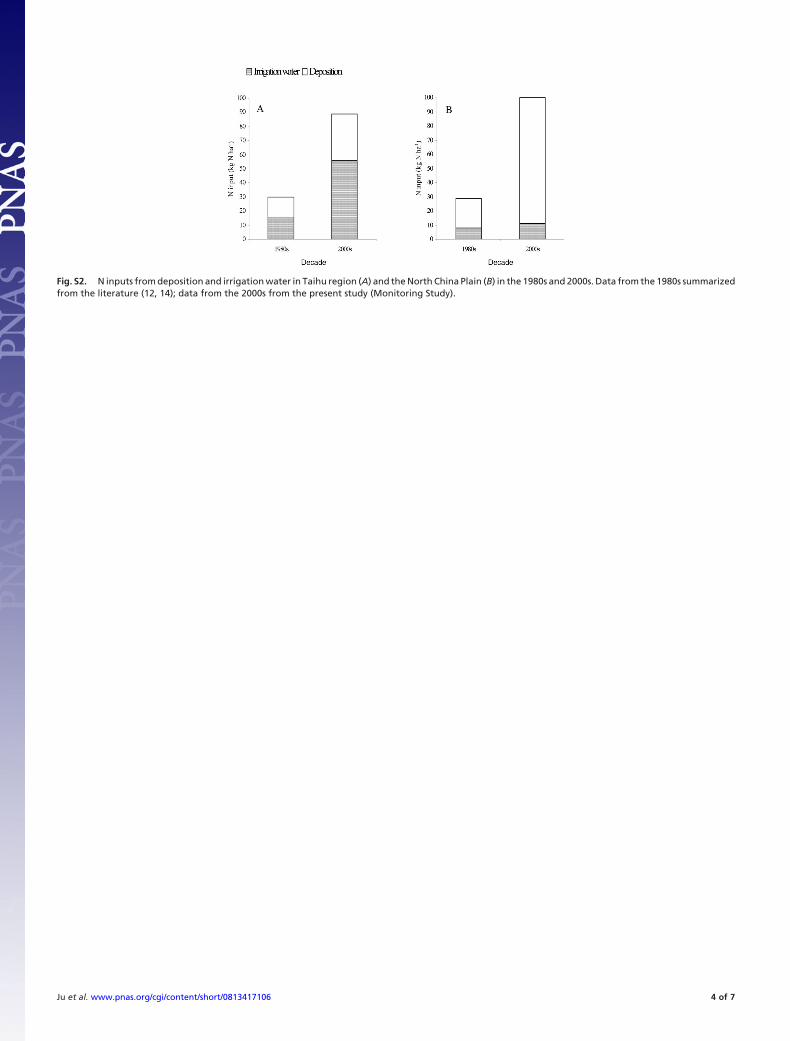
Fig. S2. N inputs from deposition and irrigation water in Taihu region (A) and the North China Plain (B) in the 1980s and 2000s. Data from the 1980s summarizedfrom the literature (12, 14); data from the 2000s from the present study (Monitoring Study).
Ju et al. www.pnas.org/cgi/content/short/0813417106 4 of 7

Fig. S3. Map showing the 2 study regions
Ju et al. www.pnas.org/cgi/content/short/0813417106 5 of 7

Table S1. N balance of current farmers’ N practices (FN) compared with the optimum N fertilization (ON) in future in rice/wheatrotation of the Taihu region (kg of N per hectare per year)
Input Output
Measured component FN ON Measured component FN ON
Synthetic N fertilizer 550 353 Crop removal 341 324Deposition 33 15* NH3 volatilization 38 24Biological N fixation 45† 45† Denitrification 206 75Irrigation water 56 15* Leaching loss 12 8Seeds 4 4 Runoff loss 4† 4†
Total input 688 (A) 432 (A�) Total output 601 (B) 435 (B�)Balance �87 (A-B) �3 (A�-B�)
*Assumes recovery to 1980’s level.†Data obtained by summarizing large numbers of published values according to previous studies (12, 15).
Ju et al. www.pnas.org/cgi/content/short/0813417106 6 of 7
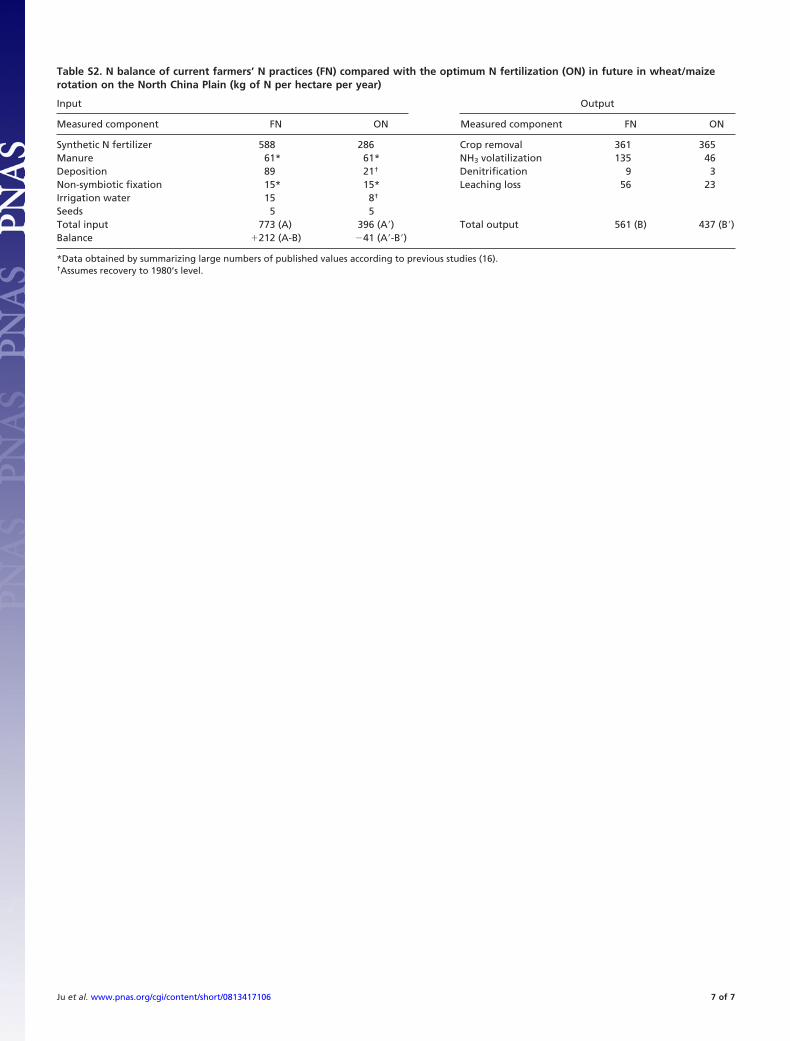
Table S2. N balance of current farmers’ N practices (FN) compared with the optimum N fertilization (ON) in future in wheat/maizerotation on the North China Plain (kg of N per hectare per year)
Input Output
Measured component FN ON Measured component FN ON
Synthetic N fertilizer 588 286 Crop removal 361 365Manure 61* 61* NH3 volatilization 135 46Deposition 89 21† Denitrification 9 3Non-symbiotic fixation 15* 15* Leaching loss 56 23Irrigation water 15 8†
Seeds 5 5Total input 773 (A) 396 (A�) Total output 561 (B) 437 (B�)Balance �212 (A-B) �41 (A�-B�)
*Data obtained by summarizing large numbers of published values according to previous studies (16).†Assumes recovery to 1980’s level.
Ju et al. www.pnas.org/cgi/content/short/0813417106 7 of 7