Embed Size (px)
Citation preview

REDUCING ENERGY COSTS IN PIGGERIES 1
2015
AUSTRALIAN PORK LIMITED
Reducing Energy Costs in Piggeries

PROJECT TITLE:
Demonstrations of How to Achieve Best Management Practices – Environmental Management
PROJECT NUMBER:
2013/031
RESEARCH ORGANISATION:
FSA Consulting
PRINCIPAL INVESTIGATOR:
Ms Robyn Tucker, FSA Consulting, Private Bag 260, Horsham Vic 3401
DISCLAIMER
The opinions, advice and information contained in this publication have not been provided at the request of any person but are offered by Australian Pork Limited (APL) solely for informational purposes. While APL has no reason to believe that the information contained in this publication is inaccurate, APL is unable to guarantee the accuracy of the information and, subject to any terms implied by law which cannot be excluded, accepts no responsibility for loss suffered as a result of any party’s reliance on the accuracy or currency of the content of this publication. The information contained in this publication should not be relied upon for any purpose, including as a substitute for professional advice. Nothing within the publication constitutes an express or implied warranty, or representation, with respect to the accuracy or currency of the publication, any future matter or as to the value of or demand for any good.
This document should be cited as follows:
Project 2013/031 Reducing Energy Costs in Piggeries (2015), Australian Pork Ltd, Barton, ACT, 2600

REDUCING ENERGY COSTS IN PIGGERIES 1
INTRODUCTIONEnergy is an important cost for pork production, with electricity and liquid and gas fuel prices in pig production areas rising by 25-40% over the past few years. Energy sourced primarily from limited fossil fuel reserves also has an environmental cost, contributing greenhouse gas (GHG) emissions to the atmosphere. Reducing energy use, choosing the best tariff and managing the power usage accordingly, and using alternative power sources can substantially improve the bottom line for both the piggery and the environment.
All piggeries use energy, however conventional piggeries have much higher energy usage than deep litter systems and outdoor piggeries. While the focus of this booklet is on conventional piggeries, parts apply to other housing types.
Total Direct Energy Usage in Australian PiggeriesReducing energy usage requires an understanding of where and how energy is used within piggeries. As part of an Australian Pork Limited (APL) funded project, FSA Consulting measured total direct energy use at six conventional Australian piggeries. Total direct energy usage included shed lighting, heating, cleaning, water supply, feed management, manure management, administration and sundry uses. Energy used in the transportation of pigs, feedstuffs and other commodities was not measured. The piggeries comprised units in northern and southern Australia; including farrow to finish (F-F), breeder and grow-out herds. The results of this study are reported in FSA Consulting (2014d). Table 1 provides a summary of the piggeries studied.
TABLE 1 Summary of Piggeries Studied
Piggery A B C D E F
Capacity (SPU) 4200 11,350 14,705 48,064 2594 4289
Herd Type* F-F F-F Breeder Grow-out F-F Breeder
Ventilation Natural Tunnel Tunnel Tunnel Natural Natural
At each piggery, direct energy consumption was measured over a two-week period in summer and winter.
Figure 1 shows the total direct energy usage by the farrow-to finish piggeries expressed as mega joules (MJ) of energy per tonne of liveweight production.

REDUCING ENERGY COSTS IN PIGGERIES2
FIGURE 1 Energy Use (MJ) per Unit Liveweight Production (T) for Farrow to Finish Piggeries
1600LPG
1400
1200
1000
800
600
400
200
0
Piggery A Piggery B Piggery EEner
gy U
se (
MJ)
/ Liv
e-w
eigh
t pr
oduc
tion
(T) Diesel Petrol Electricity
The large variation in energy use between piggeries suggests that some have potential for substantial energy savings.
Total direct energy use by the breeder piggeries, and the breeding sections of the farrow to finish piggeries, was also compared. Figure 2 shows the results expressed as MJ of energy per tonne of weaner liveweight production.
The variation in energy use between these units is stark, with a 4-5-fold difference between the most efficient and the least efficient unit. The tunnel ventilation used at piggeries B and C partly explains their higher energy usage.
Electricity is the major energy type used at all of the piggeries, followed by diesel.
FIGURE 2 Energy Use (MJ) per Unit Liveweight Weaner Production (T) at Breeder Units
70LPG
60
50
40
30
20
10
0
Piggery A Piggery B Piggery C Piggery E Piggery F
Ener
gy U
se (
MJ)
/ Wea
ned
Pig
Diesel Petrol Electricity

REDUCING ENERGY COSTS IN PIGGERIES 3
Breakdown of Direct Energy Usage in Australian PiggeriesTo better understand energy use, various operational components were monitored at four of the six conventional piggeries. A summary of the results from FSA Consulting (2014d) is presented in Table 2.
TABLE 2 Breakdown of Energy Use by Component at Four Conventional Piggeries
Energy Use (kWh/d) Piggery A Piggery B Piggery E Piggery F
Production system F-F F-F F-F Breeder
Farrowing 150 1325 123 753
Bore bump 39 - - -
Finishing 36 1483 10 -
Feed mill - - 45 -
Stall sheds - - - 27
Workshop 145 - 9 121
Total Site 371 2809 187 900
Farrowing sheds play a major role in total energy use at piggeries, particularly given their small footprint relative to the other piggery sheds. The workshop at Piggery A appeared to be a substantial contributor, but this result was affected by power use from a house using the same switchboard. The farrowing and finisher sheds at Piggery B each used roughly the same amount of energy because all of the sheds were tunnel ventilated and this is a major power usage. The feedmill at Piggery E contributed 24% of total energy usage.
From these results, it is obvious that attention needs to be paid to energy use within farrowing sheds at breeder and farrow to finish piggeries. Further detail is presented later. Mechanical (tunnel) ventilation, feedmills and electric motors also use a substantial amount of energy.
Mechanical ventilation uses fans, thermostats and air inlets to control the air temperature and movement within sheds. Mechanical ventilation systems may contribute 60-80% of the total power requirement of the piggery. The fans used may each draw up to 11 kW of power. Natural ventilation uses wind and openings along the sheds (usually adjustable with blinds or curtains) to supply and remove air from the sheds. The energy needed to control the vents on a naturally ventilated system is typically 1-5% of the total energy use (FSA Consulting 2014b).
A piggery feedmill may contribute 20-30% of the total power use of a piggery. The milling process causes a spike in overall energy use and may contribute to the peak load depending on when it occurs. For piggeries without feedmills, the feed system contributes1-5% of total power use.
Electric motors are often used in piggery cleaning and effluent management. Energy use for each of these purposes totals 1-10% of total energy use.
Since the farrowing sheds play an important role in overall energy usage, FSA Consulting (2014d) investigated how energy is used in the farrowing sheds of Piggery A. Figure 3 shows a breakdown.
REDUCING ENERGY COSTS IN PIGGERIES4
FIGURE 3 Breakdown of Energy Use Within an Individual Farrowing Shed
70%
60%
50%
40%
30%
20%
10%
0%
Heat Lamps Effluent Pumps Effluent Agitator Hose Pump Reticlation Pump Feed Motor
% T
otal
Ene
rgy
Com
sum
ptio
n
90%
80%
The 96 X 250 watt heat lamps used for warming young piglets (see Photo 1) contribute 77% of the total energy usage within the farrowing sheds (FSA Consulting 2014d). This represents 38% of the total direct energy use for the whole farrow-to-finish piggery but could represent 30-70% of total energy use for other piggeries (FSA Consulting 2014b). Pumps used to manage effluent (4 kW), hosing (2.4kW) and water reticulation (7.5 kW) along with the effluent agitator motor (2.2 kW) collectively use 22% of the total farrowing shed energy. The feed distribution motor (1.2kW) uses very little power (FSA Consulting 2014d). Hence, farrowing shed heating should be a key target for energy reductions within breeding units.
Photograph 1 Piglets Under Heat Lamp in a Farrowing Shed
Farrowing shed heat lamps are a major contributor to overall energy use at units with a breeding herd. It is therefore a key target for energy reductions at these piggeries.

REDUCING ENERGY COSTS IN PIGGERIES 5
Energy usage varies seasonably, partly due to shed heating and cooling. For a tunnel ventilated farrow to finish piggery in Queensland, average daily electrical use increased from 1150 kWh/day in winter to 1500 kWh/day in summer. This was because of the increased fan activity needed to maintain shed temperatures under maximum ventilation (FSA Consulting 2014d).
Figure 4 compares diurnal electricity use in summer and winter electricity use for a tunnel ventilated farrow to finish piggery. Photo 2 shows a tunnel ventilated shed.
FIGURE 4 Comparison of Diurnal Summer and Winter Energy Use Within a Tunnel Ventilated Farrow to Finish Piggery in Queensland
120
100
80
60
40
20
01:00 3:00 5:00 7:00 9:00 11:00 13:00 15:00 17:00 19:00 21:00 23:00
Ener
ical
Ene
rgy
Com
sum
ptio
n (k
wh)
160
180
200
140
Total Site (Summer)
Total Site (Winter)
Breeding Sheds (Summer)
Breeding Sheds (Winter)
Finishing Sheds (Summer)
Finishing Sheds (Winter)
Photograph 2 Tunnel Ventilated Shed
REDUCING ENERGY COSTS IN PIGGERIES6
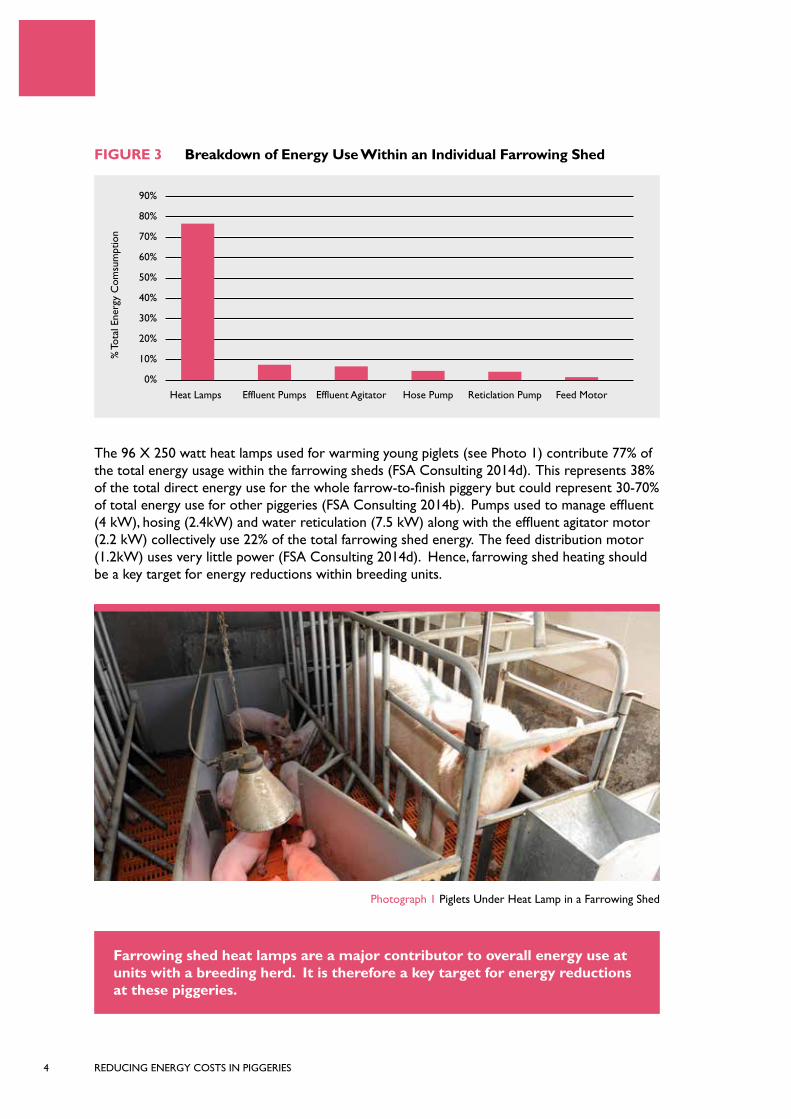
For a naturally ventilated breeder piggery in Victoria, energy use declined from 920 kWh/day in winter to 830 kWh/day in summer because of reduced heating requirements (FSA Consulting 2014d). Photo 3 shows curtains on a naturally ventilated shed.
The change in seasonal energy consumption is heavily dependent on the location, the type of piggery and the ventilation system. Mechanically ventilated piggeries in warm climates have substantially higher overall energy use due to the fans. Naturally ventilated piggeries generally have a modest increase of energy use in winter due to greater heating requirements in farrowing sheds, although this depends on the climate.
Photograph 3 Naturally Ventilated Shed
Measuring Energy Use at PiggeriesMeasuring and regularly monitoring energy use helps to identify opportunities for energy savings at your piggery. Electricity use is measured using a power meter, gas with an inline flow meter and liquid fuel with a mechanical meter at the storage tank.
Photo 4 shows an electromechanical power meter which reads total electricity use. Photos 5 and 6 show a solid state power meter. These are more versatile; some can measure voltage (phase and linked), current (phase and neutral), power (phase and three-phase active), power factor, frequency and working time. It is important that the reading taken is power use (kWh) since some meters also measure voltage (V) and current (A) and other measures. The display may show each measure for a few seconds then move to the next. Other meters show multiple measures at once (see photo 6) (FSA Consulting 2014e).
“Think about how to use day-night tariffs to reduce costs.”
Producer QLD

REDUCING ENERGY COSTS IN PIGGERIES 7
Photograph 4 Electromechanical Power Meter
Photograph 5 Solid State Power Meter
Photograph 6 Solid State Power Meter Showing the Voltage of Each Phase and the Power Usage
Power factor is a measure of how efficiently equipment uses power. It is the ratio of real power flowing to the load, to the apparent power in the circuit. It is a dimensionless number between 0 and 1. Real power is the capacity for the circuit to perform work in a given time frame. Apparent power is the product of the circuits’ current and voltage. Due to energy being stored in the load and returned to the source, or a non-linear load that distorts the wave
Example 2:
Wait until the display shows the total Kwh.
The six digit line of numbers is the total reading and is the sequence of numbers to be read.
Example 1:
Read Dials:
10,000 dial = 6 1,000 dial = 0 100 dial = 1 1 dial = 9 1/10 dial = 1 The reading is 60169.1 kWh
The reading is 59410 kWh
The reading is 81754.4 kWh
Example 3:
The top 3 figures are the voltages of each of the 3 phases.
The eight digit bottom line of numbers is the total reading and is the sequence of numbers to be read.

REDUCING ENERGY COSTS IN PIGGERIES8
shape of the current drawn from the source, the apparent power exceeds the real power. In an electrical power system, a load with a low power factor (<0.85) draws more current than a load with a higher power factor (>0.85) for the same amount of useful power transferred. The higher currents increase energy losses in the distribution system and require larger wires and other equipment. Because of the costs associated with larger equipment and energy wastage, power companies will often charge a higher cost to customers with a low power factor (McGahan et al. 2014).
Each overhead supply line will have an accompanying power authority meter. These meters accurately measure power usage. As a starting point, record farm electricity use weekly or monthly. This will enable you to compare usage between time periods and to compare with other users (e.g. the data presented in this booklet) (Clarke 2006). However, it is important to remember that as well as the power used there will be extra costs due to tariff rates, power factor and other costs (FSA Consulting 2014a).
Power monitors can be used to measure electricity use throughout the piggery. They are available from specialist sensing and instrumentation suppliers and must be installed by a licensed electrical contractor. Cost varies with features and measurement accuracy. For electrical supply networks with large currents (most piggeries), a dedicated current transformer and associated switchgear will be needed.
A run hour meter can measure the power usage of equipment that has a constant load and draws about the same amount of power continually. Measure the current or power use per unit time for the equipment then multiply this by the run time to estimate power use. Run hour meters are available from specialist sensing and instrumentation suppliers and must be installed by a licensed electrical contractor.
Gas meters may be analogue (photo 7) or digital. They measure gas usage in cubic meters (m3) or litres. They are expensive and need to be installed by a licenced gasfitter.
Photograph 7 In-line Gas Meter

REDUCING ENERGY COSTS IN PIGGERIES 9
Diesel and petrol are usually measured either at the bowser pump or through a simple inline flow meter (see photo 8). An inline meter can be purchase for around $500 and measure accurately within the range of 15-120 L/minute.
Photograph 8 In-line Fuel Flow Meter
Meters can be used to measure electricity, gas, diesel and petrol usage. Electricity meters need to be installed by a licensed electrician. Gas meters need to be installed by a licensed gasfitter.
Reducing Energy UseReducing energy use also lessens the cost of production. Energy use savings can be achieved through better management of existing infrastructure, upgrades to more efficient equipment, or a combination of these.
Always undertake a cost-benefit assessment before committing to the installation of expensive new equipment.
Since heat lamps in farrowing sheds contribute significantly to overall direct energy usage, ensure these are being used efficiently. Use a thermostat for best control. Once the temperature in the pens rises to a set level the lamps will dim or turn off, saving large amounts of energy.
Warm water (55 °C) heated floor pads are an energy efficient alternative to heat lamps. The water is heated by burning gas or using air pumps that extract heat from ambient air and transfer this to the water via heat exchange. These systems have higher capital costs than heat lamps but are more cost effective in the long term.
Installing insulated huts in farrowing pens also reduces energy wastage by helping to retain heat for the piglets. Bedding may help to reduce heating needs.
Example 4:
The top line of large digit numbers show the volume used since the last reset. This may be used for different vehicles etc.
A total reading is shown in the lower small digit sequence of numbers

REDUCING ENERGY COSTS IN PIGGERIES10
Use a thermostat to dim or switch off piglet heat lamps when the temperature rises to a set level. Consider replacing these with heated floor pads.
Farrowing Sheds
Creep area heating should commence just before the expected farrowing date. Younger piglets need more warmth than older piglets. Avoid overheating the creep area, particularly in weeks two and onwards post-farrowing (Clarke 2006).
Insulation
Good shed insulation is important for both heating and cooling as it helps retain heat in winter and reduces the external heat burden in summer. Insulate the walls and ceilings of all sheds to achieve suitable heat retention (low U-value). Seek expert advice on suitable materials and installation. Sheds also need to be well sealed to prevent cold air leaks. Energy spent through heat losses can be far higher than that needed to operate ventilation fans (Harmon et al. 2010).
If gas is used to heat sheds, use curtains to section off areas within sheds that need heating from those that don’t (McGahan et al. 2014).
Tunnel Ventilation
Modern tunnel ventilated sheds use the combination of air movement from a fan system and evaporative air cooling with cooling pads. Check that the ventilation and heating systems are working together effectively. A ventilation system that is working against the heating will sharply increase energy costs.
Fan efficiency is measured using the following indicators:
» Air moving capacity (CFM—cubic feet per minute)
» Energy efficiency (CFM/watt)
» Airflow ratio (CFM @ 0.20” static pressure/CFM @ 0.05” static pressure)
For every 2 CFM / watt increase, power usage drops by about 10% (Queensland Chicken Growers Association ND).
Larger fans are general more efficient. Recommended minimum energy efficiency ratings (10” static pressure) and airflow ratios (0.05” static pressure) are:
» 10, 12, 14 or 16” fan: energy efficiency rating of 8, airflow ratio of 0.75
» 18 or 20” fan: energy efficiency rating of 10.5 or 11 (with/without cone), airflow ratio of 0.75
» 24” fan: energy efficiency rating of 15 or 12 (with/without cone), airflow ratio of 0.7
» 36” fan: energy efficiency rating of 17 or 16.5, airflow ratio of 0.7 or 0.65 (with/without cone)
» 48” fan: energy efficiency rating of 18 or 17, airflow ratio of 0.75 or 0.65 (with/without cone) (Alberta Government ND).
Energy efficiency is most important for large fans used in warm climates (Jacobson 2004).

REDUCING ENERGY COSTS IN PIGGERIES 11
There are many factors to consider when designing a ventilation system. Seek expert advice.
Other ways to improve fan performance and energy efficiency include:
1. Cleaning fan shutters, blades and motors regularly to ensure efficient fan operation
2. Replacing burnt-out motors with more energy efficient ones
3. Regularly checking and maintaining or replacing fan belts and pulleys to ensure the fan belts are seated and tensioned properly; this can prevent wastage of up to 30% (FSA Consulting 2014c)
4. Regularly cleaning cooling pads to ensure unrestricted air flow; this minimises the load on the fan system. Run the cooling pump pads continuously, when in use, as this keeps the pads wet and as clean as possible
5. Investing in more energy efficient fans and cowling designs. This may prove to be the most cost effective option, however a cost benefit analysis is strongly recommended before purchasing new equipment. It is very important to select a fan that has been rated
6. Ensuring shed ventilation (fan performance) is meeting the manufacturer’s specifications
7. Using a variable frequency drive to reduce fan speed, which lower the airflow rate and energy use, while operating in accordance with ventilation requirements. Considerable savings in the energy needed for heating can be achieved by adjusting fan speed to meet the changing needs of growing pigs. However, efficiency is greatly compromised when fans are run at low speeds (Jacobson 2004); do not expect them to deliver less than half their full speed rated capacity (Harmon et al. 2010).
The type of lighting used, and its power usage, is worth investigating. New technologies, including compact fluorescent lamps, triphosphor bulbs and fluorescent strips, are far more efficient and have a much longer life than traditional incandescent bulbs. Compact fluorescents are attractive as they can use the same fittings as incandescent bulbs. LED lighting is more expensive to install, however as it is very efficient it is recommended for new pig sheds.
Table 3 shows the properties of different lamp types. The lumen efficacy is the light output divided by the total power to that light source.
Table 3 – Properties of Different Lamp Types
Lamp Type Lamp Size (W) Lumen Efficacy (lumens/kW)
Typical Lamp Hours
Incandescent 25-200 36-71 1000
Compact fluorescent 5-50 47-82 8000+
Fluorescent strip 32-120 66-82 16,000+
LED (Light-emitting diodes)
25 50-100 30,000 to 50,000
(McGahan et al. 2014).
To minimise energy usage, review shed heating, ventilation, insulation, sealing and equipment maintenance.

REDUCING ENERGY COSTS IN PIGGERIES12
Other Ways to Reduce Energy CostsEnergy costs can be cut by reducing the peak energy load, efficiently using power, choosing a supplier offering a competitive power tariff and using alternative energy sources.
Understanding the peak energy load is important if power rates vary throughout the day.
Measure peak energy use by installing power meters on each shed. Identify activities that don’t need to occur during the peak load.
Figure 5 shows diurnal electricity usage at six Australian piggeries (FSA Consulting 2014c).
FIGURE 5 Diurnal electricity use at six Australian piggeries
120
100
80
60
40
20
00:00 3:00 5:00 7:00 9:00 11:00 13:00 15:00 17:00 19:00 21:00 23:00
Ener
ical
Ene
rgy
Use
(kw
h)
160
140
Piggery D Piggery E Piggery FPiggery A Piggery B Piggery C
Piggeries B, C and D were larger piggeries with tunnel ventilated sheds. Their peak load occurred between midday and 4 PM when extra power was needed to cool the sheds. The smaller, naturally ventilated piggeries did not experience this peak. They did have a small spike in the morning when pump motors and other equipment were started.
Piggeries that mill feed are likely to experience a peak load while this activity is occurring.
Piggeries with mechanically ventilated sheds can reduce their peak load by minimising the use of other equipment, especially feed mills while the fans are operating at full capacity.
Stagger the start times for motors and electrical equipment to reduce the peak caused when multiple pieces of equipment are started at once.
Run high-power motors and pumps during off-peak times. Use generators to reduce grid electricity use at high tariff times.

REDUCING ENERGY COSTS IN PIGGERIES 13
Use power efficiently. Some states penalise businesses for inefficient use of electricity measured using the power factor. The accepted range for a good power factor is 0.85-0.95. It can be increased by cleaning and maintaining electrical equipment, regularly checking for leaks around pumps and the water system, minimising operation of idling or lightly loaded motors, avoiding the operation of equipment above its rated voltage and replacing equipment with more energy efficient models that are correctly sized for the task.
Choose the electricity supplier offering the best tariff for your business. In some cases a better rate can be negotiated. Prices and tariffs can vary widely between suppliers.
The tariff includes two price components: a fixed service or supply charge and a variable charge. Consider both charges when comparing offers. The variable change can be:
» single or flat rate – the variable electricity rate is the same regardless of how much electricity you use and the time of day it is used
» block rates – different rates apply to different usage blocks. You are charged a minimum rate until your use exceeds the first block, a different rate for the quantity used within the second block, and so on
» off-peak rates –lower rates apply for use occurring when the overall grid use is low (generally at night)
» time of use/day rates – the rate varies depending on the time of day the energy is used. The rates are generally divided into peak (day or afternoon and evening) and off-peak (night), and sometimes shoulder (morning) (Australian Energy Regulator ND).
Choose the electricity supplier offering the best tariff taking into account the supply charge and the type of variable charge.
Alternative Energy SourcesBiogas collected from anaerobic ponds, solar panels and wind turbines may provide financially viable energy solutions in some situations. Choosing these technologies over fossil fuel sources also reduces GHG emissions by the piggery.
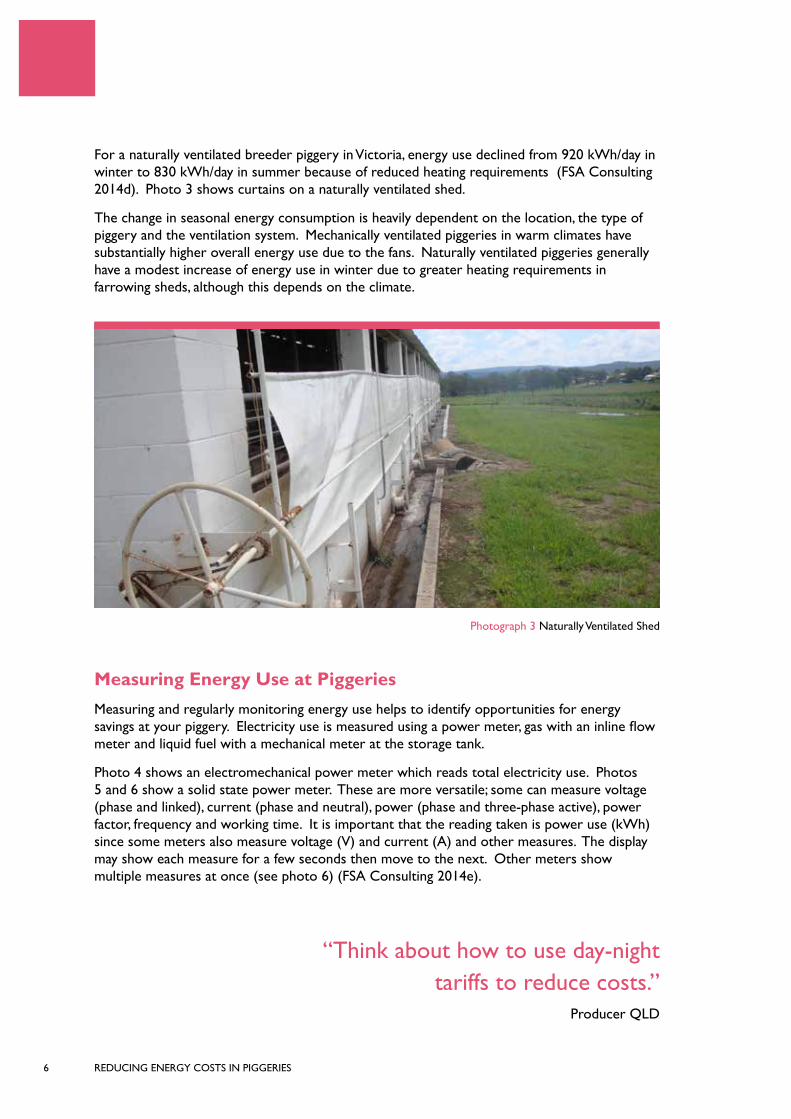
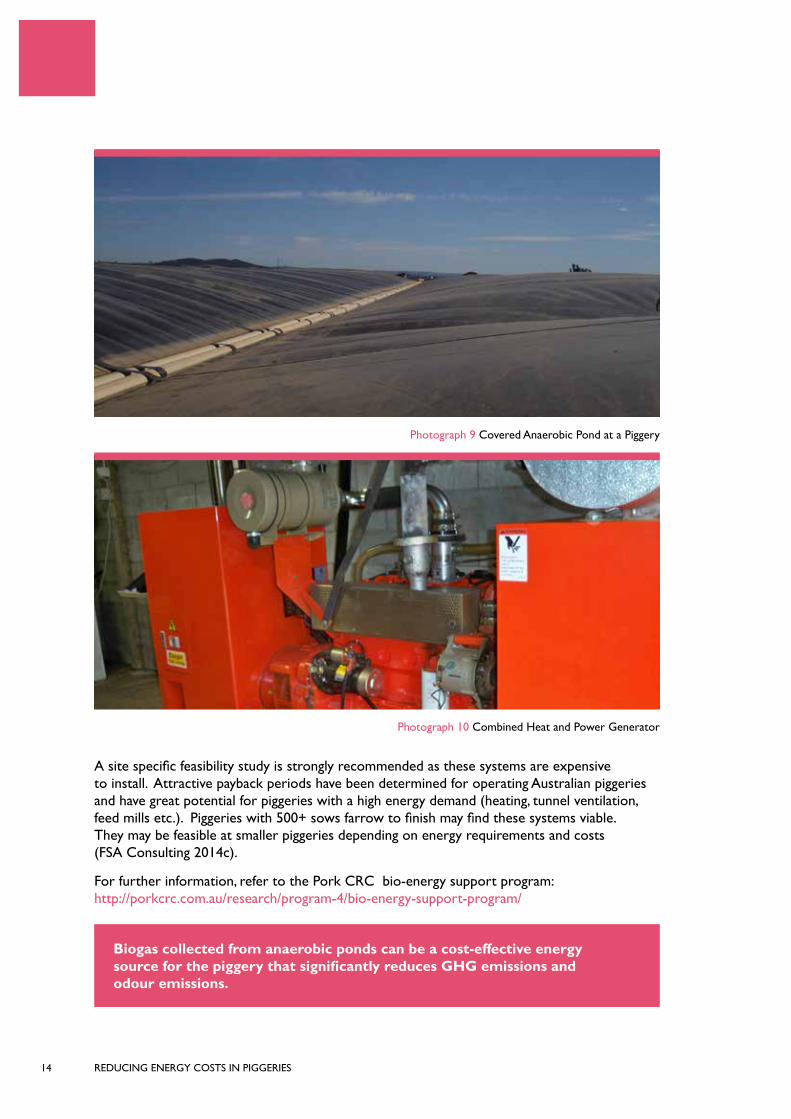
Biogas collection is of most interest to piggery operators at the present time. A number of piggeries, comprising about 11% of national production, are already collecting biogas from a covered anaerobic pond and using it to generate heat and/or power for use in the piggery. Photo 9 shows a covered anaerobic pond at a piggery. Photo 10 shows a combined heat and power generator. This equipment generates energy to run fans and motors and heat that can be used to warm heat pads within the farrowing sheds.
“Talk to your electricity supplier to get the right tariff.”
Producer QLD
REDUCING ENERGY COSTS IN PIGGERIES14
Photograph 9 Covered Anaerobic Pond at a Piggery
Photograph 10 Combined Heat and Power Generator
A site specific feasibility study is strongly recommended as these systems are expensive to install. Attractive payback periods have been determined for operating Australian piggeries and have great potential for piggeries with a high energy demand (heating, tunnel ventilation, feed mills etc.). Piggeries with 500+ sows farrow to finish may find these systems viable. They may be feasible at smaller piggeries depending on energy requirements and costs (FSA Consulting 2014c).
For further information, refer to the Pork CRC bio-energy support program: http://porkcrc.com.au/research/program-4/bio-energy-support-program/
Biogas collected from anaerobic ponds can be a cost-effective energy source for the piggery that significantly reduces GHG emissions and odour emissions.
REDUCING ENERGY COSTS IN PIGGERIES 15
Conclusions » There are two important incentives to reduce energy consumption in piggeries:
– rising energy costs – indirect GHG emissions to the atmosphere via the consumption of fossil fuels
» Energy use between conventional piggeries varies widely; some have potential for large savings. Use meters to identify major energy uses
» Farrowing sheds are major energy users, with heat lamps largely responsible. Use thermostats to dim or switch these off when the temperature rises to a set level. Consider replacing these with heated floor pads. Avoid over-heating the creep areas
» Mechanical ventilation may contribute 60-80% of total direct energy usage. To minimise costs, the ventilation and heating must work effectively together, good wall and ceiling insulation is important and the system must be kept clean and well maintained. Seek expert advice on design and equipment
» Feedmills may contribute 20-30% of the total direct energy consumption. Their use causes a spike in consumption that may add to the peak load, which typically occurs in the middle of the day. Use them at off-peak times to save money (depending on tariffs)
» Choose motors and pumps sized to do the required work. Run these at off-peak times when possible
» Energy costs depend on price as well as usage. Choose the electricity supplier offering the best tariff for your business
» Biogas collection from a covered anaerobic pond may be cost effective and reduce GHG emissions. For further information, go to: http://porkcrc.com.au/research/program-4/ bio-energy-support-program.
“We have installed heating pads to reduce energy costs in the
farrowing houses.”Producer WA

REDUCING ENERGY COSTS IN PIGGERIES16
ReferencesAlberta Government, ND, Ventilation in Swine Production, Growing Forward 2, Alberta Government, www.growingforward.alberta.ca, viewed 15 May 2014.
Australian Energy Regulator ND Tariffs and Fees Explained, Energy Made Easy: The Power to Compare, Australian Energy Regulator, Australian Government, Canberra, www.energymadeeasy.gov.au/understand-your-bill-and-contract/tariffs-and-fees-explained, viewed 15 May 2014.
Clarke, S 2006, Economising on Electricity Usage on the Pig Farm, Pig Farmers’ Conferences 2006, Teagasc, Oak Park, Carlow.
FSA Consulting 2014a, Energy Measurement Equipment, Australian Pork Ltd Energy Efficiency Fact Sheet Series, May 2014, Australian Pork Ltd, Canberra.
FSA Consulting 2014b, Identifying Energy Use Activities, Australian Pork Ltd Energy Efficiency Fact Sheet Series, May 2014, Australian Pork Ltd, Canberra.
FSA Consulting 2014c, Improvements to Energy Efficiency, Australian Pork Ltd Energy Efficiency Fact Sheet Series, May 2014, Australian Pork Ltd, Canberra.
FSA Consulting 2014d, Piggery Total Energy Usage, Australian Pork Ltd Energy Efficiency Fact Sheet Series, May 2014, Australian Pork Ltd, Canberra.
FSA Consulting 2014e, Reading and Collecting Energy Data, Australian Pork Ltd Energy Efficiency Fact Sheet Series, May 2014, Australian Pork Ltd, Canberra.
Harmon J, Hanna M and Petersen D 2010, Sizing Minimum Ventilation to Save Heating Energy in Swine Production, Iowa State University Extension, Iowa State University, Ames.
Jacobson LD 2004, Mechanical Ventilation for Pig Housing, The Pig Site, www.thepigsite.com, 5m Publishing, Sheffield.
McGahan EJ, Warren BR and Davis RJ 2014, Establishing Energy Usage on Australian Piggeries to Enable Energy Reduction Strategies, Australian Pork Limited Project No. 2012/2407, Australian Pork Limited, Canberra, February 2014.
Queensland Chicken Growers Association ND, Efficient Ventilation in Poultry Sheds, Eco-Efficiency in the Poultry Industry Factsheet Series, Queensland Chicken Growers Association, South Brisbane.
CitationThis publication should be referenced as follows:
Project 2013/031 Reducing Energy Costs in Piggeries (2015), Australian Pork Ltd, Barton, ACT, 2600
AcknowledgementThe contribution of Janine Price (Australian Pork Ltd) in reviewing this publication is gratefully acknowledged.
Disclaimer: The opinions, advice and information contained in this publication have not been provided at the request of any person but are offered by Australian Pork Limited (APL) solely for informational purposes. While APL has no reason to believe that the information contained in this publication is inaccurate, APL is unable to guarantee the accuracy of the information and, subject to any terms implied by law which cannot be excluded, accepts no responsibility for loss suffered as a result of any party’s reliance on the accuracy or currency of the content of this publication. The information contained in this publication should not be relied upon for any purpose, including as a substitute for professional advice. Nothing within the publication constitutes an express or implied warranty, or representation, with respect to the accuracy or currency of the publication, any future matter or as to the value of or demand for any good.
Notes

“Use off-peak periods as best you can.”
Producer NSW

AUSTRALIAN PORK LIMITED
ABN 83 092 783 728
Level 2, 2 Brisbane Avenue Barton ACT 2600 PO Box 4746 Kingston ACT 2604 Australia
P: 02 6285 2200 F: 02 6285 2288 E: [email protected]
www.australianpork.com.au