Embed Size (px)
Citation preview
1
Reducing Clostridium Difficile Infections Among Long-Term Care
Residents: A Collaborative in Kentucky
Fontaine Sands, DrPH, MSN, CIC
Eastern Kentucky University
NO DISCLOSURES
• Associate Professor Eastern Kentucky University, College of Health Sciences
• Kentucky Department for Public Health,
Division of Epidemiology and Health Planning, Infectious Disease Branch, HAI Program
• Association of Linen Management Richmond, Kentucky – IP Consultant
2
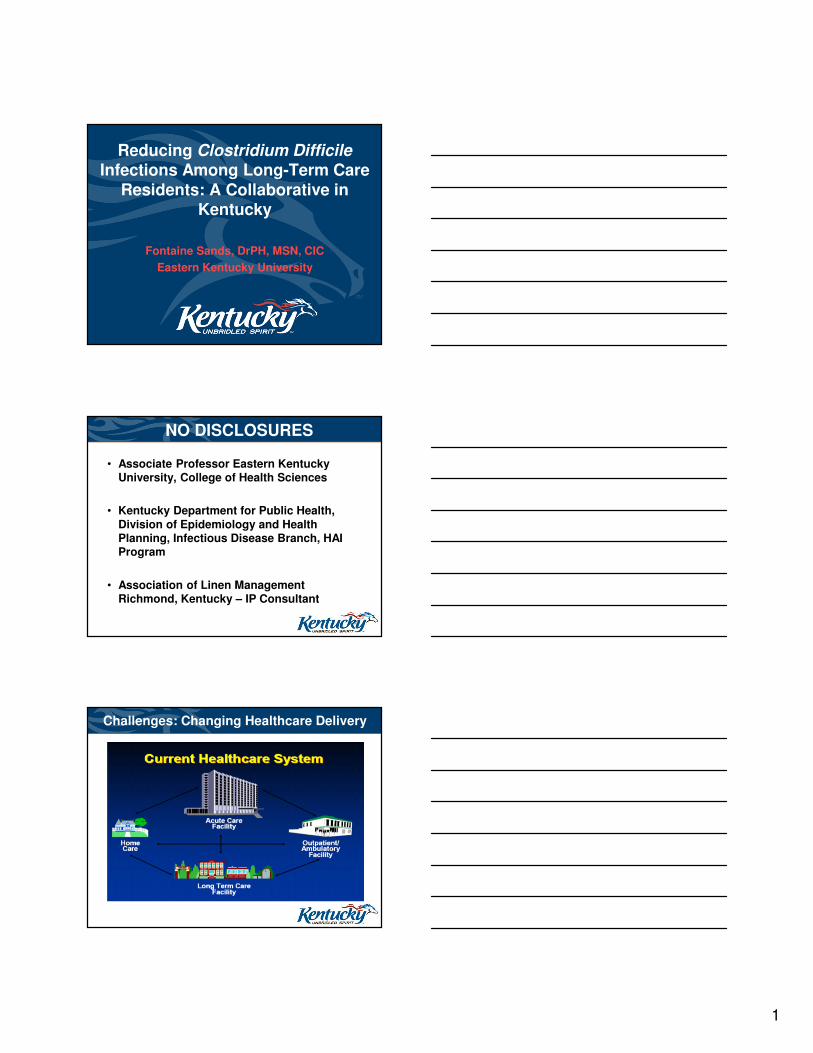
Challenges: Changing Healthcare Delivery

2
CDC’s National 6 Winnable Battles
Background LTC Setting
5
Long-term Care (LTC)
• 2012 - Long-term care 15,643 facilities with 1.4 million beds per CMS
www.raconline.org/info_guides/maps

3
In 2012
• ~3 million residents received care in certified NH/SNF in the U.S.
– For-profit nursing homes accounted for about 70.5% of the facility types
– Non-profit nursing homes accounted for 23.2%
– Government nursing homes accounted for the remaining 6.3%
Challenges: Changing Population in LTC
Nursing Home Compendium 2013, CMS
U.S. NH by Year and Bed Size
8
Nursing Home Compendium 2013, CMS
Overall decrease of
1.4% from 2008 to 2012
9
Nursing Home Compendium 2013, CMS
Percent of State Population 65 or Older
Living in NHs
Kentucky: 2.8-3.3%

4
Percent of NH residents with 4 to 5 ADL
Impairments
10
Nursing Home Compendium 2013, CMS
KentuckyInjurious Falls: 5.3-6.3%
Pressure Ulcers: 5.1-5.8%Restrained: 2.7-4.8%
Incontinence: 36-43%Feeding Tube: 5.4-7.2%
Kentucky: 65.5 to 79.4%
Percent Distribution of Health Deficiency Citations
11
5% increase in “Greater
than Minimal Harm”
Nursing Home Compendium 2013, CMS
Percent of NHs with Quality of Care Deficiencies by State 2012
12
Nursing Home Compendium 2013, CMS
Kentucky 2.9-5.4%

5
U.S. LTC 25 percent of the
nation’s facilities were cited for
survey deficiencies
for poor quality of care
• 34 percent for failure to meet professional standards;
• 30 percent for infection control problems;
• 29 percent for failure to provide comprehensive care plans;
• 24 percent for giving unnecessary drugs;
• 22 percent for poor clinical records;
• 21 percent for pressure ulcers; and
• 21 percent for poor housekeeping
Harrington, C., Carrillo, H., Blank, BW., O’Brian, T. “Nursing Facilities, Staffing, Residents and Facility Deficiencies, 2004 – 2009. September 2010. The report can
be accessed at: http://www.pascenter.org/documents/OSCAR_complete_2010.pdf.
0%
10%
20%
30%
40%
50%
60%
70%
80%
90%
100%
2000 2001 2004 2005 2008 2009 2010
ESTABLISHES INFECTIONCONTROL PROG (F441)
ISOLATES RESIDENTS WHENAPPROPRIATE (F442)
PROHIBIT EMP W/COMMUNDISEASE FROM DIRECT RESCONTACT (F443)
WASH HANDS WHEN INDICATED(F444)
HANDLE LINENS TO PREVENTSPREAD OF INFECTION (F445)
U.S. NH IC Compliance by F-Tag
Data courtesy of Ed Mortimer, CMS Survey & Cert., Nov. 2010
Health and Human Services (HHS)

6
HHS Action Plan
• One of the major overreaching priorities is:
1. Progress towards 5-year national prevention targets• Central Line-associated Bloodstream Infections (CLABSI)
• Clostridium difficile Infections (CDI)
• Catheter-associated Urinary Tract Infections (CAUTI)
• Methicillin-resistant Staphylococcus aureus (MRSA) Infections
• Surgical Site Infections (SSI)
• Ventilator-associated Pneumonia (VAP)
• Long-term Care will be added to Phase 3 of the Health and Human Services (HHS) Action Plan for the prevention of HAIs
HHS Action Plan
• Phase 3 for Long-term Care
– Priority Area 1
• Enrollment in NHSN for Nursing Home Infection Surveillance Activity
– Priority Area 2
• Clostridium difficile Infection , NH on-set reporting
– Priority Area 5
• Urinary Tract Infections, Catheter-Associated Urinary Tract Infections, and Catheter Care Processes reporting
• C. difficile is a bacteria that lives in the intestinal tract of humans
• Surpassed MRSA as #1 organism causing HAIs
• Infection occurs when the bacteria over grows in the intestinal tract, as a result of loss of normal flora
• Symptoms of infection include:– Watery diarrhea– Abdominal cramps– Colitis– Sepsis – Death
18
Why C. difficile?

7
C-Diff Annual Estimates
19
Category # Cases Excess costs Deaths
Hospital-onset 165K $1.3 B 9,000
Community-
onset, HCF-
associated
50K $0.3 B 3,000
Nursing home-
onset263K $2.2 B 16,500
• Approximately 69% to 80% of reported CDIs occur in adults age 65 and older.
• Increased risk for persons > 65 years
– Age-related decrease
in gastric acid
– Residence in hospitals
and LTC facilities
– Overuse of Antimicrobial
medications
– Risk of cross contamination is substantial
• High prevalence of incontinence
• Shared bathroom, dining
and rehabilitation facilities
20
Why C. difficile in LTC?
Collaborative Study
• ACA - ELC funding in Sept 2011
• Kickoff Feb 2012 (18 month project)
– 36 LTC facilities volunteered to participate
21

8
Roger’s Diffusion of Innovation Theory
2.5% 13.5%
34% 34%
16.0%
People adopt change at different paces; some early, some late.
6 months or greater
Collaborative Facilities in Kentucky
23
• 53% independent free-standing
• 47% for-profit • 41% not-for-profit • 12% government
• Avg. bed size 102
• Avg. LOS 285
days
Collaborative Facility IP Staff
• Experience in Infection Control: median 3 years
• Educational level: < 9%
with Bachelor’s degree or higher
• 0% certified in infection control (CIC)
• 73% spent 50% or less time on IP functions
24
• 48% received no training

9
Study Objective
• Primary goal: reduce the incidence of
Clostridium difficile infections by 15%
• Secondary goal:
reduce the use of antimicrobials for
non-symptomatic
bacteriuria by 25%
25
Antimicrobial use in NHs
http://www.cdc.gov/DRUGRESISTANCE/healthcare/ltc.htm
• Antimicrobials are the most frequently prescribed drug class
• Comprise 40% of all prescriptions
• 50-70% of LTC residents will receive an antimicrobial during annually
• 25-75% of antimicrobial use may be inappropriate
Infections in LTC

10
Methods
• 18 month project –
– February 2012 - July 2013
– 6 months pre intervention data collection
– 6 months post intervention data collection
– Monthly conference calls and 4 in-person educational trainings
• NHSN LTC UTI and CDI Surveillance
Definitions provided by Dr. Nimalie Stone,
DQHP
28
SharePoint HAI Site
29
Methods
• Improvement Activities:
• Surveillance methods (NHSN criteria)
• Identification of symptomatic vs. non-
symptomatic UTI events
• Knowledge level of facility IP on transmission
of disease and infection prevention and control practices
– Environmental cleaning procedures
– Use of Contact Precautions and PPE
– Collection, storage, and transport of urine specimens
– Urinary catheter use and care30

11
Study Activities
• Intervention resources created
– Polices
– Monitoring tools
– Algorithms and decision trees
– Skills checklists
– Teaching power point presentations
– Case scenarios
31
Tools
32
Tools
33

12
Tools
34
UTI Empiric Antibiotic Therapy Guide
Study Results
• Analysis completed with SAS 9.3
• 18 facilities provided complete pre and post data collection
– Lack of time and loss of staff most common reason for not collecting data
• Site visits made to validate data and SAS used to identify data errors
35
Tools Adopted for Implementation
Specific Interventions Implemented n Percent
UTI and C-diff surveillance using NHSN criteria 20 95.24%
Charting to document urinary symptoms 19 90.48%
Use of bleach solution for CDI environmental cleaning 16 76.19%
Preferred use of I&O cath for urine specimen collection 16 76.19%
Use of Isolation for MDROs 14 66.67%
Monitor staff hand hygiene compliance 14 66.67%
Use of Isolation for C-diff 13 61.90%
Use of urine specimen collection algorithm 12 57.14%
Use of disinfectant product on resident’s own furniture 12 57.14%
Use of UTI prevention algorithm 12 57.14%
Skills for inserting and removing urinary catheters 12 57.14%
Skills for changing and cleaning urinary drainage bag 12 57.14%
Provided ABX empiric therapy to medical providers 11 52.38%
Scheduled assessment of need for urinary catheters 11 52.38%
Improved urine specimen storage and transport 11 52.38%
Use of post-catheter assessment decision tree 10 47.62%
21 facilities completed a post-intervention survey to determine which
interventions were the most commonly adopted

13
Results - UTI
UTIs SUTI CASUTI ABUTI MD DX
1,491 cases
360 (24%)42
(3%)4
(< .01%)738
(75%)
2.27/ 1,000 days
0.60 / 1,000 days
1.66 / 1,000 cath
days
0.01 / 1,000 days
2.1 / 1,000 days
37
• Urine Culture obtained = 84% of time (of the16% with no culture, 55% had U/A)
• Specimen collection = 41% voided spec; 41%
I&0 cath; 8% indwelling
Results - UTI
• Top 3 organisms identified
1. Escherichia Coli
2. Proteus mirabilis
3. Klebsiella pneumoniae
• Top 3 antibiotics prescribed
1. Ciprofloxacin
2. Nitrofurantoin (Macrobid/Macrodantin)
3. Bactrim
38
Avg. length of therapy = 9 days
Results - UTI
39
UTI Surveillance Symptoms
Pre Intervention
Symptoms Reported, %
ABUTICA-
SUTISUTI
MD
DX
Fever 75.00 48.15 11.16 8.54
Rigors 0.00 0.00 0.93 0.41
New onset hypotension 25.00 3.70 0.93 1.22
New onset confusion/functional
decline50.00 18.52 30.70 24.53
Acute pain, swelling, or tenderness of
the testes, epididymis or prostate0.00 14.81 2.79 0.54
Acute dysuria 0.00 11.11 61.40 2.57
Purulent drainage at catheter insertion
site0.00 3.70 0.93 0.68
None 0.00 22.22 16.74 66.80

14
Results - UTI
40
Symptoms reported (%) NHSN MD DX P value
Fever 16.39% 8.55% <0.0005
Rigors 0.82% 0.41% 0.603*
New onset hypotension 1.64% 1.22% 0.746*
Confused/Behavior Change 29.1% 24.56% 0.159
Acute pain swelling of testies 4.1% 0.54% <0.0003*
Dysuria 54.92% 2.58% <0.0001
Drainage - Catheter site 1.23% 0.68% 0.418*
No symptoms 17.21% 66.76% <0.0001
P-value is the proportion of MD diagnosis cases vs. NHSN criteria casesChi-square or *Fisher's exact test
Results - UTI
41
UTI Surveillance Symptoms
Pre-Intervention
New or Marked Increase, %
ABUTICA-
SUTISUTI
MD
DX
Urgency 0.00 7.41 27.91 1.63
Frequency 0.00 0.00 42.33 5.96
Incontinence 0.00 3.70 22.33 3.52
Suprapubic tenderness 0.00 51.85 30.70 6.23
Gross hematuria 0.00 18.52 4.19 2.71
Costovertebral angle pain 0.00 18.52 14.88 2.57
None 100.00 40.74 27.91 82.52
Results - UTI
42
New or marked increase (%) NHSN MD DX P value
Urgency 25.41% 1.63% <0.0001
Frequency 36.48% 5.67% <0.0001
Incontinence 20.08% 3.53% <0.0001
Supra Pubic tenderness 32.79% 6.24% <0.0001
Gross hematuria 5.74% 2.71% 0.0252
Costovertebral angle pain 15.16% 2.58% <0.0001
No symptoms 30.33% 82.50% <0.0001
P-value is the proportion of MD diagnosis cases vs. NHSN criteria casesChi-square or *Fisher's exact test

15
Results - UTI
43
Results - UTI
44
Goal was to see 25% Reduction
Results UTI Pre-Post Transfer – 30 days
45
Pre-Intervention
Infection
Type
UTI
Transfer
Exposure
Days
Hospitalization
Rate 95% CI
ABUTI 2 351,405 0.57 0.10 - 1.88
CA-SUTI 5 15,496 32.27 11.82 - 71.52
SUTI 15 351,405 4.27 2.48 - 6.88
MD DX 56 351,405 15.94 12.15 - 20.54
Total 78 (8%) 351,405 22.20 17.66 - 27.55
Post-Intervention
Infection Type
UTI
Transfer
Exposure
Days
Hospitalization
Rate 95% CI P Value*
ABUTI 0 246,758 0.00 -- 0.35
CA-SUTI 1 9,809 10.19 0.51 - 50.28 0.31
SUTI 9 246,758 3.65 1.78 - 6.69 0.72
MD DX 40 246,758 16.21 11.74 - 21.86 0.93
Total 50 (10%) 246,758 20.26 15.20 - 26.50 0.62
*For significance of the difference between pre and post-intervention rates: mid-P exact testRate per 100,000

16
Post-Intervention
Infection Type UTI Deaths
Exposure
Days
Mortality
Rate 95% CI P Value*
ABUTI 0 246,758 0.00 -- 0.59
CA-SUTI 1 9,809 10.19 0.51 - 50.28 0.78
SUTI 0 246,758 0.00 -- 0.07
MD DX 7 246,758 2.84 1.24 - 5.61 0.01
Total 8 (2%) 246,758 3.24 1.51 - 6.16 0.001
Results UTI Pre-Post Mortality – 30 days
46
*For significance of the difference between pre and post-intervention rates: mid-P exact testRate per 100,000
Pre-Intervention
Infection Type UTI Deaths
Exposure
Days
Mortality
Rate 95% CI
ABUTI 1 351,405 0.28 0.01 - 1.40
CA-SUTI 1 15,496 6.45 0.32 - 31.83
SUTI 5 351,405 1.42 0.52 - 3.15
MD DX 29 351,405 8.25 5.63 - 11.70
Total 36 (4%) 351,405 10.24 7.28 - 14.03
Results - CDI
• Received antibiotic therapy in previous
30 days = 63.16%
• Placed in Contact precautions = 99%
47
CDIs New Recurrent
80 cases 52 (65%) 28 (35%)
2.28 / 10,000 days
1.48 / 10,000 days
0.797 / 10,000 days
Results - CDI
48
Goal was 15% reduction

17
Results CDI Pre-Post Outcomes – 30 days
49
*For significance of the difference between pre and post-intervention rates: mid-P exact testRate per 100,000
Pre-Intervention
Outcome Events
Exposure
Days Rate 95% CI
Death 0 351,405 0.00 --
Hospitalization 6 351,405 1.71 0.69 - 3.55
Post-Intervention
EventsExposure
DaysRate 95% CI P Value*
0 246,758 0.00 -- --
4 246,758 1.62 0.52 - 3.91 0.95
Outcome
Death
Hospitalization
Lessons
• Not enough time dedicated to IP function
• Assessment and documentation of UTI symptoms needed improving
• Confusion or behavioral change always meant UTI to staff
• LTC Staff communication can impact provider
prescribing
• Urine specimen collection, storage, and transport an issue
• Environmental disinfection needed improving50
Phase II
• Phase II of the Collaborative Sept 2013-July 2014
• 14 Facilities from phase 1 continued on
• Establish an antimicrobial stewardship
committee - chaired by Facilities’ Medical Director
• Enroll in NHSN
• Add tracking of at least two MDROs
51

18
Antimicrobial Resistance
39.8% reduction (p<0.001)
Collaborative
• Fontaine Sands, DrPH, MSN, CIC
• Andrea Flinchum, MPH, BSN, CIC
• Carrell Rush, MPH, BS
• Matthew Groenewold, PhD, MSPH
(CDC EPI Field Officer)
• Robert Brawley, MD, MPH, FSHEA
• Kim Croley, PharmD
(LTC Facility Pharmacist)
• Lynn Roser, PhDc, MSN
54