Embed Size (px)
Citation preview

City of San DiegoFiscal Year 2010 Annual Budget- 141 -
The Fiscal Year 2010 Annual Budget includes summary budget information as developed and reported by five City agencies: the Redevelopment Agency, Southeastern Economic Development Corporation (SEDC), Centre City Development Corporation (CCDC), San Diego Housing Commission (SDHC), and the San Diego Data Processing Corporation (SDDPC).
The budgets for these agencies are approved by their respective governing boards.
Table 1 summarizes the Fiscal Year 2010 budgets for these City agencies.
TABLE 1FiscAL YEAr 2010 BudgET (in miLLions)
Fiscal Year 2010 Budget Positions
Redevelopment Agency $ 54.7 29.00
Southeastern Economic Development Corporation $ 15.2 15.50
Centre City Development Corporation $ 159.5 52.50
San Diego Housing Commission $ 279.4 250.50
San Diego Data Processing Corporation $ 47.2 280.00
redevelopment Agencymission statementTo improve the quality of life and ensure a healthy economy for all San Diegans through job development, business development, neighborhood revitalization, public improvements, redevelopment, social services, and revenue enhancement.
The Redevelopment Agency was created by the City Council in 1958 to alleviate blight in older urban areas. The Redevelopment Agency is able to use special legal and financial mechanisms to eliminate blight and to improve economic and physical conditions in designated areas of the City. This authority is conferred to the Agency through the State of California Health and Safety Code (Section 33000-et.seq.), also known as the California Community Redevelopment Law.
Although the Redevelopment Agency is a separate legal entity, the City Council serves as its legislative body. The Council President chairs the Agency, and the City Attorney serves as general counsel. The Redevelopment Division of the City Planning and Community Investment Department serves as staff to the Agency.
City staff working on behalf of the Agency coordinate budget and reporting requirements, prepare the Redevelopment Agency Docket, and maintain the Agency’s official records. Staff also coordinate the activities of the Agency’s two public nonprofit corporations—Centre City Development Corporation (CCDC) and Southeastern Economic Development Corporation (SEDC).

city Agencies
City of San DiegoFiscal Year 2010 Annual Budget - 142 -
The Redevelopment Agency manages 17 Redevelopment Project Areas encompassing more than 11,759 acres. Of the 17 redevelopment areas, 11 are managed by the Redevelopment Division, with the other areas managed by CCDC and SEDC. The project areas managed by the Redevelopment Division are Barrio Logan, City Heights, College Community, College Grove, Crossroads, Grantville, Linda Vista, Naval Training Center (NTC), North Bay, North Park, and San Ysidro.
The Redevelopment Division administers six Project Area Committees that advise the Agency regarding plan adoption and project implementation activities.
TABLE 2.1rEdEvELopmEnT AgEncY BudgET summArY
ciTY rEdEvELopmEnT projEcT ArEAs
FY 2008 Budget
FY 2009 Budget
FY 2010 Budget
FY 2009-2010 Change
Positions* 28.00 28.00 29.00 1.00
Personnel Expense* $ 3,028,799 $ 3,010,987 $ 3,080,143 $ 69,156
Non-Personnel Expense (Redevelopment Division)
$ 632,897 $ 327,629 $ 319,453 $ (8,176)
Non-Personnel Expense (Redevelopment Agency)
$ 83,288,304 $ 61,525,751 $ 51,295,577 $ (10,230,174)
TOTAL $ 86,950,000 $ 64,864,367 $ 54,695,173 $ (10,169,194)
* All positions and personnel expenses are budgeted in the City of San Diego’s Redevelopment Division within the City Planning and Community Investment Department. These amounts are slightly reduced from the Budget passed by the Redevelopment Agency, since the City figures were finalized after the Agency budget was passed. For further details on salary, fringe, non-personnel expenditures, and revenue for the Redevelopment Division, please refer to Volume II: Department Detail.
Note: All Division Expenses are paid for by the Redevelopment Agency. They are shown separately to reflect the administrative work done by City staff.
City of San DiegoFiscal Year 2010 Annual Budget- 143 -
city Agencies
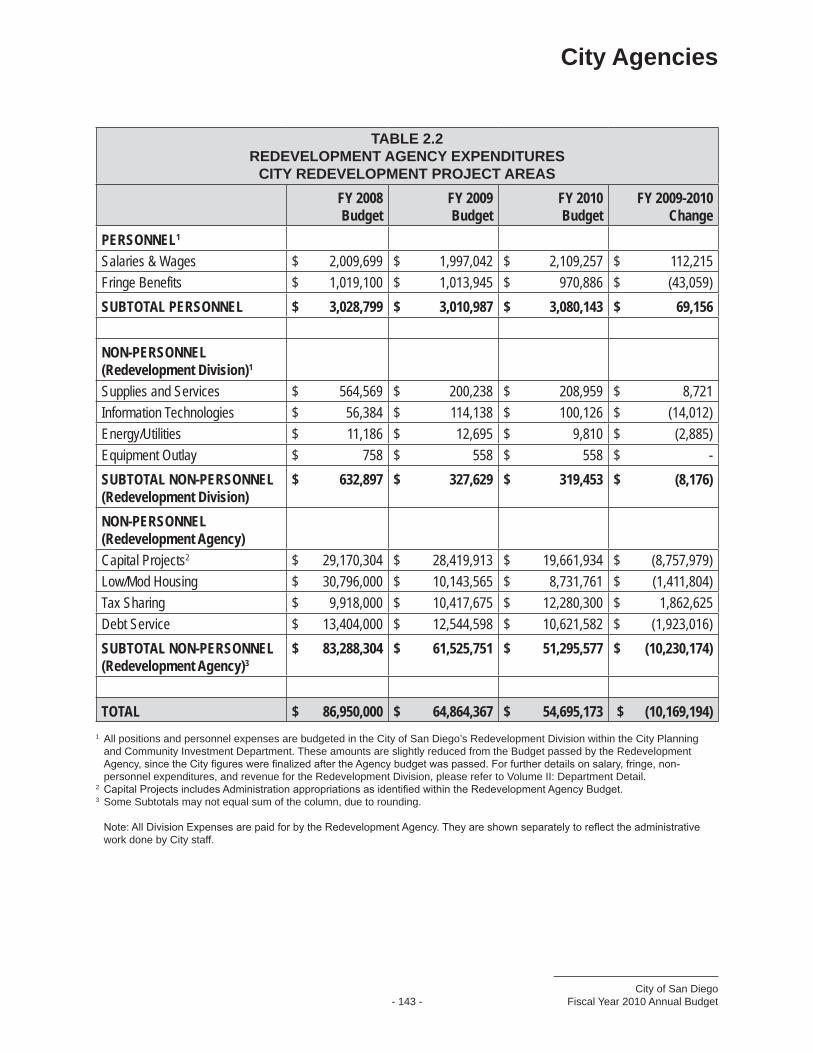
TABLE 2.2rEdEvELopmEnT AgEncY EXpEndiTurEs
ciTY rEdEvELopmEnT projEcT ArEAs
FY 2008 Budget
FY 2009 Budget
FY 2010 Budget
FY 2009-2010 Change
PERSONNEL1
Salaries & Wages $ 2,009,699 $ 1,997,042 $ 2,109,257 $ 112,215
Fringe Benefits $ 1,019,100 $ 1,013,945 $ 970,886 $ (43,059)
SUBTOTAL PERSONNEL $ 3,028,799 $ 3,010,987 $ 3,080,143 $ 69,156
NON-PERSONNEL(Redevelopment Division)1
Supplies and Services $ 564,569 $ 200,238 $ 208,959 $ 8,721
Information Technologies $ 56,384 $ 114,138 $ 100,126 $ (14,012)
Energy/Utilities $ 11,186 $ 12,695 $ 9,810 $ (2,885)
Equipment Outlay $ 758 $ 558 $ 558 $ -
SUBTOTAL NON-PERSONNEL (Redevelopment Division)
$ 632,897 $ 327,629 $ 319,453 $ (8,176)
NON-PERSONNEL (Redevelopment Agency)
Capital Projects2 $ 29,170,304 $ 28,419,913 $ 19,661,934 $ (8,757,979)
Low/Mod Housing $ 30,796,000 $ 10,143,565 $ 8,731,761 $ (1,411,804)
Tax Sharing $ 9,918,000 $ 10,417,675 $ 12,280,300 $ 1,862,625
Debt Service $ 13,404,000 $ 12,544,598 $ 10,621,582 $ (1,923,016)
SUBTOTAL NON-PERSONNEL (Redevelopment Agency)3
$ 83,288,304 $ 61,525,751 $ 51,295,577 $ (10,230,174)
TOTAL $ 86,950,000 $ 64,864,367 $ 54,695,173 $ (10,169,194)
1 All positions and personnel expenses are budgeted in the City of San Diego’s Redevelopment Division within the City Planning and Community Investment Department. These amounts are slightly reduced from the Budget passed by the Redevelopment Agency, since the City figures were finalized after the Agency budget was passed. For further details on salary, fringe, non-personnel expenditures, and revenue for the Redevelopment Division, please refer to Volume II: Department Detail.
2 Capital Projects includes Administration appropriations as identified within the Redevelopment Agency Budget.3 Some Subtotals may not equal sum of the column, due to rounding. Note: All Division Expenses are paid for by the Redevelopment Agency. They are shown separately to reflect the administrative
work done by City staff.
city Agencies
City of San DiegoFiscal Year 2010 Annual Budget - 144 -
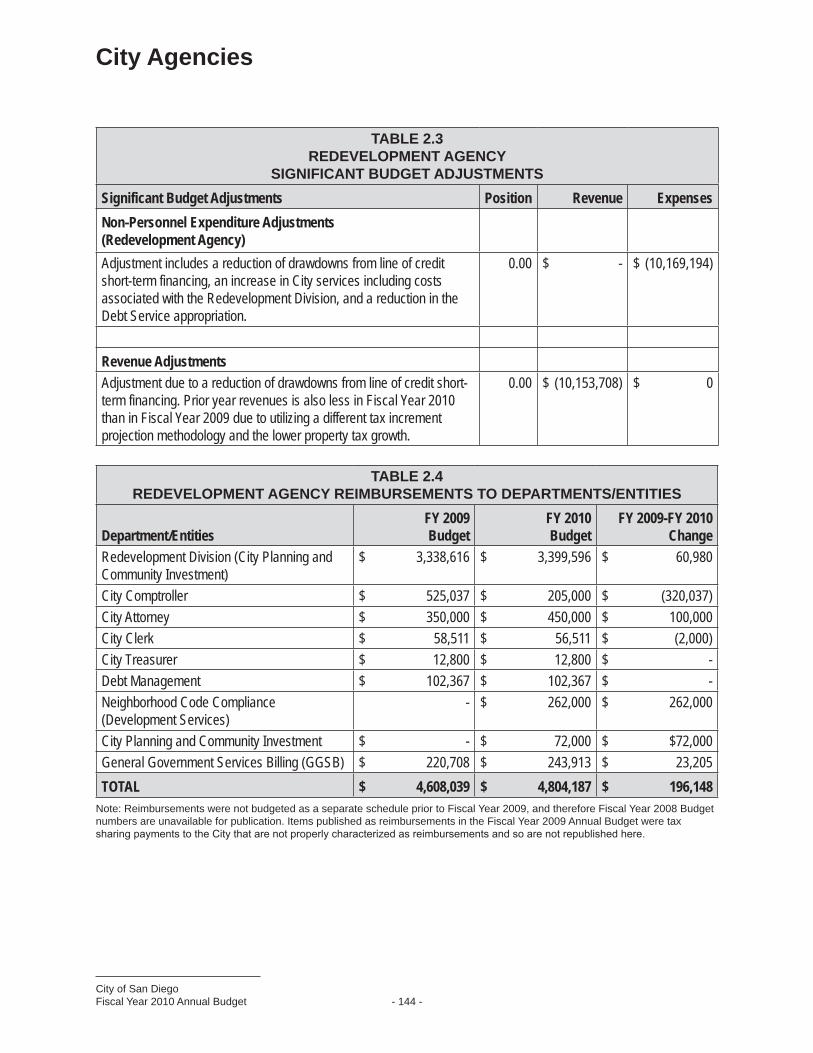
TABLE 2.4 rEdEvELopmEnT AgEncY rEimBursEmEnTs To dEpArTmEnTs/EnTiTiEs
Department/EntitiesFY 2009 Budget
FY 2010 Budget
FY 2009-FY 2010 Change
Redevelopment Division (City Planning and Community Investment)
$ 3,338,616 $ 3,399,596 $ 60,980
City Comptroller $ 525,037 $ 205,000 $ (320,037)
City Attorney $ 350,000 $ 450,000 $ 100,000
City Clerk $ 58,511 $ 56,511 $ (2,000)
City Treasurer $ 12,800 $ 12,800 $ -
Debt Management $ 102,367 $ 102,367 $ -
Neighborhood Code Compliance (Development Services)
- $ 262,000 $ 262,000
City Planning and Community Investment $ - $ 72,000 $ $72,000
General Government Services Billing (GGSB) $ 220,708 $ 243,913 $ 23,205
TOTAL $ 4,608,039 $ 4,804,187 $ 196,148 Note: Reimbursements were not budgeted as a separate schedule prior to Fiscal Year 2009, and therefore Fiscal Year 2008 Budget numbers are unavailable for publication. Items published as reimbursements in the Fiscal Year 2009 Annual Budget were tax sharing payments to the City that are not properly characterized as reimbursements and so are not republished here.
TABLE 2.3 rEdEvELopmEnT AgEncY
signiFicAnT BudgET AdjusTmEnTs
Significant Budget Adjustments Position Revenue Expenses
Non-Personnel Expenditure Adjustments (Redevelopment Agency)
Adjustment includes a reduction of drawdowns from line of credit short-term financing, an increase in City services including costs associated with the Redevelopment Division, and a reduction in the Debt Service appropriation.
0.00 $ - $ (10,169,194)
Revenue Adjustments
Adjustment due to a reduction of drawdowns from line of credit short-term financing. Prior year revenues is also less in Fiscal Year 2010 than in Fiscal Year 2009 due to utilizing a different tax increment projection methodology and the lower property tax growth.
0.00 $ (10,153,708) $ 0

City of San DiegoFiscal Year 2010 Annual Budget- 145 -
city Agencies
TABLE 2.5 rEdEvELopmEnT AgEncY rEvEnuEs
Revenue SourceFY 2008 Budget
FY 2009 Budget
FY 2010 Budget
FY 2009-FY 2010 Change
Tax Increment $ 40,513,000 $ 45,905,800 $ 46,967,410 $ 1,061,610
Line of Credit Proceeds
$ 42,153,000 $ 14,379,400 $ 5,023,696 $ (9,355,704)
Developer Proceeds/Advances
$ 923,000 $ 394,700 $ 302,000 $ (92,700)
Interest/Lease/Note/Other Revenue
$ 854,000 $ 617,100 $ 618,641 $ 1,541
Revenue from Other Agency
$ - $ 116,400 $ - $ (116,400)
Prior Year Revenues $ 2,507,000 $ 3,451,000 $ 1,798,945 $ (1,652,055)
TOTAL $ 86,950,000 $ 64,864,400 $ 54,710,692 $ (10,153,708)
southeastern Economic development corporation mission statementTo balance public investment and careful planning with a commitment to stimulate development designed to increase services, housing, and employment opportunities which will ultimately improve the quality of life for the residents of Southeastern San Diego.
Southeastern Economic Development Corporation (SEDC) is a public benefit, non-profit corporation responsible for all redevelopment activities within a seven-square-mile area immediately east of downtown San Diego. SEDC has a nine member Board of Directors appointed by the Mayor and the City Council. Established in 1981 by the City of San Diego, SEDC is responsible for an area bound by the Martin L. King, Jr. freeway (State Route 94) to the north, Interstate 5 to the south and west, and 69th Street to the east. SEDC’s sphere of influence covers 15 neighborhoods consisting of four redevelopment projects areas: Central Imperial, Gateway Center West, Mount Hope and Southcrest, and the Dells Imperial Study Area.
Economic development activities undertaken by SEDC complement the redevelopment activities that have already occurred throughout SEDC’s jurisdiction. The economic activities include but are not limited to: support to the Diamond Business Improvement District, oversight of the Agency’s Employment and Training requirements for developers, The Entrepreneur Academy, technical assistance for small businesses, a commercial rehabilitation program, a water conservation campaign, and various housing-related workshops.
SEDC’s budget has five components: administration, capital projects, low and moderate income housing, economic development, and long term debt. The Fiscal Year 2010 Annual Budget for SEDC is $15.2 million.
The annual corporate budget was presented to the SEDC Board of Directors for approval before a final submission to the San Diego Redevelopment Agency was approved on June 9, 2009.

city Agencies
City of San DiegoFiscal Year 2010 Annual Budget - 146 -
TABLE 3.1 souTHEAsTErn Economic dEvELopmEnT corporATion
BudgET summArY
FY 2008 Budget
FY 2009 Budget
FY 2010 Budget
FY 2009-2010 Change
Positions 14.50 16.00 15.50 (0.50)
Personnel Expense $ 1,675,000 $ 1,750,700 $ 1,452,600 $ (298,100)
Non-Personnel Expense $ 30,785,000 $ 16,487,300 $ 13,704,400 $ (2,782,900)
TOTAL $ 32,460,000 $ 18,238,000 $ 15,157,000 $ (3,081,000)
TABLE 3.2 souTHEAsTErn Economic dEvELopmEnT corporATion EXpEndiTurEs
FY 2008 Budget
FY 2009 Budget
FY 2010 Budget
FY 2009-2010 Change
PERSONNEL
Salaries & Wages $ 1,307,000 $ 1,335,700 $ 1,107,100 $ (228,600)
Fringe Benefits (health) $ 169,268 $ 206,900 $ 167,500 $ (39,400)
Fringe Benefits (pension) $ 161,751 $ 169,600 $ 132,900 $ (36,700)
Fringe Benefits (Life Insurance, Workers’ Comp, Employer Employment Taxes)
$ 36,981 $ 38,500 $ 45,100 $ 6,600
SUBTOTAL PERSONNEL $ 1,675,000 $ 1,750,700 $ 1,452,600 $ (298,100)
NON-PERSONNEL
Supplies & Services $ 627,200 $ 750,400 $ 648,050 $ (102,350)
Professional Services $ 156,000 $ 161,000 $ 180,500 $ 19,500
Information Technologies $ 57,000 $ 11,600 $ 32,400 $ 20,800
Energy/Utilities $ 33,600 $ 27,600 $ 31,400 $ 3,800
Equipment Outlay $ 27,900 $ 15,600 $ 650 $ (14,950)
Project Costs $ 23,253,300 $ 11,274,100 $ 9,720,400 $ (1,553,700)
Debt Service appropriation $ 6,630,000 $ 4,247,000 $ 3,091,000 $ (1,156,000)
SUBTOTAL NON-PERSONNEL $ 30,785,000 $ 16,487,300 $ 13,704,400 $ (2,782,900)
TOTAL $ 32,460,000 $ 18,238,000 $ 15,157,000 $ (3,081,000)

City of San DiegoFiscal Year 2010 Annual Budget- 147 -
city Agencies
TABLE 3.3 souTHEAsTErn Economic dEvELopmEnT corporATion
signiFicAnT BudgET AdjusTmEnTs
Significant Budget Adjustments Position Revenue Expenses
Salaries and Benefits Adjustments
Reduction due to company reorganization which reduced payroll and fringe benefits costs.
(0.50) $ - $ (298,100)
Non-Personnel Expenditure Adjustments
Supplies & Services Adjustment reflects a reduction in administrative costs in order to bring budget in line with prior-year actual spending.
0.00 $ - $ (102,350)
Professional Services Adjustment reflects an additional increase due to the audit.
0.00 $ - $ 19,500
Information Technologies Adjustment is a result of costs associated with the implementation of the City’s SAP system.
0.00 $ - $ 20,800
Energy/Utilities Increase brings budget in line with actual spending.
0.00 $ - $ 3,800
Equipment Outlay Adjustment due to cutbacks. 0.00 $ - $ (14,950)
Project Costs and Debt Service Appropriation Adjustments reflect the amount of the $24.2 million 2007 tax allocation net bond proceeds that were used to fund projects in prior fiscal years and therefore are not available in the subsequent years.
0.00 $ - $ (2,709,700)
TOTAL EXPENSE ADJUSTMENTS (0.50) $ - $ (3,081,000)
Revenue Adjustments
Adjustment reflects an anticipated reduction in tax increment due to foreclosures and appeals.
0.00 $ (543,775) $ -
Reduction in Carryover and Other Income due to depleted bond proceed balances.
0.00 $ (4,173,925) $ -
TOTAL REVENUE ADJUSTMENTS 0.00 $ (4,717,700) $ -

city Agencies
City of San DiegoFiscal Year 2010 Annual Budget - 148 -
TABLE 3.4 souTHEAsTErn Economic dEvELopmEnT corporATion
rEimBursEmEnTs To dEpArTmEnTs/EnTiTiEs
Department/EntitiesFY 2008 Budget
FY 2009 Budget
FY 2010 Budget
FY 2009-2010 Change
City Attorney $ 52,000 $ 45,500 $ 45,500 $ -
City Comptroller $ 100,100 $ 100,100 $ 100,100 $ -
Financial Management $ 1,000 $ 1,000 $ 1,000 $ -
City Treasurer $ 30,000 $ 30,000 $ 30,000 $ -
Redevelopment Division $ 83,200 $ 78,000 $ 78,000 $ -
Arbitrage $ 19,500 $ 12,000 $ 12,000 $ -
General Government Services $ 66,300 $ 66,300 $ 66,300 $ -
Redevelopment Audit Fees $ 75,000 $ 75,000 $ 75,000 $ -
Community Development Block Grant (audit fees)
$ 25,000 $ 25,000 $ 25,000 $ -
Municipal Revenue Advisor $ 2,500 $ 2,500 $ 2,500 $ -
County Services (accounting services)1
$ - $ - $ 54,000 $ 54,000
General Liabilities Insurance $ 70,000 $ 95,000 $ 95,000 $ -
Maintenance (street light/storage)
$ 1,200 $ 1,200 $ 1,200 $ -
Neighborhood Code Compliance
$ 100,000 $ 132,000 $ 132,000 $ -
TOTAL $ 625,800 $ 663,600 $ 717,600 $ 54,000
1 County Services are combined with the City Reimbursements effective with the Fiscal Year 2010 Budget.
Note: Some of the City services such as General Liabilities Insurance, Maintenance, and Neighborhood Code Compliance are reflected in project costs for the Fiscal Year 2010 Budget.
TABLE 3.5 souTHEAsTErn Economic dEvELopEnT corporATion rEvEnuEs
Revenue SourceFY 2008 Budget
FY 2009 Budget
FY 2010 Budget
FY 2009-FY 2010 Change
Tax Increment1 $ 6,782,000 $ 7,366,775 $ 6,823,000 $ (543,775)
Bond Proceeds $ 24,206,000 $ - $ - $ -
Interest $ - $ - $ - $ -
Carryover and Other Income2
$ 1,472,000 $ 12,507,925 $ 8,334,000 $ (4,173,925)
TOTAL $ 32,460,000 $ 19,874,700 $ 15,157,000 $ (4,717,700)
1 Anticipated reduction in tax increment revenue in Fiscal Year 2010 due to foreclosures and appeals.2 Carryover includes use of bond proceeds from prior year bond issuances.

City of San DiegoFiscal Year 2010 Annual Budget- 149 -
city Agencies
TABLE 3.6 souTHEAsTErn Economic dEvELopmEnT corporATion
sALArY scHEduLE
FY 2009 BUDgET FY 2010 BUDgET
Position Title
Posi-tions
Base Salary
Salary Increases
(Merit, Bonus,
etc.)
Pay-in-
Lieu2
Salary Subtotal
Fringe Benefits
Posi-tions
Base Salary Salary Increases
(Merit, Bonus,
etc.)
Pay-in-
Lieu2
Salary Subtotal
Fringe Benefits
President 1.00 $ 178,880 $ 7,155 $ 17,200 $ 203,235 $ 41,227 1.00 $ 172,000 $ - $ 9,923 $ 181,923 $ 45,057
CFO 0.00 $ - $ - $ - $ - $ - 1.00 $ 115,000 $ - $ 11,923 $ 126,923 $ 36,812
Director of Finance
1.00 $ 109,200 $ 4,368 $ 6,300 $ 119,868 $ 40,613 0.00 $ - $ - $ - $ - $ -
Manager of Projects & Development
0.00 $ - $ - $ - $ - $ - 1.00 $ 90,000 $ - $ 5,192 $ 95,192 $ 29,760
Project and Other Managers
6.00 $ 365,470 $ 14,576 $ 22,185 $ 402,231 $ 135,193 5.00 $ 266,250 $ - $ 20,815 $ 287,065 $ 99,746
Staff Accountants
2.00 $ 122,720 $ 4,908 $ 7,080 $ 134,708 $ 45,398 2.00 $ 118,000 $ - $ 9,928 $ 127,928 $ 39,818
Administra-tive/Support Staff
6.00 $ 273,412 $ 10,896 $ 17,035 $ 301,343 $ 126,479 5.50 $ 234,900 $ - $ 17,812 $ 252,712 $ 86,566
Overtime3 $ 3,348 $ 170,997 $ - $ 174,345 $ 26,090 $ 35,357 $ - $ - $ 35,357 $ 7,741
TOTAL 16.00 $ 1,053,030 $ 212,900 $ 69,800 $ 1,335,730 $ 415,000 15.50 $ 1,031,507 $ - $ 75,593 $ 1,107,100 $ 345,500
1 No bonuses have been paid, or will be paid, for Fiscal Year 2009.2 Pay-in-Lieu are payments to employees for unused vacation (up to 80 hours) and unused sick leave (up to 40 hours) per the
current company policy.3 Fiscal Year 2009 figures include bonuses that were budgeted in this line item, while the Fiscal Year 2010 budget includes only
overtime.
centre city development corporationmission statementTo act on behalf of the Redevelopment Agency of the City of San Diego to create a 24-hour livable, downtown community by eliminating blight, providing affordable housing, improving the public realm, facilitating public and private developments, stimulating economic development, and creating jobs.
Centre City Development Corporation (CCDC) was created by the City of San Diego as an independent non-profit corporation in 1975 in order to plan, implement, and direct the redevelopment of San Diego’s urban core. CCDC oversees the redevelopment of approximately 1,450 acres, an area that includes Centre City and Horton Plaza Redevelopment Project Areas.
The Fiscal Year 2010 Budget was presented to the Centre City Advisory Committee on March 11, 2009, to the CCDC Board on March 18, 2009, and approved by the Redevelopment Agency on June 9, 2009.
The Fiscal Year 2010 Annual Budget consists of three components: project activities inclusive of the use of low and moderate housing funds, long-term debt, and administration. CCDC’s budget totals $159.5 million and is funded primarily from tax increments. The project budget is $95.0 million and is made up

city Agencies
City of San DiegoFiscal Year 2010 Annual Budget - 150 -
TABLE 4.1 cEnTrE ciTY dEvELopmEnT corporATion
BudgET summArY
FY 2008 Budget
FY 2009 Budget
FY 2010 Budget
FY 2009-2010 Change
Positions 55.20 56.50 52.50 (4.00)
Personnel Expense $ 6,834,500 $ 7,178,000 $ 6,424,000 $ (754,000)
Non-Personnel Expense $ 210,701,500 $ 228,322,000 $ 153,124,000 $ (75,198,000)
TOTAL $ 217,536,000 $ 235,500,000 $ 159,548,000 $ (75,952,000)
TABLE 4.2 cEnTrE ciTY dEvELopmEnT corporATion EXpEndiTurEs
FY 2008 Budget
FY 2009 Budget
FY 2010 Budget
FY 2009-2010 Change
PERSONNEL
Salaries & Wages $ 4,775,500 $ 4,917,000 $ 4,175,000 $ (742,000)
Overtime/Interns $ 92,000 $ 125,000 $ 120,000 $ (5,000)
Fringe Benefits (health) $ 664,541 $ 727,798 $ 772,175 $ 44,377
Fringe Benefits (pension) $ 1,050,243 $ 1,123,910 $ 1,050,376 $ (73,534)
Fringe Benefits (other)* $ 252,216 $ 284,292 $ 306,449 $ 22,157
SUBTOTAL PERSONNEL $ 6,834,500 $ 7,178,000 $ 6,424,000 $ (754,000)
NON-PERSONNEL
Corporation Professional Services $ 280,000 $ 360,000 $ 625,000 $ 265,000
Other G & A Expenses $ 2,241,500 $ 2,338,500 $ 1,851,000 $ (487,500)
Project Budgets $ 171,559,000 $ 174,999,500 $ 94,989,000 $ (80,010,500)
Debt Service / City Payments $ 36,621,000 $ 50,624,000 $ 55,659,000 $ 5,035,000
SUBTOTAL NON-PERSONNEL $ 210,701,500 $ 228,322,000 $ 153,124,000 $ (75,198,000)
TOTAL $ 217,536,000 $ 235,500,000 $ 159,548,000 $ (75,952,000)
* Other Fringe Benefits are: Life Insurance, L-T Disability, Federal Medicare Insurance, Unemployment Insurance, Transit/Parking, Tuition Reimbursement, 125 Plan-Flex Benefit, Management Package, Vacation-In-Lieu, Employee Assistance Program, and Contingency for fringe benefits.
of $56.1 million for projects, $17.5 million for affordable housing, and $21.4 for tax sharing entities and City services. The balance of the budget is composed of $44.3 million for debt service, $11.3 million for City payments, and $8.9 million for CCDC administration.
CCDC has a seven member Board of Directors appointed by the City Council to manage the Corporation and its professional staff.
City of San DiegoFiscal Year 2010 Annual Budget- 151 -
city Agencies
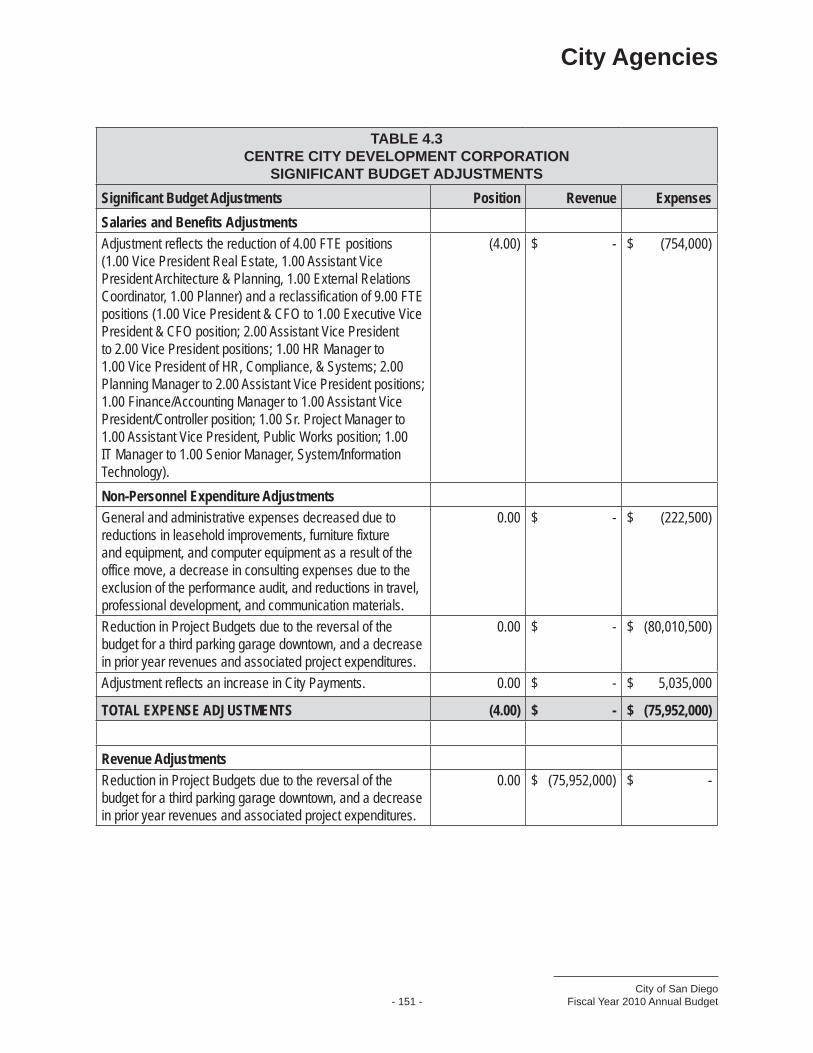
TABLE 4.3 cEnTrE ciTY dEvELopmEnT corporATion
signiFicAnT BudgET AdjusTmEnTs
Significant Budget Adjustments Position Revenue Expenses
Salaries and Benefits Adjustments
Adjustment reflects the reduction of 4.00 FTE positions (1.00 Vice President Real Estate, 1.00 Assistant Vice President Architecture & Planning, 1.00 External Relations Coordinator, 1.00 Planner) and a reclassification of 9.00 FTE positions (1.00 Vice President & CFO to 1.00 Executive Vice President & CFO position; 2.00 Assistant Vice President to 2.00 Vice President positions; 1.00 HR Manager to 1.00 Vice President of HR, Compliance, & Systems; 2.00 Planning Manager to 2.00 Assistant Vice President positions; 1.00 Finance/Accounting Manager to 1.00 Assistant Vice President/Controller position; 1.00 Sr. Project Manager to 1.00 Assistant Vice President, Public Works position; 1.00 IT Manager to 1.00 Senior Manager, System/Information Technology).
(4.00) $ - $ (754,000)
Non-Personnel Expenditure Adjustments
General and administrative expenses decreased due to reductions in leasehold improvements, furniture fixture and equipment, and computer equipment as a result of the office move, a decrease in consulting expenses due to the exclusion of the performance audit, and reductions in travel, professional development, and communication materials.
0.00 $ - $ (222,500)
Reduction in Project Budgets due to the reversal of the budget for a third parking garage downtown, and a decrease in prior year revenues and associated project expenditures.
0.00 $ - $ (80,010,500)
Adjustment reflects an increase in City Payments. 0.00 $ - $ 5,035,000
TOTAL EXPENSE ADJUSTMENTS (4.00) $ - $ (75,952,000)
Revenue Adjustments
Reduction in Project Budgets due to the reversal of the budget for a third parking garage downtown, and a decrease in prior year revenues and associated project expenditures.
0.00 $ (75,952,000) $ -

city Agencies
City of San DiegoFiscal Year 2010 Annual Budget - 152 -
TABLE 4.4 cEnTrE ciTY dEvELopmEnT corporATion
rEimBursEmEnTs To dEpArTmEnTs/EnTiTiEs
Department/EntitiesFY 2008 Budget
FY 2009 Budget
FY 2010 Budget
FY 2009-FY2010 Change
Neighborhood Code Compliance $ 220,000 $ 301,000 $ 301,000 $ -
City Comptroller $ 260,000 $ 270,000 $ 270,000 $ -
City Attorney $ 260,000 $ 250,000 $ 238,500 $ (11,500)
City Treasurer $ 220,000 $ 290,000 $ 250,000 $ (40,000)
City Planning and Community Investment
$ 125,000 $ 40,000 $ 25,000 $ (15,000)
Redevelopment Division $ 120,000 $ 120,000 $ 100,000 $ (20,000)
Homeless Coordinator $ 60,000 $ 60,000 $ 21,500 $ (38,500)
Purchasing–EEO $ 15,000 $ 15,000 $ 10,000 $ (5,000)
General Government Services $ 170,000 $ 300,000 $ 500,000 $ 200,000
Downtown Economic Development Specialist
$ 150,000 $ 150,000 $ 150,000 $ -
Maintenance District $ - $ - $ 175,000 $ 175,000
Other/Misc./Contingency $ 100,000 $ 104,000 $ 59,000 $ (45,000)
TOTAL $ 1,700,000 $ 1,900,000 $ 2,100,000 $ 200,000
TABLE 4.5 cEnTrE ciTY dEvELopmEnT corporATion rEvEnuEs
Revenue SourceFY 2008 Budget
FY 2009 Budget
FY 2010 Budget
FY 2009-FY 2010 Change
Tax Increment $ 102,127,000 $ 123,275,000 $ 133,578,000 $ 10,303,000
Developer Proceeds $ 1,950,000 $ 14,550,000 $ 4,640,000 $ (9,910,000)
Interest, Rent, & Other Revenues
$ 19,384,000 $ 21,114,000 $ 17,708,000 $ (3,406,000)
Bond Proceeds $ 60,115,000 $ 30,000,000 $ - $ (30,000,000)
Revenues from Other Agencies
$ 1,000,000 $ 4,800,000 $ 1,400,000 $ (3,400,000)
Misc./Prior Year Adjustments
$ 32,960,000 $ 41,761,000 $ 2,222,000 $ (39,539,000)
TOTAL $ 217,536,000 $ 235,500,000 $ 159,548,000 $ (75,952,000)

City of San DiegoFiscal Year 2010 Annual Budget- 153 -
city Agencies
TABLE 4.6 cEnTrE ciTY dEvELopmEnT corporATion
sALArY scHEduLEFY 2009 BUDgET FY 2010 BUDgET
Position Title PositionsBase
Salary
Salary Increases
(Merit, Bonus,
etc.)1Salary
SubtotalFringe
Benefits2 PositionsBase
Salary
Salary Increases
(Merit, Bonus,
etc.)3Salary
SubtotalFringe
Benefits4
President & COO
1.00 $ 248,000 $ 13,850 $ 261,850 $ 116,548 1.00 $ 225,000 $ - $ 225,000 $ 119,050
Senior Vice President & CFO
1.00 $ 176,800 $ 9,873 $ 186,673 $ 84,092 1.00 $ 176,800 - $ 176,800 $ 94,296
Vice President 2.00 $ 292,500 $ 16,334 $ 308,834 $ 140,332 4.00 $ 465,720 - $ 465,720 $ 204,737 Assistant Vice President
3.00 $ 395,000 $ 22,058 $ 417,058 $ 190,556 4.00 $ 409,855 - $ 409,855 $ 161,510
Senior Project Manager
6.00 $ 658,640 $ 36,780 $ 695,420 $ 300,232 5.00 $ 546,917 - $ 546,917 $ 340,344
Associate/Assistant Project Manager
4.00 $ 273,340 $ 15,264 $ 288,604 $ 124,598 4.00 $ 273,340 - $ 273,340 $ 140,375
Planning Manager
2.00 $ 204,100 $ 11,397 $ 215,497 $ 93,036 0.00 $ - - $ - $ -
Finance/Accounting Manager
1.00 $ 91,000 $ 5,082 $ 96,082 $ 41,481 0.00 $ - - $ - $ -
Managers: Marketing, HR, IT
5.00 $ 392,730 $ 21,931 $ 414,661 $ 182,521 4.00 $ 305,230 - $ 305,230 $ 205,188
Planner 7.00 $ 505,590 $ 28,233 $ 533,823 $ 230,467 6.00 $ 420,630 - $ 420,630 $ 216,016 Executive and Administrative Assistant
8.00 $ 413,975 $ 23,117 $ 437,092 $ 188,705 8.00 $ 413,975 - $ 413,975 $ 212,600
Specialist: Marketing, Graphic, EEO, IT, GIS
7.50 $ 472,688 $ 26,396 $ 499,084 $ 215,469 6.50 $ 385,732 - $ 385,732 $ 198,094
Accountant & Financial Analyst
5.00 $ 340,480 $ 19,013 $ 359,493 $ 155,203 5.00 $ 329,980 - $ 329,980 $ 169,463
Clerical Support 4.00 $ 131,100 $ 7,321 $ 138,421 $ 59,760 4.00 $ 131,100 - $ 131,100 $ 67,327 Overtime/Interns
$ 125,000 $ 125,000 $ 120,000 $ 120,000
Contingency5 $ 77,408 $ 77,408 $ 90,721 $ 90,721 TOTAL 56.50 $ 4,798,351 $ 256,649 $ 5,055,000 $ 2,123,000 52.50 $ 4,295,000 $ - $ 4,295,000 $ 2,129,000
1 Salary increases (3 percent) and $120,000 of incentive (bonus) pay have been allocated proportionately based on the percentage of position base salary to total base salary in order to comply with the City’s budget template. CCDC does not budget salary increases or incentive pay by position or job classification. However in order to comply with the City’s budget request, the Salary Increases column above has been allocated by the Position Title. No increases or incentive pay have been paid in Fiscal Year 2009.
2 Fringe benefits have been allocated proportionately based on the percentage of position base salary to total base salary in order to comply with the City’s budget template. CCDC does not budget Fringe Benefits by position or job classification but overall for the Corporation, based on the total base salary.
3 There are no salary increases or incentive pay budgeted in Fiscal Year 2010.4 Fringe benefits have been allocated proportionately based on the percentage of position base salary to total base salary in order to
comply with the City’s budget template. CCDC does not budget Fringe Benefits by position or job classification but overall for the Corporation, based on the total base salary.
5 Contingency is a provision for payout of accrued vacation for any potential attrition. In addition, it includes a provision for any additional needs when hiring and/or for special circumstances such as a severance package or a retention adjustment.

city Agencies
City of San DiegoFiscal Year 2010 Annual Budget - 154 -
san diego Housing commissionmission statementTo provide quality housing opportunities in order to improve the lives of those in need.
The San Diego Housing Commission (SDHC) is a public agency working to expand affordable housing opportunities in the City of San Diego. Each year the agency helps more than 80,000 lower-income individuals to access affordable housing through its award-winning programs. SDHC’s programs benefit the City’s economy and revitalize its neighborhoods through three major areas of work: housing assistance, housing development and finance partnerships, and housing policy advice. In Fiscal Year 2010, SDHC will provide new opportunities to access affordable housing including help for families who purchase foreclosed homes or need assistance to prevent foreclosure, and help for individuals and families who need supportive housing or homeless services. The Agency will also have opportunities to develop and finance a significant number of new affordable homes.
The agency’s housing assistance programs provide a variety of services that includes helping more than 13,780 families pay rent in private housing, owning and managing nearly 1,800 apartments, and providing clients with academic support and career development tools. SDHC’s housing finance partnerships have helped nonprofit and for-profit developers create nearly 25,000 for-sale and rental homes, of which 12,000 are deemed affordable. Agency programs have also enabled 4,300 families to buy their first homes and 10,000 to repair older homes. Finally, the agency helps to shape the City’s affordable housing programs by providing policy advice to the San Diego City Council as well as initiating, monitoring, or implementing municipal ordinances that advance affordable housing production and protect existing stock. Examples of municipal ordinances worked on by SDHC are inclusionary zoning, density bonus, single room occupancy preservation, and condo conversion protections.
The Fiscal Year 2010 Budget for the San Diego Housing Commission was approved by the Housing Authority on June 16, 2009.
TABLE 5.1 sAn diEgo Housing commission
BudgET summArY
FY 2008 Budget
FY 2009 Budget
FY 2010 Budget
FY 2009-2010 Change
Positions 238.00 243.50 250.50 7.00
Personnel Expense $ 17,838,859 $ 18,686,970 $ 19,734,336 $ 1,047,366
Non-Personnel Expense $ 256,558,564 $ 282,194,446 $ 259,704,587 $ (22,489,859)
TOTAL $ 274,397,423 $ 300,881,416 $ 279,438,923 $ (21,442,493)

City of San DiegoFiscal Year 2010 Annual Budget- 155 -
city Agencies
TABLE 5.2 sAn diEgo Housing commission EXpEndiTurEs
FY 2008 Budget
FY 2009 Budget
FY 2010 Budget
FY 2009-2010 Change
PERSONNELSalaries & Wages $ 13,049,014 $ 13,654,510 $ 14,449,242 $ 794,732Overtime $ 150,000 $ 150,000 $ 150,004 $ 4Fringe Benefits (health) $ 1,687,170 $ 1,777,542 $ 1,917,296 $ 139,754Fringe Benefits (pension) $ 1,847,867 $ 1,932,637 $ 2,043,891 $ 111,254Fringe Benefits (Life, LTD, Medicare, Workers Comp, SUI, and 457)
$ 1,104,808 $ 1,172,281 $ 1,173,903 $ 1,622
SUBTOTAL PERSONNEL $ 17,838,859 $ 18,686,970 $ 19,734,336 $ 1,047,366
NON-PERSONNELLegal $ 648,550 $ 764,750 $ 718,691 $ (46,059)Training $ 172,113 $ 207,644 $ 203,272 $ (4,372)Travel $ 111,105 $ 115,848 $ 129,941 $ 14,093Audit $ 94,000 $ 91,000 $ 91,000 $ -Professional Services $ 3,096,798 $ 3,894,486 $ 3,349,354 $ (545,132)Office Rent $ 1,898,678 $ 1,898,678 $ 2,808,691 $ 910,013Sundry $ 1,923,502 $ 1,983,274 $ 2,045,161 $ 61,887Management Fees $ 752,900 $ - $ - $ -Insurance $ 521,992 $ 488,662 $ 522,591 $ 33,929Office Equipment $ 600,628 $ 735,785 $ 681,312 $ (54,473)WED Expenses $ 1,317,746 $ 1,277,596 $ 896,103 $ (381,493)Maintenance Expenses $ 2,948,440 $ 2,949,581 $ 3,021,548 $ 71,967Utilities $ 1,977,635 $ 2,014,887 $ 2,128,587 $ 113,700Property Taxes $ 28,200 $ 42,450 $ 42,450 $ -Collection Loss $ 124,156 $ 155,762 $ 155,762 $ -Mortgage Payments $ 5,127,073 $ 2,106,255 $ 2,049,502 $ (56,753)Protective Services $ 447,815 $ 416,385 $ 428,744 $ 12,359Rent to Owners $ 145,838,511 $ 158,323,324 $ 157,045,949 $ (1,277,375)Loans/Grants $ 47,001,628 $ 51,400,945 $ 28,698,321 $ (22,702,624)Relocation $ 1,260,983 $ 1,356,070 $ 705,900 $ (650,170)Site Acquisition & Housing Development $ 9,267,748 $ 14,158,199 $ 20,387,423 $ 6,229,224Capital Improvements $ 3,779,330 $ 1,466,123 $ 1,819,482 $ 353,359Dwelling Equipment $ 1,065,700 $ 867,692 $ 171,250 $ (696,442)Reserves $ 26,553,333 $ 35,479,050 $ 31,603,553 $ (3,875,497)
SUBTOTAL NON-PERSONNEL $ 256,558,564 $ 282,194,446 $ 259,704,587 $ (22,489,859)
TOTAL $ 274,397,423 $ 300,881,416 $ 279,438,923 $ (21,442,493)

city Agencies
City of San DiegoFiscal Year 2010 Annual Budget - 156 -
TABLE 5.3 sAn diEgo Housing commission
signiFicAnT BudgET AdjusTmEnTs
Significant Budget Adjustments Position Revenue Expenses
Salaries and Benefits Adjustments
Adjustment includes the addition of 7.00 positions, the reclassification of 8.00 positions, an approved 2 percent salary step increase, anticipated employee movement along the seven-step merit pay plan in Fiscal Year 2010, a change in benefits based on a percentage of salary, and an approved increase in the flex credit plan. A 5 percent Classification & Compensation factor of $877,571 was transferred from Salaries and Benefits to Reserves as directed by the Housing Authority.
7.00 $ - $ 1,047,366
Non-Personnel Expenditure Adjustments
Legal Adjustment is due to the elimination of Policy & Public Affairs.
0.00 $ - $ (46,059)
Training Adjustment is the net result of a reduction in several activities to align budget with actual expenditures–($16,697), an increase in Organizational Development & Training for professional development and assessment–$8,125, and an increase in Board & Executive Functions for new Commissioners and staff training–$4,200.
0.00 $ - $ (4,372)
Travel Increase in travel is the net result of an increase in Board & Executive Functions to provide travel for new commissioners that included the transfer of the Policy & Public Affairs travel budget to Board & Executive Functions–$24,000, and a net reduction in several activities to align budget with actual expenditures–($9,907).
0.00 $ - $ 14,093
Professional Services Adjustment in contracts/consultants is due to a variety of changes: the reduction in Rehab Rental Housing & Owner Occupied activities due to the transfer of two direct hire contract positions to permanent positions in Fiscal Year 2010; the elimination of Program & Policy Affairs; a reduction in Rental Assistance, Workforce & Economic Development, and Human Resources; an increase in Rental Housing Development to provide for housing development acquisition and new construction consultants; an increase in Financial Services and Board & Executive Functions; an increase in Homeownership due to the addition of 1.5 direct hire positions for the Neighborhood Stabilization Program; an increase in Special Purpose Housing for the Emergency Housing and Assistance Program (EHAP) application; and decreases in various activities.
0.00 $ - $ (545,132)

City of San DiegoFiscal Year 2010 Annual Budget- 157 -
city Agencies
Significant Budget Adjustments Position Revenue Expenses
Office Rent Adjustment due to the increase in the per square foot charge from $2.35 to $3.15.
0.00 $ - $ 910,013
Sundry Adjustment is the net of the following changes: an increase for software support–$25,800, an increase in business expense to provide for quarterly agency staff meetings–$24,116, an increase in Agency memberships in housing related and professional organizations–$22,157, an increase in office supplies for wireless phone headsets for the Rental Assistance staff–$21,150, an increase in paper shredding services–$19,508, an increase to provide parking, trolley, and bus reimbursement for staff–$19,389, an increase in advertising for hiring and requests for proposals–$13,760, an increase to provide additional machines for Property Management–$12,000, a reduction in moving expenses, Board & Executive Functions, and Information Technology–($45,000), a reduction primarily due to the result of eliminating auto allowances–($36,138), a reduction in janitorial services due to the closure of office at Calle Primera–($12,000), and a net reduction in other sundry accounts–($2,855).
0.00 $ - $ 61,887
Insurance Adjustment reflects an increase due to the providers’ estimate of higher costs for property, employment practices, and vehicle insurance, while costs for general liability, boiler and machinery, crime and fiduciary insurance are expected to decrease.
0.00 $ - $ 33,929
Office Equipment Adjustment reflects a decrease in Information Technology, Financial Services, Rehab Owner Occupied, and Policy & Public Affairs, as well as an increase to provide furniture for the Economic Development Academy.
0.00 $ - $ (54,473)
Workforce & Economic Development Expenses Adjustment is the result of spending or committing prior year and current year funding in Fiscal Year 2009. It is expected that new awards to replenish these decreases will occur during Fiscal Year 2010.
0.00 $ - $ (381,493)
Maintenance Expenses Adjustment reflects additional maintenance contracting for the Smart Corner office facility–$42,667, maintenance materials and contracts for the planned acquisition of new units in Property Management–$31,000, a reduction in janitorial services for Workforce and Economic Development–($1,700).
0.00 $ - $ 71,967
Utilities Adjustment reflects anticipated increases in Fiscal Year 2010 rates for water, sewer, gas and electric utilities for agency-managed units and office facilities.
0.00 $ - $ 113,700

city Agencies
City of San DiegoFiscal Year 2010 Annual Budget - 158 -
Significant Budget Adjustments Position Revenue Expenses
Mortgage Adjustment reflects loan payoffs to the State of California on the Casa Colina and 52nd Street properties.
0.00 $ - (56,753)
Protective Services Adjustment provides for additional monitoring equipment and services at the Smart Corner office facility and at the economic development academies.
0.00 $ - 12,359
Rent to Owners Reduction is due primarily to a decrease in Section 8 Voucher funds for rent to owners–($758,834), a decrease in Shelter Plus Care funds–($345,432), a decrease resulting from less carryover of HOME Tenant Based Rental Assistance for special purpose transitional vouchers–($210,000), and other changes including an addition for the Section 8 Mod Rehab program and a reduction in the Disaster Voucher program–$36,891.
0.00 $ - (1,277,375)
Loans & grants Adjustment is due to less new revenues anticipated in Fiscal Year 2010, less carryover anticipated in Fiscal Year 2010, reduction due to the completion of the first round of lead control grants, an addition of new funds in several programs including HOME, Cal State Housing Trust Fund, Shelter Plus Care, and Property Management, and the transfer of CDBG funds from Site Acquisition/Housing Development to Loans & Grants for rehabilitation.
0.00 $ - (22,702,624)
Relocation Adjustment reflects a transfer of PH repositioning fees from relocation in Property Management to Site Acquisition/Housing Development in Rental Housing Development–($555,821), a reduction in Construction Services to provide for relocation–($50,000), and a reduction in Rehab Rental Housing and Rehab Owner Occupied to reflect the new lead grants–($44,349).
0.00 $ - (650,170)
Site Acquisition Adjustment includes net additions in Rental Housing Development, Smart Corner Office Facility, and Portfolio Servicing, and the transfer of $2.0 million from Loans & Grants.
0.00 $ - 6,229,224
Capital Improvements The increase will provide for capital improvements at the Housing Commission-owned, Public Housing, and State Rental Housing properties.
0.00 $ - 353,359
Dwelling Equipment Adjustment reflects the Fiscal Year 2009 purchase of stoves for the SDHC local units.
0.00 $ - (696,442)
City of San DiegoFiscal Year 2010 Annual Budget- 159 -
city Agencies
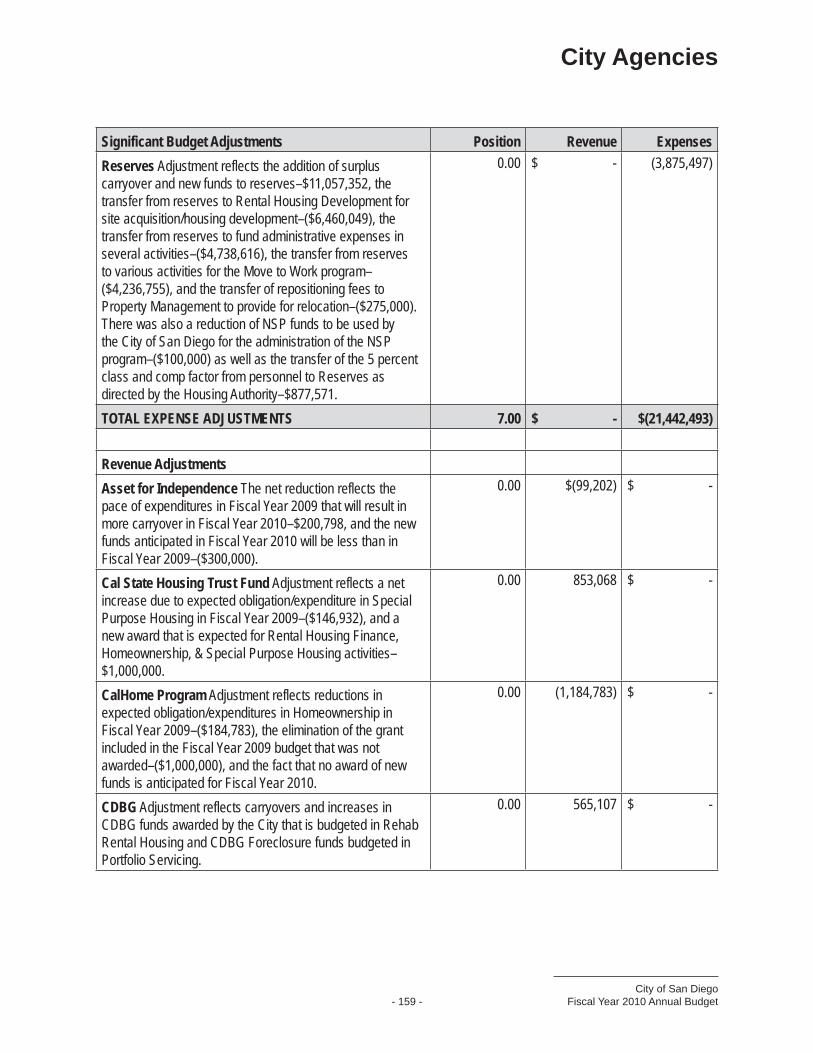
Significant Budget Adjustments Position Revenue Expenses
Reserves Adjustment reflects the addition of surplus carryover and new funds to reserves–$11,057,352, the transfer from reserves to Rental Housing Development for site acquisition/housing development–($6,460,049), the transfer from reserves to fund administrative expenses in several activities–($4,738,616), the transfer from reserves to various activities for the Move to Work program–($4,236,755), and the transfer of repositioning fees to Property Management to provide for relocation–($275,000). There was also a reduction of NSP funds to be used by the City of San Diego for the administration of the NSP program–($100,000) as well as the transfer of the 5 percent class and comp factor from personnel to Reserves as directed by the Housing Authority–$877,571.
0.00 $ - (3,875,497)
TOTAL EXPENSE ADJUSTMENTS 7.00 $ - $(21,442,493)
Revenue Adjustments
Asset for Independence The net reduction reflects the pace of expenditures in Fiscal Year 2009 that will result in more carryover in Fiscal Year 2010–$200,798, and the new funds anticipated in Fiscal Year 2010 will be less than in Fiscal Year 2009–($300,000).
0.00 $(99,202) $ -
Cal State Housing Trust Fund Adjustment reflects a net increase due to expected obligation/expenditure in Special Purpose Housing in Fiscal Year 2009–($146,932), and a new award that is expected for Rental Housing Finance, Homeownership, & Special Purpose Housing activities–$1,000,000.
0.00 853,068 $ -
CalHome Program Adjustment reflects reductions in expected obligation/expenditures in Homeownership in Fiscal Year 2009–($184,783), the elimination of the grant included in the Fiscal Year 2009 budget that was not awarded–($1,000,000), and the fact that no award of new funds is anticipated for Fiscal Year 2010.
0.00 (1,184,783) $ -
CDBg Adjustment reflects carryovers and increases in CDBG funds awarded by the City that is budgeted in Rehab Rental Housing and CDBG Foreclosure funds budgeted in Portfolio Servicing.
0.00 565,107 $ -

city Agencies
City of San DiegoFiscal Year 2010 Annual Budget - 160 -
Significant Budget Adjustments Position Revenue Expenses
Coastal Housing Adjustment reflects decreases in the expected obligation/expenditure of funds in Rental Housing Finance in Fiscal Year 2009–($318,291), and no anticipation of new award funds in Fiscal Year 2010–($100,214).
0.00 $ (418,505) $ -
Condo Conversion Adjustment reflects reductions of the expected obligation/expenditure of funds in Homeownership and Rental Housing Finance in Fiscal Year 2009–($33,266), and a reduction of new monitoring fees–($34,864).
0.00 $ (68,130) $ -
County CDBg Reinvestment Task Force Adjustment reflects less support in Fiscal Year 2010.
0.00 $ (10,000) $ -
Family Health Centers of San Diego Adjustment reflects a net of an increase in the amount of carryover from Fiscal Year 2009 into Fiscal Year 2010–$19,381, and the anticipation of no new award funds in Fiscal Year 2010–($23,872).
0.00 $ (4,491) $ -
HOME Program Adjustment reflects decreases in carryover as a result of expected obligation and/or completion of Rental Housing Finance, Homeownership, Rehabilitation and Special Purpose projects in Fiscal Year 2009–($2,180,442) and in new funds, due to a nonrecurring loan payoff–($4,327,553).
0.00 $ (6,507,995) $ -
Housing Rehab Trust Fund Adjustment reflects reductions due to expected obligation/expenditure of funds in Rehab Owner Occupied in Fiscal Year 2009–($144,412), and a reduction in new funds–($15,677).
0.00 $ (160,089) $ -
HTF CDBg Adjustment reflects reductions in the expected obligation/expenditure of funds in Rehab Owner Occupied–($290,312), and in new funds anticipated for Fiscal Year 2010–($63,484).
0.00 $ (353,796) $ -
HTF Linkage Adjustment reflects reductions in carryover in Fiscal Year 2010–($4,393,609), a decrease of new fees budgeted in Fiscal Year 2009 that are not expected due to the change in economic conditions–($1,120,337), and a decrease in new funds–($1,223,829).
0.00 $ (6,737,775) $ -
HTF Redevelopment Agency Adjustment is the net result of less carryover and an increase in estimated income.
0.00 $ (101) $ -
HTF Transient Occupancy Tax Adjustment is the net result of less carryover and an increase in estimated income.
0.00 $ 562 $ -

City of San DiegoFiscal Year 2010 Annual Budget- 161 -
city Agencies
Significant Budget Adjustments Position Revenue Expenses
HUD Lead Control grants Adjustment reflects decreases in original lead grants–($886,439) and the anticipated expenditure/obligation of the new awards in Rehabilitation–($566,470)
0.00 $ (1,452,909) $ -
Inclusionary Housing Fund Adjustment reflects decreases in carryover–($6,948,142) and in new fees due to economic conditions–($505,618).
0.00 $ (7,453,760) $ -
Local Funds Adjustment is the net change due to less carryover–($3,043,856) and an increase in funds from more rental income to the Smart Corner facilities and additional funds expected from bond fees, SRO admin fees, tenant rents, and site leases–$835,369.
0.00 $ (2,208,487) $ -
National City CDBg RTF Reduction is due to the expected use of all funding in Fiscal Year 2009 and no new funds expected in Fiscal Year 2010.
0.00 $ (25,766) $ -
Neighborhood Stabilization Programs Adjustment reflects a reduction in the expected obligation/expenditure of funds in Fiscal Year 2009 in Homeownership.
0.00 $ (773,600) $ -
North County Future Urbanizing Area (NCFUA) Adjustment includes reductions in expected obligation/expenditure of funds in Fiscal Year 2009 in Rental Housing Finance–($4,985), and a decrease in estimated new income–($897).
0.00 $ (5,882) $ -
Property Management – Chollas Creek Adjustment is rental and other income to provide for the property management and maintenance of the newly acquired 31-unit complex.
0.00 $ 358,108 $ -
Property Management – City Properties Adjustment reflects the reduction from seven to four units managed by the Housing Commission for the City of San Diego.
0.00 $ (37,130) $ -
Property Management – Maya Apartments Adjustment reflects the net of a reduction in the expected obligation/expenditure of funds in Fiscal Year 2009 in Property Management–($131,046), and additional rental and other income estimated for Fiscal Year 2010–$86,079.
0.00 $ (44,967) $ -
Property Management – SDHC Local Units Adjustment reflects the net of the expected obligation/expenditure of funds in Fiscal Year 2009 in Property Management–($1,017,754), and the estimated increase in rental and other income in Fiscal Year 2010–$621,955.
0.00 $ (395,799) $ -

city Agencies
City of San DiegoFiscal Year 2010 Annual Budget - 162 -
Significant Budget Adjustments Position Revenue Expenses
Property Management – State Rental Housing Adjustment reflects the net of the expected obligation/expenditure of funds in Fiscal Year 2009 in Property Management–($102,006) and the estimated increase in rental and other income in Fiscal Year 2010–$157,848.
0.00 $ 55,842 $ -
Property Management – University Canyon Adjustment reflects decreases in the expected obligation/expenditure of funds in Fiscal Year 2009 in Property Management–($1,087,202) and in new income–($40,381).
0.00 $ (1,127,583) $ -
Public Housing Capital Funds Adjustment reflects increases due to the carryover of Capital Fund administration and operation funds from grants 501-05, 501-06, and 501-07 for housing development–$566,333, the new award of Capital Fund 501-09 ARRA for housing development–$2,173,051, and the application for Capital Funds for capital improvements on 36 units of public housing–$47,000.
0.00 $ 2,786,384 $ -
Public Housing – Management Adjustment reflects the estimated carryover public housing reserves and anticipated new award repositioning fees to recover costs related to the disposition of public housing.
0.00 $ 2,181,109 $ -
Public Housing – ROSS Neighborhood Networks Adjustment reflects the net changes in expected obligation/expenditure of funds in Workforce & Economic Development in Fiscal Year 2009–($19,988), and a new award for Neighborhood Networks–$300,000.
0.00 $ 280,012 $ -
Redevelopment Agency – CCDC Homeownership Adjustment reflects net changes due to an increase in estimated carryover–$5,205, and a reduction of a grant included in the Fiscal Year 2009 budget that was not awarded–($700,000).
0.00 $ (694,795) $ -
Redevelopment Agency - City Heights Adjustment reflects net changes in the expected obligation/expenditure of funds in the Rehab Owner Occupied activity in Fiscal Year 2009, a change in the estimated new funds for Fiscal Year 2010.
0.00 $ (79,660) $ -
Redevelopment Agency – College grove Increase is due to the estimated new funds for Fiscal Year 2010.
0.00 $ 100,000 $ -
Redevelopment Agency – Crossroads Adjustment reflects the net changes to expected obligation/expenditure of funds in the Rehab Owner Occupied activity in Fiscal Year 2009–($19,422) and an increase in estimated new funds–$3,980.
0.00 $ (15,442) $ -

City of San DiegoFiscal Year 2010 Annual Budget- 163 -
city Agencies
Significant Budget Adjustments Position Revenue Expenses
Redevelopment Agency – grantville Addition of a new program for the rehabilitation of existing owner occupied housing in the Grantville Redevelopment Area.
0.00 $ 250,000 $ -
Redevelopment Agency – Linda Vista Adjustment reflects the expected obligation/expenditure of funds in the Rehab Owner Occupied activity in Fiscal Year 2009.
0.00 $ (93,995) $ -
Redevelopment Agency – North Park Adjustment reflects the net changes of the expected obligation/expenditure of funds in the Rehab Owner Occupied activity in Fiscal Year 2009–$166,568, and new awards that are less than received in Fiscal Year 2009–($212,800).
0.00 $ (46,232) $ -
Redevelopment Agency – San Ysidro Adjustment reflects a net reduction of an expected obligation/expenditure of funds in the Rehab Owner Occupied activity in Fiscal Year 2009–$423,217 and a reduction in funds expected in Fiscal Year 2010 from investment income–($495,000).
0.00 $ (71,783) $ -
Redevelopment Agency – SEDC Market Street Redevelopment Adjustment reflects an increase due to the expected obligation/expenditure of funds in the Rehab Owner Occupied activity in Fiscal Year 2009.
0.00 $ 3,061 $ -
Redevelopment Agency: SEDC Mt Hope Rehabilitation Adjustment reflects the net changes of an expected obligation/completion of Rehab Owner Occupied projects during Fiscal Year 2009–($20,491) and the addition of new funds that are expected from principal and interest payments, and investment income–$3,136.
0.00 $ (17,355) $ -
Redevelopment Agency – SEDC Southcrest Adjustment reflects the addition of an expected obligation/completion of Rehab Owner Occupied projects during Fiscal Year 2009.
0.00 $ 3,342 $ -
Redevelopment Agency – SEDC Southeast Addition is for a new program for the rehabilitation of existing owner occupied housing in the Southeast San Diego Redevelopment Area.
0.00 $ 300,000 $ -
Rental Rehabilitation Reduction is due to a reduction of new funds from principal and interest payments, and investment income.
0.00 $ (32,691) $ -
Section 8 Programs Adjustment reflects the net changes of a reduction in the estimated carryover–($3,439,193), and an increase in Fiscal Year 2010 new funds–$4,791,882.
0.00 $ 1,352,689 $ -

city Agencies
City of San DiegoFiscal Year 2010 Annual Budget - 164 -
Significant Budget Adjustments Position Revenue Expenses
Shea Homes: Addition is the result of an increase in carryover–$7,642 and new funds from investment income–$3,653.
0.00 $ 11,295 $ -
Shelter Plus Care Adjustment reflects reductions due to the expected obligation/completion of the Fiscal Year 2009 Shelter Plus Care grants–($355,199) and a decrease in the award of seven annual grants and one five year grant–($60,632).
0.00 $ (415,831) $ -
State REO Addition due to carryover. 0.00 $ 380 $ -
WED Youth Individual Development Accounts Reduction due to less carryover.
0.00 $ (4,918) $ -
TOTAL REVENUE ADJUSTMENTS 0.00 $ (21,442,493) $ -
TABLE 5.4 sAn diEgo Housing commission rEvEnuEs
Revenue Source FY 2008 Budget
FY 2009 Budget
FY 2010 Budget
FY 2009-2010 Budget Change
Assets for Independence $ 200,000 $ 472,127 $ 372,925 $ (99,202)
Cal State Housing Trust Fund
$ 604 $ 146,932 $ 1,000,000 $ 853,068
CalHome EAGR $ 33,942 $ - $ - $ -
CalHome Program $ 34,871 $ 1,259,185 $ 74,402 $ (1,184,783)
CDBG $ 3,488,119 $ 2,187,639 $ 2,752,746 $ 565,107
Coastal Housing/FUA $ 665,211 $ 447,428 $ 28,923 $ (418,505)
Condo Conversion/ Density Bonus
$ 331,432 $ 249,882 $ 181,752 $ (68,130)
County CDBG - RTF $ 60,000 $ 60,000 $ 50,000 $ (10,000)
Family Health Centers of SD
$ 30,589 $ 53,023 $ 48,532 $ (4,491)
HOME Program $ 25,678,616 $ 18,328,805 $ 11,820,810 $ (6,507,995)
Housing Rehab Trust Fund $ 897,062 $ 487,444 $ 327,355 $ (160,089)
HTF - CDBG $ 602,512 $ 419,856 $ 66,060 $ (353,796)
HTF - Linkage Fees $ 5,174,353 $ 8,531,608 $ 1,793,833 $ (6,737,775)
HTF - Redevelopment Agency
$ 40,675 $ 51,953 $ 51,852 $ (101)
HTF -Transient Occupancy Tax
$ 26,433 $ 29,574 $ 30,136 $ 562
HUD Development $ 443,207 $ 443,207 $ 443,207 $ -

City of San DiegoFiscal Year 2010 Annual Budget- 165 -
city Agencies
Revenue Source FY 2008 Budget
FY 2009 Budget
FY 2010 Budget
FY 2009-2010 Budget Change
HUD Economic Development Initiative
$ 148,500 $ - $ - $ -
HUD Lead Grant Reduction & Control Grants
$ 3,189,273 $ 7,886,439 $ 6,433,530 $ (1,452,909)
HUD Model Schools $ 5,000,000 $ - $ - $ -
Inclusionary Housing Fund $ 10,941,545 $ 10,007,913 $ 2,554,153 $ (7,453,760)
Local Funds $ 24,155,456 $ 23,191,965 $ 20,983,478 $ (2,208,487)
National City CDBG - RTF $ 49,222 $ 25,766 $ - $ (25,766)
Neighborhood Stabilization Program
$ - $ 9,442,370 $ 8,668,770 $ (773,600)
North County Future Urbanizing Area
$ 233,470 $ 155,091 $ 149,209 $ (5,882)
Property Mgmt - Chollas Creek
$ - $ - $ 358,108 $ 358,108
Property Mgmt - City Properties
$ 95,942 $ 76,236 $ 39,106 $ (37,130)
Property Mgmt - Maya Apartments
$ 2,199,107 $ 2,300,479 $ 2,255,512 $ (44,967)
Property Mgmt - SDHC Local Units
$ 6,933,098 $ 20,794,539 $ 20,398,740 $ (395,799)
Property Mgmt - State Rental Housing
$ 998,591 $ 892,894 $ 948,736 $ 55,842
Property Mgmt - University Canyon
$ 7,102,601 $ 4,682,342 $ 3,554,759 $ (1,127,583)
Public Housing - Capital Fund Grants
$ 2,474,480 $ - $ 2,786,384 $ 2,786,384
Public Housing - Community Outreach Partnership Center
$ 20,163 $ - $ - $ -
Public Housing - Management
$ 9,745,634 $ 10,052,892 $ 12,234,001 $ 2,181,109
Public Housing – ROSS Neighborhood Networks
$ 1,126,800 $ 61,600 $ 341,612 $ 280,012
Redevelopment Agency - CCDC Homeownership
$ 1,246,420 $ 742,415 $ 47,620 $ (694,795)
Redevelopment Agency - City Heights Redev HELP
$ 1,865,096 $ 1,401,117 $ 1,321,457 $ (79,660)
Redevelopment Agency - College Grove Redev HELP
$ - $ 200,000 $ 300,000 $ 100,000

city Agencies
City of San DiegoFiscal Year 2010 Annual Budget - 166 -
Revenue SourceFY 2008 Budget
FY 2009 Budget
FY 2010 Budget
FY 2009-2010 Budget Change
Redevelopment Agency - Cross Roads HELP
$ 443,919 $ 548,064 $ 532,622 $ (15,442)
Redevelopment Agency - Grantville Redev HELP
$ - $ - $ 250,000 $ 250,000
Redevelopment Agency - Linda Vista HELP
$ 357,107 $ 270,875 $ 176,880 $ (93,995)
Redevelopment Agency - Market Street
$ 125,439 $ 117,447 $ 120,508 $ 3,061
Redevelopment Agency - North Park HELP
$ - $ 470,000 $ 423,768 $ (46,232)
Redevelopment Agency - San Ysidro HELP
$ - $ 500,000 $ 428,217 $ (71,783)
Redevelopment Agency - SEDC
$ - $ - $ 300,000 $ 300,000
Redevelopment Agency - SEDC Mt. Hope Rehabilitation
$ 99,978 $ 90,587 $ 73,232 $ (17,355)
Redevelopment Agency - SEDC Southcrest
$ 143,187 $ 79,164 $ 82,506 $ 3,342
Rental Rehabilitation $ 34,848 $ 37,788 $ 5,097 $ (32,691)
Section 8 Programs $ 156,662,470 $ 171,499,657 $ 172,852,346 $ 1,352,689
Shea Homes $ 24,581 $ 9,919 $ 21,214 $ 11,295
Shelter Plus Care $ 1,252,062 $ 2,133,763 $ 1,717,932 $ (415,831)
State REO $ 20,808 $ 21,810 $ 22,190 $ 380
WED Youth Individual Development Account
$ - $ 19,621 $ 14,703 $ (4,918)
TOTAL $ 274,397,423 $ 300,881,416 $ 279,438,923 $ (21,442,493)

City of San DiegoFiscal Year 2010 Annual Budget- 167 -
city Agencies
TABLE 5.5 sAn diEgo Housing commission
sALArY scHEduLEFY 2009 BUDgET FY 2010 BUDgET
Position Title Positions Base
Salary
Salary Increases
(Merit, Bonus,
etc.)* Salary
Subtotal Fringe
Benefits** Positions Base
Salary
Salary Increases
(Merit, Bonus,
etc.)* Salary
Subtotal Fringe
Benefits** Accountant 2.00 $ 100,962 $ 2,019 $ 102,981 $ 36,408 2.00 $ 106,039 $ 2,121 $ 108,160 $ 38,599 Accounting Assistant
1.00 $ 36,005 $ 720 $ 36,725 $ 15,110 1.00 $ 34,112 $ 682 $ 34,794 $ 15,216
Accounting Supervisor
4.00 $ 274,855 $ 17,794 $ 292,649 $ 89,928 4.00 $ 281,041 $ 10,098 $ 291,139 $ 91,896
Accounting Technician
4.00 $ 161,758 $ 6,461 $ 168,219 $ 64,908 4.00 $ 166,991 $ 7,669 $ 174,660 $ 68,373
Administrative Assistant
1.00 $ 43,731 $ 2,860 $ 46,591 $ 17,177 1.00 $ 44,596 $ 4,074 $ 48,670 $ 18,647
Assistant Vice President, HD&F
0.00 $ - $ - $ - $ - 1.00 $ 112,943 $ 4,406 $ 117,349 $ 34,695
Asst Director of Hsg Programs
3.00 $ 247,412 $ 21,843 $ 269,255 $ 77,233 3.00 $ 247,000 $ 22,996 $ 269,996 $ 80,074
Budget Analyst 1.00 $ 53,102 $ 1,062 $ 54,164 $ 17,982 1.00 $ 57,346 $ 1,147 $ 58,493 $ 19,345 Budget Officer 1.00 $ 80,455 $ 1,609 $ 82,064 $ 23,426 1.00 $ 84,116 $ 1,682 $ 85,798 $ 24,712 Business Analyst
1.00 $ 79,989 $ 1,600 $ 81,589 $ 24,509 1.00 $ 67,455 $ 1,349 $ 68,804 $ 22,416
Client Services Receptionist
2.00 $ 64,389 $ 4,236 $ 68,625 $ 29,211 2.00 $ 66,582 $ 4,307 $ 70,889 $ 31,405
Communications Officer
1.00 $ 82,470 $ 3,753 $ 86,223 $ 25,480 1.00 $ 84,115 $ 3,825 $ 87,940 $ 26,467
Community Liaison
1.00 $ 71,220 $ 7,972 $ 79,192 $ 24,008 1.00 $ 72,634 $ 8,901 $ 81,535 $ 25,110
Community Relations Specialist
1.00 $ 64,584 $ 2,374 $ 66,958 $ 21,444 0.00 $ - $ - $ - $ -
Director 6.00 $ 613,252 $ 82,900 $ 696,152 $ 209,314 0.00 $ - $ - $ - $ - Docket Coordinator
1.00 $ 55,807 $ 2,411 $ 58,218 $ 19,610 1.00 $ 56,930 $ 2,433 $ 59,363 $ 20,417
Executive Vice President & COO
1.00 $ 144,626 $ 9,339 $ 153,965 $ 43,432 1.00 $ 162,594 $ 9,878 $ 172,472 $ 54,060
Financial Specialist
2.00 $ 151,424 $ 4,110 $ 155,534 $ 46,260 2.00 $ 154,482 $ 3,960 $ 158,442 $ 49,978
Fiscal Services Specialist
1.00 $ 51,496 $ 1,030 $ 52,526 $ 18,422 1.00 $ 56,930 $ 1,139 $ 58,069 $ 20,142
Housing Aide II 1.50 $ 38,376 $ 767 $ 39,143 $ 19,326 1.50 $ 39,136 $ 783 $ 39,919 $ 20,228 Housing Assistant II
37.00 $ 1,559,806 $ 91,525 $ 1,651,331 $ 619,518 37.00 $ 1,572,214 $ 88,653 $ 1,660,867 $ 656,974
Housing Construction Officer
2.00 $ 164,941 $ 11,728 $ 176,669 $ 49,689 2.00 $ 168,231 $ 12,743 $ 180,974 $ 53,567

city Agencies
City of San DiegoFiscal Year 2010 Annual Budget - 168 -
FY 2009 BUDgET FY 2010 BUDgET
Position Title Positions Base
Salary
Salary Increases
(Merit, Bonus,
etc.)* Salary
Subtotal Fringe
Benefits** Positions Base
Salary
Salary Increases
(Merit, Bonus,
etc.)* Salary
Subtotal Fringe
Benefits** Housing Construction Specialist
8.00 $ 541,028 $ 13,636 $ 554,664 $ 174,105 10.00 $ 685,324 $ 16,320 $ 701,644 $ 228,447
Housing Construction Supervisor
2.00 $ 148,527 $ 5,135 $ 153,662 $ 45,131 3.00 $ 223,435 $ 6,421 $ 229,856 $ 71,011
Housing Inspector
9.00 $ 446,655 $ 26,611 $ 473,266 $ 162,700 9.00 $ 458,050 $ 26,722 $ 484,772 $ 172,374
Housing Specialist
6.00 $ 312,105 $ 18,141 $ 330,246 $ 112,869 7.00 $ 358,223 $ 12,956 $ 371,179 $ 136,415
Housing Supervisor
9.00 $ 571,309 $ 17,239 $ 588,548 $ 189,062 9.00 $ 590,604 $ 13,485 $ 604,089 $ 202,923
Human Resources Analyst
1.00 $ 58,573 $ 2,254 $ 60,827 $ 20,160 1.00 $ 61,889 $ 2,320 $ 64,209 $ 21,443
Human Resources Officer
1.00 $ 80,454 $ 2,691 $ 83,145 $ 24,834 1.00 $ 84,116 $ 1,682 $ 85,798 $ 26,012
Information Technology Analyst
1.00 $ 64,584 $ 1,292 $ 65,876 $ 21,218 1.00 $ 65,874 $ 1,317 $ 67,191 $ 22,073
Information Technology Assistant
2.00 $ 62,130 $ 1,242 $ 63,372 $ 28,107 2.00 $ 65,288 $ 1,306 $ 66,594 $ 29,799
Information Technology Officer
2.00 $ 160,969 $ 13,767 $ 174,736 $ 51,441 2.00 $ 162,240 $ 13,833 $ 176,073 $ 52,972
Information Technology Technician
1.00 $ 37,031 $ 741 $ 37,772 $ 15,329 1.00 $ 39,683 $ 794 $ 40,477 $ 16,419
Inspection Coordinator
1.00 $ 58,594 $ 2,225 $ 60,819 $ 20,160 1.00 $ 59,758 $ 3,776 $ 63,534 $ 21,290
Loan Management Supervisor
1.00 $ 82,471 $ 1,649 $ 84,120 $ 23,828 1.00 $ 84,117 $ 1,682 $ 85,799 $ 25,584
Loan Production Specialist
2.00 $ 99,847 $ 1,996 $ 101,843 $ 35,427 2.00 $ 101,861 $ 2,036 $ 103,897 $ 37,951
Loan Servicing Specialist
2.00 $ 111,614 $ 2,232 $ 113,846 $ 37,040 2.00 $ 115,274 $ 2,306 $ 117,580 $ 40,000
Maintenance Supervisor
3.00 $ 141,087 $ 13,323 $ 154,410 $ 82,521 2.00 $ 95,930 $ 10,154 $ 106,084 $ 53,694
Maintenance Technician II
13.00 $ 514,348 $ 56,658 $ 571,006 $ 318,648 13.00 $ 523,970 $ 65,755 $ 589,725 $ 312,439
Office Assistant II 11.00 $ 377,676 $ 25,065 $ 402,741 $ 165,971 12.00 $ 421,862 $ 25,078 $ 446,940 $ 193,245 PIU Hearing Coordinator
1.00 $ 55,805 $ 5,403 $ 61,208 $ 19,357 1.00 $ 56,930 $ 2,581 $ 59,511 $ 20,149
President & Chief Executive Officer
1.00 $ 225,000 $ - $ 225,000 $ 84,168 1.00 $ 249,600 $ 27,480 $ 277,080 $ 91,686

City of San DiegoFiscal Year 2010 Annual Budget- 169 -
city Agencies
FY 2009 BUDgET FY 2010 BUDgET
Position Title Positions Base
Salary
Salary Increases
(Merit, Bonus,
etc.)* Salary
Subtotal Fringe
Benefits** Positions Base
Salary
Salary Increases
(Merit, Bonus,
etc.)* Salary
Subtotal Fringe
Benefits** Program Analyst 3.00 $ 169,357 $ 13,504 $ 182,861 $ 60,558 3.00 $ 179,381 $ 5,178 $ 184,559 $ 63,223 Project Manager 6.00 $ 469,477 $ 9,391 $ 478,868 $ 147,222 5.00 $ 394,785 $ 7,897 $ 402,682 $ 125,683 Property Manager
0.00 $ - $ - $ - $ - 12.00 $ 420,379 $ 15,707 $ 436,086 $ 186,516
Purchasing Supervisor
1.00 $ 59,967 $ 1,199 $ 61,166 $ 20,232 1.00 $ 61,173 $ 1,223 $ 62,396 $ 21,058
Reinvestment Coordinator
1.00 $ 100,564 $ 2,011 $ 102,575 $ 26,895 0.00 $ - $ - $ - $ -
Res Initiatives Coordinator
2.00 $ 101,299 $ 5,482 $ 106,781 $ 37,204 4.00 $ 199,869 $ 6,819 $ 206,688 $ 76,233
Resident Manager
12.00 $ 404,407 $ 20,088 $ 424,495 $ 175,735 0.00 $ - $ - $ - $ -
Secretary to the President & CEO
1.00 $ 64,810 $ 2,296 $ 67,106 $ 23,678 1.00 $ 69,556 $ 4,391 $ 73,947 $ 25,725
Senior Accounting Technician
2.00 $ 91,915 $ 1,838 $ 93,753 $ 34,474 2.00 $ 96,591 $ 1,932 $ 98,523 $ 36,557
Senior Administrative Assistant
9.00 $ 430,940 $ 16,588 $ 447,528 $ 159,757 11.00 $ 555,278 $ 26,058 $ 581,336 $ 212,284
Senior Budget Analyst
1.00 $ 69,351 $ 1,387 $ 70,738 $ 21,216 1.00 $ 72,634 $ 1,453 $ 74,087 $ 22,411
Senior Housing Assistant
16.00 $ 755,873 $ 46,683 $ 802,556 $ 286,067 16.00 $ 778,793 $ 48,811 $ 827,604 $ 308,238
Senior Information Technology Analyst
3.00 $ 180,649 $ 4,696 $ 185,345 $ 61,080 3.00 $ 197,685 $ 13,820 $ 211,505 $ 68,325
Senior Maintenance Technician
2.00 $ 78,521 $ 8,571 $ 87,092 $ 48,831 2.00 $ 81,911 $ 9,874 $ 91,785 $ 48,556
Senior Manager 0.00 $ - $ - $ - $ - 1.00 $ 84,116 $ 1,681 $ 85,797 $ 26,879 Senior Office Assistant
8.00 $ 291,357 $ 22,843 $ 314,200 $ 125,167 8.00 $ 306,462 $ 22,375 $ 328,837 $ 135,710
Senior Program Analyst
14.00 $ 956,947 $ 32,967 $ 989,914 $ 308,210 15.00 $ 1,040,214 $ 33,949 $ 1,074,163 $ 350,808
Senior Resident Initiatives Coordinator
4.00 $ 246,259 $ 10,485 $ 256,744 $ 82,466 4.00 $ 246,357 $ 5,797 $ 252,154 $ 86,707
Senior Storekeeper
2.00 $ 79,416 $ 1,588 $ 81,004 $ 31,802 2.00 $ 80,996 $ 1,620 $ 82,616 $ 33,609
Senior Vice President, HD&F
0.00 $ - $ - $ - $ - 1.00 $ 159,600 $ 9,717 $ 169,317 $ 46,166
Storekeeper 1.00 $ 34,237 $ 685 $ 34,922 $ 14,733 1.00 $ 34,924 $ 698 $ 35,622 $ 15,391 Supervising Project Manager
2.00 $ 164,946 $ 3,297 $ 168,243 $ 49,648 1.00 $ 82,077 $ 1,641 $ 83,718 $ 26,421

city Agencies
City of San DiegoFiscal Year 2010 Annual Budget - 170 -
FY 2009 BUDgET FY 2010 BUDgET
Position Title Positions Base
Salary
Salary Increases
(Merit, Bonus,
etc.)* Salary
Subtotal Fringe
Benefits** Positions Base
Salary
Salary Increases
(Merit, Bonus,
etc.)* Salary
Subtotal Fringe
Benefits** Supervising Res Initiatives Coord
2.00 $ 130,812 $ 3,699 $ 134,511 $ 43,014 2.00 $ 138,362 $ 2,768 $ 141,130 $ 45,576
Vice President 0.00 - - - - 5.00 555,042 38,872 593,914 178,545 Vacancy Factor1 0.00 (65,772) - (65,772) - 0.00 (69,585) - (69,585) - Tsf of Factor for Classification & Compensation Study to Reserves, including Fringe2
0.00 - - - - 0.00 - - - (153,778)
TOTAL 243.50 $ 13,105,799 $ 698,711 $ 13,804,510 $ 4,882,460 250.50 $ 13,906,115 $ 693,131 $ 14,599,246 $ 5,135,090
* Salary Increases include provisions for merit pay, differentials, bilingual, on-call (Fiscal Year 2009 only), overtime, bonuses, and the Housing Authority approved 2 percent salary step increase. SDHC bonuses are budgeted at $43,005: $15,000 for the President & CEO (amount to be determined by the Housing Authority), $5,000 for the Vice President & COO (amount will be determined and awarded by the President &CEO), $20,005 for Vice Presidents (individual amounts will be determined and awarded by the President & CEO and Vice President &COO). Merit increases are awarded to staff based on their performance as determined by their supervisor, with director review and approval. A merit increase is 2.5 percent (one step on the pay plan) given for one year. In order to have a provision for merit increases in the budget, SDHC budgets based on all staff that are currently receiving a merit. The provision in the Fiscal Year 2010 Budget is $56,517 based on merit for 41 staff members.
**Fringe Benefits include provisions for 14 percent Defined Contribution Pension, 2.5 percent 457 contribution, Life Insurance, Long Term Disability, Workers’ Compensation, Medicare, State Unemployment Insurance, and Flex Plan benefits.
1 A Vacancy Factor of 0.5 percent is incorporated into the budget to provide for vacant positions.2 A 5 percent factor was included in Fiscal Year 2010 due to a Classification & Compensation Study, but the $877,571 cost of the study
($723,793 salary, $153,778 fringe) has been transferred to Reserves. The fringe benefits associated with that study were originally built into the fringe amounts associated with each position, and so this line item removes the amount.
san diego data processing corporationmission statementTo support, improve, build, and maintain clients’ information technology needs through an open and honest partnership.
San Diego Data Processing Corporation (SDDPC) was formed in 1979 by the City of San Diego to realize the benefit of privatizing its information technology (IT) functions. SDDPC continues to provide those benefits, while also supporting the City with professional, quality IT services.
SDDPC is at the forefront of providing IT and telecommunications services to the departments of the City of San Diego, as well as other municipal and nonprofit organizations. SDDPC provides state-of-the-art hardware, software, and networks to give our customers immediate access to the information they need. These programs and services have been nationally recognized for innovation and efficiency.
The Fiscal Year 2010 Budget for SDDPC was developed based on the Fiscal Year 2010 IT budgets of City departments and other (non-City) customers. SDDPC has its own Board of Directors, appointed by the Mayor. The Fiscal Year 2010 Budget was approved by the SDDPC Board of Directors on April 29, 2009.

City of San DiegoFiscal Year 2010 Annual Budget- 171 -
city Agencies
TABLE 6.1 sAn diEgo dATA procEssing corporATion BudgET summArY
FY 2008 Budget
FY 2009 Budget
FY 2010 Budget
FY 2009-2010 Change
Positions 249.00 258.00 280.00 22.00
Operating Expenses
Personnel Expense $ 25,429,000 $ 26,799,000 $ 26,999,966 $ 200,966
Non-Personnel Expense $ 20,335,000 $ 19,739,000 $ 18,226,184 $ (1,512,816)
Subtotal Operating $ 45,764,000 $ 46,538,000 $ 45,226,150 $ (1,311,850)
Special Items–Use of Prior Year Net Assets
Personnel Expense $ - $ 420,000 $ - $ (420,000)
Non-Personnel Expense $ - $ 1,241,000 $ 2,000,000 $ 759,000
Subtotal Special Items $ - $ 1,661,000 $ 2,000,000 $ 339,000
Total SDDPC
Personnel Expense $ 25,429,000 $ 27,219,000 $ 26,999,966 $ (219,034)
Non-Personnel Expense $ 20,335,000 $ 20,980,000 $ 20,226,184 $ (753,816)
TOTAL $ 45,764,000 $ 48,199,000 $ 47,226,150 $ (972,850)
SDDPC has been acknowledged by the Gartner Group, an independent analyst of IT customer service, as an industry leader and trendsetter in customer satisfaction throughout the country. This level of achievement puts SDDPC in the top 10 percent of IT providers in the United States. Areas that were reviewed included support responsiveness, availability and expertise, system performance, functionality and quality, cost, impact of IT services, and support.
As a partner of the City, SDDPC is committed to delivering quality, efficient, and cost-effective IT services so that the residents of San Diego receive quality public safety, library, parks and recreation, and related services that depend on the performance of IT services.

city Agencies
City of San DiegoFiscal Year 2010 Annual Budget - 172 -
TABLE 6.2 sAn diEgo dATA procEssing corporATion opErATing EXpEndiTurEs
FY 2008 Budget
FY 2009 Budget
FY 2010 Budget
FY 2009-2010 Change
PERSONNEL
Salaries & Wages $ 19,005,000 $ 20,070,000 $ 20,229,939 $ 159,939
Overtime $ 138,000 $ 163,000 $ 166,040 $ 3,040
Fringe Benefits (Health, Worker’s Compensation, Insurance)
$ 1,842,000 $ 1,799,000 $ 1,897,477 $ 98,477
Fringe Benefits (pension) $ 3,811,000 $ 4,049,000 $ 4,049,999 $ 999
Fringe Benefits (other – Payroll Taxes, Benefit Allowance, Tuition, Recognition, Recruiting, Accrued Vacation)
$ 633,000 $ 718,000 $ 656,512 $ (61,488)
SUBTOTAL PERSONNEL $ 25,429,000 $ 26,799,000 $ 26,999,966 $ 200,966
NON-PERSONNEL
Data/Voice Circuits & Lines $ 5,249,000 $ 4,896,000 $ 4,555,672 $ (340,328)
Professional Services $ 2,344,820 $ 1,562,000 $ 1,456,632 $ (105,368)
Equipment & Software Maintenance
$ 6,015,130 $ 6,899,000 $ 5,367,429 $ (1,531,571)
Depreciation $ 4,620,920 $ 4,434,000 $ 4,984,847 $ 550,847
Facilities $ 1,288,349 $ 1,102,000 $ 1,091,976 $ (10,024)
Supplies & Other $ 816,781 $ 846,000 $ 769,628 $ (76,372)
SUBTOTAL NON-PERSONNEL $ 20,335,000 $ 19,739,000 $ 18,226,184 $ (1,512,816)
TOTAL $ 45,764,000 $ 46,538,000 $ 45,226,150 $ (1,311,850)
Note: Totals may not equal sum of the column, due to rounding.

City of San DiegoFiscal Year 2010 Annual Budget- 173 -
city Agencies
TABLE 6.3 sAn diEgo dATA procEssing corporATion
signiFicAnT opErATing BudgET AdjusTmEnTs
Significant Budget Adjustments Position Revenue Expenses
Salaries and Benefits Adjustments
Adjustment is due to an increase in salaries and wages, overtime, and benefits associated with the addition of 22.00 new positions. These position additions include 19.00 positions to meet higher customer demand, and 3.00 part-time positions for additional administrative services. Salary compensation was reduced by 6 percent through salary reductions, furloughs, and benefit program reductions.
22.00 $ - $ 200,966
Adjustment in Non-Personnel Expenditures
Addition is due to the depreciation of planned Fiscal Years 2009 and 2010 capital asset additions
0.00 $ - $ 550,847
Reduction reflects lower costs for Data and Voice Circuits and Lines from the WAN Network Upgrade Project.
0.00 $ - $ (340,328)
Reduction is primarily due to lower premiums for Property and Equipment Insurance.
0.00 $ - $ (10,024)
An addition in contractors & temporaries $215,773 combined with reductions in consulting services/training ($250,691), professional services ($69,400), directors fees ($1050), reflects overall lower consulting fees charged.
0.00 $ - $ (105,368)
Reduction is primarily the result of lower consulting fees. 0.00 $ - $ (1,531,571)
Reduction in the Supplies & Other category is due to lower printing/photocopying, microfilming, and operating supplies expenses.
0.00 $ - $ (76,372)
TOTAL EXPENSE ADJUSTMENTS 22.00 $ - $ (1,311,850)
Revenue Adjustments
Reduction in revenue reflects an overall shift in resource needs in support of legacy applications to OneSD.
0.00 $ (4,013,293) $ -
Addition in revenue reflects additional resources and services required in support of OneSD.
0.00 $ 2,928,175 $ -
Addition in revenue from all other customers reflects an increasing demand for the services provided by SDDPC in support of other non-City customers such as SDCERS and ARJIS.
0.00 $ 160,671 $ -
TOTAL REVENUE ADJUSTMENTS 0.00 $ (924,447) $ -
Note: The Fiscal Year 2010 Proposed Budget reflects SDDPC operating at a deficit of $2.6 million for the year. SDDPC will use projected Fiscal Year 2009 net revenues versus expenses as the primary funding source. Fiscal Year 2010 OneSD Project expenses comprise $2.0 million of the $2.6 million deficit. The use of Prior Year Net Revenue totalling $1.7 million was also part of the Fiscal Year 2009 Annual Budget.

city Agencies
City of San DiegoFiscal Year 2010 Annual Budget - 174 -
TABLE 6.4 sAn diEgo dATA procEssing corporATion
rEvEnuEs
Revenue SourceFY 2008 Budget
FY 2009 Budget
FY 2010 Budget
FY 2009-FY 2010 Change
City of San Diego $ 41,554,014 $ 39,463,734 $ 35,450,441 $ (4,013,293)
OneSD $ - $ 1,557,692 $ 4,485,867 $ 2,928,175
SDCERS $ 1,139,312 $ 1,230,703 $ 1,264,274 $ 33,571
ARJIS $ 2,890,976 $ 2,925,719 $ 3,251,985 $ 326,266
San Diego County $ 167,698 $ 125,873 $ 85,776 $ (40,097)
Other $ 12,000 $ 246,876 $ 87,806 $ (159,070)
TOTAL $ 45,764,000 $ 45,550,597 $ 44,626,150 $ (924,447)
Note: Totals may not equal sum of the column, due to rounding.

City of San DiegoFiscal Year 2010 Annual Budget- 175 -
city Agencies
TABLE 6.5 sAn diEgo dATA procEssing corporATion
sALArY scHEduLEFY 2009 BUDgET FY 2010 BUDgET
Position Title Positions Base Salary
Salary Increases
(Merit, Bonus,
etc.) Salary
Subtotal Fringe
Benefits Positions Base Salary
Salary Increases
(Merit, Bonus,
etc.) Salary
Subtotal Fringe
BenefitsAdmin Asst. II 1.00 $ 38,462 $ 321 $ 38,783 $ 12,586 0.00 $ - $ - $ - $ - Admin Asst. III 1.00 $ 49,638 $ 207 $ 49,845 $ 16,176 1.00 $ 50,120 $ - $ 50,120 $ 16,228 Asst. Programmer Analyst
2.00 $ 101,821 $ 1,306 $ 103,127 $ 33,468 3.00 $ 151,334 $ - $ 151,334 $ 49,000
Billing Supp. Analyst II
1.00 $ 49,670 $ 1,656 $ 51,326 $ 16,657 1.00 $ 50,980 $ - $ 50,980 $ 16,507
Business Analyst II
1.00 $ 79,181 $ 2,309 $ 81,490 $ 26,447 1.00 $ 78,797 $ - $ 78,797 $ 25,514
Business Analyst III
1.00 $ 87,829 $ 4,025 $ 91,854 $ 29,810 1.00 $ 87,829 $ - $ 87,829 $ 28,438
Buyer II 1.00 $ 53,914 $ 225 $ 54,139 $ 17,570 2.00 $ 107,531 $ - $ 107,531 $ 34,817 Buyer III 1.00 $ 73,649 $ 614 $ 74,263 $ 24,101 1.00 $ 73,291 $ - $ 73,291 $ 23,731 Chief Financial Officer
1.00 $ 135,928 $ 1,699 $ 137,627 $ 44,665 1.00 $ 135,268 $ - $ 135,268 $ 43,798
Corporate Counsel
1.00 $ 175,929 $ 4,398 $ 180,327 $ 58,523 1.00 $ 177,637 $ - $ 177,637 $ 57,517
Corporate Legal Assistant
1.00 $ 55,000 $ 2,292 $ 57,292 $ 18,593 1.00 $ 52,000 $ - $ 52,000 $ 16,837
Data Center Operations Analyst
1.00 $ 68,196 $ 568 $ 68,764 $ 22,317 1.00 $ 67,865 $ - $ 67,865 $ 21,974
Data Center Operator I
6.00 $ 238,113 $ 4,101 $ 242,214 $ 78,607 6.00 $ 238,701 $ - $ 238,701 $ 77,289
Data Center Operator II
3.00 $ 145,209 $ 4,306 $ 149,515 $ 48,523 3.00 $ 146,133 $ - $ 146,133 $ 47,316
Data Entry Operator
1.00 $ 24,452 $ 306 $ 24,758 $ 8,035 1.00 $ 24,215 $ - $ 24,215 $ 7,841
Database Admin. III
5.00 $ 419,794 $ 14,469 $ 434,263 $ 140,934 5.00 $ 415,620 $ - $ 415,620 $ 134,573
Database Admin. IV
3.00 $ 278,481 $ 9,770 $ 288,251 $ 93,548 2.00 $ 179,234 $ - $ 179,234 $ 58,034
Database Admin. V
1.00 $ 114,146 $ 1,902 $ 116,048 $ 37,662 2.00 $ 214,146 $ - $ 214,146 $ 69,338
Desktop Support Analyst I
6.00 $ 276,404 $ 7,031 $ 283,435 $ 91,985 4.00 $ 182,577 $ - $ 182,577 $ 59,117
Desktop Support Analyst II
11.00 $ 602,075 $ 12,814 $ 614,889 $ 199,554 12.00 $ 630,672 $ - $ 630,672 $ 204,205
Desktop Support Analyst III
0.00 $ - $ - $ - $ - 2.00 $ 122,469 $ - $ 122,469 $ 39,654
Division Director 2.00 $ 286,874 $ 7,172 $ 294,046 $ 95,429 2.00 $ 288,269 $ - $ 288,269 $ 93,338 Executive Assistant
1.00 $ 55,702 $ 232 $ 55,934 $ 18,153 1.00 $ 55,973 $ - $ 55,973 $ 18,123
Facilities Manager 1.00 $ 83,842 $ 699 $ 84,541 $ 27,437 1.00 $ 84,249 $ - $ 84,249 $ 27,279 Financial Analyst III
2.00 $ 132,453 $ 1,944 $ 134,397 $ 43,616 2.00 $ 132,453 $ - $ 132,453 $ 42,887
General Maintenance
1.00 $ 34,278 $ 571 $ 34,849 $ 11,310 0.00 $ - $ - $ - $ -
Help Desk Specialist I
0.00 $ - $ - $ - $ - 2.00 $ 75,962 $ - $ 75,962 $ 24,596

city Agencies
City of San DiegoFiscal Year 2010 Annual Budget - 176 -
FY 2009 BUDgET FY 2010 BUDgET
Position Title Positions Base Salary
Salary Increases
(Merit, Bonus,
etc.) Salary
Subtotal Fringe
Benefits Positions Base Salary
Salary Increases
(Merit, Bonus,
etc.) Salary
Subtotal Fringe
BenefitsHelp Desk Specialist II
10.00 $ 504,242 $ 21,966 $ 526,208 $ 170,774 7.00 $ 316,625 $ - $ 316,625 $ 102,520
Human Resources Rep. I
1.00 $ 51,500 $ 429 $ 51,929 $ 16,853 1.00 $ 52,000 $ - $ 52,000 $ 16,837
Information Security Officer
1.00 $ 129,590 $ 1,080 $ 130,670 $ 42,407 1.00 $ 128,961 $ - $ 128,961 $ 41,756
Information Security Specialist
3.00 $ 241,618 $ 9,324 $ 250,942 $ 81,440 3.00 $ 257,000 $ - $ 257,000 $ 83,214
Intern Programmer Analyst
1.00 $ 38,563 $ 1,767 $ 40,330 $ 13,089 1.00 $ 41,413 $ - $ 41,413 $ 13,409
Inventory Control Specialist
0.00 $ - $ - $ - $ - 1.00 $ 36,442 $ - $ 36,442 $ 11,800
Mail Systems Admin. I
1.00 $ 56,706 $ 2,126 $ 58,832 $ 19,093 1.00 $ 56,706 $ - $ 56,706 $ 18,361
Mail Systems Admin. II
3.00 $ 189,282 $ 4,186 $ 193,468 $ 62,788 3.00 $ 192,447 $ - $ 192,447 $ 62,312
Mail Systems Admin. III
2.00 $ 160,476 $ 2,739 $ 163,215 $ 52,969 2.00 $ 167,507 $ - $ 167,507 $ 54,237
Maintenance 1.00 $ 31,200 $ - $ 31,200 $ 10,126 1.00 $ 34,840 $ - $ 34,840 $ 11,281 Network Administrator I
2.00 $ 122,155 $ 1,515 $ 123,670 $ 40,135 0.00 $ - $ - $ - $ -
Network Administrator II
11.00 $ 808,752 $ 20,124 $ 828,876 $ 269,001 12.00 $ 810,684 $ - $ 810,684 $ 262,490
Network Administrator III
0.00 $ - $ - $ - $ - 3.00 $ 239,573 $ - $ 239,573 $ 77,571
Network Coordinator
1.00 $ 76,050 $ 1,584 $ 77,634 $ 25,195 1.00 $ 75,681 $ - $ 75,681 $ 24,505
Network Engineer I
1.00 $ 79,994 $ 2,000 $ 81,994 $ 26,610 0.00 $ - $ - $ - $ -
Network Engineer II
2.00 $ 172,700 $ 6,704 $ 179,404 $ 58,223 0.00 $ - $ - $ - $ -
Network Engineer III
3.00 $ 315,126 $ 5,669 $ 320,795 $ 104,110 5.00 $ 504,016 $ - $ 504,016 $ 163,195
Network Engineer IV
1.00 $ 124,630 $ 2,077 $ 126,707 $ 41,121 1.00 $ 120,000 $ - $ 120,000 $ 38,855
Network Support Engineer
3.00 $ 197,097 $ 5,812 $ 202,909 $ 65,851 0.00 $ - $ - $ - $ -
Network Svcs. Tech II
2.00 $ 99,452 $ 3,540 $ 102,992 $ 33,425 2.00 $ 100,169 $ - $ 100,169 $ 32,434
Network Svcs. Tech III
5.00 $ 283,137 $ 9,930 $ 293,067 $ 95,111 5.00 $ 285,837 $ - $ 285,837 $ 92,551
Network Sys. Analyst I
1.00 $ 43,661 $ 1,819 $ 45,480 $ 14,760 0.00 $ - $ - $ - $ -
NOC Analyst I 0.00 $ - $ - $ - $ - 1.00 $ 45,684 $ - $ 45,684 $ 14,792 NOC Analyst II 0.00 $ - $ - $ - $ - 1.00 $ 61,737 $ - $ 61,737 $ 19,990 NOC Analyst III 0.00 $ - $ - $ - $ - 3.00 $ 226,266 $ - $ 226,266 $ 73,262 Payroll Specialist 1.00 $ 51,500 $ 644 $ 52,144 $ 16,923 1.00 $ 51,500 $ - $ 51,500 $ 16,675 President/CEO* 1.00 $ 230,000 $ 76,666 $ 306,666 $ 99,525 1.00 $ 230,000 $ - $ 230,000 $ 74,471 Principal Analyst I 36.00 $ 3,211,868 $ 82,538 $ 3,294,406 $ 1,069,157 45.00 $ 3,792,823 $ - $ 3,792,823 $ 1,228,073 Principal Analyst II
11.00 $ 1,024,387 $ 24,288 $ 1,048,675 $ 340,334 14.00 $ 1,345,744 $ - $ 1,345,744 $ 435,737
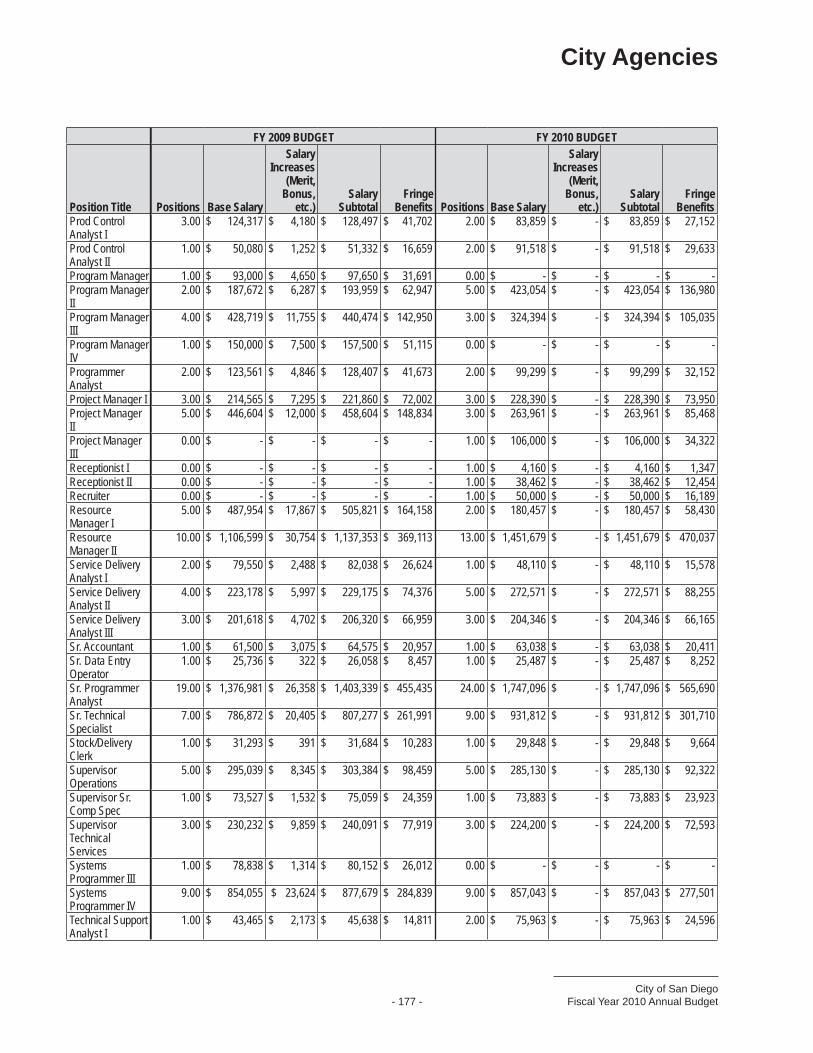
City of San DiegoFiscal Year 2010 Annual Budget- 177 -
city Agencies
FY 2009 BUDgET FY 2010 BUDgET
Position Title Positions Base Salary
Salary Increases
(Merit, Bonus,
etc.) Salary
Subtotal Fringe
Benefits Positions Base Salary
Salary Increases
(Merit, Bonus,
etc.) Salary
Subtotal Fringe
BenefitsProd Control Analyst I
3.00 $ 124,317 $ 4,180 $ 128,497 $ 41,702 2.00 $ 83,859 $ - $ 83,859 $ 27,152
Prod Control Analyst II
1.00 $ 50,080 $ 1,252 $ 51,332 $ 16,659 2.00 $ 91,518 $ - $ 91,518 $ 29,633
Program Manager 1.00 $ 93,000 $ 4,650 $ 97,650 $ 31,691 0.00 $ - $ - $ - $ - Program Manager II
2.00 $ 187,672 $ 6,287 $ 193,959 $ 62,947 5.00 $ 423,054 $ - $ 423,054 $ 136,980
Program Manager III
4.00 $ 428,719 $ 11,755 $ 440,474 $ 142,950 3.00 $ 324,394 $ - $ 324,394 $ 105,035
Program Manager IV
1.00 $ 150,000 $ 7,500 $ 157,500 $ 51,115 0.00 $ - $ - $ - $ -
Programmer Analyst
2.00 $ 123,561 $ 4,846 $ 128,407 $ 41,673 2.00 $ 99,299 $ - $ 99,299 $ 32,152
Project Manager I 3.00 $ 214,565 $ 7,295 $ 221,860 $ 72,002 3.00 $ 228,390 $ - $ 228,390 $ 73,950 Project Manager II
5.00 $ 446,604 $ 12,000 $ 458,604 $ 148,834 3.00 $ 263,961 $ - $ 263,961 $ 85,468
Project Manager III
0.00 $ - $ - $ - $ - 1.00 $ 106,000 $ - $ 106,000 $ 34,322
Receptionist I 0.00 $ - $ - $ - $ - 1.00 $ 4,160 $ - $ 4,160 $ 1,347 Receptionist II 0.00 $ - $ - $ - $ - 1.00 $ 38,462 $ - $ 38,462 $ 12,454 Recruiter 0.00 $ - $ - $ - $ - 1.00 $ 50,000 $ - $ 50,000 $ 16,189 Resource Manager I
5.00 $ 487,954 $ 17,867 $ 505,821 $ 164,158 2.00 $ 180,457 $ - $ 180,457 $ 58,430
Resource Manager II
10.00 $ 1,106,599 $ 30,754 $ 1,137,353 $ 369,113 13.00 $ 1,451,679 $ - $ 1,451,679 $ 470,037
Service Delivery Analyst I
2.00 $ 79,550 $ 2,488 $ 82,038 $ 26,624 1.00 $ 48,110 $ - $ 48,110 $ 15,578
Service Delivery Analyst II
4.00 $ 223,178 $ 5,997 $ 229,175 $ 74,376 5.00 $ 272,571 $ - $ 272,571 $ 88,255
Service Delivery Analyst III
3.00 $ 201,618 $ 4,702 $ 206,320 $ 66,959 3.00 $ 204,346 $ - $ 204,346 $ 66,165
Sr. Accountant 1.00 $ 61,500 $ 3,075 $ 64,575 $ 20,957 1.00 $ 63,038 $ - $ 63,038 $ 20,411 Sr. Data Entry Operator
1.00 $ 25,736 $ 322 $ 26,058 $ 8,457 1.00 $ 25,487 $ - $ 25,487 $ 8,252
Sr. Programmer Analyst
19.00 $ 1,376,981 $ 26,358 $ 1,403,339 $ 455,435 24.00 $ 1,747,096 $ - $ 1,747,096 $ 565,690
Sr. Technical Specialist
7.00 $ 786,872 $ 20,405 $ 807,277 $ 261,991 9.00 $ 931,812 $ - $ 931,812 $ 301,710
Stock/Delivery Clerk
1.00 $ 31,293 $ 391 $ 31,684 $ 10,283 1.00 $ 29,848 $ - $ 29,848 $ 9,664
Supervisor Operations
5.00 $ 295,039 $ 8,345 $ 303,384 $ 98,459 5.00 $ 285,130 $ - $ 285,130 $ 92,322
Supervisor Sr. Comp Spec
1.00 $ 73,527 $ 1,532 $ 75,059 $ 24,359 1.00 $ 73,883 $ - $ 73,883 $ 23,923
Supervisor Technical Services
3.00 $ 230,232 $ 9,859 $ 240,091 $ 77,919 3.00 $ 224,200 $ - $ 224,200 $ 72,593
Systems Programmer III
1.00 $ 78,838 $ 1,314 $ 80,152 $ 26,012 0.00 $ - $ - $ - $ -
Systems Programmer IV
9.00 $ 854,055 $ 23,624 $ 877,679 $ 284,839 9.00 $ 857,043 $ - $ 857,043 $ 277,501
Technical Support Analyst I
1.00 $ 43,465 $ 2,173 $ 45,638 $ 14,811 2.00 $ 75,963 $ - $ 75,963 $ 24,596

city Agencies
City of San DiegoFiscal Year 2010 Annual Budget - 178 -
FY 2009 BUDgET FY 2010 BUDgET
Position Title Positions Base Salary
Salary Increases
(Merit, Bonus,
etc.) Salary
Subtotal Fringe
Benefits Positions Base Salary
Salary Increases
(Merit, Bonus,
etc.) Salary
Subtotal Fringe
BenefitsTechnical Support Analyst II
2.00 $ 90,372 $ 1,644 $ 92,016 $ 29,863 1.00 $ 48,329 $ - $ 48,329 $ 15,648
Trainer 1.00 $ 70,000 $ 3,500 $ 73,500 $ 23,853 0.00 $ - $ - $ - $ - Overtime 0.00 $ 162,743 $ - $ 162,743 $ 52,816 0.00 $ 166,040 $ - $ 166,040 $ 53,762 Market Adj /Promotions /Critical Skills
0.00 $ 250,000 $ - $ 250,000 $ 81,134 0.00 $ 50,000 $ - $ 50,000 $ 16,189
Attrition 0.00 $ (617,392) $ - $ (617,392) $ (200,365) 0.00 $ (648,285) $ - $ (648,285) $ (209,907)Mandatory one-week leave
0.00 $ - $ - $ - $ - 0.00 $ (400,845) $ - $ (400,845) $ (129,789)
TOTAL 258.00 $ 19,635,404 $ 597,578 $ 20,232,982 $ 6,566,352 280.00 $ 20,395,979 $ - $ 20,395,979 $ 6,603,987
* In Fiscal Year 2009, the President/CEO received $239,200, instead of the budgeted salary of $306,666. Note: Totals may not equal sum of the column, due to rounding.