Embed Size (px)
Citation preview
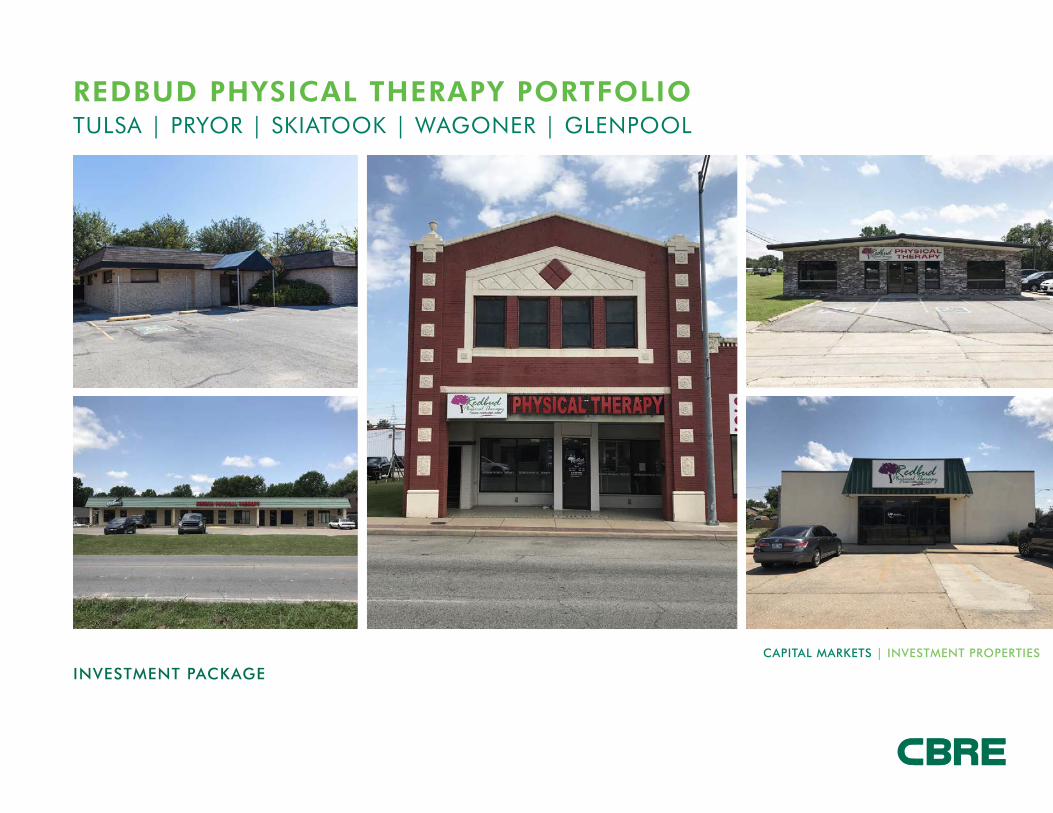
REDBUD PHYSICAL THERAPY PORTFOLIOTULSA | PRYOR | SKIATOOK | WAGONER | GLENPOOL
CAPITAL MARKETS | INVESTMENT PROPERTIES
INVESTMENT PACKAGE

DISCLAIMER
CBRE © 2015 All Rights Reserved. All information included in this letter/proposal pertaining to CBRE—including but not limited to its operations, employees, technology and clients—are proprietary and confidential, and are supplied with the understanding that they will be held in confidence and not disclosed to third parties without the prior written consent of CBRE. This letter/proposal is intended solely as a preliminary expression of general intentions and is to be used for discussion purposes only. The parties intend that neither shall have any contractual obligations to the other with respect to the matters referred herein unless and until a definitive agreement has been fully executed and delivered by the parties. The parties agree that this letter/proposal is not intended to create any agreement or obligation by either party to negotiate a definitive lease/purchase and sale agreement and imposes no duty whatsoever on either party to continue negotiations, including without limitation any obligation to negotiate in good faith or in any way other than at arm’s length. Prior to delivery of a definitive executed agreement, and without any liability to the other party, either party may (1) propose different terms from those summarized herein, (2) enter into negotiations with other parties and/or (3) unilaterally terminate all negotiations with the other party hereto.
This valuation analysis or broker opinion of value is not an appraisal and has not been performed in accordance with the Uniform Standards of Professional Appraisal Practice. Neither you, nor any third parties, may rely on this analysis for any tax purposes, estate work, litigation, lending or any other matter other than your direct use in connection with a contemplated transaction.
01EXECUTIVE SUMMARY
02TEAM OVERVIEW
03ASSET OVERVIEW
AFFILIATED BUSINESS DISCLOSURE AND CONFIDENTIALITY AGREEMENT
CBRE, Inc. operates within a global family of companies with many subsidiaries and related entities (each an “Affiliate”) engaging in a broad range of commercial real estate businesses including, but not limited to, brokerage services, property and facilities management, valuation, investment fund management and development. At times different Affiliates, including CBRE Global Investors, Inc. or Trammell Crow Company, may have or represent clients who have competing interests in the same transaction. For example, Affiliates or their clients may have or express an interest in the property described in this Memorandum (the “Property”), and may be the successful bidder for the Property. Your receipt of this Memorandum constitutes your acknowledgement of that possibility and your agreement that neither CBRE, Inc. nor any Affiliate has an obligation to disclose to you such Affiliates’ interest or involvement in the sale or purchase of the Property. In all instances, however, CBRE, Inc. and its Affiliates will act in the best interest of their respective client(s), at arms’ length, not in concert, or in a manner detrimental to any third party. CBRE, Inc. and its Affiliates will conduct their respective businesses in a manner consistent with the law and all fiduciary duties owed to their respective client(s).
Your receipt of this Memorandum constitutes your acknowledgement that (i) it is a confidential Memorandum solely for your limited use and benefit in determining whether you desire to express further interest in the acquisition of the Property, (ii) you will hold it in the strictest confidence, (iii) you will not disclose it or its contents to any third party without the prior
written authorization of the owner of the Property (“Owner”) or CBRE, Inc., and (iv) you will not use any part of this Memorandum in any manner detrimental to the Owner or CBRE, Inc.
If after reviewing this Memorandum, you have no further interest in purchasing the Property, kindly return it to CBRE, Inc.
This Memorandum contains select information pertaining to the Property and the Owner, and does not purport to be all-inclusive or contain all or part of the information which prospective investors may require to evaluate a purchase of the Property. The information contained in this Memorandum has been obtained from sources believed to be reliable, but has not been verified for accuracy, completeness, or fitness for any particular purpose. All information is presented “as is” without representation or warranty of any kind. Such information includes estimates based on forward-looking assumptions relating to the general economy, market conditions, competition and other factors which are subject to uncertainty and may not represent the current or future performance of the Property. All references to acreages, square footages, and other measurements are approximations. This Memorandum describes certain documents, including leases and other materials, in summary form. These summaries may not be complete nor accurate descriptions of the full agreements referenced. Additional information and an opportunity to inspect the Property may be made available to qualified prospective purchasers. You are advised to independently verify the accuracy and completeness of all summaries and
information contained herein, to consult with independent legal and financial advisors, and carefully investigate the economics of this transaction and Property’s suitability for your needs. ANY RELIANCE ON THE CONTENT OF THIS MEMORANDUM IS SOLELY AT YOUR OWN RISK.
The Owner expressly reserves the right, at its sole discretion, to reject any or all expressions of interest or offers to purchase the Property, and/or to terminate discussions at any time with or without notice to you. All offers, counteroffers, and negotiations shall be non-binding and neither CBRE, Inc. nor the Owner shall have any legal commitment or obligation except as set forth in a fully executed, definitive purchase and sale agreement delivered by the Owner.

ASSET OVERVIEW
4 | REDBUD PHYSICAL THERAPY PORTFOLIO© 2017 CBRE Limited. Data © TeleAtlas, Google, AerialExpress, DigitalGlobe, Landiscor, USGS, i-cubed. The information contained herein (the “Information”) is intended for informational purposes only and should not be relied upon by recipients hereof. Although the Information is believed to be correct, its accuracy, correctness or completeness cannot be guaranteed and has not been verified byeither CBRE Limited or any of its affiliates (CBRE Limited and its affiliates are collectively referred to herein as “CBRE”). CBRE neither guarantees, warrants nor assumes any responsibility or liability of any kind with respect to the accuracy, correctness, completeness, or suitability of, or decisions based upon or in connection with, the Information. The recipient of the Information should take such stepsas the recipient may deem appropriate with respect to using the Information. The Information may change and any property described herein may be withdrawn from the market at any time without notice or obligation of any kind on the part of CBRE. The Information is protected by copyright and shall be fully enforced.
Layout ID:L02 MapId:4959213
Glenpool
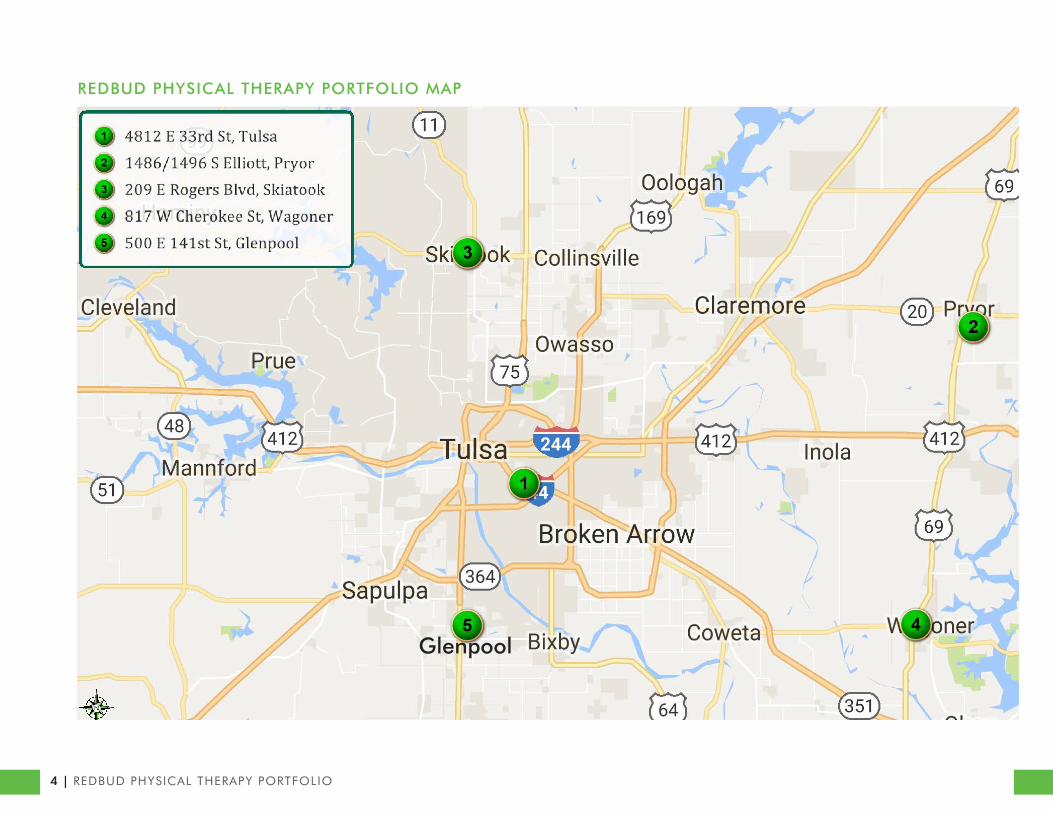
REDBUD PHYSICAL THERAPY PORTFOLIO MAP

REDBUD PHYSICAL THERAPY PORTFOLIO | 5
INVESTMENT SUMMARY
The Redbud Physical Therapy Portfolio (“RPTP”) consists of five properties located within 35 miles of the Tulsa MSA. These consist of three single tenant triple net medical office buildings and two multi-tenant office/retail properties. The improvements total ±27,320 SF situated on ±2.76 acres of land. Redbud PT is the major tenant in all buildings, a wholly owned subsidiary of Confluent Health Care. The single tenant buildings are currently 100% occupied with the multi-tenant buildings being 48% and 82% leased. The portfolio currently has eight leased spaces and three vacancies.
INVESTMENT HIGHLIGHTS
• CASH FLOW: With the property at 82% occupancy, the asset provides investors with in-place cash flow as well as potential for yearly NOI growth. The portfolio also provides redevelopment opportunities and cash flow improvement.
• FUTURE INCOME GROWTH: Below market lease rates offer investor upside through potential income growth while serving as a hedge against inflation.
• VARIABLE LOCATIONS: The main facility is conveniently situated in Tulsa with four properties located within 35 miles of the Tulsa MSA.
• REPLACEMENT COST: At $121 psf, well below replacement costs.
• RENOVATION & EXPANSION POTENTIAL: The multi-tenant properties in Skiatook and Pryor provide an opportunity to renovate and increase cash flow.
$/SFPRO FORMA NNN NOI
CAP
CONTRACT PRICE
$3,305,000 $121.00 $265,000.00 8.00%
PROPERTY OVERVIEW
Location Tenant Size (SF) Year Built Site Area Parking Zoning
Tulsa
4812 East 33rd Street Redbud Physical Therapy 5,460 1976 0.52 35 High Density Commercial
Tulsa, OK 74135
1486 - 1496 South Elliott Redbud Physical Therapy 3,220 1979 0.87 45 Office
Pryor, OK 74361 KeeWes 500
Complete Home Health 1,850
Michelle Hickox 750
Office 2,180
Total 8,500
209 East Rogers Blvd Redbud Physical Therapy 2,600 1923 0.18 5 High Density Commercial
Skiatook, OK 74070 Storage 1,860
Apartment 1,000
Total 5,460
817 West Cherokee Redbud Physical Therapy 4,900 1986 0.39 16 Commercial
Wagoner, OK 74467
500 East 141st Street Redbud Physical Therapy 3,000 1982 0.80 17 General Commercial
Glenpool, OK 74033
TOTALS 27,320 2.76
REDBUD PHYSICAL THERAPY PORTFOLIO PROPERTY OVERVIEW
Pryor
Glenpool
Wagoner
Skiatook
6 | REDBUD PHYSICAL THERAPY PORTFOLIO
PROPOSED LOAN TERMS:
ACQUISITION $3,305,000 Contract Price
REDEVELOPMENT $127,000 Skiatook & Pryor
TOTAL $3,432,000
BANK FINANCING
JANUARY 1, 2018
LTV: 80%
LOAN: $2,745,600
EQUITY: $686,400
AMORTIZATION: 20 years
TERM: 10 years
INTEREST RATE 5% or less
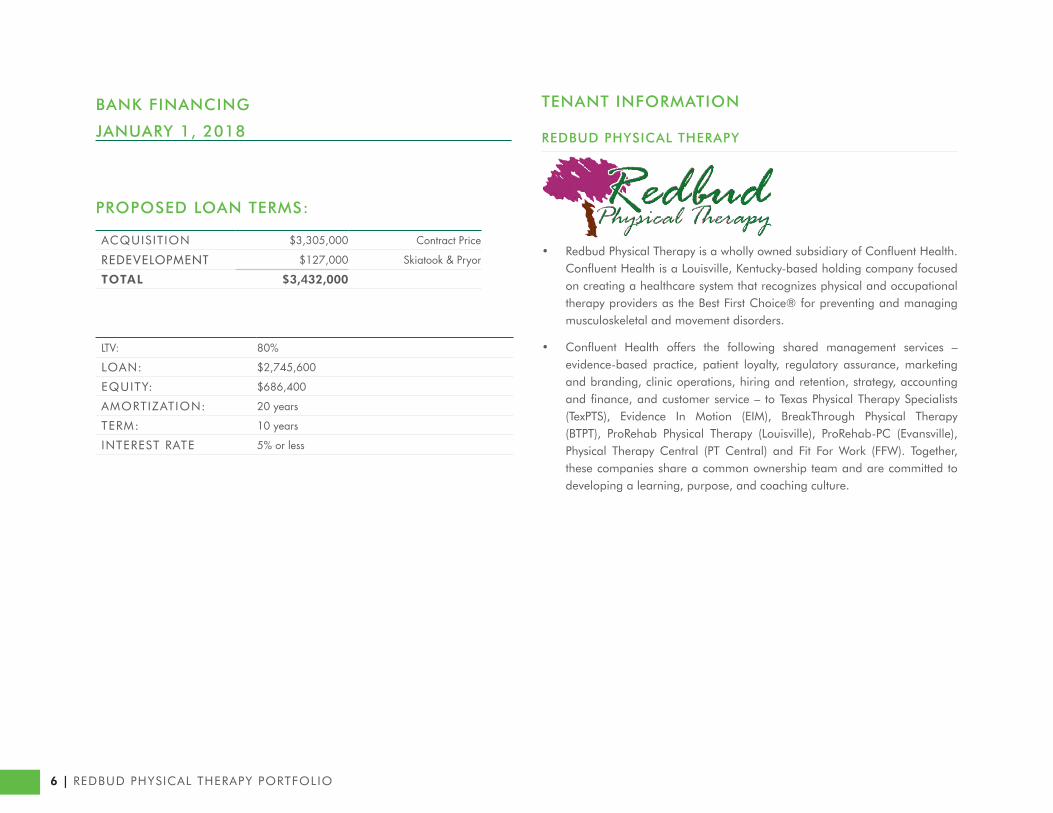
TENANT INFORMATION
REDBUD PHYSICAL THERAPY
• Redbud Physical Therapy is a wholly owned subsidiary of Confluent Health. Confluent Health is a Louisville, Kentucky-based holding company focused on creating a healthcare system that recognizes physical and occupational therapy providers as the Best First Choice® for preventing and managing musculoskeletal and movement disorders.
• Confluent Health offers the following shared management services – evidence-based practice, patient loyalty, regulatory assurance, marketing and branding, clinic operations, hiring and retention, strategy, accounting and finance, and customer service – to Texas Physical Therapy Specialists (TexPTS), Evidence In Motion (EIM), BreakThrough Physical Therapy (BTPT), ProRehab Physical Therapy (Louisville), ProRehab-PC (Evansville), Physical Therapy Central (PT Central) and Fit For Work (FFW). Together, these companies share a common ownership team and are committed to developing a learning, purpose, and coaching culture.
REDBUD PHYSICAL THERAPY PORTFOLIO | 7
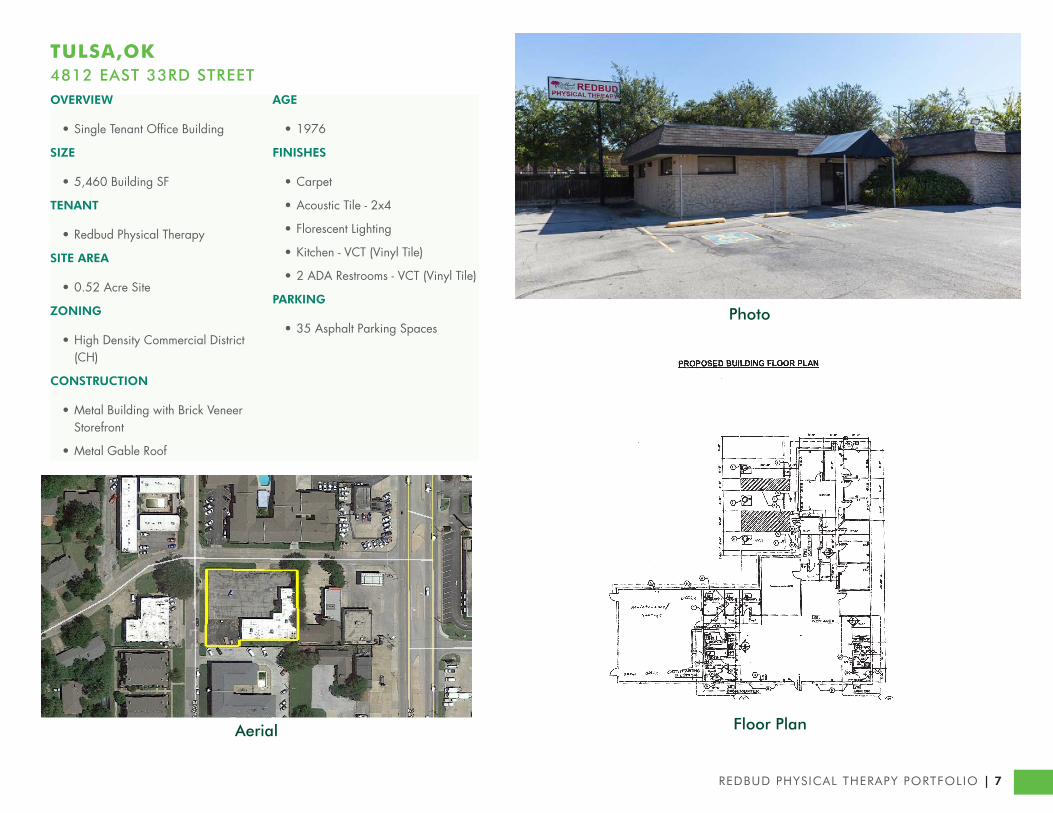
TULSA,OK4812 EAST 33RD STREETOVERVIEW
• Single Tenant Office Building
SIZE
• 5,460 Building SF
TENANT
• Redbud Physical Therapy
SITE AREA
• 0.52 Acre Site
ZONING
• High Density Commercial District (CH)
CONSTRUCTION
• Metal Building with Brick Veneer Storefront
• Metal Gable Roof
AGE
• 1976
FINISHES
• Carpet
• Acoustic Tile - 2x4
• Florescent Lighting
• Kitchen - VCT (Vinyl Tile)
• 2 ADA Restrooms - VCT (Vinyl Tile)
PARKING
• 35 Asphalt Parking Spaces
Aerial
Photo
Floor Plan

8 | REDBUD PHYSICAL THERAPY PORTFOLIO
TULSA
Tulsa has a population of 403,090 and is the 2nd largest city in the state. Located in the northeast corner of Oklahoma, Tulsa sits along the Arkansas River and at the foothills of the Ozark Mountains in a region known as “Green Country”. Once dependent on the oil industry, Tulsa now has a diverse economy with strong footings in the energy, finance, aviation, telecommunications, and technology sectors. Tulsa is also considered the cultural and arts center of Oklahoma.

REDBUD PHYSICAL THERAPY PORTFOLIO | 9
PRYOR,OK1486/1496 SOUTH ELLIOTTOVERVIEW
• Multi-Tenant Office Building
SIZE
• 8,500 Building SF
TENANTS
• Redbud Physical Therapy
• KeeWes
• Complete Home Health
• Michelle Hickox
SITE AREA
• 0.87 Acre Site
ZONING
• Office
CONSTRUCTION
• Brick Exterior
• Standing Seam Metal Roof/Gable
• Glass Storefront
• Non-Sprinklered
AGE
• 1979
FINISHES
• Carpet
• Drop Ceiling
• Acoustic Tile - 2x4
• Florescent Lighting
• CMU Separation Walls
• Kitchen - VCT (Vinyl Tile)
• Restroom - VCT (Vinyl Tile)
• Interior Above Ground Interior Therapy Pool - 20’x20’
PARKING
• 45 Concrete Parking Spaces
Floor Plan
Photo
Aerial

10 | REDBUD PHYSICAL THERAPY PORTFOLIO
PRYOR
Pryor lies about 45 miles northeast of Tulsa along OK-20 and has a population of approximately 9,520. Pryor is home to MidAmerica Industrial Park where Google has a $600 million internet data center facility. The city is the seventh largest manufacturing center in the state and the main industries it serves are: machinery, metals, electronics and transportation equipment.

REDBUD PHYSICAL THERAPY PORTFOLIO | 11
SKIATOOK,OK209 EAST ROGERS BOULEVARDOVERVIEW
• Historic Downtown 2 Story Building
• Mixed Use with Office, Retail and Apartment
SIZE
• 5,460 Building SF
TENANTS
• Redbud Physial Therapy
• Vacant Retail
• Vacant Apartment
SITE AREA
• 0.18 Acre Site
ZONING
• High Density Commercial District (CH)
CONSTRUCTION
• Brick Veneer with Concrete Accents
• Built up Roof / Composition Shingle
• Unfinished Apartment Upstairs
AGE
• 1923
FINISHES
• Carpet
• Acoustic Tile - 2x4
• Florescent Lighting
• Kitchen
• Restroom - VCT (Vinyl Tile)
• ADA Ramp
• HVAC RTU
PARKING
• 5 Concrete Parking Spaces
RETAIL UNIT
• Concrete Floor
• Brick
• Wood Deck
• Insulation - Painted
Floor Plan
Photo
Aerial

12 | REDBUD PHYSICAL THERAPY PORTFOLIO
SKIATOOK
Skiatook lies about 20 miles north of Tulsa just east of US-75 and has a population of approximately 7,908. Skiatook is home to Skiatook Lake, a 10,500-acre man-made lake with 160 miles of shoreline. Skiatook serves primarily as a suburb of Tulsa.

REDBUD PHYSICAL THERAPY PORTFOLIO | 13
WAGONER,OK817 WEST CHEROKEE STREETOVERVIEW
• Single Tenant Medical Office Building
SIZE
• 4,900 Building SF
TENANT
• Redbud Physical Therapy
SITE AREA
• 0.39 Acres
ZONING
• Commercial
CONSTRUCTION
• Metal with Brick Veneer Storefront
• Metal Roof
AGE
• 1986
FINISHES
• Carpet
• Acoustic Tile - 2x4
• Florescent Lighting
• Interior Inground Therapy Pool - 30x30
• Kitchen - VCT (Vinyl Tile)
• 2 ADA Restrooms - VCT (Vinyl Tile)
• Shower - Ceramic Tile
PARKING
• 16 Asphalt Parking Spaces
Floor Plan
Photo
Aerial

14 | REDBUD PHYSICAL THERAPY PORTFOLIO
WAGONER
Wagoner lies about 40 miles southeast of Tulsa along OK-51 and directly east of Fort Gibson Lake. The city has an approximate population of 8,846. The completion of Fort Gibson Lake in 1950 stimulated the economy and turned Wagoner into a sports and retirement center. Wagoner primarily serves as a bedroom community to Tulsa and Muskogee.

REDBUD PHYSICAL THERAPY PORTFOLIO | 15
GLENPOOL,OK500 EAST 141ST STREETOVERVIEW
• Single Tenant Medical Office Building
• Former Post Office
SIZE
• 3,000 Building SF
TENANT
• Redbud Physical Therapy
SITE AREA
• 0.80 Acre Site
ZONING
• General Commercial District (CG)
CONSTRUCTION
• Concrete Block with Brick Veneer
• Mansard Metal Vestibule
AGE
• 1982
FINISHES
• Carpet
• Acoustic Tile - 2x4
• Florescent Lighting
• Kitchen - VCT (Vinyl Tile)
• 2 Restrooms - VCT (Vinyl Tile)
• Interior Above Ground Therapy Pool - 20’x20’
PARKING
• 17 Concrete Parking Spaces
Floor Plan
Photo
Aerial

16 | REDBUD PHYSICAL THERAPY PORTFOLIO
GLENPOOL
Glenpool lies about 15 miles south of Tulsa along US-75 and has a population of approximately 13,479. In 1905, oil was discovered in Glenpool and propelled Tulsa’s growth. Glenpool now serves primarily as a commuter town for Tulsa.

MARKET OVERVIEW

18 | REDBUD PHYSICAL THERAPY PORTFOLIO PLATT COLLEGE | 18
$14.36 PSFAVERAGE ASKING RATES
30,479,389 SF TOTAL OFFICE MARKET
POPULATION
419,4942017 POPULATION
CITY OF TULSA | MARKET OVERVIEW
OFFICE MARKET
Source: CBRE RESEARCH
48.9%MALE
51.1%FEMALE
36AVERAGE
AGE
20.8%BACHELORS
$44,101MEDIAN HH
INCOME
14.0%AVERAGE VACANCY
REDBUD PHYSICAL THERAPY PORTFOLIO | 19
TULSA MARKET OVERVIEW
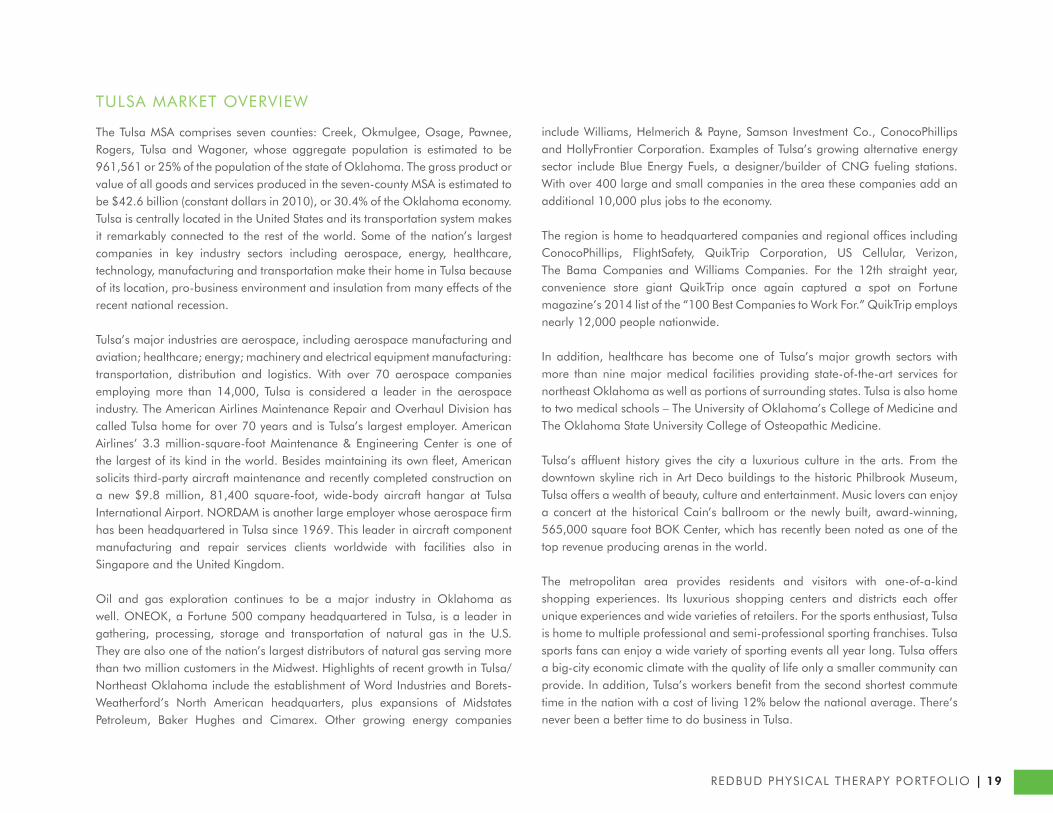
The Tulsa MSA comprises seven counties: Creek, Okmulgee, Osage, Pawnee, Rogers, Tulsa and Wagoner, whose aggregate population is estimated to be 961,561 or 25% of the population of the state of Oklahoma. The gross product or value of all goods and services produced in the seven-county MSA is estimated to be $42.6 billion (constant dollars in 2010), or 30.4% of the Oklahoma economy. Tulsa is centrally located in the United States and its transportation system makes it remarkably connected to the rest of the world. Some of the nation’s largest companies in key industry sectors including aerospace, energy, healthcare, technology, manufacturing and transportation make their home in Tulsa because of its location, pro-business environment and insulation from many effects of the recent national recession.
Tulsa’s major industries are aerospace, including aerospace manufacturing and aviation; healthcare; energy; machinery and electrical equipment manufacturing: transportation, distribution and logistics. With over 70 aerospace companies employing more than 14,000, Tulsa is considered a leader in the aerospace industry. The American Airlines Maintenance Repair and Overhaul Division has called Tulsa home for over 70 years and is Tulsa’s largest employer. American Airlines’ 3.3 million-square-foot Maintenance & Engineering Center is one of the largest of its kind in the world. Besides maintaining its own fleet, American solicits third-party aircraft maintenance and recently completed construction on a new $9.8 million, 81,400 square-foot, wide-body aircraft hangar at Tulsa International Airport. NORDAM is another large employer whose aerospace firm has been headquartered in Tulsa since 1969. This leader in aircraft component manufacturing and repair services clients worldwide with facilities also in Singapore and the United Kingdom.
Oil and gas exploration continues to be a major industry in Oklahoma as well. ONEOK, a Fortune 500 company headquartered in Tulsa, is a leader in gathering, processing, storage and transportation of natural gas in the U.S. They are also one of the nation’s largest distributors of natural gas serving more than two million customers in the Midwest. Highlights of recent growth in Tulsa/Northeast Oklahoma include the establishment of Word Industries and Borets-Weatherford’s North American headquarters, plus expansions of Midstates Petroleum, Baker Hughes and Cimarex. Other growing energy companies
include Williams, Helmerich & Payne, Samson Investment Co., ConocoPhillips and HollyFrontier Corporation. Examples of Tulsa’s growing alternative energy sector include Blue Energy Fuels, a designer/builder of CNG fueling stations. With over 400 large and small companies in the area these companies add an additional 10,000 plus jobs to the economy.
The region is home to headquartered companies and regional offices including ConocoPhillips, FlightSafety, QuikTrip Corporation, US Cellular, Verizon, The Bama Companies and Williams Companies. For the 12th straight year, convenience store giant QuikTrip once again captured a spot on Fortune magazine’s 2014 list of the “100 Best Companies to Work For.” QuikTrip employs nearly 12,000 people nationwide.
In addition, healthcare has become one of Tulsa’s major growth sectors with more than nine major medical facilities providing state-of-the-art services for northeast Oklahoma as well as portions of surrounding states. Tulsa is also home to two medical schools – The University of Oklahoma’s College of Medicine and The Oklahoma State University College of Osteopathic Medicine.
Tulsa’s affluent history gives the city a luxurious culture in the arts. From the downtown skyline rich in Art Deco buildings to the historic Philbrook Museum, Tulsa offers a wealth of beauty, culture and entertainment. Music lovers can enjoy a concert at the historical Cain’s ballroom or the newly built, award-winning, 565,000 square foot BOK Center, which has recently been noted as one of the top revenue producing arenas in the world.
The metropolitan area provides residents and visitors with one-of-a-kind shopping experiences. Its luxurious shopping centers and districts each offer unique experiences and wide varieties of retailers. For the sports enthusiast, Tulsa is home to multiple professional and semi-professional sporting franchises. Tulsa sports fans can enjoy a wide variety of sporting events all year long. Tulsa offers a big-city economic climate with the quality of life only a smaller community can provide. In addition, Tulsa’s workers benefit from the second shortest commute time in the nation with a cost of living 12% below the national average. There’s never been a better time to do business in Tulsa.

20 | REDBUD PHYSICAL THERAPY PORTFOLIO
SIGNIFICANT TULSA EMPLOYERS
COMPANY # EMPLOYEES
Aaon 1,178
AEP/PSO 1,200
American Airlines Maint. Base 6,750
AT&T 2,600
Baker Hughes 1,738
Bank of Oklahoma 3,250
Blue Cross/Blue Shield 1,250
Broken Arrow Public Schools 2,500
City of Tulsa 4,200
DirecTV 1,500
Dollar Thrifty Automotive 1,000
Farmers Insurance Group 1,750
Girling Health Care Inc. 1,500
Hard Rock Hotel & Casino 1,000
Hillcrest Healthcare System 4,250
HP Enterprise Services 1,000
IBM 1,250
Jenks Public Schools 1,750
Mazzio’s 2,250
Nordam Group 1,437
ONEOK* 4,077
COMPANY # EMPLOYEES
OSU Medical Center 1,250
Owasso Public Schools 1,250
QuikTrip 1,500
Reasor’s 2,500
River Spirit Casino 1,000
Saint Francis Health System 5,500
Spirit AeroSystems 1,750
St. John Medical Center 6,250
State Farm 1,300
Triad Hospitals, SouthCrest 1,100
Tulsa Community College 2,500
Tulsa County 2,000
Tulsa Public Schools 6,250
U.S. Postal Service 9,000
Union Public Schools 2,250
University of Tulsa 1,200
WalMart/Sam’s Club 1,000
Warehouse Market 1,000
Warren Clinic 1,000
Whirlpool Corporation 1,100
Williams Companies 1,250
TULSA MARKET OVERVIEW

REDBUD PHYSICAL THERAPY PORTFOLIO | 21
PO
PU
LAT
ION
2017 POPULATION - CURRENT YEAR ESTIMATE 419,494
2022 POPULATION - FIVE YEAR PROJECTION 440,480
2010 POPULATION - CENSUS 391,900
2000 POPULATION - CENSUS 392,752
2010-2017 ANNUAL POPULATION GROWTH RATE 0.94%
2017-2022 ANNUAL POPULATION GROWTH RATE 0.98%
HO
US
EH
OLD
S
2017 HOUSEHOLDS - CURRENT YEAR ESTIMATE 173,071
2022 HOUSEHOLDS - FIVE YEAR PROJECTION 180,971
2010 HOUSEHOLDS - CENSUS 163,973
2000 HOUSEHOLDS - CENSUS 165,667
2010-2017 ANNUAL HOUSEHOLD GROWTH RATE 0.75%
2017-2022 ANNUAL HOUSEHOLD GROWTH RATE 0.90%
2017 AVERAGE HOUSEHOLD SIZE 2.38
INC
OM
E
2017 AVERAGE HOUSEHOLD INCOME $69,784
2022 AVERAGE HOUSEHOLD INCOME $77,723
2017 MEDIAN HOUSEHOLD INCOME $44,101
2022 MEDIAN HOUSEHOLD INCOME $47,728
2017 PER CAPITA INCOME $29,214
2022 PER CAPITA INCOME $32,334
HO
US
ING
2017 HOUSING UNITS 194,568
2017 VACANT HOUSING UNITS 21,497
2017 OCCUPIED HOUSING UNITS 173,071
2017 OWNER OCCUPIED HOUSING UNITS 88,896
2017 RENTER OCCUPIED HOUSING UNITS 84,175
TULSA DEMOGRAPHICS

22 | REDBUD PHYSICAL THERAPY PORTFOLIO
TULSA OFFICE MARKETVIEW
TULSA’S ECONOMY CONTINUES TO MAKE STRIDESUnemployment rates dropped to 4.6% in the first half of the year. The rates were pushed lower by employment gains in manufacturing and business/professional services. The rebound in manufacturing is expected to be bolstered by demand from aerospace and energy through the remainder of the year. Moody’s Analytics projects unemployment to reach 4.3% by year-end; if accurate, it will be the strongest rate since the pre-financial crash of 2008. Although gross metro product (GMP) is expected to face slight contraction in 2017 with a negatie 0.6% change year-over-year, forecasts indicate steady growth ahead from 2018-2022.
CONSTRUCTION HALTSFor the first time since H2 2012, there is no office building construction activity. Slowed development has helped keep the market on its feet while weathering the energy slump.
ENERGY FIRMS TIP SCALE TO THE REDThe CBD and South submarkets experienced an increase in vacancy in H1 2017, primarily due to the downsizing of energy firms. The CBD contributed the majority of negative net absorption with 104,234 sq. ft. returned to the market. Samson Resources relocated within the CBD to First Place Tower and reduced their footprint to 60,000 sq. ft., which is one third of their previously occupied space in Williams Center Tower II. The South submarket has also been impacted by the energy crunch with either space reductions or vacancies from Houston Interests, SEM Group, and Murphy Energy. However, even as oil and gas companies continue to be in flux, the expectation is that they have “right sized” and will not continue to oershadow the positive gross absorption Tulsa has experienced. As this happens, the momentum will shift back to the black.
115,584 SFNET ABSORPTION
14.0%VACANCY RATE
$14.36/SF AVGASKNG RATE
0 SFCONSTRUCTION
TULSA OFFICEHIGHLIGHTS

REDBUD PHYSICAL THERAPY PORTFOLIO | 23
MARKETVIEW
Tailwinds approach as energy
firms keep a thumb on the scale
Tulsa Office, H1 2017
H1 2017 CBRE Research © 2017 CBRE, Inc. | 1
(115,584) SF 14.0% 0 SF$14.36 PSF
11.0
11.5
12.0
12.5
13.0
13.5
14.0
14.5
(150)
(100)
(50)
0
50
100
150
200
H1 2015 H2 2015 H1 2016 H2 2016 H1 2017
Vacancy Rate (%)Net Absorption (000s SF)
Net Absorption Vacancy Rate
Figure 1: Historical Net Absorption and Overall Vacancy
Source: CBRE Research, H1 2017.
*Arrows indicate trend from previous half-year.
TULSA’S ECONOMY CONTINUES TO MAKE STRIDES
CONSTRUCTION HALTS
ENERGY FIRMS TIP SCALE TO THE RED
MARKETVIEW
11.5
12.0
12.5
13.0
13.5
14.0
14.5
H1 20
15
H2 20
15
H1 20
16
H2 20
16
H1 20
17
(%)
H1 2017 CBRE Research © 2017 CBRE, Inc. | 2
TULSA OFFICE
0
10
20
30
40
50
60
70
H1 20
15
H2 20
15
H1 20
16
H2 20
16
H1 20
17
($) Millions
Figure 6: Historical Investment Sales Volume
Source: CBRE Research, Real Capital Analytics, H1 2017.
0
50
100
150
200
250
300
350
400
H1 20
15
H2 20
15
H1 20
16
H2 20
16
H1 20
17
(000s) SF
Figure 5: Historical Under Construction
Source: CBRE Research, H1 2017.
Figure 3: Historical Vacancy
Source: CBRE Research, Xceligent, H1 2017.
13.00
13.50
14.00
14.50
15.00
H1 20
15
H2 20
15
H1 20
16
H2 20
16
H1 20
17($) SF
Figure 4: Historical Asking Rates
Source: CBRE Research, Xceligent, H1 2017.
Figure 2: Market Statistics
Source: CBRE Research, Xceligent, H1 2017.
MarketH1 2017 Total
Leasable (SF)
H1 2017 Total Vacant
(SF)
H1 2017 Vacancy
(%)
H1 2017 Asking Rate Gross Avg. Annual
($/SF)
H1 2017 Net Absorption
(SF)
H1 2017 Under Construction
(SF)
CBD 11,112,397 1,488,587 13.4 14.41 (104,234) -
Uptown 1,368,879 35,593 2.6 16.52 11,937 -
Midtown 2,506,392 168,168 6.7 14.41 8,422 -
East 4,169,667 544,951 13.1 10.73 8,761 -
North 1,267,372 406,952 32.1 10.01 4,909 -
Southwest 572,009 39,259 6.9 17.82 0 -
South 9,482,673 1,588,233 16.7 15.94 (45,379) -
Total Market 30,479,389 4,271,743 14.0 14.36 (115,584) -
TULSA OFFICE MARKETVIEW CONTINUED

CA
PITA
L MA
RK
ET
S |
INV
ES
TM
EN
T P
RO
PE
RT
IES
PREPARED BY
BOB PIELSTICKER, SIORFirst Vice President+1 918 392 [email protected]
MATT REESE, CCIMSenior Associate+1 918 392 [email protected]
JEFFREY METCALF, MBAAssociate+1 918 392 [email protected]
© 2017 CBRE, Inc. All rights reserved. This information has been obtained from sources believed reliable, but has not been verified for accuracy or completeness. You are solely responsible for independently verifying the information in this Memorandum. ANY RELIANCE ON IT IS SOLELY AT YOUR OWN RISK.