Embed Size (px)
Citation preview

Traffic Noise Analysis Report
Red Wing US 63 Bridge and Approach Roadways TH 63 over the Mississippi River
Red Wing, MN
MN State Project Number: 2515-21
WI Project ID Number: 7210-00-06
June 2015

MnDOT/WisDOT | Traffic Noise Analysis Report
Red Wing US 63 Bridge and Approach Roadways TRAFFIC NOISE ANALYSIS REPORT
The purpose of this analysis is to evaluate and document the effect of the proposed State Project 2515-21 Preliminary Design for Red Wing US 63 Bridge and Approach Roadways (Project) on traffic‐ generated noise levels. This analysis includes modeled traffic noise levels for existing (2010) and future (2042) No Build and Build conditions. This report is organized into the following sections:
• Introduction (Background Information) • Analysis Methodology • Modeling Results • Noise Mitigation Evaluation • Noise Barrier Evaluation • Other Noise Mitigation Considerations • Conclusions
The traffic noise analysis is consistent with current Minnesota Department of Transportation (MnDOT) and Wisconsin Department of Transportation (WisDOT) noise policies.
MN#: 2515-21 2 | June 2015 WI#: 7210-00-06

MnDOT/WisDOT | Traffic Noise Analysis Report
Table of Contents Introduction ................................................................................................................................... 4
General Project Description ......................................................................................................... 4
Background Information on Noise ................................................................................................ 4
Federal and State Noise Policies ................................................................................................. 5
Federal Noise Abatement Criteria ............................................................................................ 6
WisDOT Noise Policy ............................................................................................................... 6
MnDOT Noise Policy and Minnesota State Noise Standards .................................................... 6
Methodology .................................................................................................................................. 8
Affected Environment ................................................................................................................... 8
Noise Monitoring .......................................................................................................................... 8
Noise Modeling ............................................................................................................................ 9
Traffic Noise Modeling (Wisconsin) .......................................................................................... 9
Traffic Noise Modeling (Minnesota) .......................................................................................... 9
Noise Model Results .................................................................................................................. 10
Noise Model Results (Wisconsin) ........................................................................................... 10
Noise Model Results (Minnesota) ........................................................................................... 11
Traffic Noise Abatement Analysis .............................................................................................. 12
Noise Barrier Evaluation............................................................................................................. 12
Noise Barrier Evaluation (Wisconsin) ..................................................................................... 12
Noise Barrier Evaluation (Minnesota) ..................................................................................... 13
Noise Barrier Analysis Results ................................................................................................... 14
Area A (Downtown Red Wing, MN) ......................................................................................... 14
Area B (Residential Receptors south of Highway 61, east of the proposed ramp) .................. 14
Other Traffic Noise Abatement Techniques ............................................................................... 15
Construction Noise .................................................................................................................... 16
Conclusions................................................................................................................................. 17
Appendix A................................................................................................................................... 18
Appendix B .................................................................................................................................. 22
Appendix C .................................................................................................................................. 31
Appendix D .................................................................................................................................. 39
MN#: 2515-21 3 | June 2015 WI#: 7210-00-06

MnDOT/WisDOT | Traffic Noise Analysis Report INTRODUCTION
Introduction
General Project Description MnDOT initiated the Red Wing Bridge Project in January 2012. The project includes the US 63 (Eisenhower) Bridge 9040 over the Mississippi River and the US 63 Bridge 9103 over US 61, as well as the highway connections to US 61, Minnesota TH 58, and approach roadways in the State of Wisconsin. The Eisenhower Bridge carries US 63 across the river from Red Wing and connects to the State of Wisconsin. The bridge provides the only regional crossing of the river for over 30 miles upstream or downstream for several communities on both the Wisconsin and Minnesota sides of the river. For the purposes of the noise analysis, these bridges and the surrounding land is called the study area.
Background Information on Noise Noise is defined as any unwanted sound. Sound travels in a wave motion and produces a sound pressure level. This sound pressure level is commonly measured in decibels. Decibels (dB) represent the logarithm of the ratio of a sound energy relative to a reference sound energy. For highway traffic noise, an adjustment, or weighting, of the high‐ and low‐ pitched sound is made to approximate the way that an average person hears sound. The adjusted sound levels are stated in units of “A‐weighted decibels” (dBA). A sound increase of 3 dBA is barely noticeable by the human ear, a 5 dBA increase is clearly noticeable, and a 10 dBA increase is heard as twice as loud.
In Wisconsin, traffic noise impacts are evaluated by measuring and modeling the equivalent steady-state sound level (Leq). The Leq is defined as the “equivalent steady-state sound level which in a stated period contains the same acoustic energy as the time-varying sound level during the same period.” For a one-hour period, the descriptor is the hourly equivalent sound level Leq(h) level.
In Minnesota, traffic noise impacts are evaluated by measuring and/or modeling the traffic noise levels that are expected to be exceeded 10 percent and 50 percent of the time during the hours of the day and/or night that have the loudest traffic noise levels. These level descriptors are identified as the L10 and L50 levels, respectively. The L10 level is the noise level that is exceeded for a total of 10 percent, or 6 minutes, of an hour. The L50 level is the noise level that is exceeded for a total of 50 percent, or 30 minutes, of an hour.
MN#: 2515-21 4 | June 2015 WI#: 7210-00-06

MnDOT/WisDOT | Traffic Noise Analysis Report INTRODUCTION
Table 1 provides a comparison of the noise levels of some common noise sources.
Table 1: Decibel levels of common noise sources
Sounds Pressure Level (dBA)
Noise Source
140 Jet Engine (at 75 feet) 130 Jet Aircraft (at 300 feet) 120 Rock and Roll Concert 110 Pneumatic Chipper 100 Jointer/Planer 90 Chainsaw 80 Heavy Truck Traffic 70 Business Office 60 Conversational Speech 50 Library 40 Bedroom 30 Secluded Woods 20 Whisper
Source: “A Guide to Noise Control in Minnesota,” Minnesota Pollution Control Agency, http://www.pca.state.mn.us/programs/pubs/noise.pdf and “Highway Traffic Noise,” FHWA, http://www.fhwa.dot.gov/environment/htnoise.htm
Along with the volume of traffic and other factors (e.g. topography of the area and vehicle speed) that contribute to the loudness of traffic noise, the distance of a receptor from a sound’s source is also an important factor. Sound level decreases as distance from a source increases. A rule of thumb regarding sound level decrease due to increasing distance from a line source (roadway) that is commonly used is: beyond approximately 50 feet from the sound source, each doubling of distance from the line source over hard ground (such as pavement or water) will reduce the sound level by 3 dBA, whereas each doubling of distance over soft ground (such as vegetated or grassy ground) results in a sound level decrease of 4.5 dBA.
Federal and State Noise Policies The Federal Highway Administration’s (FHWA) traffic noise regulation is described in 23 Code of Federal Regulations (CFR) Part 772, Procedures for Abatement of Highway Traffic Noise and Construction Noise. 23 CFR 772 requires identification of highway traffic noise impacts and the evaluation of potential noise abatement measures, along with other considerations, in conjunction with the planning and design of a Federal-aid highway project.
MN#: 2515-21 5 | June 2015 WI#: 7210-00-06

MnDOT/WisDOT | Traffic Noise Analysis Report INTRODUCTION
Federal Noise Abatement Criteria A traffic noise impact analysis is completed for all Federal or Federal-aid Type I projects (construction of a highway meeting one or more of eight criteria defined in 23 CFR 772.5). Noise impacts are determined based on land use activities and predicted worst hourly L10 or Leq noise levels under future conditions. For residential land uses (Activity Category B), the Federal Noise Abatement Criteria is 70 dBA (L10) and 67 dBA (Leq). Federal Noise Abatement Criteria (L10 and Leq) are shown in Table 2.
Receptor locations where noise levels are “approaching” or exceeding the criterion level must be evaluated for noise abatement feasibility and reasonableness. A noise impact also occurs when the future modeled noise levels substantially exceed the existing modeled noise levels. The definitions for “approaching” the Federal Noise Abatement Criteria and “substantial increase” in Wisconsin and Minnesota are provided below.
WisDOT Noise Policy The WisDOT policies and procedures for implementing the FHWA highway noise standards in 23 CFR Part 772 are outlined in the WisDOT Facilities Development Manual (FDM) Chapter 23. FDM Chapter 23 was approved by the FHWA as the department’s written noise policy on July 11, 2011. The provisions of Wisconsin Administrative Code Trans 405 serve as a supplement to the WisDOT policy.
In Wisconsin, “approaching” is defined as 1 dBA or less below the Federal Noise Abatement Criteria. For example, 66 dBA (Leq) is defined as “approaching” the Federal Noise Abatement Criteria for residential land uses (Activity Category B). A “substantial increase” is defined as an increase of 15 dBA or more under future conditions over the existing noise level.
MnDOT Noise Policy and Minnesota State Noise Standards The MnDOT policies and procedures for implementing the FHWA highway noise standards in 23 CFR 772 are outlined in the MnDOT Noise Policy (effective June 1, 2011). In Minnesota, “approaching” is defined as 1 dBA or less below the Federal Noise Abatement Criteria. For example, 69 dBA (L10) is defined as “approaching” the Federal Noise Abatement Criteria for residential land uses (Activity Category B). A “substantial increase” is defined as an increase of 5 dBA or greater from existing to future conditions.
Minnesota state noise standards have been established by the Minnesota Pollution Control Agency (MPCA) for daytime and nighttime periods. For residential land uses (identified as Noise Area Classification 1 or NAC‐1), the Minnesota State standards for L10 are 65 dBA for daytime and 55 dBA for nighttime; the standards for L50 are 60 dBA for daytime and 50 dBA for nighttime. The MPCA defines daytime as 7:00 a.m. to 10:00 p.m. and nighttime from 10:00 p.m. to 7:00 a.m. State noise standards are depicted in Table 3.
MN#: 2515-21 6 | June 2015 WI#: 7210-00-06

MnDOT/WisDOT | Traffic Noise Analysis Report INTRODUCTION
Table 2: Federal noise abatement criteria1
Activity Category
Activity Criteria (1)(2) Evaluation Location
Activity Description Leq (dBA) L10 (dBA)
A 57 60 Exterior Lands on which serenity and quiet are of extraordinary significance and serve and important public need and where the preservation of those qualities is essential if the area is to continue to serve its intended purpose
B(3) 67 70 Exterior Residential C(3) 67 70 Exterior Active sport areas, amphitheaters, auditoriums,
campgrounds, cemeteries, day care centers, hospitals, libraries, medical facilities, parks, picnic areas, places of worship, playgrounds, public meeting rooms, public or nonprofit institutional structures, radio studios, recording studios, recreation areas, Section 4(f) sites, schools, television studios, trails, and trail crossings
D 52 55 Interior Auditoriums, day care centers, hospitals, libraries, medical facilities, places of worship, public meeting rooms, public or nonprofit institutional structures, radio studios, recording studios, schools, and television studios
E(3) 72 75 Exterior Hotels, motels, offices, restaurants/bars, and other developed lands, properties or activities not included in A‐D or F
F ‐‐ ‐‐ ‐‐ Agriculture, airports, bus yards, emergency services, industrial, logging, maintenance facilities, manufacturing, mining, rail yards, retail facilities, shipyards, utilities (water resources water treatment, electrical), and warehousing
G ‐‐ ‐‐ ‐‐ Undeveloped lands that are not permitted (1) In Minnesota, traffic noise impacts are determined using the hourly L10 value. In Wisconsin, traffic noise impacts are
determined using the hourly Leq value. (2) The Leq(h) and L10(h) Activity Criteria values are for impact determination only, and are not design standards
for noise abatement measures. (3) Includes undeveloped lands permitted for this activity category.
Table 3: Minnesota state noise standards
Land Use Code Daytime (7 a.m. – 10 p.m.) dBA
Nighttime (10 p.m. – 7:00 a.m.) dBA
Residential NAC‐1(1) L10 of 65 L50 of 60 L10 of 55 L50 of 50 Commercial NAC‐2(2) L10 of 70 L50 of 65 L10 of 70 L50 of 65 Industrial NAC‐3(3) L10 of 80 L50 of 75 L10 of 80 L50 of 75
(1) NAC‐1 includes household units, transient lodging and hotels, educational, religious, cultural entertainment, camping, and picnicking land uses
(2) NAC‐2 includes retail and restaurants, transportation terminals, professional offices, parks, recreational, and amusement land uses.
(3) NAC‐3 includes industrial manufacturing, transportation facilities (except terminals), and utilities land uses.
1 WisDOT has substituted the term “Noise Level Criteria” for “Noise Abatement Criteria” in the Department’s noise policy (see Chapter 23, Section 30 of the WisDOT Facilities Development Manual). The term “Noise Abatement Criteria” shall be referred to throughout this document for consistency purposes only.
MN#: 2515-21 7 | June 2015 WI#: 7210-00-06

MnDOT/WisDOT | Traffic Noise Analysis Report METHODOLOGY
Methodology Affected Environment The purpose of this noise analysis is to determine if traffic noise impacts are projected to occur as a result of the proposed project, at noise sensitive receptors (residences, businesses, etc.) in the study area.
The Red Wing Bridge Project (Minnesota S.P. 2515-21 and Wisconsin Project ID 7210-00-06) is located in the cities of Hager City, Wisconsin and Red Wing, Minnesota. Existing land uses in the vicinity of the Wisconsin portion of the study area consist primarily of a campground and marina. Existing land uses in the vicinity of the Minnesota portion of the study area consist primarily of commercial uses (downtown portion of project) and residential uses (Hwy 61 heading east).
Traffic noise is generated by vehicles traveling on the highway, as well as intersecting roadways.
Noise Monitoring Existing traffic noise levels were measured in the field and then compared against computer predictions to verify the accuracy of the computer model. If the predicted and measured levels are within + or – 3 dBA of one another, this is an indication that the modeling is within the accepted level of accuracy.
Existing noise levels were monitored at five sites adjacent to the proposed project area. Traffic was counted at four of these sites (A-D). At one of the locations (E) traffic was not counted, and thus validation modeling was not performed. The monitored noise levels at location E are presented for informational purposes only. Noise monitoring locations are described below and depicted on Figures 1‐3 in Appendix A.
• Monitoring site A is located west of Highway 63 in the Trenton Island Yacht Club (see Figure 1).
• Monitoring site B is located west of Highway 63 in Levee Park (see Figure 2). • Monitoring site C is located south of Highway 61 near 4th St and Green St (see Figure 3). • Monitoring site D is located south of Highway 61 near 3rd St and Sanderson St (see Figure 3). • Monitoring site E is located near 3rd St and Plum St in the parking lot of the Armory Center
Building (see Figure 2).
Noise levels were monitored on May 13, 2014. Traffic noise measurements were conducted in accordance with FHWA‐PD‐96‐046 Measurement of Highway Related Noise (May 1996).
The measured and predicted noise levels for each of the monitoring sites selected along the project corridor are presented in Table 4. Each set of predicted and measured data (A-D) was found to be within the acceptable + or – 3 dBA tolerance; therefore the modeling is considered to be validated.
MN#: 2515-21 8 | June 2015 WI#: 7210-00-06

MnDOT/WisDOT | Traffic Noise Analysis Report METHODOLOGY
Table 4: Model validation results, hourly A-weighted sound level decibels (dBA)
Existing Monitored Results Existing Modeled Results Difference Monitoring Location
A (1) Leq
51.6 Monitoring Location
A(1) Leq
48.7 Leq
‐2.9
Monitoring Location B
L10 L50 Monitoring Location B
L10 L50 L10 L50 54.0 50.8 52.0 47.9 ‐2.0 ‐2.9
Monitoring Location C
L10 L50 Monitoring Location C
L10 L50 L10 L50
63.4 56.4 65.5 57.1 +2.1 +0.7 Monitoring Location
D L10 L50 Monitoring Location
D L10 L50 L10 L50
66.5 59.4 66.0 57.8 ‐0.5 ‐1.6 Monitoring Location
E L10 L50 N/A
69.5 61.6 (1) Monitoring Location A was in Wisconsin, thus validation monitoring was done using Leq and modeling was done using
TNM.
Noise Modeling Traffic Noise Modeling (Wisconsin) Noise modeling for the Wisconsin portion of the project was done using the FHWA noise prediction program “TNM” (Traffic Noise Model), version 2.5. TNM is similar to the MINNOISE model described below in that it also uses traffic volumes, speed, class of vehicle, and the typical characteristics of the roadway being analyzed (e.g., roadway horizontal and vertical alignment). Traffic data input into the TNM noise model input files for the proposed project included existing year (2010) and future year (2042) Recommended Alternative forecast traffic volumes.
Traffic Noise Modeling (Minnesota) Noise modeling for the Minnesota portion of the project was done using the noise prediction program “MINNOISEV31,” a version of the FHWA “STAMINA” model adapted by MnDOT. This model uses traffic volumes, speed, class of vehicle, and the typical characteristics of the roadway being analyzed (e.g. roadway horizontal and vertical alignment). Traffic data input into the MINNOISE31 noise model input files for the proposed project included existing year (2010) and future year (2042) No-Build and Recommended Alternative forecast traffic volumes.
Traffic noise impacts were assessed by modeling noise levels at receptor sites likely to be affected by construction of the proposed project. Noise receptors were modeled 500 feet past the project limits to include all receptors potentially affected by the project. Traffic noise levels were modeled at 112 representative receptor locations along the project corridor. The locations of the modeled receptor sites are illustrated in Figure 1 through Figure 3 in Appendix A. Land uses (residential, commercial, etc.) are listed with each modeled receptor location in Tables 6-7 in Appendix B.
MN#: 2515-21 9 | June 2015 WI#: 7210-00-06

MnDOT/WisDOT | Traffic Noise Analysis Report METHODOLOGY
Noise model input files were developed based on the following assumptions:
• Traffic data input into the noise models was provided by SEH and included existing (year 2010) and future (year 2042) No Build and Build traffic volumes and is provided in Appendix D.
• Vehicle mix data (% Autos, % Medium Trucks, % Heavy Trucks) was not available for each individual hour of the day. Therefore, the peak traffic hour was used as the peak noise hour for the purposes of traffic noise modeling. A table is included in Appendix D showing the total hourly traffic used to identify the loudest hours.
• The 6:00 a.m. to 7:00 a.m. period was identified from modeling of the traffic data as the loudest hour of the nighttime period.
• The 4:00 p.m. to 5:00 p.m. period was identified from modeling of the traffic data as the loudest hour of the daytime period.
• An acoustically “soft” surface (alpha=0.5) was assumed between modeled receptor locations and modeled roadways in the MINNOISE31 input files.
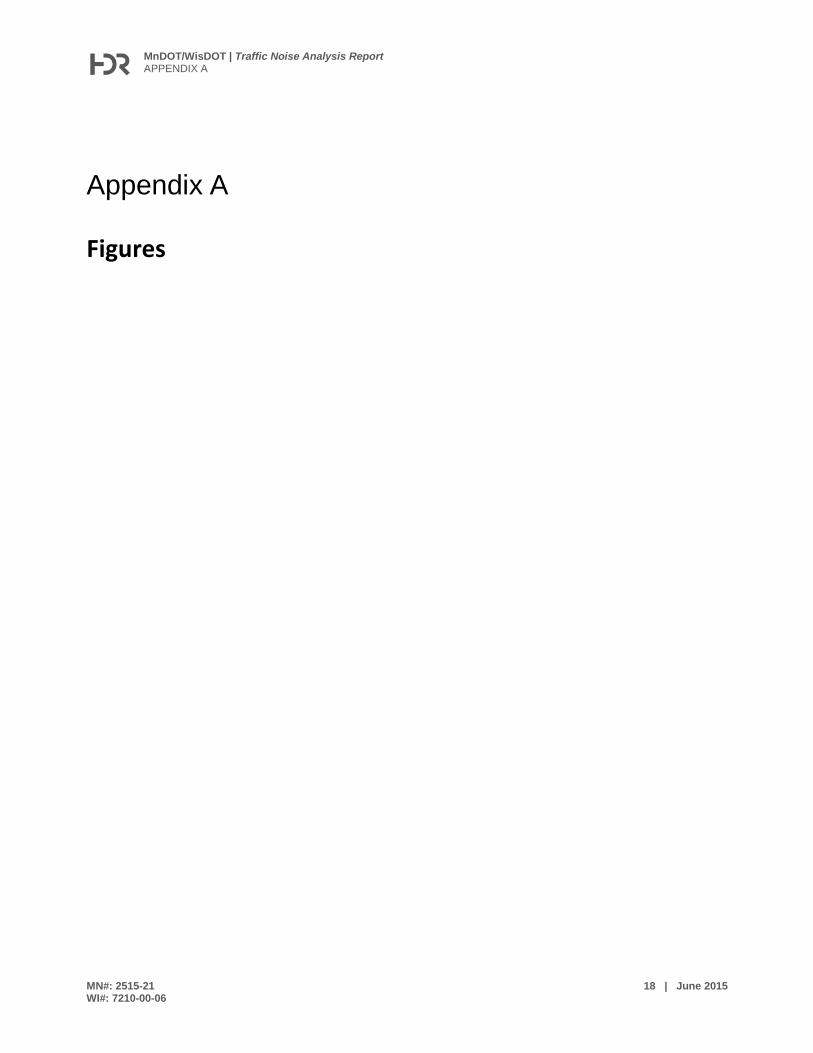
Noise Model Results Results of the noise modeling analysis are tabulated in Table 6 (Wisconsin), Table 7 (Minnesota – daytime), and Table 8 (Minnesota – Nighttime) in Appendix B. The results of the traffic noise modeling analysis are summarized below.
Noise Model Results (Wisconsin) Existing (2010) modeled noise levels at receptor locations in the Wisconsin portion of the project area range from 50.5 dBA (Leq) to 65.9 dBA (Leq). Modeled noise levels do not approach or exceed Federal Noise Abatement Criteria under existing conditions (≥ 66 dBA, Leq for Activity Category B).
Future (2042) modeled noise levels under the Recommended Alternative range from 51.7 dBA (Leq) to 59.9 dBA (Leq). In general, most modeled receptor locations (50 feet to 500 feet on each side of the bridge in the marina) are projected to experience an increase in traffic noise levels from existing conditions to the future Recommended Alternative. This change is predicted to range from -6.5 dBA to 1.5 dBA. Some receptor locations are expected to experience a decrease in traffic noise levels as traffic shifts from the existing bridge to the proposed bridge under the Recommended Alternative.
Traffic noise levels at modeled receptor locations in Wisconsin do not approach or exceed Federal Noise Abatement Criteria for Activity Category B with the future Recommended Alternative. Modeled traffic noise levels are projected to range from 7.1 dBA to 15.3 dBA less than the Federal Noise Abatement Criteria for Activity Category B (67 dBA, Leq). In addition, none of the modeled receptor locations are projected to experience a substantial increase in traffic noise levels from existing conditions to the Recommended Alternative (see Table 6). Noise impacts were not predicted at any Section 4(f) properties.
MN#: 2515-21 10 | June 2015 WI#: 7210-00-06

MnDOT/WisDOT | Traffic Noise Analysis Report METHODOLOGY
Noise Model Results (Minnesota) The following describes the noise modeling results for the Minnesota portion of the Red Wing Bridge Project.
Existing (2010) daytime modeled noise levels at receptor locations in the Minnesota portion of the project range from 57.2 dBA (L10) to 70.1 dBA (L10) and 51.7 dBA (L50) to 59.3 dBA (L50), whereas nighttime modeled noise levels range from 55.9 dBA (L10) to 68.9 dBA (L10) and 43.3 dBA (L50) and 57.8 dBA (L50). Modeled daytime traffic noise levels for existing conditions exceed State daytime L10 standards at 8 of the 92 modeled receptor locations and State daytime L50 standards at 0 of the 92 modeled receptor locations; whereas modeled nighttime traffic noise levels for existing conditions exceed State nighttime L10 standards at 67 of 92 modeled receptor locations and State nighttime L50 standards at 61 of the 92 modeled receptor locations.
Future (2042) daytime modeled noise levels under the No Build Alternative are predicted to range from 58.3 dBA (L10) to 72.7 dBA (L10) and 53.4 dBA (L50) to 62.4 dBA (L50), whereas nighttime modeled noise levels range from 56.3 dBA (L10) to 69.5 dBA (L10) and 50.1 dBA (L50) to 58.1 dBA (L50). In general, modeled daytime traffic noise levels are predicted to increase by 0.1 dBA to 2.7 dBA under the No Build Alternative compared to existing conditions. Modeled traffic noise levels are predicted to exceed State daytime L10 standards at 21 of 92 modeled receptor locations and State daytime L50 standards at 1 of 92 modeled receptor locations with the No Build Alternative. Modeled nighttime traffic noise levels are predicted to exceed State nighttime L10 standards at 67 of 92 modeled receptor locations and State nighttime L50 standards at 67 of 92 modeled receptor locations with the No Build Alternative.
Daytime modeled noise levels are predicted to range from 58.7 dBA (L10) to 74.4 dBA (L10) and 53.6 dBA (L50) to 65.6 dBA (L50) under the future (2042) Recommended Alternative. Nighttime modeled noise levels are predicted to range from 56.5 dBA (L10) to 71.1 dBA (L10) and 44.4 dBA (L50) to 60.9 dBA (L50) under the future Recommended Alternative. In general, modeled daytime traffic noise levels are predicted to change by -9.8 dBA to 6.7 dBA compared to existing conditions, whereas modeled nighttime traffic noise levels are predicted to change by -9.0 dBA to 4.7 dBA compared to existing conditions.
Some modeled receptor locations are projected to experience a decrease in traffic noise levels with the Recommended Alternative. These decreases were generally observed at locations where the new ramp alignment will shift traffic volumes to different routes. Modeled noise levels are predicted to exceed State daytime L10 standards at 27 of the 92 modeled receptor locations and State daytime L50 standards at 10 of the 92 modeled receptors under the future Recommended Alternative. Modeled noise levels are predicted to exceed State nighttime L10 standards at 69 of the 92 modeled receptor locations and State nighttime L50 standards at 68 of the 92 modeled receptor locations under the future Recommended Alternative.
Modeled L10 noise levels are projected to approach Federal Noise Abatement Criteria for Activity Category B at one modeled receptor location, additionally one of the modeled receptor locations is projected to experience a substantial increase in traffic noise levels from existing conditions to the future Recommended Alternative.
MN#: 2515-21 11 | June 2015 WI#: 7210-00-06

MnDOT/WisDOT | Traffic Noise Analysis Report TRAFFIC NOISE ABATEMENT ANALYSIS
One receptor, receptor 44 within the Barn Bluff property, was also reviewed with respect to potential for noise-related Section 4(f) constructive use impacts as a result of the project. However, noise levels at this location do not approach or exceed State and Federal standards nor is a substantial increase in noise levels predicted. As a result, the project does not result in any noise-related Section 4(f) impacts. See Figure 2 in Appendix A for the location of receptor 44 and Tables 7 and 8 within Appendix B for its detailed noise model results.
Commercial land uses are located downtown Red Wing, Minnesota. Commercial land uses fall under Federal Activity Category E. The Federal Noise Abatement Criterion for Activity Category E is 75 dBA (L10) (see Table 2). None of the modeled noise levels at receptor locations representing commercial land uses were identified to approach or exceed Federal Noise Abatement Criteria under existing and future No Build conditions. One modeled noise receptor representing commercial land uses were identified to approach or exceed Federal Noise Abatement Criteria with the future Recommended Alternative.
Traffic Noise Abatement Analysis The construction of the Red Wing Bridge Project is considered a Type I project for the purposes of traffic noise analysis (23 CFR 772.5). 23 CFR 772.15(c) describes noise abatement measures that are to be considered when a traffic noise impact has been identified with a Type I highway project. These noise abatement measures include:
• Construction of noise barriers, including acquisition of property rights, either within oroutside the highway right of way. Landscaping is not a viable noise abatement measure.
• Traffic management measures, including, but not limited to, traffic control devices andsigning for prohibition of certain vehicle types, time-use restrictions for certain vehicle types,modified speed limits, and exclusive lane designations.
• Alteration of horizontal and vertical alignments.• Acquisition of real property or interests therein (predominantly unimproved property) to
serve as a buffer zone to preempt development which would be adversely impacted bytraffic noise.
• Noise insulation of Activity Category D land use facilities listed in Table 3 (auditoriums, daycare centers, hospitals, libraries, medical facilities, places of worship, public meeting rooms,public or nonprofit institutional structures, radio studios, recording studios, schools, andtelevision studios).
Noise Barrier Evaluation Noise Barrier Evaluation (Wisconsin) WisDOT’s policies and procedures for evaluating noise barrier feasibility and reasonableness are set forth in the Facilities Development Manual (FDM) Chapter 23. Wisconsin Administrative Code Chapter Trans 405 (Siting Noise Barriers) serves as a supplement to the written noise policy in FDM Chapter 23.
As described under “Noise Model Results”, none of the modeled receptor locations in the Wisconsin portion of the project are predicted to experience a traffic noise impact as a result of the project. Modeled traffic noise levels under the future Recommended Alternative are predicted to
MN#: 2515-21 12 | June 2015 WI#: 7210-00-06

MnDOT/WisDOT | Traffic Noise Analysis Report TRAFFIC NOISE ABATEMENT ANALYSIS
be below the Federal Noise Abatement Criteria for Activity Category B uses, and increases in traffic noise levels from existing to future conditions are predicted to be less than 15 dBA. Noise abatement measures are not required for the Wisconsin portion of the project. As such, the WisDOT procedures for evaluating noise barrier feasibility and reasonableness are not summarized in this document.
Noise Barrier Evaluation (Minnesota) MnDOT’s policies and procedures for evaluating noise barrier feasibility and reasonableness are set forth in Chapter 5 of the MnDOT Highway Noise Policy (Analysis of Noise Abatement Measures).
Noise barrier construction decisions are based on a study of feasibility and reasonableness.
Feasibility is determined by physical and/or engineering constraints (i.e. whether a noise barrier could feasibly be constructed on the site) and by acoustic ability (at least one impacted receptor per proposed barrier must receive the minimum reduction of 5 dBA to achieve acoustic feasibility). There are three reasonableness factors that must be met for a noise abatement measure to be considered reasonable.
1. A noise reduction design goal of at least 7 dBA must be achieved at a minimum of one benefited receptor for each proposed noise abatement measure to be considered reasonable.
2. A cost effectiveness threshold of $43,500 per individual benefited receptor has been established, based on an estimated construction cost of $20/ft2 for noise walls (additional costs of some items such as guard rail, rub rail, purchased right‐of‐way, etc.., shall be added to the baseline unit costs cited above for the purpose of cost estimation).
3 . The viewpoints of the property owners and residents of all benefited receptors shall be solicited and considered in reaching a decision on the abatement measures to be provided. This occurs through a voting procedure as explained below.
Section 5.3.3 of the MnDOT Noise Policy (effective date: June 1, 2011) contains a detailed explanation of the voting system. A simple majority (greater than 50%) of all possible voting points (not just the ones that reply) for each potential noise abatement measure must vote “down” or against the abatement measure to remove it from further consideration.
There are several steps to assessing the cost‐effectiveness of noise barriers. First, the cost‐ effective noise barrier height is determined for each segment of the project area. For this study, three heights of potential noise barriers were analyzed: 20 feet (MnDOT’s maximum height), 15 feet (if necessary), and 10 feet (if necessary). If a 20‐foot tall noise barrier meets the reasonableness criteria and is feasible, it would be proposed for construction. If the 20‐foot tall barrier does not meet the criteria, a 15‐foot high barrier is evaluated. Likewise, if a 15‐foot tall barrier does not meet the criteria, a 10‐foot high barrier is studied. If a 10‐foot tall noise barrier meets the reasonableness criteria and is feasible, it would then be proposed for construction. All barriers evaluated must meet MnDOT’s 7 dBA noise reduction design goal. If a barrier is unable to achieve the 7 dBA noise reduction design goal, further evaluation of shorter barrier heights will not completed.
MN#: 2515-21 13 | June 2015 WI#: 7210-00-06

MnDOT/WisDOT | Traffic Noise Analysis Report TRAFFIC NOISE ABATEMENT ANALYSIS
Noise Barrier Analysis Results Noise barriers were evaluated at all modeled receptor locations that are predicted to approach or exceed Federal Noise Abatement Criteria, experience a substantial increase in noise levels from existing to future conditions, and/or exceed State daytime/nighttime noise standards under the future (2042) Recommended Alternative. The locations of the modeled noise barriers are shown in Figures 1 through 3 in Appendix A.
Noise barrier cost‐effectiveness results are tabulated at the end of this report in Appendix C. Multiple barrier configurations were evaluated (barrier lengths and heights). The results presented below represent the most acoustically effective and/or cost effective noise barrier configuration identified in this analysis. Results for a 20-foot high noise barrier are described with each modeled barrier first, followed by a discussion of additional barrier heights less than 20 feet where applicable. The discussion of noise barrier modeling results presented below includes only daytime results. For reference, nighttime noise barrier cost effectiveness results are also tabulated and presented at the end of this report in Appendix C, with the daytime noise barrier cost effectiveness results. In general, results of daytime noise barrier cost effectiveness for the project are consistent with noise barrier cost effectiveness for nighttime conditions.
Area A (Downtown Red Wing, MN) Area A includes the commercial receptors located downtown Red Wing (Receptors 21-44).
Modeled noise levels exceed State daytime standards at 11 of 24 modeled receptor locations in this area with future (2042) Daytime Build conditions. Modeled noise levels exceed State nighttime standards at 1 of 24 modeled receptor locations in this area with future (2042) Nighttime Build conditions.
The impacted receptor locations in Area A occur at commercial receptors located on city streets, directly abutting the sidewalks and roadway. Constructing noise barriers in downtown Red Wing does not meet the MnDOT engineering feasibility requirements for constructability listed in Section 5.2.2 of the MnDOT Noise Policy. Specifically, safety requirements that a noise barrier must not present a crash hazard, intrude into crash zones, or cause restrictions of critical sight lines at intersections.
Area B (Residential Receptors south of Highway 61, east of the proposed ramp) Land uses south of Highway 61 and east of the newly proposed ramp are mainly residential with the exception of the City of Red Wing Streets Department building (which will be displaced as part of the proposed project).
Noise levels were modeled at 68 receptor locations in Area B (Receptors 45-112). Modeled noise levels exceed State daytime standards at 16 of 68 modeled receptor locations in this area with future (2042) Daytime Build conditions. Modeled noise levels exceed State nighttime standards at 68 of 68 modeled receptor locations in this area with future (2042) Nighttime Build conditions. Receptors 45-47 will be displaced as part of the project.
A noise barrier was evaluated on the proposed ramp attempting to shield the residences in this area. Due to sight distance requirements for the intersection of the ramp with Highway 61, the
MN#: 2515-21 14 | June 2015 WI#: 7210-00-06

MnDOT/WisDOT | Traffic Noise Analysis Report TRAFFIC NOISE ABATEMENT ANALYSIS
proposed barrier was unable to connect to Noise Barrier B (described below). For a noise barrier to be effective it must be continuous, with no breaks. The opening required for the intersection of the ramp with Highway 61 makes the noise barrier unable to provide the required 7 dBA noise reduction per MnDOT Noise Policy.
Noise Barrier B
Receptors 48 through 112 (see Figure 3)
An approximately 1,290‐foot long, 20‐foot high noise barrier was modeled along the south side of Highway 61 starting just east of the newly proposed ramp and heading east. The noise barrier ending point was chosen at a location where the future build noise levels with the project constructed (w/o the noise barrier) are not noticeably higher than the future no-build noise levels. The approximately 1,290‐ foot long barrier costs approximately $500,320 and provides a reduction that varies from 0.4 dBA to 11.1 dBA. The cost‐ effectiveness of the barrier is $11,635 per benefited receptor (43 benefited receptors).
The approximately 1,290‐foot long, 20‐foot high, modeled Barrier B meets MnDOT’s minimum $43,500 cost‐effectiveness criteria and is warranted to be carried forward to the next step of the noise barrier evaluation process which involves soliciting input from the benefited property owners and residents.
No other sites warranted evaluation of noise mitigation.
Other Traffic Noise Abatement Techniques Noise abatement measures other than noise barriers were considered for the proposed project. These measures are summarized below.
Traffic Management Measures: These measures include such items as prohibition of certain vehicle types and time-use restrictions for certain vehicle types. These traffic management measures are not reasonable for the Red Wing Bridge Project because this would be inconsistent with the Project’s intended use.
• Modified Speed Limits: In general, a decrease in speed of approximately 20 miles per hour is necessary for a noticeable decrease in noise levels. Lower speeds would reduce the capacity of the highway and is not consistent with the function of these roadways. In addition, motorists would likely not obey a substantially lower speed limit.
• Vertical and Horizontal Alignment: The proposed project includes reconstruction of the US 63 Red Wing Bridge and approach roadways. The horizontal and vertical alignments of connecting roadways are determined by the crossing location and design. Further changes in the horizontal and vertical alignment of connecting roadways are not feasible without substantial impacts to surrounding properties.
• Landscaping/Natural Noise Screening: Vegetation is only effective for reducing noise levels if it is at least 100 to 200 feet deep, a minimum of 15 feet above the line of sight, and dense enough that is cannot be seen through (i.e. evergreen vegetation, which maintains its
MN#: 2515-21 15 | June 2015 WI#: 7210-00-06

MnDOT/WisDOT | Traffic Noise Analysis Report TRAFFIC NOISE ABATEMENT ANALYSIS
foliage year round). It is not reasonable to plant enough vegetation to achieve substantial noise level reductions. As such, vegetation is not a reasonable noise mitigation measure.
• Exclusive Land Use Designations: Buffer zones are undeveloped, open spaces adjacent to a highway corridor. Acquisition of property to serve as a buffer zone between the proposed roadway and adjacent lands is not feasible because the Highway 61 corridor in Minnesota is fully developed. See below for a discussion of land use planning and traffic noise.
• Acoustical Insulation of Houses: Acoustical insulation of individual residences is not reasonable. This noise abatement measure would not affect noise levels that approach or exceed Federal Noise Abatement Criteria or Minnesota State Noise Standards because these are intended for exterior uses only. Under 23 CFR 772.15(c), MnDOT policy and WisDOT policy, only public buildings such as schools and hospitals (Activity Category D, see Table 2) should be considered for acoustical insulation. These uses are not located within the vicinity of the project area.
Construction Noise The construction of the proposed project will result in temporary noise and vibration increases within the project area. The noise and vibration would be generated primarily from heavy equipment used in hauling materials and building the bridge and roadway improvements. Sensitive areas located close to the construction area may temporarily experience increased noise and vibration levels. The following have been identified as being potential construction noise and vibration sensitive sites that exist along the project corridor: residences.
MnDOT incorporates a number of provisions that are to be used on MnDOT projects to reduce the impacts of construction noise. This could include but is not limited to prohibiting construction work from occurring during nighttime hours, installation of mufflers on equipment, and requirements to receive the appropriate operation approvals from the appropriate local officials.
MN#: 2515-21 16 | June 2015 WI#: 7210-00-06

MnDOT/WisDOT | Traffic Noise Analysis Report CONCLUSIONS
Conclusions In general, construction of the Red Wing Bridge Project will result in both increases and decreases in traffic noise levels compared to existing conditions. In most locations traffic noise levels will increase due to the increase in traffic from the existing condition to the future condition. The reconfiguration of the entrance and exit geometry from the bridge will cause some areas in downtown Red Wing to have decreases in traffic noise levels as some of the traffic volume shifts from 3rd Street to other areas.
In the Minnesota portion of the study area, changes in daytime traffic noise levels are projected to range from -9.8 dBA to 6.7 dBA compared to existing conditions. Modeled noise levels are predicted to exceed State daytime L10 standards at 27 of the 92 modeled receptor locations and State daytime L50 standards at 10 of the 92 modeled receptors under the future Recommended Alternative. Modeled noise levels are predicted to exceed State nighttime L10 standards at 69 of the 92 modeled receptor locations and State nighttime L50 standards at 68 of the 92 modeled receptor locations under the future Recommended Alternative.
Cost effectiveness of noise barriers was calculated, Table 5 lists the barrier that was found to be feasible and reasonable. All of these barriers are proposed as part of the project. Final mitigation decisions will be subject to input from affected property owners and final design considerations.
Table 5: Considered noise barriers
Noise Barrier Location Length Height Barrier B Proposed‐ south of Highway 61, east of proposed ramp 1,290 20
MN#: 2515-21 17 | June 2015 WI#: 7210-00-06
MnDOT/WisDOT | Traffic Noise Analysis Report APPENDIX A
Appendix A
Figures
MN#: 2515-21 18 | June 2015 WI#: 7210-00-06

Figure 1Noise Analysis
Red Wing Bridge Project
LegendReceptorsMonitoring LocationsProposed Alignment
0 200100 Feet

Figure 2Noise Analysis
Red Wing Bridge Project
0 300150 Feet
LegendReceptorsMonitoring LocationsProposed Alignment

0 200100 Feet
Figure 3Noise Analysis
Red Wing Bridge Project
LegendReceptorsBenefited Receptors (>5 dBA reduction)
Monitoring Locations
Proposed AlignmentProposed Barrier B

MnDOT/WisDOT | Traffic Noise Analysis Report APPENDIX B
Appendix B
Noise Modeling Results
MN#: 2515-21 22 | June 2015 WI#: 7210-00-06
MnDOT/WisDOT | Traffic Noise Analysis Report APPENDIX B
Table 6 Red Wing Bridge Project Wisconsin Noise Model Results
Receptor Location
Distance From ROW
to Receptor (ft)
Number of Families or
People Typical of
this Receptor
Site
Sound Level Leq (dBA) Impact Evaluation
Address Noise Level
Criteria
Future Sound Level
(2042)
Existing Sound Level
(2010)
Difference in Future
and Existing Sound Levels
Difference in Future
Sound Levels and
Noise Level
Criteria
Impact1 or
No Impact
1 W Marina 50 650 825th Street, Hager City, WI 50 1 67 59.9 59.7 0.2 ‐7.1 No Impact 2 W Marina 100 650 825th Street, Hager City, WI 100 1 67 58.7 57.7 1.0 ‐8.3 No Impact 3 W Marina 150 650 825th Street, Hager City, WI 150 1 67 57.2 56.1 1.1 ‐9.8 No Impact 4 W Marina 200 650 825th Street, Hager City, WI 200 1 67 56.2 54.9 1.3 ‐10.8 No Impact 5 W Marina 250 650 825th Street, Hager City, WI 250 1 67 55.2 53.7 1.5 ‐11.8 No Impact 6 W Marina 300 650 825th Street, Hager City, WI 300 1 67 54.3 53.0 1.3 ‐12.7 No Impact 7 W Marina 350 650 825th Street, Hager City, WI 350 1 67 53.6 52.2 1.4 ‐13.4 No Impact 8 W Marina 400 650 825th Street, Hager City, WI 400 1 67 52.9 51.6 1.3 ‐14.1 No Impact 9 W Marina 450 650 825th Street, Hager City, WI 450 1 67 52.3 51.0 1.3 ‐14.7 No Impact 10 W Marina 500 650 825th Street, Hager City, WI 500 1 67 51.7 50.5 1.2 ‐15.3 No Impact 11 E Marina 50 N671 825th Street, Hager City, WI 50 1 67 59.4 65.9 ‐6.5 ‐7.6 No Impact 12 E Marina 100 N671 825th Street, Hager City, WI 100 1 67 58.8 61.4 ‐2.6 ‐8.2 No Impact 13 E Marina 150 N671 825th Street, Hager City, WI 150 1 67 57.4 58.4 ‐1.0 ‐9.6 No Impact 14 E Marina 200 N671 825th Street, Hager City, WI 200 1 67 56.3 56.5 ‐0.2 ‐10.7 No Impact 15 E Marina 250 N671 825th Street, Hager City, WI 250 1 67 55.3 55.3 0.0 ‐11.7 No Impact 16 E Marina 300 N671 825th Street, Hager City, WI 300 1 67 54.4 54.1 0.3 ‐12.6 No Impact 17 E Marina 350 N671 825th Street, Hager City, WI 350 1 67 53.7 53.3 0.4 ‐13.3 No Impact 18 E Marina 400 N671 825th Street, Hager City, WI 400 1 67 53.0 52.5 0.5 ‐14.0 No Impact 19 E Marina 450 N671 825th Street, Hager City, WI 450 1 67 52.3 51.9 0.4 ‐14.7 No Impact 20 E Marina 500 N671 825th Street, Hager City, WI 500 1 67 51.7 51.3 0.4 ‐15.3 No Impact
1 An impact occurs when the future sound levels exceed existing sound levels by 15 dB or more, or, future sound levels approach or exceed the Noise Level Criteria ("approach" is defined as 1 dB less that the Noise Level Criteria).
MN#: 2515-21 23 | June 2015 WI#: 7210-00-06

MnDOT/WisDOT | Traffic Noise Analysis Report APPENDIX B
Table 7 Red Wing Bridge Project Minnesota Noise Model Results: Daytime
Receptor ID Type
NAC: Noise Area
Classification Address
Modeled Existing (2010)
Modeled No Build (2042)
Difference between
Existing (2010) and No Build (2042)
Modeled Build
(2042)
Difference between
Existing (2010) and Build (2042)
L10 L50 L10 L50 L10 L50 L10 L50 L10 L50 State Daytime Noise Standards Residential NAC-1 65 60 65 60 -- -- 65 60 -- -- Commercial NAC-2 70 65 70 65 -- -- 70 65 -- -- Industrial NAC-3 80 75 80 75 -- -- 80 75 -- --
21 Commercial NAC‐2 302 Main Street, Red Wing, MN 67.8 58.6 69.4 60.7 1.6 2.1 70.6 62.4 2.8 3.8 22 Commercial NAC‐2 137 Main Street, Red Wing, MN 69.4 58.9 70.8 60.7 1.4 1.8 74.4 65.6 5.0 6.7 23 Commercial NAC‐2 211 Main Street, Red Wing, MN 67.4 57.5 68.7 59.3 1.3 1.8 71.8 63.6 4.4 6.1 24 Commercial NAC‐2 223 Main Street, Red Wing, MN 66.7 57.1 68.0 59.0 1.3 1.9 71.0 63.0 4.3 5.9 25 Commercial NAC‐2 201 Plum Street, Red Wing, MN 67.3 57.6 68.6 59.4 1.3 1.8 71.5 63.4 4.2 5.8 26 Commercial NAC‐2 301 Main Street, Red Wing, MN 69.6 60.4 71.2 62.5 1.6 2.1 71.7 63.3 2.1 2.9 27 Commercial NAC‐2 307 Main Street, Red Wing, MN 69.0 60.1 70.6 62.2 1.6 2.1 70.9 62.7 1.9 2.6 28 Commercial NAC‐2 315 Main Street, Red Wing, MN 68.8 59.9 70.4 62.1 1.6 2.2 70.6 62.4 1.8 2.5 29 Commercial NAC‐2 321 Main Street, Red Wing, MN 69.5 60.2 71.2 62.4 1.7 2.2 71.4 62.7 1.9 2.5 30 Commercial NAC‐2 323 Main Street, Red Wing, MN 69.5 60.0 71.1 62.1 1.6 2.1 71.3 62.4 1.8 2.4 31 Commercial NAC‐2 325 Main Street, Red Wing, MN 69.6 59.5 71.3 61.6 1.7 2.1 71.5 62.0 1.9 2.5 32 Commercial NAC‐2 219 Plum Street, Red Wing, MN 60.4 53.3 62.3 55.9 1.9 2.6 59.9 54.3 ‐0.5 1.0 33 Commercial NAC‐2 318 W 3rd Street, Red Wing, MN 60.4 52.2 62.8 53.4 2.4 1.2 61.4 51.4 1.0 ‐0.8 34 Commercial NAC‐2 320 W 3rd Street, Red Wing, MN 60.2 51.9 62.7 53.1 2.5 1.2 61.3 51.1 1.1 ‐0.8 35 Commercial NAC‐2 227 Bush Street, Red Wing, MN 59.7 50.7 62.1 52.0 2.4 1.3 60.7 50.0 1.0 ‐0.7 36 Industrial NAC‐3 301 Potter Street, Red Wing, MN 69.4 60.2 71.8 63.1 2.4 2.9 59.6 55.5 ‐9.8 ‐4.7 37 Commercial NAC‐2 219 W 3rd Street, Red Wing, MN 70.1 59.3 72.7 62.4 2.6 3.1 63.5 51.2 ‐6.6 ‐8.1 38 Commercial NAC‐2 308 Plum Street, Red Wing, MN 64.8 55.4 67.3 58.5 2.5 3.1 60.4 50.4 ‐4.4 ‐5.0 39 Commercial NAC‐2 303 W 3rd Street, Red Wing, MN 62.4 52.9 64.9 55.4 2.5 2.5 62.5 51.9 0.1 ‐1.0 40 Commercial NAC‐2 313 W 3rd Street, Red Wing, MN 61.7 52.0 64.3 54.6 2.6 2.6 62.4 51.7 0.7 ‐0.3 41 Commercial NAC‐2 313 W 3rd Street, Red Wing, MN 62.2 51.7 64.9 54.5 2.7 2.8 63.3 52.0 1.1 0.3 42 Commercial NAC‐2 327 W 3rd Street, Red Wing, MN 62.0 51.4 64.7 54.2 2.7 2.8 63.1 51.9 1.1 0.5 43 Commercial NAC‐2 301 Bush Street, Red Wing, MN 60.2 49.7 62.9 52.3 2.7 2.6 61.4 50.1 1.2 0.4 44 Commercial NAC‐2 Red Wing, MN 59.8 54.3 61.6 56.6 1.8 2.3 60.7 56.4 0.9 2.1 45 Commercial NAC‐2 321 Bluff Street, Red Wing, MN 62.0 55.2 63.2 57.0 1.2 1.8 take* take* take* take* 46 Residential NAC‐1 135 3rd Street, Red Wing, MN 62.7 55.8 63.9 57.5 1.2 1.7 take* take* take* take* 47 Residential NAC‐1 141 3rd Street, Red Wing, MN 63.4 56.3 64.6 58.0 1.2 1.7 take* take* take* take* 48 Residential NAC‐1 147 3rd Street, Red Wing, MN 64.3 57.0 65.4 58.6 1.1 1.6 68.4 61.9 4.1 4.9 49 Residential NAC‐1 153 3rd Street, Red Wing, MN 64.8 57.4 66.0 59.1 1.2 1.7 67.7 61.3 2.9 3.9
MN#: 2515-21 24 | June 2015 WI#: 7210-00-06

MnDOT/WisDOT | Traffic Noise Analysis Report APPENDIX B
Table 7 Red Wing Bridge Project Minnesota Noise Model Results: Daytime
Receptor ID Type
NAC: Noise Area
Classification Address
Modeled Existing (2010)
Modeled No Build (2042)
Difference between
Existing (2010) and No Build (2042)
Modeled Build
(2042)
Difference between
Existing (2010) and Build (2042)
L10 L50 L10 L50 L10 L50 L10 L50 L10 L50 State Daytime Noise Standards Residential NAC-1 65 60 65 60 -- -- 65 60 -- -- Commercial NAC-2 70 65 70 65 -- -- 70 65 -- -- Industrial NAC-3 80 75 80 75 -- -- 80 75 -- --
50 Residential NAC‐1 157 3rd Street, Red Wing, MN 65.8 58.2 67.0 59.8 1.2 1.6 68.0 60.9 2.2 2.7 51 Residential NAC‐1 304 Sanderson Street, Red Wing, MN 66.9 59.0 68.1 60.6 1.2 1.6 69.0 61.4 2.1 2.4 52 Residential NAC‐1 308 Sanderson Street, Red Wing, MN 65.2 57.8 66.4 59.4 1.2 1.6 67.1 60.1 1.9 2.3 53 Residential NAC‐1 310 Sanderson Street, Red Wing, MN 62.8 55.9 64.0 57.5 1.2 1.6 64.6 58.2 1.8 2.3 54 Residential NAC‐1 318 Sanderson Street, Red Wing, MN 61.2 54.5 62.3 56.1 1.1 1.6 63.0 57.1 1.8 2.6 55 Residential NAC‐1 120 4th Street, Red Wing, MN 59.6 53.5 60.8 55.2 1.2 1.7 64.5 58.8 4.9 5.3 56 Residential NAC‐1 124 4th Street, Red Wing, MN 59.5 53.4 60.7 55.1 1.2 1.7 63.1 58.0 3.6 4.6 57 Residential NAC‐1 130 4th Street, Red Wing, MN 59.6 53.5 60.7 55.1 1.1 1.6 62.5 57.5 2.9 4.0 58 Residential NAC‐1 134 4th Street, Red Wing, MN 60.0 53.7 61.1 55.4 1.1 1.7 62.3 57.1 2.3 3.4 59 Residential NAC‐1 142 4th Street, Red Wing, MN 60.0 53.7 61.2 55.3 1.2 1.6 62.0 56.6 2.0 2.9 60 Residential NAC‐1 150 4th Street, Red Wing, MN 60.5 54.0 61.6 55.6 1.1 1.6 62.1 56.4 1.6 2.4 61 Residential NAC‐1 309 Sanderson Street, Red Wing, MN 65.8 58.2 66.9 59.8 1.1 1.6 67.5 60.3 1.7 2.1 62 Residential NAC‐1 315 Sanderson Street, Red Wing, MN 62.8 55.7 64.0 57.3 1.2 1.6 64.4 57.8 1.6 2.1 63 Residential NAC‐1 202 4th Street, Red Wing, MN 61.2 54.5 62.4 56.1 1.2 1.6 62.8 56.7 1.6 2.2 64 Residential NAC‐1 214 4th Street, Red Wing, MN 61.7 54.8 62.8 56.5 1.1 1.7 63.1 56.8 1.4 2.0 65 Residential NAC‐1 220 4th Street, Red Wing, MN 62.9 55.8 64.1 57.4 1.2 1.6 64.3 57.6 1.4 1.8 66 Residential NAC‐1 228 4th Street, Red Wing, MN 62.7 55.5 63.8 57.1 1.1 1.6 64.0 57.3 1.3 1.8 67 Residential NAC‐1 232 4th Street, Red Wing, MN 63.9 56.4 65.1 58.0 1.2 1.6 65.3 58.2 1.4 1.8 68 Residential NAC‐1 236 4th Street, Red Wing, MN 64.4 56.7 65.5 58.3 1.1 1.6 65.7 58.5 1.3 1.8 69 Residential NAC‐1 250 4th Street, Red Wing, MN 65.7 57.5 66.9 59.1 1.2 1.6 67.0 59.3 1.3 1.8 70 Residential NAC‐1 121 4th Street, Red Wing, MN 57.2 51.7 58.3 53.4 1.1 1.7 59.8 55.4 2.6 3.7 71 Residential NAC‐1 125 4th Street, Red Wing, MN 57.5 51.9 58.6 53.6 1.1 1.7 59.8 55.3 2.3 3.4 72 Residential NAC‐1 133 4th Street, Red Wing, MN 57.8 52.1 58.9 53.7 1.1 1.6 59.8 55.1 2.0 3.0 73 Residential NAC‐1 137 4th Street, Red Wing, MN 58.0 52.3 59.1 53.9 1.1 1.6 59.8 55.0 1.8 2.7 74 Residential NAC‐1 141 4th Street, Red Wing, MN 58.3 52.5 59.4 54.1 1.1 1.6 60.0 55.0 1.7 2.5 75 Residential NAC‐1 147 4th Street, Red Wing, MN 58.6 52.7 59.7 54.3 1.1 1.6 60.2 55.1 1.6 2.4 76 Residential NAC‐1 207 4th Street, Red Wing, MN 59.2 53.1 60.3 54.7 1.1 1.6 60.7 55.2 1.5 2.1 77 Residential NAC‐1 213 4th Street, Red Wing, MN 59.5 53.3 60.6 54.9 1.1 1.6 60.9 55.3 1.4 2.0 78 Residential NAC‐1 215 4th Street, Red Wing, MN 59.7 53.5 60.8 55.1 1.1 1.6 61.1 55.4 1.4 1.9
MN#: 2515-21 25 | June 2015 WI#: 7210-00-06

MnDOT/WisDOT | Traffic Noise Analysis Report APPENDIX B
Table 7 Red Wing Bridge Project Minnesota Noise Model Results: Daytime
Receptor ID Type
NAC: Noise Area
Classification Address
Modeled Existing (2010)
Modeled No Build (2042)
Difference between
Existing (2010) and No Build (2042)
Modeled Build
(2042)
Difference between
Existing (2010) and Build (2042)
L10 L50 L10 L50 L10 L50 L10 L50 L10 L50 State Daytime Noise Standards Residential NAC-1 65 60 65 60 -- -- 65 60 -- -- Commercial NAC-2 70 65 70 65 -- -- 70 65 -- -- Industrial NAC-3 80 75 80 75 -- -- 80 75 -- --
79 Residential NAC‐1 223 4th Street, Red Wing, MN 60.1 53.7 61.2 55.3 1.1 1.6 61.4 55.6 1.3 1.9 80 Residential NAC‐1 225 4th Street, Red Wing, MN 60.3 53.9 61.4 55.4 1.1 1.5 61.6 55.7 1.3 1.8 81 Residential NAC‐1 227 4th Street, Red Wing, MN 60.5 54.0 61.6 55.6 1.1 1.6 61.8 55.8 1.3 1.8 82 Residential NAC‐1 233 4th Street, Red Wing, MN 60.8 54.2 61.9 55.8 1.1 1.6 62.1 56.0 1.3 1.8 83 Residential NAC‐1 239 4th Street, Red Wing, MN 61.2 54.4 62.4 56.0 1.2 1.6 62.5 56.2 1.3 1.8 84 Residential NAC‐1 243 4th Street, Red Wing, MN 61.6 54.6 62.7 56.2 1.1 1.6 62.8 56.4 1.2 1.8 85 Residential NAC‐1 247 4th Street, Red Wing, MN 61.9 54.8 63.1 56.4 1.2 1.6 63.2 56.6 1.3 1.8 86 Residential NAC‐1 255 4th Street, Red Wing, MN 62.8 55.4 64.0 57.0 1.2 1.6 64.0 57.1 1.2 1.7 87 Residential NAC‐1 263 4th Street, Red Wing, MN 63.6 55.8 64.8 57.5 1.2 1.7 64.8 57.6 1.2 1.8 88 Residential NAC‐1 273 4th Street, Red Wing, MN 64.7 56.5 66.0 58.2 1.3 1.7 66.0 58.3 1.3 1.8 89 Residential NAC‐1 301 4th Street, Red Wing, MN 65.2 56.8 66.4 58.4 1.2 1.6 66.4 58.5 1.2 1.7 90 Residential NAC‐1 309 4th Street, Red Wing, MN 66.3 57.5 67.6 59.2 1.3 1.7 67.6 59.3 1.3 1.8 91 Residential NAC‐1 238 5th Street, Red Wing, MN 57.5 51.8 58.5 53.4 1.0 1.6 58.7 53.6 1.2 1.8 92 Residential NAC‐1 242 5th Street, Red Wing, MN 58.2 52.3 59.3 53.9 1.1 1.6 59.4 54.1 1.2 1.8 93 Residential NAC‐1 244 5th Street, Red Wing, MN 57.9 52.2 59.0 53.7 1.1 1.5 59.1 53.9 1.2 1.7 94 Residential NAC‐1 248 5th Street, Red Wing, MN 58.0 52.2 59.1 53.7 1.1 1.5 59.2 53.9 1.2 1.7 95 Residential NAC‐1 252 5th Street, Red Wing, MN 58.3 52.3 59.4 53.9 1.1 1.6 59.5 54.1 1.2 1.8 96 Residential NAC‐1 258 5th Street, Red Wing, MN 60.2 53.5 61.3 55.1 1.1 1.6 61.4 55.2 1.2 1.7 97 Residential NAC‐1 256 5th Street, Red Wing, MN 58.4 52.4 59.5 54.0 1.1 1.6 59.6 54.1 1.2 1.7 98 Residential NAC‐1 410 Green Street, Red Wing, MN 62.1 54.7 63.3 56.3 1.2 1.6 63.3 56.4 1.2 1.7 99 Residential NAC‐1 414 Green Street, Red Wing, MN 60.8 53.8 62.0 55.4 1.2 1.6 62.1 55.6 1.3 1.8
100 Residential NAC‐1 264 5th Street, Red Wing, MN 58.8 52.7 59.9 54.2 1.1 1.5 59.9 54.3 1.1 1.6 101 Residential NAC‐1 268 5th Street, Red Wing, MN 59.1 52.8 60.2 54.4 1.1 1.6 60.2 54.5 1.1 1.7 102 Residential NAC‐1 272 5th Street, Red Wing, MN 59.2 52.9 60.3 54.5 1.1 1.6 60.3 54.6 1.1 1.7 103 Residential NAC‐1 407 Green Street, Red Wing, MN 63.6 55.6 64.8 57.2 1.2 1.6 64.9 57.3 1.3 1.7 104 Residential NAC‐1 413 Green Street, Red Wing, MN 61.9 54.5 63.1 56.1 1.2 1.6 63.2 56.2 1.3 1.7 105 Residential NAC‐1 417 Green Street, Red Wing, MN 60.5 53.5 61.7 55.1 1.2 1.6 61.7 55.2 1.2 1.7 106 Residential NAC‐1 304 5th Street, Red Wing, MN 59.4 53.0 60.5 54.5 1.1 1.5 60.6 54.6 1.2 1.6 107 Residential NAC‐1 312 5th Street, Red Wing, MN 59.7 53.0 60.8 54.6 1.1 1.6 60.8 54.7 1.1 1.7
MN#: 2515-21 26 | June 2015 WI#: 7210-00-06

MnDOT/WisDOT | Traffic Noise Analysis Report APPENDIX B
Table 7 Red Wing Bridge Project Minnesota Noise Model Results: Daytime
Receptor ID Type
NAC: Noise Area
Classification Address
Modeled Existing (2010)
Modeled No Build (2042)
Difference between
Existing (2010) and No Build (2042)
Modeled Build
(2042)
Difference between
Existing (2010) and Build (2042)
L10 L50 L10 L50 L10 L50 L10 L50 L10 L50 State Daytime Noise Standards Residential NAC-1 65 60 65 60 -- -- 65 60 -- -- Commercial NAC-2 70 65 70 65 -- -- 70 65 -- -- Industrial NAC-3 80 75 80 75 -- -- 80 75 -- --
108 Residential NAC‐1 407 Arkin Street, Red Wing, MN 64.7 56.1 65.9 57.8 1.2 1.7 65.9 57.8 1.2 1.7 109 Residential NAC‐1 415 Arkin Street, Red Wing, MN 62.6 54.5 63.8 56.1 1.2 1.6 63.8 56.2 1.2 1.7 110 Residential NAC‐1 419 Arkin Street, Red Wing, MN 61.1 53.7 62.2 55.3 1.1 1.6 62.3 55.4 1.2 1.7 111 Residential NAC‐1 326 5th Street, Red Wing, MN 60.4 53.3 61.5 54.9 1.1 1.6 61.6 55.0 1.2 1.7 112 Residential NAC‐1 332 5th Street, Red Wing, MN 61.8 54.0 63.0 55.6 1.2 1.6 63.1 55.7 1.3 1.7
Bold numbers are above state standards Underline refers to L10 values approaching/exceeding Federal noise abatement criteria * Taken due to construction
Table 8 Red Wing Bridge Project Minnesota Noise Model Results: Nighttime
Receptor ID Type
NAC: Noise Area
Classification Address
Modeled Existing (2010)
Modeled No Build (2042)
Difference between
Existing (2010) and No Build (2042)
Modeled Build
(2042)
Difference between
Existing (2010) and Build (2042)
L10 L50 L10 L50 L10 L50 L10 L50 L10 L50 State Nighttime Noise Standards Residential NAC-1 55 50 55 50 -- -- 55 50 -- -- Commercial NAC-2 70 65 70 65 -- -- 70 65 -- -- Industrial NAC-3 80 75 80 75 -- -- 80 75 -- --
21 Commercial NAC‐2 302 Main Street, Red Wing, MN 66.8 57.2 67.4 57.9 0.6 0.7 68.7 59.8 1.9 2.6 22 Commercial NAC‐2 137 Main Street, Red Wing, MN 68.9 57.8 68.2 57.2 ‐0.7 ‐0.6 71.1 60.9 2.2 3.1 23 Commercial NAC‐2 211 Main Street, Red Wing, MN 67.1 56.6 66.2 55.9 ‐0.9 ‐0.7 68.9 59.4 1.8 2.8 24 Commercial NAC‐2 223 Main Street, Red Wing, MN 66.4 56.2 65.6 55.6 ‐0.8 ‐0.6 68.2 59.0 1.8 2.8 25 Commercial NAC‐2 201 Plum Street, Red Wing, MN 66.9 56.6 66.1 56.0 ‐0.8 ‐0.6 68.7 59.3 1.8 2.7 26 Commercial NAC‐2 301 Main Street, Red Wing, MN 68.5 58.4 68.5 58.6 0.0 0.2 68.9 59.3 0.4 0.9 27 Commercial NAC‐2 307 Main Street, Red Wing, MN 67.8 58.1 67.9 58.4 0.1 0.3 68.2 58.7 0.4 0.6 28 Commercial NAC‐2 315 Main Street, Red Wing, MN 67.7 57.9 67.8 58.2 0.1 0.3 67.9 58.4 0.2 0.5 29 Commercial NAC‐2 321 Main Street, Red Wing, MN 68.3 58.2 68.4 58.5 0.1 0.3 68.5 58.6 0.2 0.4 30 Commercial NAC‐2 323 Main Street, Red Wing, MN 68.3 57.9 68.3 58.2 0.0 0.3 68.4 58.3 0.1 0.4 31 Commercial NAC‐2 325 Main Street, Red Wing, MN 68.3 57.4 68.4 57.6 0.1 0.2 68.4 57.7 0.1 0.3
MN#: 2515-21 27 | June 2015 WI#: 7210-00-06

MnDOT/WisDOT | Traffic Noise Analysis Report APPENDIX B
Table 8 Red Wing Bridge Project Minnesota Noise Model Results: Nighttime
Receptor ID Type
NAC: Noise Area
Classification Address
Modeled Existing (2010)
Modeled No Build (2042)
Difference between
Existing (2010) and No Build (2042)
Modeled Build
(2042)
Difference between
Existing (2010) and Build (2042)
L10 L50 L10 L50 L10 L50 L10 L50 L10 L50 State Nighttime Noise Standards Residential NAC-1 55 50 55 50 -- -- 55 50 -- -- Commercial NAC-2 70 65 70 65 -- -- 70 65 -- -- Industrial NAC-3 80 75 80 75 -- -- 80 75 -- --
32 Commercial NAC‐2 219 Plum Street, Red Wing, MN 59.0 51.2 60.3 52.7 1.3 1.5 57.5 50.8 ‐1.5 ‐0.4 33 Commercial NAC‐2 318 W 3rd Street, Red Wing, MN 57.3 46.0 59.0 48.3 1.7 2.3 57.3 45.9 0.0 ‐0.1 34 Commercial NAC‐2 320 W 3rd Street, Red Wing, MN 57.1 45.7 58.8 48.0 1.7 2.3 57.2 45.6 0.1 ‐0.1 35 Commercial NAC‐2 227 Bush Street, Red Wing, MN 56.3 44.4 58.1 46.8 1.8 2.4 56.5 44.4 0.2 0.0 36 Industrial NAC‐3 301 Potter Street, Red Wing, MN 66.8 56.4 68.9 59.1 2.1 2.7 57.8 52.6 ‐9.0 ‐3.8 37 Commercial NAC‐2 219 W 3rd Street, Red Wing, MN 67.6 55.6 69.5 58.1 1.9 2.5 60.4 47.4 ‐7.2 ‐8.2 38 Commercial NAC‐2 308 Plum Street, Red Wing, MN 62.6 52.0 64.3 54.3 1.7 2.3 57.4 46.4 ‐5.2 ‐5.6 39 Commercial NAC‐2 303 W 3rd Street, Red Wing, MN 58.8 47.3 60.7 49.5 1.9 2.2 58.0 45.7 ‐0.8 ‐1.6 40 Commercial NAC‐2 313 W 3rd Street, Red Wing, MN 57.9 46.1 59.8 48.3 1.9 2.2 57.8 45.5 ‐0.1 ‐0.6 41 Commercial NAC‐2 313 W 3rd Street, Red Wing, MN 57.8 45.2 59.9 47.6 2.1 2.4 58.3 45.5 0.5 0.3 42 Commercial NAC‐2 327 W 3rd Street, Red Wing, MN 57.5 44.9 59.6 47.3 2.1 2.4 58.2 45.3 0.7 0.4 43 Commercial NAC‐2 301 Bush Street, Red Wing, MN 55.9 43.3 57.9 45.6 2.0 2.3 56.5 43.7 0.6 0.4 44 Commercial NAC‐2 Red Wing, MN 58.2 51.7 59.7 53.6 1.5 1.9 58.9 53.6 0.7 1.9 45 Commercial NAC‐2 321 Bluff Street, Red Wing, MN 60.7 52.7 61.0 53.5 0.3 0.8 take* take* take* take* 46 Residential NAC‐1 135 3rd Street, Red Wing, MN 61.5 53.3 61.6 53.9 0.1 0.6 take* take* take* take* 47 Residential NAC‐1 141 3rd Street, Red Wing, MN 62.1 53.8 62.2 54.4 0.1 0.6 take* take* take* take* 48 Residential NAC‐1 147 3rd Street, Red Wing, MN 63.0 54.5 63.0 55.0 0.0 0.5 66.3 58.8 3.3 4.3 49 Residential NAC‐1 153 3rd Street, Red Wing, MN 63.5 54.9 63.5 55.4 0.0 0.5 65.5 57.9 2.0 3.0 50 Residential NAC‐1 157 3rd Street, Red Wing, MN 64.4 55.6 64.5 56.1 0.1 0.5 65.6 57.2 1.2 1.6 51 Residential NAC‐1 304 Sanderson Street, Red Wing, MN 65.5 56.4 65.6 56.8 0.1 0.4 66.4 57.5 0.9 1.1 52 Residential NAC‐1 308 Sanderson Street, Red Wing, MN 63.9 55.2 63.9 55.7 0.0 0.5 64.6 56.3 0.7 1.1 53 Residential NAC‐1 310 Sanderson Street, Red Wing, MN 61.6 53.5 61.6 53.9 0.0 0.4 62.3 54.8 0.7 1.3 54 Residential NAC‐1 318 Sanderson Street, Red Wing, MN 60.1 52.2 60.1 52.7 0.0 0.5 60.9 53.7 0.8 1.5 55 Residential NAC‐1 120 4th Street, Red Wing, MN 58.4 51.1 58.6 51.8 0.2 0.7 62.6 55.8 4.2 4.7 56 Residential NAC‐1 124 4th Street, Red Wing, MN 58.4 51.1 58.5 51.7 0.1 0.6 61.2 54.9 2.8 3.8 57 Residential NAC‐1 130 4th Street, Red Wing, MN 58.4 51.1 58.6 51.7 0.2 0.6 60.6 54.5 2.2 3.4 58 Residential NAC‐1 134 4th Street, Red Wing, MN 58.8 51.4 58.9 51.9 0.1 0.5 60.3 54.0 1.5 2.6 59 Residential NAC‐1 142 4th Street, Red Wing, MN 58.9 51.4 59.0 51.9 0.1 0.5 59.9 53.3 1.0 1.9 60 Residential NAC‐1 150 4th Street, Red Wing, MN 59.3 51.7 59.4 52.2 0.1 0.5 60.0 53.1 0.7 1.4
MN#: 2515-21 28 | June 2015 WI#: 7210-00-06

MnDOT/WisDOT | Traffic Noise Analysis Report APPENDIX B
Table 8 Red Wing Bridge Project Minnesota Noise Model Results: Nighttime
Receptor ID Type
NAC: Noise Area
Classification Address
Modeled Existing (2010)
Modeled No Build (2042)
Difference between
Existing (2010) and No Build (2042)
Modeled Build
(2042)
Difference between
Existing (2010) and Build (2042)
L10 L50 L10 L50 L10 L50 L10 L50 L10 L50 State Nighttime Noise Standards Residential NAC-1 55 50 55 50 -- -- 55 50 -- -- Commercial NAC-2 70 65 70 65 -- -- 70 65 -- -- Industrial NAC-3 80 75 80 75 -- -- 80 75 -- --
61 Residential NAC‐1 309 Sanderson Street, Red Wing, MN 64.4 55.6 64.4 56.0 0.0 0.4 65.0 56.5 0.6 0.9 62 Residential NAC‐1 315 Sanderson Street, Red Wing, MN 61.7 53.4 61.7 53.8 0.0 0.4 62.1 54.2 0.4 0.8 63 Residential NAC‐1 202 4th Street, Red Wing, MN 60.1 52.3 60.1 52.7 0.0 0.4 60.6 53.3 0.5 1.0 64 Residential NAC‐1 214 4th Street, Red Wing, MN 60.6 52.6 60.5 52.9 ‐0.1 0.3 60.9 53.4 0.3 0.8 65 Residential NAC‐1 220 4th Street, Red Wing, MN 61.8 53.5 61.7 53.8 ‐0.1 0.3 62.0 54.0 0.2 0.5 66 Residential NAC‐1 228 4th Street, Red Wing, MN 61.6 53.3 61.5 53.6 ‐0.1 0.3 61.7 53.8 0.1 0.5 67 Residential NAC‐1 232 4th Street, Red Wing, MN 62.8 54.2 62.7 54.4 ‐0.1 0.2 62.9 54.7 0.1 0.5 68 Residential NAC‐1 236 4th Street, Red Wing, MN 63.2 54.5 63.1 54.7 ‐0.1 0.2 63.3 54.9 0.1 0.4 69 Residential NAC‐1 250 4th Street, Red Wing, MN 64.6 55.4 64.4 55.5 ‐0.2 0.1 64.6 55.7 0.0 0.3 70 Residential NAC‐1 121 4th Street, Red Wing, MN 56.1 49.4 56.3 50.1 0.2 0.7 57.9 52.4 1.8 3.0 71 Residential NAC‐1 125 4th Street, Red Wing, MN 56.4 49.6 56.6 50.3 0.2 0.7 57.9 52.3 1.5 2.7 72 Residential NAC‐1 133 4th Street, Red Wing, MN 56.7 49.8 56.8 50.4 0.1 0.6 57.9 52.1 1.2 2.3 73 Residential NAC‐1 137 4th Street, Red Wing, MN 56.9 50.0 57.0 50.6 0.1 0.6 57.9 51.9 1.0 1.9 74 Residential NAC‐1 141 4th Street, Red Wing, MN 57.2 50.2 57.3 50.7 0.1 0.5 58.0 51.8 0.8 1.6 75 Residential NAC‐1 147 4th Street, Red Wing, MN 57.5 50.4 57.6 50.9 0.1 0.5 58.1 51.8 0.6 1.4 76 Residential NAC‐1 207 4th Street, Red Wing, MN 58.1 50.8 58.2 51.3 0.1 0.5 58.6 51.9 0.5 1.1 77 Residential NAC‐1 213 4th Street, Red Wing, MN 58.4 51.0 58.4 51.5 0.0 0.5 58.7 51.9 0.3 0.9 78 Residential NAC‐1 215 4th Street, Red Wing, MN 58.6 51.2 58.7 51.6 0.1 0.4 58.9 52.0 0.3 0.8 79 Residential NAC‐1 223 4th Street, Red Wing, MN 58.9 51.5 59.0 51.9 0.1 0.4 59.2 52.2 0.3 0.7 80 Residential NAC‐1 225 4th Street, Red Wing, MN 59.2 51.6 59.2 52.0 0.0 0.4 59.4 52.3 0.2 0.7 81 Residential NAC‐1 227 4th Street, Red Wing, MN 59.4 51.8 59.4 52.1 0.0 0.3 59.6 52.4 0.2 0.6 82 Residential NAC‐1 233 4th Street, Red Wing, MN 59.7 52.0 59.7 52.3 0.0 0.3 59.9 52.6 0.2 0.6 83 Residential NAC‐1 239 4th Street, Red Wing, MN 60.2 52.3 60.1 52.6 ‐0.1 0.3 60.3 52.8 0.1 0.5 84 Residential NAC‐1 243 4th Street, Red Wing, MN 60.5 52.5 60.4 52.8 ‐0.1 0.3 60.6 52.9 0.1 0.4 85 Residential NAC‐1 247 4th Street, Red Wing, MN 60.9 52.7 60.8 53.0 ‐0.1 0.3 60.9 53.1 0.0 0.4 86 Residential NAC‐1 255 4th Street, Red Wing, MN 61.8 53.3 61.7 53.5 ‐0.1 0.2 61.8 53.7 0.0 0.4 87 Residential NAC‐1 263 4th Street, Red Wing, MN 62.6 53.9 62.4 54.0 ‐0.2 0.1 62.5 54.1 ‐0.1 0.2 88 Residential NAC‐1 273 4th Street, Red Wing, MN 63.8 54.7 63.6 54.7 ‐0.2 0.0 63.7 54.8 ‐0.1 0.1 89 Residential NAC‐1 301 4th Street, Red Wing, MN 64.2 55.0 64.0 55.0 ‐0.2 0.0 64.1 55.1 ‐0.1 0.1
MN#: 2515-21 29 | June 2015 WI#: 7210-00-06

MnDOT/WisDOT | Traffic Noise Analysis Report APPENDIX B
Table 8 Red Wing Bridge Project Minnesota Noise Model Results: Nighttime
Receptor ID Type
NAC: Noise Area
Classification Address
Modeled Existing (2010)
Modeled No Build (2042)
Difference between
Existing (2010) and No Build (2042)
Modeled Build
(2042)
Difference between
Existing (2010) and Build (2042)
L10 L50 L10 L50 L10 L50 L10 L50 L10 L50 State Nighttime Noise Standards Residential NAC-1 55 50 55 50 -- -- 55 50 -- -- Commercial NAC-2 70 65 70 65 -- -- 70 65 -- -- Industrial NAC-3 80 75 80 75 -- -- 80 75 -- --
90 Residential NAC‐1 309 4th Street, Red Wing, MN 65.5 55.8 65.2 55.7 ‐0.3 ‐0.1 65.2 55.8 ‐0.3 0.0 91 Residential NAC‐1 238 5th Street, Red Wing, MN 56.4 49.6 56.4 50.0 0.0 0.4 56.6 50.3 0.2 0.7 92 Residential NAC‐1 242 5th Street, Red Wing, MN 57.1 50.1 57.1 50.5 0.0 0.4 57.3 50.7 0.2 0.6 93 Residential NAC‐1 244 5th Street, Red Wing, MN 56.9 49.9 56.9 50.3 0.0 0.4 57.0 50.5 0.1 0.6 94 Residential NAC‐1 248 5th Street, Red Wing, MN 56.9 49.9 56.9 50.3 0.0 0.4 57.1 50.5 0.2 0.6 95 Residential NAC‐1 252 5th Street, Red Wing, MN 57.2 50.1 57.2 50.5 0.0 0.4 57.3 50.7 0.1 0.6 96 Residential NAC‐1 258 5th Street, Red Wing, MN 59.2 51.5 59.1 51.7 ‐0.1 0.2 59.2 51.8 0.0 0.3 97 Residential NAC‐1 256 5th Street, Red Wing, MN 57.3 50.2 57.3 50.6 0.0 0.4 57.5 50.8 0.2 0.6 98 Residential NAC‐1 410 Green Street, Red Wing, MN 61.1 52.8 61.0 52.9 ‐0.1 0.1 61.1 53.0 0.0 0.2 99 Residential NAC‐1 414 Green Street, Red Wing, MN 59.8 51.9 59.7 52.0 ‐0.1 0.1 59.8 52.2 0.0 0.3
100 Residential NAC‐1 264 5th Street, Red Wing, MN 57.7 50.5 57.7 50.8 0.0 0.3 57.8 51.0 0.1 0.5 101 Residential NAC‐1 268 5th Street, Red Wing, MN 58.0 50.7 58.0 51.0 0.0 0.3 58.1 51.1 0.1 0.4 102 Residential NAC‐1 272 5th Street, Red Wing, MN 58.1 50.8 58.1 51.1 0.0 0.3 58.2 51.2 0.1 0.4 103 Residential NAC‐1 407 Green Street, Red Wing, MN 62.7 53.8 62.4 53.7 ‐0.3 ‐0.1 62.5 53.9 ‐0.2 0.1 104 Residential NAC‐1 413 Green Street, Red Wing, MN 61.0 52.6 60.8 52.7 ‐0.2 0.1 60.9 52.8 ‐0.1 0.2 105 Residential NAC‐1 417 Green Street, Red Wing, MN 59.6 51.6 59.4 51.7 ‐0.2 0.1 59.5 51.8 ‐0.1 0.2 106 Residential NAC‐1 304 5th Street, Red Wing, MN 58.4 50.9 58.3 51.1 ‐0.1 0.2 58.4 51.2 0.0 0.3 107 Residential NAC‐1 312 5th Street, Red Wing, MN 58.7 51.0 58.6 51.2 ‐0.1 0.2 58.7 51.3 0.0 0.3 108 Residential NAC‐1 407 Arkin Street, Red Wing, MN 63.9 54.5 63.5 54.3 ‐0.4 ‐0.2 63.5 54.4 ‐0.4 ‐0.1 109 Residential NAC‐1 415 Arkin Street, Red Wing, MN 61.9 52.9 61.4 52.7 ‐0.5 ‐0.2 61.5 52.8 ‐0.4 ‐0.1 110 Residential NAC‐1 419 Arkin Street, Red Wing, MN 60.2 51.9 60.0 51.9 ‐0.2 0.0 60.0 52.0 ‐0.2 0.1 111 Residential NAC‐1 326 5th Street, Red Wing, MN 59.5 51.4 59.3 51.5 ‐0.2 0.1 59.3 51.6 ‐0.2 0.2 112 Residential NAC‐1 332 5th Street, Red Wing, MN 61.1 52.4 60.7 52.2 ‐0.4 ‐0.2 60.8 52.3 ‐0.3 ‐0.1
Bold numbers are above state standards Underline refers to L10 values approaching/exceeding Federal noise abatement criteria * Taken due to construction
MN#: 2515-21 30 | June 2015 WI#: 7210-00-06

MnDOT/WisDOT | Traffic Noise Analysis Report APPENDIX C
Appendix C Noise Barrier Cost Effectiveness Results
MN#: 2515-21 31 | June 2015 WI#: 7210-00-06

MnDOT/WisDOT | Traffic Noise Analysis Report APPENDIX C
NOISE BARRIER COST‐EFFECTIVENESS RESULTS LIST OF TABLES
• TABLE 9 Noise Mitigation Cost Effectiveness Results (Daytime) Modeled Barrier B (20-foot) ...............................................................................33 • TABLE 10 Noise Mitigation Cost Effectiveness Results (Nighttime) Modeled Barrier B (20-foot) ..........................................................................36
MN#: 2515-21 32 | June 2015 WI#: 7210-00-06

MnDOT/WisDOT | Traffic Noise Analysis Report APPENDIX C
Table 9: Noise Mitigation Cost Effectiveness Results (Daytime) Modeled Barrier B (20-foot)
Receptors Type NAC Address
Daytime L10 Noise (dBA) Reduction
(in dBA)
With Noise
Barrier
Number
of
Receptors
Number
of
Benefited
Receptors1
Number
Meeting
Design
Goal2
Length
of
Barrier
(feet)
Barrier
Area
(ft2)3
Total
Cost
of
Barrier
$20/ft2
Cost/
Benefited
Receptor
Build Year
2042
(No
Barrier)
Build Year
2042
(with
Barrier)
20-foot tall modeled Barrier B
1,290 25,016 $500,320 $11,635
48 Residential NAC‐1 147 3rd Street, Red Wing, MN 68.4 68.0 0.4 1 0 0
49 Residential NAC‐1 153 3rd Street, Red Wing, MN 67.7 67.1 0.6 1 0 0
50 Residential NAC‐1 157 3rd Street, Red Wing, MN 68.0 66.1 1.9 1 0 0
51 Residential NAC‐1 304 Sanderson Street, Red Wing, MN 69.0 64.1 4.9 1 1 0
52 Residential NAC‐1 308 Sanderson Street, Red Wing, MN 67.1 62.0 5.1 1 1 0
53 Residential NAC‐1 310 Sanderson Street, Red Wing, MN 64.6 61.2 3.4 1 0 0
54 Residential NAC‐1 318 Sanderson Street, Red Wing, MN 63.0 60.0 3.0 1 0 0
55 Residential NAC‐1 120 4th Street, Red Wing, MN 64.5 64.1 0.4 1 0 0
56 Residential NAC‐1 124 4th Street, Red Wing, MN 63.1 62.4 0.7 1 0 0
57 Residential NAC‐1 130 4th Street, Red Wing, MN 62.5 61.6 0.9 1 0 0
58 Residential NAC‐1 134 4th Street, Red Wing, MN 62.3 60.8 1.5 1 0 0
59 Residential NAC‐1 142 4th Street, Red Wing, MN 62.0 59.7 2.3 1 0 0
60 Residential NAC‐1 150 4th Street, Red Wing, MN 62.1 58.5 3.6 1 0 0
61 Residential NAC‐1 309 Sanderson Street, Red Wing, MN 67.5 59.4 8.1 1 1 1
62 Residential NAC‐1 315 Sanderson Street, Red Wing, MN 64.4 58.0 6.4 1 1 0
63 Residential NAC‐1 202 4th Street, Red Wing, MN 62.8 57.7 5.1 1 1 0
64 Residential NAC‐1 214 4th Street, Red Wing, MN 63.1 56.7 6.4 1 1 0
65 Residential NAC‐1 220 4th Street, Red Wing, MN 64.3 55.9 8.4 1 1 1
66 Residential NAC‐1 228 4th Street, Red Wing, MN 64.0 55.3 8.7 1 1 1
67 Residential NAC‐1 232 4th Street, Red Wing, MN 65.3 55.5 9.8 1 1 1
68 Residential NAC‐1 236 4th Street, Red Wing, MN 65.7 55.6 10.1 1 1 1
69 Residential NAC‐1 250 4th Street, Red Wing, MN 67.0 55.9 11.1 1 1 1
70 Residential NAC‐1 121 4th Street, Red Wing, MN 59.8 58.8 1.0 1 0 0
71 Residential NAC‐1 125 4th Street, Red Wing, MN 59.8 58.5 1.3 1 0 0
MN#: 2515-21 33 | June 2015 WI#: 7210-00-06

MnDOT/WisDOT | Traffic Noise Analysis Report APPENDIX C
Table 9: Noise Mitigation Cost Effectiveness Results (Daytime) Modeled Barrier B (20-foot)
Receptors Type NAC Address
Daytime L10 Noise (dBA) Reduction
(in dBA)
With Noise
Barrier
Number
of
Receptors
Number
of
Benefited
Receptors1
Number
Meeting
Design
Goal2
Length
of
Barrier
(feet)
Barrier
Area
(ft2)3
Total
Cost
of
Barrier
$20/ft2
Cost/
Benefited
Receptor
Build Year
2042
(No
Barrier)
Build Year
2042
(with
Barrier)
72 Residential NAC‐1 133 4th Street, Red Wing, MN 59.8 58.0 1.8 1 0 0
73 Residential NAC‐1 137 4th Street, Red Wing, MN 59.8 57.5 2.3 1 0 0
74 Residential NAC‐1 141 4th Street, Red Wing, MN 60.0 57.1 2.9 1 0 0
75 Residential NAC‐1 147 4th Street, Red Wing, MN 60.2 56.8 3.4 1 0 0
76 Residential NAC‐1 207 4th Street, Red Wing, MN 60.7 55.7 5.0 1 1 0
77 Residential NAC‐1 213 4th Street, Red Wing, MN 60.9 55.3 5.6 1 1 0
78 Residential NAC‐1 215 4th Street, Red Wing, MN 61.1 55.0 6.1 1 1 0
79 Residential NAC‐1 223 4th Street, Red Wing, MN 61.4 54.7 6.7 1 1 0
80 Residential NAC‐1 225 4th Street, Red Wing, MN 61.6 54.5 7.1 1 1 1
81 Residential NAC‐1 227 4th Street, Red Wing, MN 61.8 54.3 7.5 1 1 1
82 Residential NAC‐1 233 4th Street, Red Wing, MN 62.1 54.2 7.9 1 1 1
83 Residential NAC‐1 239 4th Street, Red Wing, MN 62.5 54.1 8.4 1 1 1
84 Residential NAC‐1 243 4th Street, Red Wing, MN 62.8 54.2 8.6 1 1 1
85 Residential NAC‐1 247 4th Street, Red Wing, MN 63.2 54.2 9.0 1 1 1
86 Residential NAC‐1 255 4th Street, Red Wing, MN 64.0 54.5 9.5 1 1 1
87 Residential NAC‐1 263 4th Street, Red Wing, MN 64.8 54.8 10.0 1 1 1
88 Residential NAC‐1 273 4th Street, Red Wing, MN 66.0 55.4 10.6 1 1 1
89 Residential NAC‐1 301 4th Street, Red Wing, MN 66.4 56.0 10.4 1 1 1
90 Residential NAC‐1 309 4th Street, Red Wing, MN 67.6 56.8 10.8 1 1 1
91 Residential NAC‐1 238 5th Street, Red Wing, MN 58.7 52.7 6.0 1 1 0
92 Residential NAC‐1 242 5th Street, Red Wing, MN 59.4 52.8 6.6 1 1 0
93 Residential NAC‐1 244 5th Street, Red Wing, MN 59.1 52.7 6.4 1 1 0
94 Residential NAC‐1 248 5th Street, Red Wing, MN 59.2 52.8 6.4 1 1 0
95 Residential NAC‐1 252 5th Street, Red Wing, MN 59.5 52.9 6.6 1 1 0
96 Residential NAC‐1 258 5th Street, Red Wing, MN 61.4 53.5 7.9 1 1 1
97 Residential NAC‐1 256 5th Street, Red Wing, MN 59.6 53.2 6.4 1 1 0
MN#: 2515-21 34 | June 2015 WI#: 7210-00-06

MnDOT/WisDOT | Traffic Noise Analysis Report APPENDIX C
Table 9: Noise Mitigation Cost Effectiveness Results (Daytime) Modeled Barrier B (20-foot)
Receptors Type NAC Address
Daytime L10 Noise (dBA) Reduction
(in dBA)
With Noise
Barrier
Number
of
Receptors
Number
of
Benefited
Receptors1
Number
Meeting
Design
Goal2
Length
of
Barrier
(feet)
Barrier
Area
(ft2)3
Total
Cost
of
Barrier
$20/ft2
Cost/
Benefited
Receptor
Build Year
2042
(No
Barrier)
Build Year
2042
(with
Barrier)
98 Residential NAC‐1 410 Green Street, Red Wing, MN 63.3 54.5 8.8 1 1 1
99 Residential NAC‐1 414 Green Street, Red Wing, MN 62.1 54.2 7.9 1 1 1
100 Residential NAC‐1 264 5th Street, Red Wing, MN 59.9 53.6 6.3 1 1 0
101 Residential NAC‐1 268 5th Street, Red Wing, MN 60.2 53.9 6.3 1 1 0
102 Residential NAC‐1 272 5th Street, Red Wing, MN 60.3 54.4 5.9 1 1 0
103 Residential NAC‐1 407 Green Street, Red Wing, MN 64.9 55.9 9.0 1 1 1
104 Residential NAC‐1 413 Green Street, Red Wing, MN 63.2 56.0 7.2 1 1 1
105 Residential NAC‐1 417 Green Street, Red Wing, MN 61.7 55.7 6.0 1 1 0
106 Residential NAC‐1 304 5th Street, Red Wing, MN 60.6 55.3 5.3 1 1 0
107 Residential NAC‐1 312 5th Street, Red Wing, MN 60.8 56.0 4.8 1 0 0
108 Residential NAC‐1 407 Arkin Street, Red Wing, MN 65.9 59.5 6.4 1 1 0
109 Residential NAC‐1 415 Arkin Street, Red Wing, MN 63.8 59.3 4.5 1 0 0
110 Residential NAC‐1 419 Arkin Street, Red Wing, MN 62.3 58.3 4.0 1 0 0
111 Residential NAC‐1 326 5th Street, Red Wing, MN 61.6 58.4 3.2 1 0 0
112 Residential NAC‐1 332 5th Street, Red Wing, MN 63.1 60.5 2.6 1 0 0
Bold numbers are above state daytime standards (L10)
Underline refers to L10 values approaching/exceeding Federal Noise Abatement Criteria
(1) Number of benefited residences with a minimum 5 dBA reduction
(2) Noise barrier must meet MnDOT’s noise reduction design goal of at least 7 dBA at a minimum of one benefited receptor behind each noise barrier
(3) Barrier surface area includes tapers at barrier ends
MN#: 2515-21 35 | June 2015 WI#: 7210-00-06

MnDOT/WisDOT | Traffic Noise Analysis Report APPENDIX C
Table 10: Noise Mitigation Cost Effectiveness Results (Nighttime) Modeled Barrier B (20-foot)
Receptors Type NAC Address
Nighttime L10 Noise (dBA) Reduction
(in dBA)
With Noise
Barrier
Number
of
Receptors
Number
of
Benefited
Receptors1
Number
Meeting
Design
Goal2
Length
of
Barrier
(feet)
Barrier
Area
(ft2)
Total
Cost
of
Barrier
$20/ft2
Cost/
Benefited
Receptor
Build Year
2042
(No Barrier)
Build Year
2042
(with Barrier)
20-foot tall modeled Barrier B
1,290 25,016 $500,320 $12,508
48 Residential NAC‐1 147 3rd Street, Red Wing, MN 66.3 66.0 0.3 1 0 0
49 Residential NAC‐1 153 3rd Street, Red Wing, MN 65.5 64.9 0.6 1 0 0
50 Residential NAC‐1 157 3rd Street, Red Wing, MN 65.6 63.7 1.9 1 0 0
51 Residential NAC‐1 304 Sanderson Street, Red Wing, MN 66.4 61.6 4.8 1 0 0
52 Residential NAC‐1 308 Sanderson Street, Red Wing, MN 64.6 59.7 4.9 1 0 0
53 Residential NAC‐1 310 Sanderson Street, Red Wing, MN 62.3 59.0 3.3 1 0 0
54 Residential NAC‐1 318 Sanderson Street, Red Wing, MN 60.9 57.9 3.0 1 0 0
55 Residential NAC‐1 120 4th Street, Red Wing, MN 62.6 62.2 0.4 1 0 0
56 Residential NAC‐1 124 4th Street, Red Wing, MN 61.2 60.5 0.7 1 0 0
57 Residential NAC‐1 130 4th Street, Red Wing, MN 60.6 59.7 0.9 1 0 0
58 Residential NAC‐1 134 4th Street, Red Wing, MN 60.3 58.9 1.4 1 0 0
59 Residential NAC‐1 142 4th Street, Red Wing, MN 59.9 57.7 2.2 1 0 0
60 Residential NAC‐1 150 4th Street, Red Wing, MN 60.0 56.5 3.5 1 0 0
61 Residential NAC‐1 309 Sanderson Street, Red Wing, MN 65.0 57.3 7.7 1 1 1
62 Residential NAC‐1 315 Sanderson Street, Red Wing, MN 62.1 56.0 6.1 1 1 0
63 Residential NAC‐1 202 4th Street, Red Wing, MN 60.6 55.7 4.9 1 0 0
64 Residential NAC‐1 214 4th Street, Red Wing, MN 60.9 54.7 6.2 1 1 0
65 Residential NAC‐1 220 4th Street, Red Wing, MN 62.0 54.1 7.9 1 1 1
66 Residential NAC‐1 228 4th Street, Red Wing, MN 61.7 53.5 8.2 1 1 1
67 Residential NAC‐1 232 4th Street, Red Wing, MN 62.9 53.7 9.2 1 1 1
68 Residential NAC‐1 236 4th Street, Red Wing, MN 63.3 53.7 9.6 1 1 1
69 Residential NAC‐1 250 4th Street, Red Wing, MN 64.6 53.9 10.7 1 1 1
MN#: 2515-21 36 | June 2015 WI#: 7210-00-06

MnDOT/WisDOT | Traffic Noise Analysis Report APPENDIX C
Table 10: Noise Mitigation Cost Effectiveness Results (Nighttime) Modeled Barrier B (20-foot)
Receptors Type NAC Address
Nighttime L10 Noise (dBA) Reduction
(in dBA)
With Noise
Barrier
Number
of
Receptors
Number
of
Benefited
Receptors1
Number
Meeting
Design
Goal2
Length
of
Barrier
(feet)
Barrier
Area
(ft2)
Total
Cost
of
Barrier
$20/ft2
Cost/
Benefited
Receptor
Build Year
2042
(No Barrier)
Build Year
2042
(with Barrier)
70 Residential NAC‐1 121 4th Street, Red Wing, MN 57.9 56.9 1.0 1 0 0
71 Residential NAC‐1 125 4th Street, Red Wing, MN 57.9 56.7 1.2 1 0 0
72 Residential NAC‐1 133 4th Street, Red Wing, MN 57.9 56.1 1.8 1 0 0
73 Residential NAC‐1 137 4th Street, Red Wing, MN 57.9 55.6 2.3 1 0 0
74 Residential NAC‐1 141 4th Street, Red Wing, MN 58.0 55.2 2.8 1 0 0
75 Residential NAC‐1 147 4th Street, Red Wing, MN 58.1 54.9 3.2 1 0 0
76 Residential NAC‐1 207 4th Street, Red Wing, MN 58.6 53.9 4.7 1 0 0
77 Residential NAC‐1 213 4th Street, Red Wing, MN 58.7 53.5 5.2 1 1 0
78 Residential NAC‐1 215 4th Street, Red Wing, MN 58.9 53.2 5.7 1 1 0
79 Residential NAC‐1 223 4th Street, Red Wing, MN 59.2 52.9 6.3 1 1 0
80 Residential NAC‐1 225 4th Street, Red Wing, MN 59.4 52.7 6.7 1 1 0
81 Residential NAC‐1 227 4th Street, Red Wing, MN 59.6 52.5 7.1 1 1 1
82 Residential NAC‐1 233 4th Street, Red Wing, MN 59.9 52.4 7.5 1 1 1
83 Residential NAC‐1 239 4th Street, Red Wing, MN 60.3 52.3 8.0 1 1 1
84 Residential NAC‐1 243 4th Street, Red Wing, MN 60.6 52.4 8.2 1 1 1
85 Residential NAC‐1 247 4th Street, Red Wing, MN 60.9 52.4 8.5 1 1 1
86 Residential NAC‐1 255 4th Street, Red Wing, MN 61.8 52.6 9.2 1 1 1
87 Residential NAC‐1 263 4th Street, Red Wing, MN 62.5 52.9 9.6 1 1 1
88 Residential NAC‐1 273 4th Street, Red Wing, MN 63.7 53.4 10.3 1 1 1
89 Residential NAC‐1 301 4th Street, Red Wing, MN 64.1 54.0 10.1 1 1 1
90 Residential NAC‐1 309 4th Street, Red Wing, MN 65.2 54.7 10.5 1 1 1
91 Residential NAC‐1 238 5th Street, Red Wing, MN 56.6 50.9 5.7 1 1 0
92 Residential NAC‐1 242 5th Street, Red Wing, MN 57.3 51.0 6.3 1 1 0
93 Residential NAC‐1 244 5th Street, Red Wing, MN 57.0 50.9 6.1 1 1 0
94 Residential NAC‐1 248 5th Street, Red Wing, MN 57.1 51.0 6.1 1 1 0
95 Residential NAC‐1 252 5th Street, Red Wing, MN 57.3 51.1 6.2 1 1 0
MN#: 2515-21 37 | June 2015 WI#: 7210-00-06

MnDOT/WisDOT | Traffic Noise Analysis Report APPENDIX C
Table 10: Noise Mitigation Cost Effectiveness Results (Nighttime) Modeled Barrier B (20-foot)
Receptors Type NAC Address
Nighttime L10 Noise (dBA) Reduction
(in dBA)
With Noise
Barrier
Number
of
Receptors
Number
of
Benefited
Receptors1
Number
Meeting
Design
Goal2
Length
of
Barrier
(feet)
Barrier
Area
(ft2)
Total
Cost
of
Barrier
$20/ft2
Cost/
Benefited
Receptor
Build Year
2042
(No Barrier)
Build Year
2042
(with Barrier)
96 Residential NAC‐1 258 5th Street, Red Wing, MN 59.2 51.6 7.6 1 1 1
97 Residential NAC‐1 256 5th Street, Red Wing, MN 57.5 51.3 6.2 1 1 0
98 Residential NAC‐1 410 Green Street, Red Wing, MN 61.1 52.6 8.5 1 1 1
99 Residential NAC‐1 414 Green Street, Red Wing, MN 59.8 52.3 7.5 1 1 1
100 Residential NAC‐1 264 5th Street, Red Wing, MN 57.8 51.6 6.2 1 1 0
101 Residential NAC‐1 268 5th Street, Red Wing, MN 58.1 52.0 6.1 1 1 0
102 Residential NAC‐1 272 5th Street, Red Wing, MN 58.2 52.4 5.8 1 1 0
103 Residential NAC‐1 407 Green Street, Red Wing, MN 62.5 53.8 8.7 1 1 1
104 Residential NAC‐1 413 Green Street, Red Wing, MN 60.9 53.8 7.1 1 1 1
105 Residential NAC‐1 417 Green Street, Red Wing, MN 59.5 53.5 6.0 1 1 0
106 Residential NAC‐1 304 5th Street, Red Wing, MN 58.4 53.1 5.3 1 1 0
107 Residential NAC‐1 312 5th Street, Red Wing, MN 58.7 53.8 4.9 1 1 0
108 Residential NAC‐1 407 Arkin Street, Red Wing, MN 63.5 57.0 6.5 1 1 0
109 Residential NAC‐1 415 Arkin Street, Red Wing, MN 61.5 56.8 4.7 1 0 0
110 Residential NAC‐1 419 Arkin Street, Red Wing, MN 60.0 55.9 4.1 1 0 0
111 Residential NAC‐1 326 5th Street, Red Wing, MN 59.3 56.1 3.2 1 0 0
112 Residential NAC‐1 332 5th Street, Red Wing, MN 60.8 58.1 2.7 1 0 0
MN#: 2515-21 38 | June 2015 WI#: 7210-00-06

MnDOT/WisDOT | Traffic Noise Analysis Report APPENDIX D
Appendix D Traffic Information
MN#: 2515-21 39 | June 2015 WI#: 7210-00-06

MnDOT/WisDOT | Traffic Noise Analysis Report APPENDIX D
Existing 2010 PM Peak
Roadway Segment Autos Medium Trucks
Heavy Trucks
1 SB Hwy 63 Segment 1 355 0 18 2 SB Hwy 63 Segment 2 355 0 18 3 NB Hwy 63 Segment 1 704 0 17 4 NB Hwy 63 Segment 2 704 0 17 5 WB Hwy 61 Segment 1 314 0 18 6 WB Hwy 61 Segment 2 314 0 18 7 WB Hwy 61 Segment 3 314 0 18 8 EB Hwy 61 Segment 1 391 0 16 9 EB Hwy 61 Segment 2 391 0 16 10 EB Hwy 61 Segment 3 391 0 16 11 WB 3rd Street (Potter to Plum) 332 0 15 12 EB 3rd Street (Potter to Plum) 589 0 16 13 WB 3rd Street (Plum to Bush) 142 0 0 14 EB 3rd Street (Plum to Bush) 200 0 1 15 WB Main Street (Potter to Plum) 277 0 18 16 EB Main Street (Potter to Plum) 428 0 16 17 WB Main Street (Plum to Bush) 666 0 22 18 EB Main Street (Plum to Bush) 886 0 28
MN#: 2515-21 40 | June 2015 WI#: 7210-00-06

MnDOT/WisDOT | Traffic Noise Analysis Report APPENDIX D
Existing 2010 Nighttime (6AM-7AM)
Nighttime (70.8%)
Nighttime (70.8%)
Roadway Segment Speed Limit
(mph) Autos Medium Trucks Heavy Trucks 1 SB Hwy 63 Segment 1 55 383 0 11 2 SB Hwy 63 Segment 2 30 383 0 11 3 NB Hwy 63 Segment 1 30 133 0 16 4 NB Hwy 63 Segment 2 55 133 0 16 5 WB Hwy 61 Segment 1 55 183 0 13 6 WB Hwy 61 Segment 2 55 183 0 13 7 WB Hwy 61 Segment 3 30 183 0 13 8 EB Hwy 61 Segment 1 30 138 0 24 9 EB Hwy 61 Segment 2 55 138 0 24 10 EB Hwy 61 Segment 3 55 138 0 24 11 WB 3rd Street (Potter to Plum) 25 324 0 11 12 EB 3rd Street (Potter to Plum) 25 103 0 16 13 WB 3rd Street (Plum to Bush) 25 79 0 1 14 EB 3rd Street (Plum to Bush) 25 25 0 1 15 WB Main Street (Potter to Plum) 25 172 0 14 16 EB Main Street (Potter to Plum) 25 157 0 24 17 WB Main Street (Plum to Bush) 25 441 0 20 18 EB Main Street (Plum to Bush) 25 239 0 33
MN#: 2515-21 41 | June 2015 WI#: 7210-00-06

MnDOT/WisDOT | Traffic Noise Analysis Report APPENDIX D
No-Build 2042 PM Peak
Roadway Segment Autos Medium Trucks
Heavy Trucks
1 SB Hwy 63 Segment 1 520 0 30 2 SB Hwy 63 Segment 2 520 0 30 3 NB Hwy 63 Segment 1 1027 0 33 4 NB Hwy 63 Segment 2 1027 0 33 5 WB Hwy 61 Segment 1 406 0 24 6 WB Hwy 61 Segment 2 406 0 24 7 WB Hwy 61 Segment 3 406 0 24 8 EB Hwy 61 Segment 1 499 0 21 9 EB Hwy 61 Segment 2 499 0 21 10 EB Hwy 61 Segment 3 499 0 21 11 WB 3rd Street (Potter to Plum) 492 0 28 12 EB 3rd Street (Potter to Plum) 869 0 31 13 WB 3rd Street (Plum to Bush) 218 0 2 14 EB 3rd Street (Plum to Bush) 307 0 3 15 WB Main Street (Potter to Plum) 385 0 25 16 EB Main Street (Potter to Plum) 571 0 19 17 WB Main Street (Plum to Bush) 896 0 34 18 EB Main Street (Plum to Bush) 1169 0 41
MN#: 2515-21 42 | June 2015 WI#: 7210-00-06

MnDOT/WisDOT | Traffic Noise Analysis Report APPENDIX D
No-Build 2042 Nighttime (6AM-7AM)
Nighttime (70.8%)
Nighttime (70.8%)
Roadway Segment Speed Limit
(mph) Autos Medium Trucks Heavy Trucks 1 SB Hwy 63 Segment 1 55 559 0 21 2 SB Hwy 63 Segment 2 30 559 0 21 3 NB Hwy 63 Segment 1 30 203 0 23 4 NB Hwy 63 Segment 2 55 203 0 23 5 WB Hwy 61 Segment 1 55 231 0 17 6 WB Hwy 61 Segment 2 55 231 0 17 7 WB Hwy 61 Segment 3 30 231 0 17 8 EB Hwy 61 Segment 1 30 198 0 15 9 EB Hwy 61 Segment 2 55 198 0 15 10 EB Hwy 61 Segment 3 55 198 0 15 11 WB 3rd Street (Potter to Plum) 25 476 0 20 12 EB 3rd Street (Potter to Plum) 25 162 0 22 13 WB 3rd Street (Plum to Bush) 25 126 0 1 14 EB 3rd Street (Plum to Bush) 25 40 0 2 15 WB Main Street (Potter to Plum) 25 230 0 18 16 EB Main Street (Potter to Plum) 25 234 0 13 17 WB Main Street (Plum to Bush) 25 613 0 24 18 EB Main Street (Plum to Bush) 25 339 0 29
MN#: 2515-21 43 | June 2015 WI#: 7210-00-06

MnDOT/WisDOT | Traffic Noise Analysis Report APPENDIX D
Build 2042 PM Peak
Roadway Segment Speed Limit
(mph) Autos Medium Trucks
Heavy Trucks
1 SB Hwy 63 Segment 1 55 530 0 30 2 SB Hwy 63 Segment 2 30 530 0 30 3 SB Hwy 63 Segment 3 30 530 0 30 4 NB Hwy 63 Segment 1 30 1032 0 28 5 NB Hwy 63 Segment 2 30 1032 0 28 6 NB Hwy 63 Segment 3 55 1032 0 28 7 WB Hwy 61 Segment 1 55 406 0 24 8 WB Hwy 61 Segment 2 30 854 0 41 9 EB Hwy 61 Segment 1 30 1459 0 36 10 EB Hwy 61 Segment 2 55 509 0 21 11 WB 3rd Street (Potter to Plum) 25 187 0 3 12 EB 3rd Street (Potter to Plum) 25 107 0 3 13 WB 3rd Street (Plum to Bush) 25 143 0 2 14 EB 3rd Street (Plum to Bush) 25 192 0 3 15 WB Main Street (Potter to Plum) 25 838 0 42 16 EB Main Street (Potter to Plum) 25 1476 0 34 17 WB Main Street (Plum to Bush) 25 971 0 34 18 EB Main Street (Plum to Bush) 25 1284 0 41
MN#: 2515-21 44 | June 2015 WI#: 7210-00-06

MnDOT/WisDOT | Traffic Noise Analysis Report APPENDIX D
Build 2042 Nighttime (6AM-7AM) Nighttime
(70.8%) Nighttime
(70.8%) Nighttime
(70.8%)
Roadway Segment Speed Limit
(mph) Autos Medium Trucks Heavy Trucks 1 SB Hwy 63 Segment 1 55 566 0 21 2 SB Hwy 63 Segment 2 30 566 0 21 3 SB Hwy 63 Segment 3 30 566 0 21 4 NB Hwy 63 Segment 1 30 207 0 20 5 NB Hwy 63 Segment 2 30 207 0 20 6 NB Hwy 63 Segment 3 55 207 0 20 7 WB Hwy 61 Segment 1 55 231 0 17 8 WB Hwy 61 Segment 2 30 753 0 29 9 EB Hwy 61 Segment 1 30 367 0 25 10 EB Hwy 61 Segment 2 55 205 0 15 11 WB 3rd Street (Potter to Plum) 25 33 0 2 12 EB 3rd Street (Potter to Plum) 25 83 0 2 13 WB 3rd Street (Plum to Bush) 25 55 0 1 14 EB 3rd Street (Plum to Bush) 25 30 0 2 15 WB Main Street (Potter to Plum) 25 746 0 30 16 EB Main Street (Potter to Plum) 25 383 0 24 17 WB Main Street (Plum to Bush) 25 691 0 24 18 EB Main Street (Plum to Bush) 25 350 0 29
MN#: 2515-21 45 | June 2015 WI#: 7210-00-06

MnDOT/WisDOT | Traffic Noise Analysis Report APPENDIX D
24-hr Traffic Demands
Total
Hourly %
12:00 AM 365 0.59% 01:00 AM 283 0.46% 02:00 AM 270 0.43% 03:00 AM 253 0.41% 04:00 AM 919 1.48% 05:00 AM 1466 2.36% 06:00 AM 2372 3.81% 07:00 AM 3193 5.14% 08:00 AM 3186 5.12% 09:00 AM 3294 5.30% 10:00 AM 3593 5.78% 11:00 AM 4090 6.58% 12:00 PM 4104 6.60% 01:00 PM 4188 6.74% 02:00 PM 4292 6.90% 03:00 PM 4987 8.02% 04:00 PM 5359 8.62% 05:00 PM 4550 7.32% 06:00 PM 3390 5.45% 07:00 PM 2559 4.12% 08:00 PM 2181 3.51% 09:00 PM 1592 2.56% 10:00 PM 1006 1.62% 11:00 PM 687 1.10%
62179 100.00%
MN#: 2515-21 46 | June 2015 WI#: 7210-00-06