Embed Size (px)
Citation preview

RECYCLING IN NC:MARKET UPDATE,UNDERSTANDING SINGLE STREAM VALUATIONS, &MAKING THE BEST OF THINGS
NC APWA Solid Waste Division, August 12, 2016
Rob Taylor, NC Department of Environmental Quality

Overview•Recycling Things on Everybody’s Minds
•Market Update
•The Value of a Commingled Ton
•Quality
•Making the Best of Things
•Discussion

Recycling: Some Things On Everybody’s Mind
•Recycling Markets / Material Values
•Processing Costs
•Glass
•Contamination
•Electronics (whoops, wrong presentation)

Recycling Market Update• Some major factors influencing the value of your recyclables:
• Low cost of oil
• High value of US dollar relative to other currencies
• Decreased demand for US recyclables in China
• The relatively low value of recyclable commodities over the past year has exacerbated problems with glass (more later).

Fiber / Paper Prices (per ton) Since 2008

Aluminum, PET and HDPE Prices (per .lb) since 2008

What about Glass?• Yes: Glass is causing trouble for recycling at this time
• Yes: Citizens want to recycle glass
• Yes: ABC On-Premises permit holders in NC are required to recycle glass beverage containers
• And, glass is a substantial proportion of recycling tonnage (more later)
• Remember, if glass isn’t recycled then it’s thrown away.• “Away” = MSW Landfill in your municipal garbage trucks
• Questions:• Does garbage collection have a cost?
• Does your community pay tipping fees for disposal (either directly or indirectly)?

Glass: Believe It Or Not…• Glass is readily recyclable and there’s plenty of demand for recycled glass cullet
• NC has good access to glass processing• Strategic Materials, or SMI, has a beneficiation plant in Wilson, NC
• SMI turns mixed glass into “cullet” that is furnace-ready
• Challenges with glass recycling:• Hard on equipment
• Low value relative to other recyclables
• Glass from MRFs often contains A LOT of
material besides glass
• SMI pays for glass, but not for transportation or
the other materials mixed with glass

Strategic Materials, Wilson
From this:
To this:

Users of Reclaimed Cullet in NC area
• Ardagh• Henderson, NC
• Wilson, NC
• Owens-Illinois• Danville, VA
• Winston-Salem, NC
• Potters Industries• Apex, NC
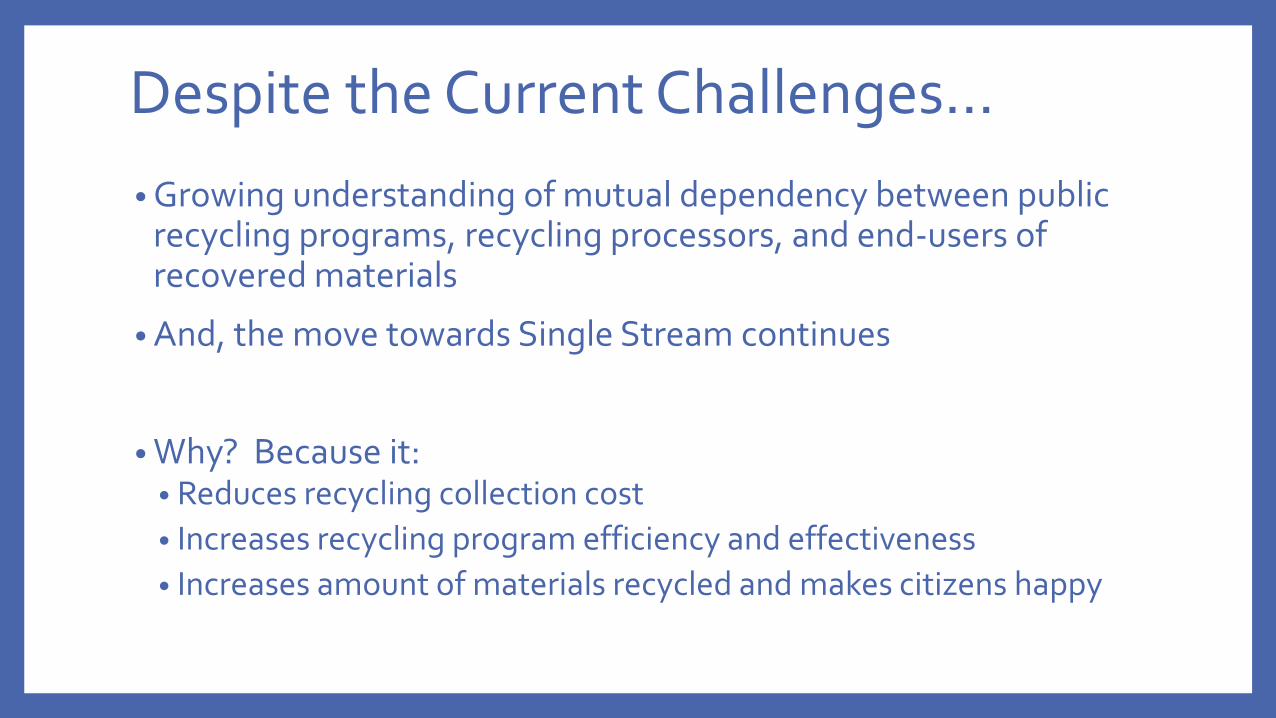
Despite the Current Challenges…
• Growing understanding of mutual dependency between public recycling programs, recycling processors, and end-users of recovered materials
• And, the move towards Single Stream continues
• Why? Because it:• Reduces recycling collection cost
• Increases recycling program efficiency and effectiveness
• Increases amount of materials recycled and makes citizens happy

-
50,000
100,000
150,000
200,000
250,000
300,000
350,000
400,000
FY 2004-05
FY 2005-06
FY 2006-07
FY 2007-08
FY 2008-09
FY 2009-10
FY 2010-11
FY 2011-12
FY 2012-13
FY 2013-14
FY 2014-15
Annual Recycling Tons Reported as “Commingled” by NC Local Governments

NC MRFs

NC MRFs

Single Stream Recycling: What’s In The Bin?
Material 2015
Glass 27.4%
PET 4.8%
HDPE 3.4%
3-7 Plastics 0.6%
Rigid Plastics 0.5%
Aluminum 1.2%
Steel 2.5%
Containers SubT: 40.3%
Newspaper 20.8%
OCC 17.6%
Magazines n/a
Mixed Paper 21.3%
Fiber SubT: 59.7%
• Material mix varies by region and community• Socio-economics of community population
• Local decisions about what materials will be accepted by public recycling programs
• Access to markets for specific materials
• Material mix varies within any given year (seasonally, yearly, and even weekly)• Seasonal nature of consumption
• Composition of mix depends on effectiveness of outreach efforts• Getting the message about the “right”
materials and the “wrong” materials

Understanding Commingled Pricing• More important than ever because of recent markets
• Lots of moving parts contribute to the final value
• Price of a commingled ton is a composite based on the value of individual commodities and their percent of the mix (the “commingled ton”)
• Remember: sorting and baling isn’t free and MRFs are for-profit operations
• Both quantity and quality of material delivered to a MRF matters

Materials, from the MRF Perspective
Value of material to a MRF is influenced by:• An individual material’s current commodity price• How much of any material is in the commingled mix• The MRF’s contracts / relationships with markets for materials• The effectiveness of the MRF system for recovering that material
Not all MRFS are created equal:• Efficiency and economy of scale impact relative cost of processing
Material Value ($/Ton), May Pricing in NC
Higher Lower
Al HDPE PET Steel OCC ONP OMP Glass

Material % of 1 MRF ton Price/ton* Value
Fiber Materials
ONP 20.8% $ 68.30 $ 14.21
Mixed Paper 21.3% $ 50.00 $ 10.65
OCC 17.6% $ 96.33 $ 16.95
Fiber Sub-total 59.7% $ 41.81
Container Materials
Glass 27.4% $ (6.67) $ (1.83)
Aluminum Cans 1.2% $ 1,100.00 $ 12.76
Steel Cans 2.5% $ 43.00 $ 1.08
PET 4.8% $ 150.00 $ 7.20
HDPE (colored prices) 3.4% $ 400.00 $ 13.60
Mixed Plastics 0.8% $ 30.00 $ 0.24
Cartons/aseptics 0.2% $ 50.00 $ 0.10
Container Sub-total 40.3% $ 33.15
TOTAL $ 74.96
MRF Operating Costs $ 70.00
Residue Costs $ 7.20
Net Cost/Revenue $ (2.24)
How to determine
the value of a
commingled ton

Material % of 1 MRF ton Price/ton* Value
Fiber Materials
ONP 20.8% $ 68.30 $ 14.21
Mixed Paper 21.3% $ 50.00 $ 10.65
OCC 17.6% $ 96.33 $ 16.95
Fiber Sub-total 59.7% $ 41.81
Container Materials
Glass 27.4% $ (6.67) $ (1.83)
Aluminum Cans 1.2% $ 1,100.00 $ 12.76
Steel Cans 2.5% $ 43.00 $ 1.08
PET 4.8% $ 150.00 $ 7.20
HDPE (colored prices) 3.4% $ 400.00 $ 13.60
Mixed Plastics 0.8% $ 30.00 $ 0.24
Cartons/aseptics 0.2% $ 50.00 $ 0.10
Container Sub-total 40.3% $ 33.15
TOTAL $ 74.96
MRF Operating Costs $ 70.00
Residue Costs $ 7.20
Net Cost/Revenue $ (2.24)
Start with the materials in
the mix

Material % of 1 MRF ton Price/ton* Value
Fiber Materials
ONP 20.8% $ 68.30 $ 14.21
Mixed Paper 21.3% $ 50.00 $ 10.65
OCC 17.6% $ 96.33 $ 16.95
Fiber Sub-total 59.7% $ 41.81
Container Materials
Glass 27.4% $ (6.67) $ (1.83)
Aluminum Cans 1.2% $ 1,100.00 $ 12.76
Steel Cans 2.5% $ 43.00 $ 1.08
PET 4.8% $ 150.00 $ 7.20
HDPE (colored prices) 3.4% $ 400.00 $ 13.60
Mixed Plastics 0.8% $ 30.00 $ 0.24
Cartons/aseptics 0.2% $ 50.00 $ 0.10
Container Sub-total 40.3% $ 33.15
TOTAL $ 74.96
MRF Operating Costs $ 70.00
Residue Costs $ 7.20
Net Cost/Revenue $ (2.24)
Add in the value of the
commodities
*winter 2015/16 prices shown for illustration

Material % of 1 MRF ton Price/ton* Value
Fiber Materials
ONP 20.8% $ 68.30 $ 14.21
Mixed Paper 21.3% $ 50.00 $ 10.65
OCC 17.6% $ 96.33 $ 16.95
Fiber Sub-total 59.7% $ 41.81
Container Materials
Glass 27.4% $ (6.67) $ (1.83)
Aluminum Cans 1.2% $ 1,100.00 $ 12.76
Steel Cans 2.5% $ 43.00 $ 1.08
PET 4.8% $ 150.00 $ 7.20
HDPE (colored prices) 3.4% $ 400.00 $ 13.60
Mixed Plastics 0.8% $ 30.00 $ 0.24
Cartons/aseptics 0.2% $ 50.00 $ 0.10
Container Sub-total 40.3% $ 33.15
TOTAL $ 74.96
MRF Operating Costs $ 70.00
Residue Costs $ 7.20
Net Cost/Revenue $ (2.24)
Gross Value
Add things up to determine the Gross Value of
the Ton

Material % of 1 MRF ton Price/ton* Value
Fiber Materials
ONP 20.8% $ 68.30 $ 14.21
Mixed Paper 21.3% $ 50.00 $ 10.65
OCC 17.6% $ 96.33 $ 16.95
Fiber Sub-total 59.7% $ 41.81
Container Materials
Glass 27.4% $ (6.67) $ (1.83)
Aluminum Cans 1.2% $ 1,100.00 $ 12.76
Steel Cans 2.5% $ 43.00 $ 1.08
PET 4.8% $ 150.00 $ 7.20
HDPE (colored prices) 3.4% $ 400.00 $ 13.60
Mixed Plastics 0.8% $ 30.00 $ 0.24
Cartons/aseptics 0.2% $ 50.00 $ 0.10
Container Sub-total 40.3% $ 33.15
TOTAL $ 74.96
MRF Operating Costs $ 70.00
Residue Costs $ 7.20
Net Cost/Revenue $ (2.24)
ProcessingCost
Remember the MRF has costs:
-Maintenance-Overhead
-Capital Outlay

Material % of 1 MRF ton Price/ton* Value
Fiber Materials
ONP 20.8% $ 68.30 $ 14.21
Mixed Paper 21.3% $ 50.00 $ 10.65
OCC 17.6% $ 96.33 $ 16.95
Fiber Sub-total 59.7% $ 41.81
Container Materials
Glass 27.4% $ (6.67) $ (1.83)
Aluminum Cans 1.2% $ 1,100.00 $ 12.76
Steel Cans 2.5% $ 43.00 $ 1.08
PET 4.8% $ 150.00 $ 7.20
HDPE (colored prices) 3.4% $ 400.00 $ 13.60
Mixed Plastics 0.8% $ 30.00 $ 0.24
Cartons/aseptics 0.2% $ 50.00 $ 0.10
Container Sub-total 40.3% $ 33.15
TOTAL $ 74.96
MRF Operating Costs $ 70.00
Residue Costs $ 7.20
Net Cost/Revenue $ (2.24)
Amount available for MRF profit and paying revenue to community
Do the Math and you’ll see
why MRFs have been charging for processing

Value of a Commingled Ton Over Time
$-
$20.00
$40.00
$60.00
$80.00
$100.00
$120.00
$140.00
$160.00
$180.00
$200.00
Gross Value of Single Stream TonWith Glass, Not Including Residue Costs

Value of a Commingled Ton Over Time
$-
$20.00
$40.00
$60.00
$80.00
$100.00
$120.00
$140.00
$160.00
$180.00
$200.00
Gross Value of Single Stream TonWith Glass, Not Including Residue Costs
The Good News:

Lessons From The Last Year Or So:• Quality matters
• Communication matters
• Contracts matter & deals should reflect mutual dependence and mutual needs
MRF• Profitability• Material Quality• Low residue cost• Committed
material stream
Local Govt• Consistent access to
processing services• Predictable costs &
possible revenue• Info about acceptable
materials• Protection from
unexpected costs

The Impact of Residue on Value of The Ton
Gross Value of One Incoming Commingled Ton
Description Value
Average North Carolina Single Stream Ton without Residue $82.16
Average North Carolina Single Stream Ton with 10% Residue
$67.45
Average North Carolina Single Stream Ton with 15% Residue
$60.09
Assumptions:• Spring 2016 pricing• Full cost of residue = $65/Ton

What’s A Community To Do?• Focus on Efficiency
• Recycling: More and Better• More:
• Offer recycling service where you can: multifamily, small businesses, away-from-home
• Use outreach BMPs to make citizens award of all the materials they can recycle
• Better:• Focus on Quality
• No shredded paper, no plastic bags, no trash, no tanglers
• If moving to single stream (especially drop-off systems), do the math on collecting glass separate
• Keep the end goal in mind: provide effective public recycling service

Questions / Discussion
Thank You
Rob Taylor
North Carolina Department of Environmental Quality
Division of Environmental Assistance and Customer Service
Phone: 919-707-8139
Email: [email protected]
Web: www.recyclenc.org

Away-from-home recycling
APWA 2016Dave Bundick
Superintendent of Solid Waste
City of Wilmington, NC

Before

Grant as catalyst
• 2013 Community Waste Reduction
and Recycling grant
• $30K with 20% local match
• Away-from-home recycling focus
area

Cart garages
• Permanent
• Presence
• Pleasing

Facility Focus
• High Visitation– 21,600 people at amphitheater
– 55,000 people at the golf course
– 25,000 people at the nature park
– 11,000 people at tennis complex
– 950,000 people at the stadium per year
• Parks and Recreation staff knowledge of material
disposal
• Management and collection
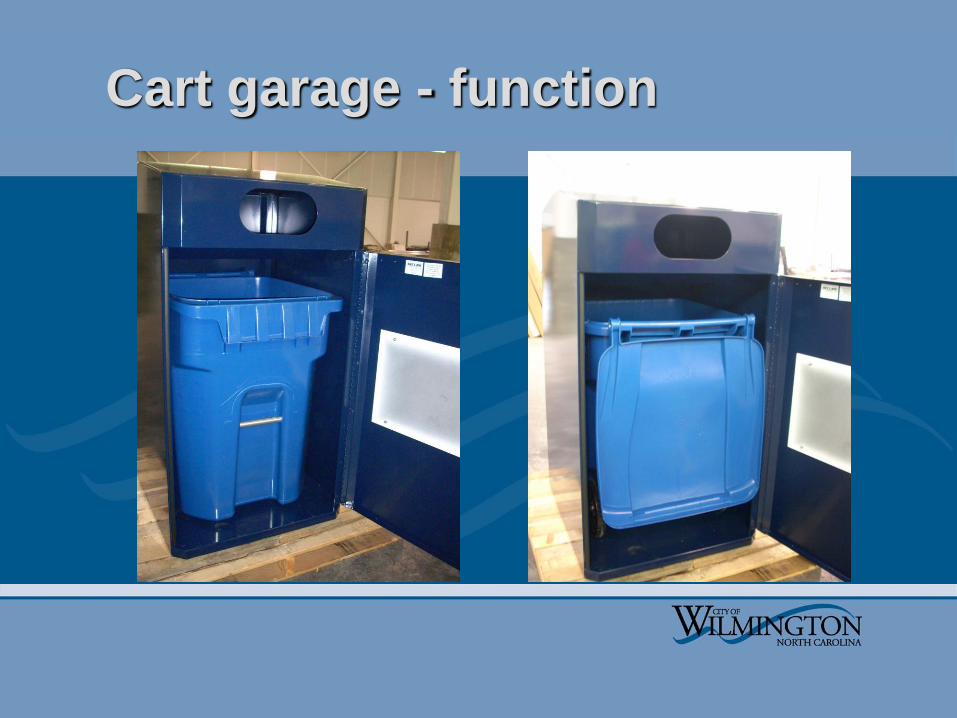
Cart garage - function

Legion Stadium

Hugh Morton Amphitheater at
Greenfield Lake

Althea Gibson Tennis area at
Empie Park

Municipal Golf Course

Halyburton Park

Introduce to the
community

Engage the
community
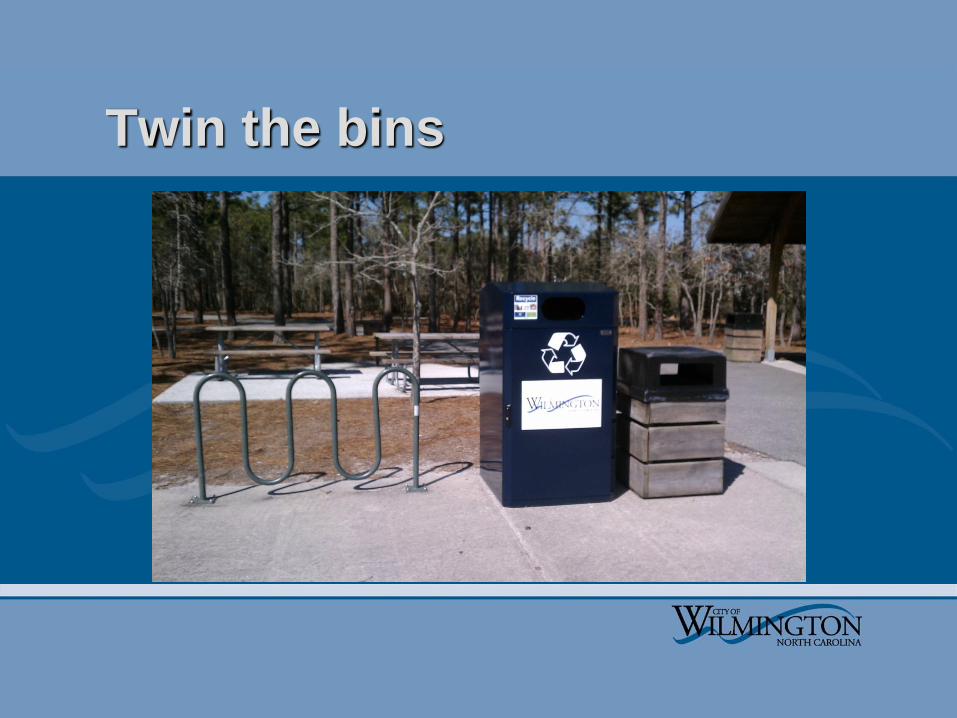
Twin the bins

Data Collection
• Parks and Public Spaces absorbed into
residential collection
• Isolated collection found 1,450lbs in May 2014
• If representative, 17,400 lbs per year
• Fluctuate dependent on events
• Materials found: Plastic bottles, aluminum cans,
glass bottles and cardboard

Next steps
Opportunities
• Increase recycling
expansion efforts
– Parks, Downtown
• Continue to engage the
community
Challenges
• Data collection
• Managing contaminants

Event Recycling Guide

Advertising Focus

Historic Downtown Recycling
• There are currently nineteen recycling receptacles
in Wilmington’s Historic Downtown, a 23 block
area that includes River Front Park.

2014 Community Waste Reduction
and Recycling Grant Program
• $25,000 grant with a $5,000 match to purchase
19 Victor Stanley Recycling Containers.
• 19 Containers total $26,455: $1,393 each
– Installation cost $3,545: $187 each
• Approval need from the Wilmington Historic
District Board
• Project took six months to complete from
day of purchase to installation

Waste Audit: Downtown Recycling
• One week audit in May 2015 produced 1,048
gallons of recycling; 73% was recyclable material.

Away-from-Home Recycling
Downtown Recycling Expansion
• NCDENR 2016 Community Waste
Reduction and Recycling Grant
• $30,000 Grant
– $6,000 Grant match
• 23 Victor Stanley Recycling containers
• Estimated completion date: April 2017