Embed Size (px)
Citation preview

Recovery Rates of Bank Loans:
Empirical Evidence for Germany
Jens Grunerta,b and Martin Webera,c
March 2005
a Department of Banking and Finance, University of Mannheim, L 5.2, 68131 Mannheim,
Germany b Wants to present the paper
c Centre for Economic Policy Research (CEPR), London, United Kingdom
E-Mail: [email protected], [email protected]

1
Recovery Rates of Bank Loans:
Empirical Evidence for Germany
Abstract:
Only few studies exist concerning the recovery rate of bank loans. The recovery rate
is defined as the payback quota of a defaulted borrower. Prediction models of recovery rates
are gaining in importance because of the Basel II-reform and the impact for the credit risk
management, the calculation of interest rates and the results of credit risk models.
Factors that influence the recovery rate can be divided into the groups features of the
borrower, intensity of the business connection, terms of credit and macroeconomic factors.
According to the literature, the impact of the company size and the quota of collateral can be
confirmed. Not yet analyzed is the detected influence of the probability of default, the inten-
sity of the business connection and the sum of discounted outpayments. The found negative
correlation between the probability of default and the recovery rate is important because the
commonly used formula to calculate standard risk cost determines an expected loss that can
be too low. Furthermore, this correlation leads to an underestimation of credit risk of credit
risk models.
Key words: recovery rates, bank loans, forecast models, credit risk, capital requirements

2
1. Introduction
Whereas the prediction of the probability of default for potential or actual borrowers
has been intensely analyzed during the past few decades,1 the prediction of recovery rates has
become increasingly central in academic literature. The recovery rate is defined as the pay-
back quota of the borrower. Within the scope of the Basel II-reform the term loss given de-
fault is used, which depicts the loss quota in the case of the borrower’s default.2 For bonds, it
is possible to acquire market-recovery rates, which can be calculated either immediately or
after a determined period following the default event as quotient of the actual market price
and the nominal value. Because of the fact that bank loans are not normally tradable, only so-
called work-out-recovery rates exist.3 In this context all future incoming payments within the
work-out-process for example due to the realization of collateral and outpayments as a result
of legal requirements are discounted at the time of default and divided at the exposure of de-
fault (EAD).4 This calculation process requires a consistent default definition. In banking
practice it is customary to define various default events. In doing so, the existence of one of
these events causes the occurrence of the default status.5
An escalating discussion concerning the recovery rate is comprehensible if the im-
portance of it for the banking practice is considered. The calculation of interest rates depends
on the recovery rate because of the consideration of standard risk-costs. These standard risk-
costs cover the expected credit loss as the product of the exposure of default, the probability
of default, and the recovery rate.6 Consequently, both the probability of default and the recov-
ery rate have great influence when calculating the standard risk-costs, whereas the impact of
1 See Beaver (1966), Altman (1968), Altman et al. (1977) and Ohlson (1980), who developed models to predict the probability of default based on financial factors. 2 See Basel Committee on Banking Supervision (2004). Thus: recovery rate (RR) = 1 – loss given default (LGD). 3 In addition, so called implicit market-recovery rates exist. These values are used to price credit derivatives and asset backed securities based on theoretical models. See Schuermann (2004), p. 6 et seq. 4 In the following, this value is multiplied by 100. 5 In the following, the default event indicates the first occurred default event. 6 This calculation is only correct under the assumption of independence between the probability of default, the loss given default, and the exposure at default.

3
the latter has been far less researched. In addition, the recovery rate must be calculated for an
estimation of the unexpected credit loss. The loss given default is an important parameter
when using the advanced IRB approach of the Basel II-reform to calculate the capital re-
quirements. Banks that use this approach have to estimate the loss given default based on a
suitable self-provided model. In return, these banks are confronted with lower capital re-
quirements. The estimation of the loss given default should consider the potential influence of
deteriorating economic conditions and the potential dependency with the probability of de-
fault.7 Furthermore, the recovery rate is a parameter in credit risk models, which are increas-
ingly more important in banking practice. Both in these models and in the calculation of the
standard risk-costs the assumption is made that the recovery rate is independent of the prob-
ability of the borrower’s default. However, various empirical studies about bonds show that
there is a negative correlation between these two factors. The estimation of the recovery rates
of underlying loans is also necessary for the evaluation of credit derivatives and asset backed
securities. Thus, the hedging premium at the time of the contract of a credit default swap de-
pends on the estimated recovery rate.8 In addition, the risk-adjusted risk measurement of the
credit business’ profit requires an evaluation of the recovery rate-risk.9
The first aim of this empirical study is to gain insights into the level and distribution
of recovery rates of defaulted borrowers at a large German bank, because very little research
actually exists for continental Europe. Subsequently, potential influencing factors on the re-
covery rate, both discussed in the literature and self-defined, are examined10 and compared to
empirical findings in the literature for US banks to illustrate possible country differences due
to factors like the insolvency laws, the financing structure of the companies and the composi-
tion of the industry classification. 7 See Basel Committee on Banking Supervision (2005), paragraph 468-469. 8 Jarrow and Turnbull (2000) describe the importance of the density function of risk-neutral recovery rates for the evaluation of credit derivatives. 9 This defines the risk that the realized recovery rates can differ from the estimated ones. 10 To know these factors is especially important for banks that want to build up there own model to predict re-covery rates.

4
The remainder of this paper is organized in the following manner. Section 2 reviews
the literature regarding recovery rates of loans. Based on these studies, hypotheses concerning
potential influencing factors about the recovery rate are defined in section 3. Subsequently,
the description of the data set takes place in section 4. In section 5 information about the level
and distribution of recovery rates are described and the postulated hypotheses are tested. Sec-
tion 6 concludes the paper and suggests avenues for further research.
2. Overview of literature concerning recovery rates of loans
Literature investigating recovery rates of loans can be divided into two groups. Ini-
tially, empirical studies analyzing the level of and important influencing factors on the recov-
ery rate are summarized and statistical models of international rating agencies used to predict
recovery rates of loans are specified. Afterwards, studies that criticize assumptions of credit
risk models concerning the recovery rate are illustrated. These studies mainly refer to bonds,
but can in all likelihood pertain to loans. In particular, the assumption of independence be-
tween the probability of default and the recovery rate is questioned. Possibilities to model
dependencies between these factors are presented at the end of the section.
Influencing factors of recovery rates
In contrast to bonds, only a few empirical studies concerning recovery rates of loans
exist because loans are not normally tradable and there are often problems with data confiden-
tiality.11 These studies are mainly based on data from the US banking system with a small
sample size. Normally, only mean values and quantiles are calculated and sometimes influ-
encing factors are described.12 Table 1 summarizes these studies. Compared to bonds, loans
exhibit a higher recovery rate. Whereas for bonds the recovery rate amounts on average to
11 We only consider empirical studies that analyze the recovery rate at the time of default. 12 However, Renault and Scaillet (2004) show that the density function of bond recovery rates cannot be de-scribed only knowing the mean value and the variance. They identify density functions of recovery rates and discuss methods for the non-parametric estimation of the distribution.

5
about 40, for bank loans it is on average 75. The recovery rate of loans may be higher because
creditors of loans are better off in case of the liquidation of the company. Furthermore, banks
have more influence on the company because of covenants and the possibility to renegotiate
the contract.13
Authors country Data years RR Number Asarnow and Edwards (1995) US bank 70-93 65,2 831 Asarnow and Edwards (1995) US bank 70-93 87,3 89 Carty and Lieberman (1996) US capital market 89-96 71,0 58 Carty and Lieberman (1996) US capital market 90-96 79,0 229 Grossman et al. (1997) US capital market 91-97 82,0 60 Grossman et al. (1997) UK capital market 91-97 68,1 14 Felsovalyi and Hurt (1998) LA bank 70-96 68,0 1149 Eales and Bosworth (1998) AU bank 92-95 69,0 5782 Carty (1998) US capital market 86-97 87,0 200 Carty (1998) US capital market 86-98 70,0 98 Hamilton and Carty (1999) US capital market 82-97 84,3 195 van de Castle et al. (1999) US capital market 87-97 84,5 258 Bartlett (2000) UK capital market 96-00 76,5 55 Gupton et al. (2000) US capital market 89-00 69,5 181 van de Castle et al. (2000) US capital market 87-96 83,5 264 Kabance (2001) MX capital market 95-01 40,0 70 O'Shea et al. (2001) US capital market 97-00 73,0 35 Hamilton et al. (2002) US capital market 82-01 71,3 n.s. Bos et al. (2002) US capital market 88-01 83,5 528 Hamilton et al. (2004) US capital market 03 86,0 21 Keisman (2003) US capital market 88-03 78,8 750 Araten et al. (2004) US bank 82-99 60,2 3761 Franks et al. (2004) UK bank 84-03 75,0 1418 Franks et al. (2004) F bank 84-03 52,9 586 Franks et al. (2004) G bank 84-03 61,4 276 Table 1: Empirical studies concerning the recovery rate of loans14
The value of the collateral in comparison to the exposure at default (in the following
the quota of collateral), the seniority, the size of the company, the industry classification and
macroeconomic conditions are considered the most influential factors on the recovery rate.
The importance of the quota of collateral is emphasized in all studies that analyze influencing
factors. Loans partially or completely covered by collateral exhibit a higher recovery rate due 13 See Amihud et al. (2000), p. 116. 14 The abbreviations stand for: US (USA), UK (United Kingdom), LA (Latin America), AU (Australia), MX (Mexico), F (France), G (Germany), and n.s. (not specified).
6
to the realization of the underlying collateral.15 Furthermore, the recovery rate rises if the
claims are better off in the case of the liquidation of the company.16 Different are the results
concerning the size of the company.17 These differences may be due to the common small
sample size and special features of the loan portfolios of the banks. Additionally, Grossman et
al. (1997), Brennan et al. (1998), Bartlett (2000), Grossman et al. (2001), O`Shea et al.
(2001), Kabance (2001) and Araten et al. (2004) emphasize the impact of the industry classi-
fication, whereas Gupton et al. (2000) and Franks et al. (2004) detect no significant impact of
this classification. Altman et al. (2001), Gupton and Stein (2002), Altman et al. (2004), Ara-
ten et al. (2004) and Franks et al. (2004) show that the recovery rate increases in mac-
roeconomically good conditions. Acharya et al. (2004) emphasize that the impact depends on
the factor that represents the macroeconomic condition. Franks et al. (2004) discover no sig-
nificant influence on the quotient’s recovery rate of the exposure at default and the size of the
company. The variety of the empirical results shows that the recovery rate depends intensely
on the data set and the calculation method.18 It must be mentioned that most of these studies
analyze the impact on the recovery rate only based on a univariate method, normally the com-
parison of mean values of two groups.19
Based on empirical results Moody`s Loss CalcTM is the first important commercial
model that considers both macroeconomic factors and specific factors of the borrower to es-
timate the recovery rate at the time of default (immediate version) and one year after default
(one-year version) for bank loans, bonds and preferred stocks.20 In the immediate version nine
and in the one-year version eight factors serve as influencing factors concerning the group’s
15 See Carty (1998), Gupton et al. (2000), Thorburn (2000), Hamilton et al. (2001), Kabance (2001), Bos et al. (2002), Emery et al. (2003), Araten et al. (2004) and Franks et al. (2004). 16 See Gupton et al. (2000), Thorburn (2000) and Bos et al. (2002). 17 Eales and Bosworth (1998), Felsovalyi and Hurt (1998) and Kabance (2001) identify a negative correlation between the size of the company and its recovery rate, whereas Asarnow and Edwards (1995) verify a positive correlation. Carty and Lieberman (1996), Bartlett (2000), Thorburn (2000) and Franks et al. (2004) identify no correlation between the size of the company and its recovery rate. 18 Araten et al. (2004) describe the sensitivity of the results varying the discounting rate. 19 See for example Franks et al. (2004) as the only study for continental Europe. 20 For an explicit description of the model see Gupton and Stein (2002).

7
“debt instrument and seniority”. “macroeconomic condition”, “industry classification” and
“capital structure of the company”, whereas the factors are not specified explicitly. Gupton
and Stein (2002) show that the use of this model for bonds leads to a better estimation quality
than the use of historical means. Later, Standard & Poor`s developed LossStatsTM to predict
recovery rates. There are different versions of the estimation model for the USA, United
Kingdom, France and Germany. The influencing factors can be divided into “quality of the
collateral”, the “seniority of the debt instrument” and “macroeconomic and industry specific
default rates”.
Treatment of recovery rates in credit risk models
Studies that critically analyse the assumptions concerning recovery rates in credit
risk models can be divided into two groups: the first deals with assumptions of the distribu-
tion of recovery rates. Renault and Scaillet (2004) show the extent of estimation errors that
arises if the usually assumed beta distribution is used for the value-at-risk calculation.21 The
second group of studies discusses the assumption of independence between the probability of
the borrower’s default and its recovery rate.22 Actually, we do not know of an empirical study
that analyzes this correlation for loans. Wilson (1997), Carey (1998), Altman and Brady
(2001), Altman and Bana (2002) and Altman and Fanjul (2004) detect a negative correlation
for bonds between these two factors.23 In addition, Löffler (2003), Altman et al. (2001, 2004)
and Chabaane et al. (2004) emphasize the important impact of these assumptions on the ex-
pected loss of a loan portfolio. Because of the discussion about this correlation, much work
has been done over the last few years to consider this correlation more thoroughly.24 Frye
(2000a, 2000b) present models that use macroeconomic conditions that both cause the default
21 For a description of the treatment of recovery rates in credit risk models also see Hu and Perraudin (2002). 22 CreditRisk+ implies a constant recovery rate, whereas CreditMetrics, Credit Portfolio View and the KMV-model assume stochastic (for the most part beta distributed) recovery rates. 23 In contrast: Acharya et al. (2004), who detect a positive correlation and Carey and Gordy (2003) who find no correlation. 24 See Altman et al. (2003).

8
of the borrower and decrease its recovery rate.25 Thereby the dependence of these two pa-
rameters of one systematic factor is justified, because in the case of the borrower’s default, the
value of the collateral deteriorates and the recovery rates declines.26
3. Hypotheses concerning potential influencing factors on the recovery rate
In addition to the described influencing factors on the recovery rate in the literature,
more factors can be detected and divided into these four groups: features of the borrower,
details of the business connection, terms of credit and macroeconomic factors. Particularly the
influence of the business connection’s intensity is interesting because it is yet only nominally
analyzed. Figure 1 summarizes the most important factors of these groups.
25 Frye (2000a) uses an equation that determines the value of the collateral to define the recovery rate, whereas Frye (2000b) models the recovery rate directly. 26 Jarrow (2001), Jokivuolle and Peura (2003), Pykhtin (2003), Düllmann and Trapp (2004), and Chabaane et al. (2004) present further models that determine the correlation between the probability of default and the recovery rate. 26 Jarrow (2001), Jokivuolle and Peura (2003), Pykhtin (2003), Düllmann and Trapp (2004), and Chabaane et al. (2004) present further models that determine the correlation between the probability
Features of the borrower: - creditworthiness (*) - size of the company (*) - industry classification (*) - legal form of the company (*) - number of creditors - age of the company - structure of the balance sheet - country
Recovery RateMacroeconomic factors - economic condition (*) - default rates (*) - interest rate level (*)
Business connection: - intensity (*) - length

9
Figure 1: Potential influencing factors on the recovery rate
Because of the assumed important influence on the recovery rate and the data availability, the
factors marked with (*) are analyzed in the empirical study. The following hypotheses are
described and indicate studies that support the hypothesis or disagree with it.
H1: Because of the detected negative correlation’s transfer from bonds to loans between
the probability of the borrower’s default and its recovery rate, loans of companies with
good creditworthiness possess a higher recovery rate.
Not yet discussed in the literature about loans.
H2: Loans to limited-liability corporations exhibit a lower recovery rate in comparison to
loans to non-limited-liability corporations because of the nonexisting liability of the
participators.
Not discussed in the described literature.
H3: The control of the restructuring or liquidation process of large companies is more
complicated for the creditors. This leads to both a minor influence of a single creditor
and a prolongation of the work-out-process.27 Consequently, large companies possess
a lower recovery rate.
pro: Asarnow and Edwards (1995), Eales and Bosworth (1998), Felsovalyi and
Hurt (1998), Kabance (2001).
27 The prolongation of the work-out-process leads to stronger discounting of later payments. This effect reduces the recovery rate. In addition, the financing of large companies is normally based on more creditors, that tenden-tially complicates the work-out-process. Brunner and Krahnen (2004) show that the existence of a large banking pool in comparison to a small one prolongates the work-out-process.
Terms of credit: - value of collateral (*) - life of a loan - exposure at default (*) - seniority - length of the work-out-process - syndication - costs of the work-out-process (*)

10
con: Carty and Lieberman (1996), Bartlett (2000), Thorburn (2000), Franks et al.
(2004).
H4: Companies with different industry classifications exhibit differences concerning the
structure of the balance sheet, for example the intensity of investments. This fact leads
to recovery rates that are dependent on the industry classification of the company.
pro: Grossman et al. (1997), Brennan et al. (1998), Bartlett (2000), Grossman et
al. (2001), O’Shea et al. (2001), Kabance (2001), Araten et al. (2004).
con: Gupton et al. (2000), Franks et al. (2004).
H5: A higher exposure at default leads to a more intensive enquiry of the company’s cred-
itworthiness. Under the assumption of the risk standardization hypothesis28 and the
negative correlation between the probability of default and the recovery rate, the re-
covery rate rises with a higher exposure at default. Furthermore, banks intensify their
effort in the work-out-process if high losses could appear.29
con: Franks et al. (2004).30
H6: The receiving of collateral increases the payments because the collateral can be sold in
the work-out-process and thus leads to a higher recovery rate. Furthermore, companies
with a high creditworthiness can signal their quality providing collateral. Under the as-
sumption of a negative correlation between the probability of default and the recovery
rate this causes a higher recovery rate.
pro: Carty (1998), Gupton et al. (2000), Kabance (2001), Emery (2003), Araten et
al. (2004), Franks et al. (2004).
28 The risk standardization hypothesis signifies that banks do not assign a loan if the probability of default ex-ceeds a determined level. A more intensive enquiry of the creditworthiness leads to a higher probability that companies with a high probability of default can be detected. 29 As shown in the following empirical study, a positive correlation between the exposure at default and the size of the company exists. This fact has to be considered analyzing the hypotheses 3 and 5. 30 Franks et al. (2004) show that the ratio of the exposure at default and the size of the company has no influence on the recovery rate.

11
H7: High outpayments of the bank within the work-out-process indicate problems with this
process, for example in selling the collateral. Therefore, the recovery rate decreases if
the outpayments within the work-out-process increase.
Not discussed in the described literature.
H8: A high intensity of the bank-borrower relationship increases the possibility to receive
collateral. In addition, banks have more influence on the business policy and the work-
out-process of the company. Therefore, the recovery rate increases if the intensity of
the bank-borrower relationship rises.31
pro: Franks et al. (2004).
H9: Collateral loses less in value in macroeconomic good conditions. In addition, the
lengths of the work-out-process decreases, as the courts have less work to do. Fur-
thermore, under good economic conditions the probability rises that the company can
proceed to run its business after the work-out-process.32, 33
pro: Altman et al. (2001, 2004), Gupton und Stein (2002), Araten et al. (2004),
Franks et al. (2004).
These hypotheses are summarized in table 2 stating their influence on the recovery rate and
the observed variables.34 The detailed definitions of these variables are described in appendix
A. The main loan is defined as that loan with the highest exposure, because only the entire
exposure and the main loan are stated in the data set. According to the literature, the specifica-
tions of the parameters concerning the annual financial statements correspond to the last
statement before the occurrence of the default event. Due to the lack of direct specifications
31 Machauer and Weber (1998) analyze the impact of the existence of a house bank relationship. They show that banks receive more collateral if they are in a house bank relationship with the company. In return, these compa-nies get higher loan exposures. 32 Companies that can proceed to run their business possess a higher recovery rate. See chapter 5.2 and Franks et al. (2004). 33 Furthermore, Shleifer and Vishny (1992) develop a model assuming that the work-out-process of companies in financial distress is more expensive if the financial situation of the competitors is bad. 34 The outpayments of the bank within the work-out-process can normally be calculated at the end of the work-out-process. For this reason, this variable is suited only on a limited scale for the recovery rate estimation model.

12
regarding the business connection, the multiple conclusion of loan contracts, the distance
from the domicile of the borrower and the bank, and the logarithmized ratio of the exposure at
default and the total assets are used as proxies for the intensity of the business connection.
The growth of the gross domestic product (GDP), the monthly inflation rate in comparison to
the rate in the previous year, the yearly depreciations of the volume of credit of German
commercial banks that are published by the OECD35 and the interbank interest rate serve as
proxies for the macroeconomic environment. In particular, the depreciation quota appears
meaningful because it describes the specific situation of the German banks. The indication
(0,1) signifies a dummy variable36, whereas “ln” indicates the logarithm of the value of the
variable. This logarithmization lowers the influence of specifications that strongly deviate
from the mean value.
influencing factor Variable influence features of the borrower
H 1 creditworthiness of the borrower risk premium + H 2 form of company capital company (0,1) -
ln (turnover) - H 3 size of the company ln (total assets) - H 4 industry classification various industries (0,1)37 0
terms of credit H 5 exposure at default ln (EAD) + H 6 value of collateral quota of collateral + H 7 costs of the work-out-process sum of discounted outpayments -
35 See Organisation for Economic Co-operation and Development (2003). In the following empirical analysis the ratio of the depreciations of the volume of credit and the volume of credit of the default year is calculated and named depreciation quota. These specifications are available for the years 1992 to 2001. 36 This variable is provided with the value of 1 if the borrower applies to this characteristic otherwise it amounts to 0. 37In the empirical analysis the following the companies are categorized into the following industries: real estate, car industry, building industry, manufacturing industry, supply of services and others.

13
business connection multiple conclusion of loan contracts (0,1) +
distance (0,1) - H 8 intensity of the business connection
ln (fraction of total assets) + macroeconomic factors
growth of the GDP + inflation rate + depriations of banks - H 9 economic condition
interbank interest rate + Table 2: Hypotheses concerning the potential influencing factors. The “+” (“-“) indicates that a value increase for the factor leads to higher (lower) recovery rate. With regard to dummy variables the “+” (“-“) means that the existence of the characteristic raises (lowers) the recov-ery rate. The “0” indicates that the hypothesis does not give evidence concerning the influence of the factor.
4. Data set
The data set contains information about 120 borrowing companies from one large
German bank that defaulted in the years 1992 to 2003. The data was collected from employ-
ees of the bank based on credit files and provided to the authors after electronic data process-
ing. Only companies with a completed work-out-process are taken into account. This means
that the bank anticipates no further payments from these companies. This is the reason for the
small number of borrowers in the years 2002 and 2003. The main features of the following
empirical analysis are summarized in table 3 and 4.
legal form of the company (120)
capital companies: 58 business partnerships: 62
period of defaults (120)
1992: 4 1995: 7 1998: 9 2001: 17 1993: 4 1996: 15 1999: 25 2002: 3 1994: 9 1997: 10 2000: 16 2003: 1
default event (119)

14
provisions for risk/depreciations: 54 filing for insolvency: 3 transfer to the work-out-group: 50 cancellation of the loan: 3 delay of payment: 6 restructuring of the company: 3
industry classification (119) manufacturing industry: 31 real estate: 30 Building industry: 21 car industry: 10 supply of services: 9 others: 18
number of loans (117)
one loan: 26 more than one loans: 91
Distance (120) 38
more than 150 kilometers: 36 less than 150 kilometers: 84
Table 3: Description of the data set. The numbers in brackets indicate the number of borrow-ers who apply to specific characteristic.
The recovery rate is calculated as a work-out-recovery rate. The calculation is based
on the borrower level and not on that of the single loan to consider the lien within the terms
and conditions of banks. This work-out-recovery rate includes neither potential tax advan-
tages because of reserves for bad debt and depreciations nor costs of capital commitments.
The influence of different recovery rate-definitions is described later. An interest rate of 5%
per year is assumed for the whole observation period for discounting future payments. This
period of investigation enables an analysis of the recovery rate both in bad and good macro-
economic situations.
Except for the macroeconomic factors the metric potential influencing factors are
described in table 4. The size of the companies varies highly as measured by the turnover and
the total assets.39
38 150 kilometers is the average distance between the domiciles of the bank and the borrower in the dataset. 39 Because of the fact that only a few very large companies are included in the data set, the median of the total assets amounts to 6,7 mill., of the turnover to 10,0 mill. and of the exposure at default to 2,4 mill..
15
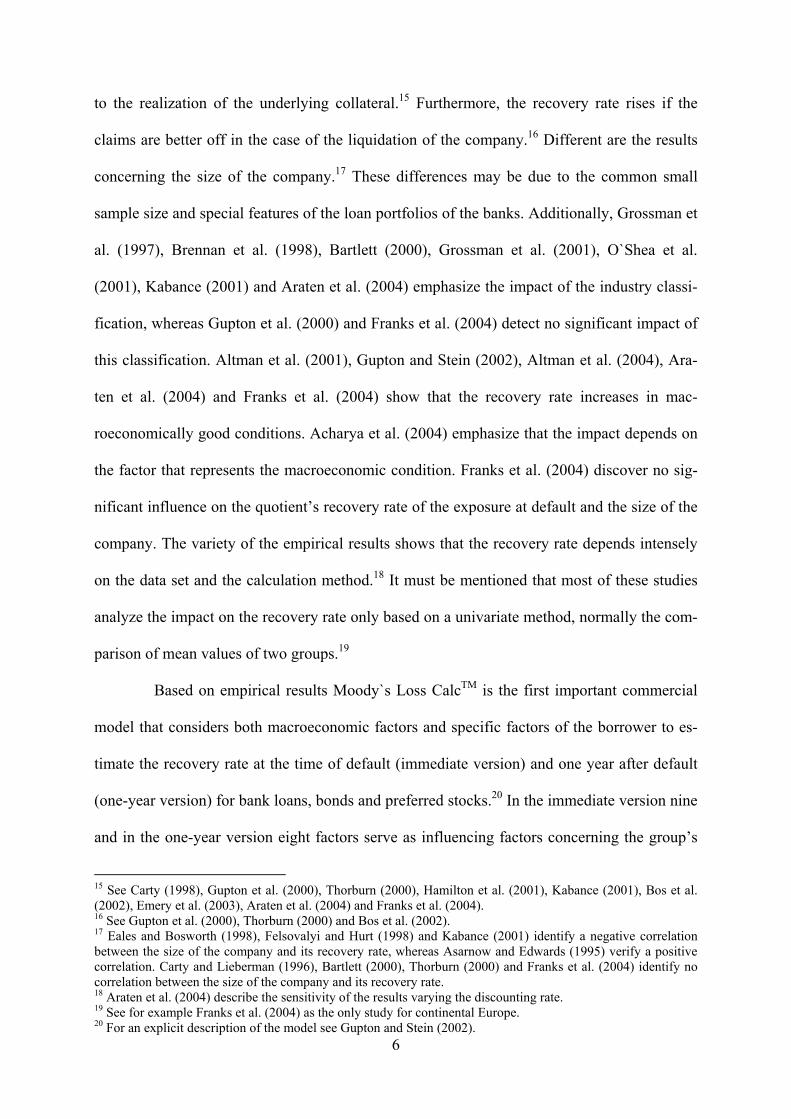
influencing factor mean std.dev. min. max. number
risk premium in %40 3.2367 1.6671 -0.113 9.688 116
turnover in mill. Euro 347.27 2350 0.00 20451 76
total assets in mill. Euro 27.30 1.66 0.025 14153 79
exposure at default in mill. Euro 5.59 10.70 0.052 93.2 117
quota of collateral in % 30.87 30.77 0 100 70
sum of discounted payments in Euro 31468 66117 296 501435 115
fraction of total assets 20.687 28.58 0.034 96.583 78 Table 4: Specifications of the influencing factors of the empirical analysis
The correlations between the independent variables of the regression analyses of the
following section that were defined in section 3 are shown in table 5. This investigation is
important for the later multivariate analyses. As expected, there is a strong positive correlation
between the logarithmized turnovers and total assets of the companies. In addition, the expo-
sure at default rises in connection with an increase of these two factors. Furthermore, the sum
of the discounted outpayments of the work-out-process is positively correlated with the expo-
sure at default. Even the negative correlation of the exposure at default and the fraction of this
exposure of the total assets with the turnover and the total assets seems to be consistent, be-
cause larger companies typically use loans from multiple lenders and sources. The other two
potential influencing factors concerning the intensity of the business connection are positively
correlated. Besides these correlations, the other dependencies that affect the macroeconomic
factors have to be considered in the following regression analyses.41
1 2 3 4 5 6 7 8 9 10 11 12 131 risk premium
40 The effective yield is the last agreed interest rate before the default event. According to the statement of the bank, the effective yield is frequently adjusted during the life of the loan. Since 1998 the Euribor is subtracted from the effective yield because the Fibor is not longer available. 41 Bigus et al. (2004) describe empirical studies that detect interrelations between the quota of collateral, the size of the company, the legal form of the company, the exposure at default, the creditworthiness, the intensity of the business connection and macroeconomic factors. The relationship of the quota of collateral and the creditworthi-ness will be discussed in chapter 5.2.

16
2 capital company 0.07
3 ln (turnover) -0.04 0.07
4 ln (total assets) 0.01 -0.03 0.76
5 ln (EAD) -0.08 0.18 0.43 0.54
6 quota of collateral 0.12 -0.06 -0.17 -0.14 -0.07
7 outpayments WOP. 0.14 0.02 -0.01 0.07 0.25 0.10
8 multiple loan contracts -0.12 -0.05 -0.05 -0.02 -0.00 -0.00 -0.07
9 distance -0.12 -0.09 0.05 -0.24 -0.27 0.04 -0.10 -0.34
10 ln (fraction total assets) -0.09 0.11 -0.63 -0.85 -0.01 0.01 0.07 0.00 0.10
11 growth of GDP -0.21 0.08 0.08 0.01 0.02 0.03 0.14 -0.08 -0.08 -0.06
12 interbank interest rate -0.24 0.05 0.17 0.11 0.10 0.13 0.07 -0.00 0.04 -0.04 0.25
13 inflation rate -0.11 0.02 0.09 0.02 0.03 0.19 0.07 0.05 0.06 0.05 0.12 0.76
14 depreciations quota -0.03 -0.06 -0.17 -0.20 -0.02 0.07 -0.05 -0.05 0.05 0.30 -0.23 0.42 0.62
Table 5: Description of the correlations between the potential influencing factors.42 The indi-cation of the columns is carried out only in terms of the specification of the numbers that are dedicated to the variables in the first column. If the correlation coefficient is statistically sig-nificant at the 5% level different from zero the corresponding field is highlighted.43
5. Results of the empirical analyses
The distribution of the recovery rates of the borrowers, the temporal development
and the influence of alternative recovery rate-definitions are analyzed in this section. Subse-
quently, the stated hypotheses with regard to potential influencing factors are tested.
5.1 Distribution of recovery rates
Very similar to the analyses described in section 2, the mean value of the recovery
rates of the borrowers taken into account amounts to 72.45. The fraction of recovery rates
closed to 100 is very high. This can also be expressed regarding the median of 91.77 com-
pared to the lower mean. In figure 2, the borrowers are ordered starting with the borrower that
exhibits the lowest recovery rate.44 This finding supports the critique of Renault and Scaillet
(2004) on the commonly assumed beta distribution used in credit risk models. After the
42 Although the variables 2, 8 and 9 are dummy variables, they are nevertheless included in the analysis of corre-lation for the purpose of a better overview. 43 On the 10% level, no further coefficient would be statistically different from zero. 44 A negative recovery rate indicates that the sum of the discounted outpayments is higher than that of the incom-ing payments.

17
weighting of the recovery rates with their exposure at default the mean value yields to 71.91.
This value deviates marginally from the (not weighted) mean recovery rate of 72.45. The re-
covery rates of companies that continue to run their business is significantly higher (81.71)
than that of borrowers that have to be liquidated (62.94).45
-60,00-40,00-20,00
0,0020,0040,0060,0080,00
100,00
borrower
reco
very
rate
work-out-recovery rate mean median std.dev. 72.45 91.77 35.64
EAD-weighted recovery rate 71.91
010203040506070
<0 0-20 20-40 40-60 60-80 80-100
Figure 2: Distribution of the recovery rates
Figure 3 shows the potential influence of macroeconomic factors that is described in
the literature and postulated in hypothesis 9, in which the recovery rates are illustrated subject
to the date of the default event of the borrower. The low recovery rate in the year 1998 in
comparison to the years before and after may be due to the fact that only 9 borrower defaulted
in this year. Therefore, the probability of a deviating mean value rises.46 The following em-
pirical analysis should (among other things) investigate the question if the recovery rate is
significantly higher in years under good rather than under bad macroeconomic conditions.
45 This finding is consistent with the results of Franks et al. (2004). In our study, 48 companies can continue to run their business whereas 72 are liquidated in the course of the work-out-process. 46 In addition, a modification of the German insolvency law took place at the beginning of the year 1999. Poten-tially, this fact could delay default events.

18
Figure 3: The mean values of recovery rates subject to the date of the default event
The way to calculate the work-out-recovery rate, that on average amounts to 72.45,
also has to be used applying the advanced IRB approach in the framework of Basel II.47 Dis-
counting only the incoming payments during the work-out-process, the mean recovery rate
amounts to on average 74.03. Consequently, the discounted outpayments lower the recovery
rate by 1.58 to the above value of 72.45. In other words, the bank loses on average 1.58% of
the exposure at default due to outpayments during the work-out-process. To identify the fac-
tors influencing this value a linear regression analysis is addressed. The result is that this
value decreases if the creditworthiness (again measured by the risk premium) and the expo-
sure at default increase.48 Indeed, a high quota of collateral leads to an increase in this sum of
discounted outpayments that are generated due to a realization of collateral in relation to the
exposure at default. However, this influence is statistically not significant.
So far, no costs of capital commitments are considered on the part of exposure at de-
fault that cannot be regained.49 These costs are economically reasonable because this part can
47 See Basel Committee on Banking Supervision (2004), paragraph 460, where both the consideration of direct and indirect costs and the discounting of future payments are postulated. 48 Expectedly, the sum of the discounted outpayments (without dividing the sum by the exposure at default) rises if the exposure at default increases. 49 The costs of capital commitments of the regained part of the exposure at default are considered in terms of discounting future payments to the time of default.
1992 1993 1994 1995 35.65 28.38 57.45 71.66
1996 1997 1998 1999 78.30 79.93 46.18 88.36
2000 2001 2002 2003 84.04 71.02 64.29 51.68
0,00
20,00
40,00
60,00
80,00
100,00
1992
1993
1994
1995
1996
1997
1998
1999
2000
2001
2002
2003
reco
very
rate

19
not be invested to yield interest. After considering this loss of interest the recovery rate de-
creases from its original value of 72.45 to 62.96.50
Finally, potential tax advantages for the bank due to reserves for bad debt and depre-
ciations are discussed. Reserves for bad debt and depreciations lower the annual net profit and
for this reason the fiscal outpayments. According to the bank’s statement, this effect increases
the recovery rate with the value of 6.22. The influence of different recovery rate-definitions is
described in figure 4.
Figure 4: Recovery rate using different definitions51
The fact that the mean work-out-recovery rate (72.45) is much higher than the aver-
age quota of collateral (30.62) reveals that in the course of the recovery rate-prediction not
only payments due to the realization of collateral have to be considered.52 The following
analyses try to expose which factors influence the level of these payments.
5.2 Influencing factors on the recovery rate
Before investigating the combined influence of multiple factors, an analysis of pos-
sible correlations between factors and the recovery rate should provide an initial indication of
the impact of these factors. If the factors are defined as dummy variables the differences of 50 The calculation of costs of capital commitments ends at the end of the work-out-process. 51 The first column indicates the work-out-recovery rate (72.45) that is the basis for the following empirical analysis. The second column (74.03) is generated disregarding the sum of discounted outpayments. Based on the original recovery rate (72.45), the value decreases to the value of 62.96 if potential tax advantages are considered as shown in the third column. The fourth column (69.18) additionally considers the tax advantages due to re-serves for bad dept and depreciations 52 Franks et al. (2004) point out that the quota of collateral in Germany is much lower in comparison to other European countries. (see Franks et al. (2004), p. 70).
0
20
40
60
80
100
1 2 3 4
reco
very
rate

20
the mean values of the recovery rate dependent on the specification of the dummy variable (0
or 1) are tested for statistic significance. In comparison to the multivariate regression analysis,
this univariate analysis is advantageous in that it maximizes the sample size per factor.
The results of these analyses are presented in table 6. With regard to the signifi-
cance, the hypotheses 1, 3, 6, 7, 8 and 9 can be confirmed. In respect to the macroeconomic
factors hypothesis 9 can only be confirmed based on the appreciation quota of German banks.
In addition to the analyses presented in table 6, the coefficients concerning the industry classi-
fication are tested whether the hypothesis of equal mean values of the regarded industries can
be rejected using the ANOVA-analysis. Because this is not the case, no statistical evidence is
provided for the influence of the industry classification on the recovery rate.
part A: Correlation coefficients on the basis of Bravias and Person coefficient n coefficient n
risk premium -0.2069 ** 113 ln (fraction total as.) 0.2211 * 78 ln (turnover) -0.1770 75 groth of GDP 0.1230 113 ln (total assets) -0.2839 ** 78 interb. interest rate -0.1511 113 ln (EAD) -0.1311 117 inflation rate -0.0858 113 quota of collateral 0.2526 ** 70 depreciation quota -0.2111 ** 113 sum outpayments -0.2382 ** 115
***, **, * indicates that the coefficient is significantly different to 0 on the 1%, 5% and 10% level using the two tailed t-test. part B: Mean values depending from the characteristic of the dummy variable
mean (0) mean (1) N capital company 75.53 69.20 117 real estate 73.14 70.14 116 car industry 72.77 68.10 116 Building industry 72.02 74.02 116 manufacturing industry 70.08 79.21 116

21
supply of services 73.73 53.98 116 Multiple conclusion of loans 59.00 76.29 * 117 Distance 76.61 62.29 * 117
***, **, * indicates that the mean values significantly differ on the 1%, 5% and 10% level using the Wicoxon-ranksum test. Table 6: Influence of the factors using univariate methods
The aim of the following regression analyses is to investigate the combined influ-
ence of multiple independent variables on the dependent variable, in this instance the recovery
rate. As demonstrated in table 6, not all borrowers possess specifications for all of the factors.
For this reason, in the first regression analysis only such variables are considered that are al-
most completely available.53 The result of the regression analysis with the largest sample size
is outlined in column (1) of table 7. Respectively, the appropriate independent variable is
added to the regression (1) to analyze the influence of the other factors on the basis of a pref-
erable large sample size. Therefore, the values in the columns of table 7 are the results of dif-
ferent regression analyses.
(1) (2) (3) (4) (5) (6)
Constant 106.2 (41.1)
*** 121.0 (53.6)
** 111.2 (49.7)
** 42.12 (69.3)
96.55 (80.7)
* 170.1 (46.7)
***
risk premium -4.09 (2.04)
** -4.93 (2.71)
* -3.97 (2.61)
-5.27 (3.09)
* -3.97 (2.61)
-4.64 (2.00)
**
capital company -4.23 (6.48)
-6.63 (8.12)
-8.84 (7.63)
0.74 (9.72)
-8.84 (7.63)
1.05 (6.45)
ln (EAD) -1.01 (2.60)
-1.01 (3.52)
1.24 (3.54)
2.47 (4.25)
-1.94 (2.97)
-1.95 (2,53)
sum outpayments -0.10 (0.05)
** -0.10 (0.06)
* -0.10 (0.05)
* -0.07 (0.08)
-0.10 (0.05)
* -0.10 (0.05)
**
multiple conclusion of loans
14,90 (7.57)
* 14.72 (10.1)
19.38 (9.60)
** 20.51 (11.41)
* 19.38 (10.0)
** 17.60 (7.42)
**
growth of GDP 11,05 (4.45)
** 8.33 (5.55)
7.89 (5.19)
9.25 (6.22)
7.89 (5.19)
5.57 (4.96)
interbank interest rate -13,33 (4.42)
*** -8.77 (5.23)
* -8.30 (4.94)
* -12.06 (6.30)
* -8.30 (4.94)
* -12.55 (4.25)
***
53 Based on the findings of the comparison of the mean values the dummy variables for the industry classifica-tion are not used in the regression analyses because they largely lower the quality of the analyses. Furthermore, the depreciation quota of German banks does not serve as an independent variable because no information is available for the years 2002 and 2003, so the use would highly shorten the period of investigation. Considering the intensity of the business connection, only the multiple conclusions of loans are regarded because this variable is negatively correlated with the variable concerning the distance between the bank and the borrower.

22
inflation rate 11,78 (7.32)
12.91 (9.30)
11.30 (8.77)
5.49 (10.75)
11.30 (8.77)
14.85 (7.78)
*
ln (turnover) -1.43
(1.48)
ln (total assets) -3.18
(1.86) *
quota of collateral 0.38
(0.16) **
ln (fraction total assets)
3.18 (1.86)
*
depreciation quota -73.00
(41.0) *
sample size 111 72 75 64 75 102
adjusted R2 0.1498 0.1414 0.1840 0.1353 0.1840 0.2158
Table 7: Results of the linear regression analyses. ***, **, * indicates that the coefficient is significantly different from 0 on the 1%, 5% and 10% level using the two tailed t-test. The standard deviations of the coefficients are presented in brackets.
The results of the regression analyses confirm the influence of the creditworthiness
of the borrower, the size of the company, the quota of collateral, the sum of discounted out-
payments due to the work-out-process, the intensity of the business connection and macro-
economic factors. With regard to the macroeconomic factors it can be stated that the inflation
rate is not important for the prediction of the recovery rate. To describe the impact of the cor-
relations between the independent variables, as addressed in section 4, initially both the
growth of the GDP and the interbank interest rate are removed from regression (1) as these
factors are negatively correlated with the risk premium. Compared to the results described in
table 7 neither the sign of the coefficients nor the significance54 of the other independent vari-
ables change whereas only the significance level of the risk premium declines to the 10%
level. Disregarding the logarithmized exposure at default in regression (1) owing the correla-
tion with the sum of discounted outpayments the result is the same.55 This is even the case
54 In both the actual and the following analyses concerning the robustness of the regressions, significance indi-cates that the significance level is at least 10%. 55 Again, the significance level of the risk premium declines to the 10% level.

23
when removing the inflation rate (correlation with the interbank interest rate).56 Neither the
sign of the coefficients nor the significance changes in regressions (2), (3) and (4) if the loga-
rithmized exposure at default is eliminated due to its correlation with the logarithmized vari-
ables with respect to the size of the company and the fraction of the exposure at default of the
total assets.57 To investigate the influence of the correlation of the depreciation quota of Ger-
man banks with other macroeconomic factors in regression (6) the latter factors are removed.
Again, no differences in comparison to regression (6) arise concerning the sign of the coeffi-
cients and the significance.58 Overall, the correlations of the independent variables influence
the results marginally.
The findings of the univariate and multivariate analyses are contrasted and compared
to the literature that mainly corresponds to the US-banking sector. As shown in table 8, it can
be stated that both the univariate and the multivariate analyses widely confirm or reject the
stated hypotheses in the same manner. Solely regarding hypothesis 9, which postulates the
influence of macroeconomic factors, the interbank interest rate has only an impact based on
the regression analyses.
hypothesis variable influence univariate analysis
influence regression analyses
features of the borrower 1 risk premium - ● - ● 2 capital company (0,1) -
ln (turnover) - - 3 ln (total assets) - ● - ●
4
real estate (0,1) car industry (0,1) building industry (0,1) manufacturing industry (0,1) supply of services (0,1)
- - + + -
terms of credit 5 ln (EAD) -
56 The significance level of the growth of the GDP and the risk premium declines to the 5% level, whereas that of the multiple conclusions of loans increases to the 5% level. 57 Only in regression (4) the significance level of the sum of the discounted outpayments declines to the 5% level. 58 The significance level of the risk premium decreases to the 5% level, whereas that of the depreciation quota of German banks rises to the 5% level.

24
6 quota of collateral + ● + ● 7 sum of discounted outpayments - ● - ●
business connection multiple concl. of loans (0,1) + ● + ●
distance (0,1) - ● not included in the regression analyses 8
ln (fraction total assets) + ● + ● macroeconomic factors
growth of GDP + + inflation rate - + depreciation quota - ● - ● 9
interbank interest rate - - ● Table 8: Results of the univariate and the multivariate analyses. In the columns “influence” the “+” (“-“) indicates that the increase of the value of the variable increases (decreases) the recovery rate. The “●” is denoted if the hypothesis is confirmed through the corresponding variable.
As indicated via the comparison of the recovery rate (72.45) and the quota of collat-
eral (30.87), the recovery rate-estimation should not only be based on the value of the collat-
eral. The results of the described empirical analyses support various hypotheses that postu-
lates - besides the quota of collateral as a term of credit - important influence of factors of the
features of the borrower and of the business connection. The impact of macroeconomic fac-
tors cannot be clarified explicitely.
The important impact of the borrower’s features on the recovery rate can be stated.
Furthermore, this analysis is consistent with those concerning bonds that detect a negative
correlation between the probability of default and the recovery rate. Because of the more
complicated restructuring or liquidation process of large companies, the recovery rate de-
creases if the size of the company increases. The difficult work-out-process seems to domi-
nate the assumption that large companies possess a better creditworthiness.59 In connection
with hypothesis 1 (creditworthiness of the borrower) this leads to a higher recovery rate. As
described, the influence of the size is controversial in the literature.
59 See Grunert et al. (2002), p. 1057, where this relationship is verified for small and medium companies (SME).

25
The important influence of the quota of collateral can even be detected in this analy-
sis because of the realization of the collateral as verified in the literature. Furthermore, com-
panies can signal their good creditworthiness by providing collateral.60 This assumption is
contradictory to the models of Manove and Padilla (1999, 2001) that assume a negative corre-
lation between the quota of collateral and the creditworthiness of the borrower because of a
less intensive analysis of the creditworthiness concerning loans provided with collateral.61 As
shown, companies possessing good creditworthiness exhibit a high recovery rate. The recov-
ery rate decreases with the increasing sum of the discounted outpayments. High outpaments
seem signal a complicated work-out-process.
The influence of the intensity of the business connection is only discussed in the lit-
erature on a small scale.62 In our study, if an intensive connection exists banks get a higher
recovery rate. This can be explained by both a better position in realizing the collateral and a
greater influence on the business policy of the company and the success of the work-out-
process.63
However, the other hypotheses 2, 4 and 5 cannot be confirmed. The liability of the
private means of business partnerships does not significantly raises the recovery rate. The
reason for this may be that capital companies exhibit a shorter work-out-process because of
the nonexistent liability of the participators. A short work-out-process leads to minor dis-
counting of future payments. Against the assumption that different structures in the balance
sheet influence the recovery rate, no statistically significant impact on industry classification
60 See Bester (1985), Chan and Kanatas (1985) and Besanko and Thakor (1987). 61 This assumption is approved both by empirical analyses that detect a minor quality of the ratings of loans provided with collateral (see Orgler (1970), Hester (1979), Scott and Smith (1986)) and by those that verify a higher risk premium of collateralized loans (see Berger and Udell (1990, 1992), Booth (1992), Booth and Chua (1996), Angbazo et al. (1998)). See Jiménez and Saurina (2004), p. 2194 per seq. 62 See Franks et al. (2004). 63 However, Jiménez and Saurina (2004) determine that for Spanish companies banks are more frequently will-ing to take higher credit risk if the business connection is intensive. In relation to the detected positive correla-tion between the creditworthiness and the recovery rate, this finding should lead to a lower recovery rate.

26
can be found, contrary to the literature with the exception of Gupton et al. (2002) and Franks
et al. (2004). Lastly, the exposure at default has no significant influence on the recovery rate.
Overall, no systematic country differences can be found when comparing our analy-
sis with that of other authors. Besides factors discussed in the literature, other factors seem to
have influence on the recovery rate. This has to be considered when developing a model for
the recovery rate prediction.
So far, multiple factors have been analyzed that influence the recovery rate with re-
spect to the whole range of values. Therefore, no evidence can be given as to whether these
factors have an influence on the fact that banks get exposure at default (almost) completely or
only to a very small extent. To investigate this question, in the first step the dummy variable
RR+ (0,1) is introduced. This variable amounts to 1 if the recovery rate of the borrower is
higher than 99. This is the case for 32 of the 120 borrowers. The result of the logistic regres-
sion analyses with RR+ (0,1) as dependent variable is shown in table 9. In contrast to the pre-
vious analyses, the important influence of the exposure at default can be recognized. The
probability of a bank to obtain a recovery rate larger than 99 rises with an increasing exposure
at default. This suggests that banks conduct a more intensive examination of the creditworthi-
ness of the borrowers if the exposure is high. This assumption in connection with the detected
positive correlation between the creditworthiness and the recovery rate leads to an increase in
the recovery rate. Considering the recovery rate, this finding shows that banks lower the dis-
advantages of default events of companies with high exposures at default. Furthermore, the
inflation rate at the time of the borrower’s default possesses a significant positive impact,
whereas this is not the case regarding the intensity of the business connection. Therefore, the
intensity of the business connection is especially important in those cases where the recovery
rate is low (equal or lower than 99).64
64 After removal of the growth of the GDP and the interbank interest rate from regression (1) due to the described correlations, the inflation rate loses its significance. If the inflation rate is eliminated from regression (1) and the

27
(1) (2) (3) (4) (5) (6)
constant -13.43 (4.12)
*** -8.47 (5.32)
-10.25 (5.40)
* -13.56 (7.08)
* -11.87 (5.65)
** -11.18 (4.45)
**
risk premium -0.16 (0.17)
0.43 (0.24)
* 0.32 (0.23)
-0.34 (0.27)
0.32 (0.23)
-0.15 (0.17)
capital company -0.68 (0.52)
-0.50 (0.68)
-0.90 (0.70)
-0.51 (0.83)
-0.90 (0.70)
-0.45 (0.54)
ln (EAD) 0.96 (0.27)
*** 0.75 (0.36)
** 1.11 (0.42)
*** 0.93 (0.43)
** 0.78 (0.33)
** 0.92 (0.27)
***
sum outpayments -0.04 (0.02)
* -0.07 (0.04)
* -0.05 (0.03)
-0.03 (0.03)
-0.05 (0.03)
-0.04 (0.03)
multiple conclusion of loans
0.56 (0.69)
-0.39 (0.92)
-0.11 (0.99)
1.01 (1.17)
-0.11 (0.99)
0.57 (0.68)
growth of GDP 0.57 (0.36)
0.37 (0.47)
0.51 (0.47)
0.47 (0.58)
0.51 (0.47)
0.34 (0.43)
interbank interest rate -0.82 (0.43)
* -0.79 (0.55)
-0.90 (0.56)
-0.11 (0.63)
-0.90 (0.56)
-0.83 (0.44)
*
inflation rate 1.00 (0.60)
* 1.92 (0.85)
** 2.03 (0.85)
** -1.13 (0.96)
2.02 (0.85)
** 1.11 (0.65)
*
ln (turnover) -0.08
(0.12)
ln (total assets) -0.35
(0.19) *
quota of collateral 0.01
(0.01)
ln (fraction total assets)
0.35 (0.19)
*
depreciation quota -2.47
(3.58)
sample size 111 72 75 64 75 102
pseudo R2 0.2194 0.2534 0.2708 0.2674 0.2708 0.2120
Table 9: Results of the logistic regression analyses with RR+ (0,1) as dependent variable. ***, **, * indicates that the coefficient is significantly different from 0 on the 1%, 5% and 10% level using the two tailed t-test. The standard deviations of the coefficients are presented in brackets.
To identify which factors influence the fact that banks receive a very low recovery
rate, the dummy variable RR- (0,1) is introduced taking the value 1 if the recovery rate is less
than 50. This is the case for 26 companies. As shown in table 10, the results of these logistic
regression analyses point out that - in contrast to the regression analyses with RR+ (0,1) as
macroeconomic factors with exception of the depreciation quota of German banks from regression (6) neither the signs nor the significances of the remaining coefficients change.

28
dependent variable – in particular those factors that influence very low recovery rates are im-
portant even in the regression analyses described in table 7 where the recovery rate serves as
dependent variable. The probability to obtain a recovery rate under 50 rises if the risk pre-
mium is high and both the growth of the GDP and the intensity of the business connection is
low.65
(1) (2) (3) (4) (5) (6)
Constant -2.09 (3.25)
-6.41 (4.86)
-4.96 (4.65)
2.50 (4.88)
-4.78 (4.70)
-10.33 (4.44)
**
risk premium 0.33 (0.17)
** 0.49 (0.27)
* 0.46 (0.27)
* 0.55 (0.30)
* 0.46 (0.27)
* 0.48 (0.21)
**
capital company 0.24 (0.53)
0.41 (0.74)
0.58 (0.76)
-0.03 (0.74)
0.58 (0.76)
-0.29 (0.63)
65 After implementation of the same modifications as those following the description of the results shown in table 7 with the recovery rate set as a dependent variable due to correlations between the independent variables, neither the signs nor the significances of the coefficients change.

29
ln (EAD) -0.00 (0.20)
0.18 (0.30)
0.12 (0.30)
-0.30 (0.31)
0.16 (0.26)
0.04 (0.23)
sum outpayments 0.00 (0.00)
0.00 (0.00)
0.00 (0.00)
0.01 (0.01)
0.00 (0.00)
0.00 (0.00)
multiple conclusion of loans
-1.26 (0.57)
** -1.23 (0.80)
-1.58 (0.78)
** -1.60 (0.84)
* -1.58 (0.78)
** -1.61 (0.66)
**
growth of GDP -1.14 (0.42)
*** -0.98 (0.56)
* -1.08 (0.56)
* -0.99 (0.51)
* -1.08 (0.56)
* -0.89 (0.52)
*
Interbank interest rate 0.94 (0.38)
** 1.06 (0.50)
** 1.07 (0.49)
** 0.99 (0.48)
** 1.07 (0.49)
** 1.32 (0.47)
***
inflation rate -1.09 (0.67)
-1.58 (0.93)
* -1.49 (0.90)
* -0.66 (0.82)
-1.49 (0.90)
* -2.12 (0.91)
**
ln (turnover) 0.06
(0.15)
ln (total assets) 0.04
(0.17)
quota of collateral -0.05
(0.02) ***
ln (fraction total assets)
-0.04 (0.17)
depreciation quota 10.77
(3.98) ***
sample size 111 72 75 64 75 102
pseudo R2 0.1763 0.2111 0.2305 0.3267 0.2305 0.2957
Table 10: Results of the logistic regression analyses with RR- (0,1) as dependent variable. ***, **, * indicates that the coefficient is significantly different from 0 on the 1%, 5% and 10% level using the two tailed t-test. The standard deviations of the coefficients are presented in brackets. 6. Conclusion and outlook
Whereas the probability of default of a borrower is intensely discussed in academic
literature, only a few studies exist concerning the recovery rate. The recovery rate is defined
as the payback quota of a defaulted borrower. Besides the impact of the decision in the grant-
ing of a loan and the determination of the effective yield, the recovery rate is gaining in im-
portance because of the Basel II-reform. Banks have to possess a suitable model to predict the
recovery rate if they use the advanced IRB approach in calculating their capital requirements
concerning credit risk. Banks that practice this approach should meet lower capital require-
ments. To develop this model, it is necessary for most banks to collect data about borrowers
that defaulted in the past to consider special features of the bank’s specific loan portfolio. To

30
restrict the extent of the data collection, it is important to be aware of the influencing factors
of past analyses. One problem is that these studies mainly concern the US-banking sector.
Country differences could exist because of deviating insolvency laws or specific features of
the companies.
This analysis provides information on the distribution of recovery rates for loans to
German companies and investigates factors that significantly influence the recovery rate. The
data set contains information about 120 companies that defaulted in the years 1992 to 2003.
No essential difference concerning the mean value of the recovery rates, which
amounts to 72.45, can be found in comparison to the results of studies in literature. Besides
the variation of the mean recovery rate during the period of investigation, which appears to be
caused by different macroeconomic conditions, the impact of different recovery rate-
definitions is highlighted. The recovery rate varies to a great extent from the normally used
work-out-recovery, that has also to be calculated using the advanced IRB approach according
to the Basel II-reform, considering the costs of capital commitments and tax advantages due
to reserves for bad dept and depreciations. The outpayments during the work-out-process
lower the recovery rate at an average with a value of 1.58. This value decreases if the com-
pany possesses good creditworthiness and a high exposure at default.
Factors that influence the recovery rate can be divided into the groups features of the
borrower, intensity of the business connection, terms of credit and macroeconomic factors.
Regarding factors analyzed in the literature, the impact of the company size can be con-
firmed.66 Consistent with Asarnow and Edwards (1995), Eales and Bosworth (1998),
Felsovayi and Hurt (1998) and Kabance (2001) the recovery rate decreases if the size of the
company rises. In contrast to most of the previous studies, but according to Gupton et al.
(2000) and Franks et al. (2004), no statistically significant impact of the industry classification
can be verified. The insight that a high quota of collateral leads to a higher recovery rate
66 This is the fact if the logarithmized total assets are investigated.

31
seems to be plausible because of the realization of the collateral. The impact of the macroeco-
nomic situation cannot explicitly be confirmed. As described in Acharya et al. (2004), the
findings differ using various factors to indicate the economic situation.
Besides these factors discussed, there exist many more that influence the recovery
rate but are not or only to a small extent yet analyzed for both bonds and loans. The negative
correlation between the probability of default and the recovery rate that is found for bonds can
be transferred to loans. For this reason, the commonly used formula to calculate the standard
risk costs determines an expected loss67 that can be too low. Furthermore, this correlation
leads to an underestimation of the credit risk of credit risk models. Even the influence of the
sum of the discounted outpayments during the work-out-process can be verified. To estimate
the recovery rate, the intensity of the business connection has to be considered. An intense
connection betters the access to collateral and increases the exertion of influence on the busi-
ness policy and the work-out-process of the company.
The exposure at default is important when analyzing the factors that cause a high re-
covery rate. If the exposure is high, the probability rises that the bank can achieve a high re-
covery rate. This may be due to the assumption that the bank intensifies the enquiry of the
creditworthiness and the monitoring of the borrower. In contrast, precisely those factors have
an impact on achieving a very low recovery rate, which even influence the whole range of
recovery rate values. The probability of receiving recovery rates under 50 rises if the risk
premium and the interbank interest rate are high and the intensity of the business connection
is low.
Future analyses based on a preferably large sample sizes are required to gain further
insights into the prediction of recovery rates similar to that of the probability of default. In this
context, the question should be discussed how far specifications of the bank complicate the
67 Expected loss = probability of default * loss given default * exposure at default.

32
transfer of a model that is not developed on the basis of internal data as it is the fact using the
described models of the rating agencies.
variable definition features of the borrower
H 1 risk premium effective yield of the main loan less the 3-month Fibor or Euribor
H 2 capital company (0,1) = 1, if the borrower is a capital company ln (turnover) logarithmized turnover H 3 ln (total assets) logarithmized total assets
H 4 various industry classifications (0,1)
= 1, if the company belongs to that industry classi-fication

33
terms of credit H 5 ln (EAD) logarithmized exposure at default
H 6 quota of collateral quotient of sum of the value of the collateral and the exposure at default
H 7 costs of the work-out-process sum of discounted outpayments
business connection multiple conclusion of loan contracts (0,1)
= 1, if more than 1 contract is concluded with the borrower
distance (0,1) = 1, if the domicile of the bank and the borrower are more than 150 kilometers away from each otherH 8
ln (fraction total assets) logarithmized quotient of the exposure at default and the total assets
macroeconomic factors
growth of GDP growth of the GDP of the default year in compari-son to the preceding year
inflation rate monthly inflation rate of month of the default event in comparison to the corresponding month of the preceding year
depreciation quota Depreciations on the loan portfolio of the German commercial banks of the default year divided by the quantity of the loan portfolio
H 9
interbank interest rate 3-month Fibor or Euribor at the time of the default event
Appendix A: Hypotheses and definitions of the variables concerning potential influencing factors Literature:
Acharya, V.V.; Bharath, S.T.; Srinivasan, A. (2004): Understanding the Recovery Rates on Defaulted Securities, Working Paper.
Altman, E.I. (1968): Financial Ratios, Discriminant Analysis and the Prediction of Corporate
Bankruptcy, Journal of Finance 23, S. 589-609.

34
Altman, E.I.; Haldemann, R.G.; Narayan, P. (1977): ZetaTM Analysis – A new Model to iden-tify Bankruptcy Risk of Corporations, Journal of Banking and Finance 1, 29-54.
Altman, E.I.; Brady, B. (2001): Explaining aggregate Recovery Rates on Corporate Bond De-faults, NYU Stern School of Business, Salomon Center Working Paper, New York, No-vember 2001.
Altman, E.I.; Brady, B.; Resti, A.; Sironi, A. (2001): Analyzing and Explaining Default Re-
covery Rates, ISDA Research Report, December 2001. Altman, E.I.; Bana, G. (2002): Defaults & Returns on High Yield Bonds: Analysis through
September 30, 2002, NYU Stern School of Business, Salomon Center Working Paper, New York, Oktober 2002.
Altman, E.I.; Resti, A.; Sironi, A. (2003): Default Recovery Rates in Credit Risk Modeling: A
Review of the Literature and empirical Evidence, Working Paper, Dezember 2003.
Altman, E.I.; Brady, B.; Resti, A.; Sironi, A. (2004): The Link between Default and Recovery Rates: Implication for Credit Risk Models and Procyclicality, erscheint in: Journal of Business.
Altman, E.I.; Fanjul, G. (2004): Defaults and Returns in High Yield Bond Market: Analysis
through 2003, NY Stern School of Business, Salomon Center Working Paper, January 2004.
Amihud, Y.; Garbade, K.; Kahan, M. (2000): An institutional Innovation to reduce Agency
Costs of public Corporate Bonds, Journal of Applied Corporate Finance, 114-121. Angbazo, L.A.; Mei, J.; Saunders, A. (1998): Credit Spreads in the Market of highly lever-
aged Transaction Loans, Journal of Banking and Finance 22, 1249-1282. Araten, M.; Jacobs, M. Jr.; Varshney, P. (2004): Measuring LGD on commercial Loans: An
18-Year internal Study, The RMA Journal 4, 96-103.
Asarnow, E.; Edwards, D. (1995): Measuring Loss on defaulted Bank Loans. A 24-Year-Study; Journal of Commercial Lending, Ausgabe 77, 7, S. 11-23.
Backhaus, K.; Erichson, B.; Plinke, W.; Weiber, R. (2000): Multivariate Analysemethode,
Berlin. Bartlett, F. (2000): Secured Loan Recovery Study: The UK Experience, Europe Loan Prod-
ucts, Fitch IBCA, Februar 2000. Basel Committee on Banking Supervision (2004): International Convergence of Capital
Measurement and Capital Standards, Juni 2004. Beaver, W.H. (1966): Financial Ratios as Predictors of Failure, Journal of Accounting Re-
search 4, 71-111. Berger, A.N., Udell, G.F. (1990): Collateral, Loan Quality, and Bank Risk, Journal of Mone-
tary Economics 25, 21-42.

35
Berger, A.N., Udell, G.F. (1992): Some Evidence on the empirical Significance of Credit Ra-
tioning, Journal of Political Economy 100, 1047-1077. Besanko, D./ Thakor, A. V. (1987): Competitive Equilibrium in the Credit Market under
asymmetric Information, Journal of Economic Theory, 42, 167-182. Bester, H. (1985): Screening vs. Rationing in Credit Markets with imperfect Information,
American Economic Review, 75, 850-855. Bigus, J./ Langer, Th./ Schiereck, D. (2004): Wie werden Kreditsicherheiten in der Praxis
eingesetzt? – Ein Überblick über empirische Befunde, Zeitschrift für Bankrecht und Bankwirtschaft, 6, 465-480.
Booth, J.R. (1992): Contract Costs, Bank Loans, and the cross-monitoring Hypothesis, Jour-
nal of Financial Economics 31, 25-41. Booth, J.R.; Chua, L. (1996): Loan Collateral Decisions and corporate borrowing Costs,
Working Paper, Arizona State University, Tempe, AZ. Bos, R.J.; Kelhoffer, K.; Keisman, D. (2002): Recovery Research: Ultimative Recovery in an
Era of Record Defaults, Standard & Poor’s, Juli 2002.
Brennan, W.; McGirt, D.; Roche, J. ; Verde, M. (1998): Bank Loan Ratings, in: Bank Loans: Secondary Market and Portfolio Management, Frank J. Fabozzi Associates, New Hope, P.A., 57-69.
Brunner, A.; Krahnen, J.P. (2004): Multiple Lenders and corporate Distress: Evidence on
Debt Restructering, CEPR Discussion Paper Series 4287. Carey, M. (1998): Credit Risk in private Debt Portfolios, Journal of Finance 53 (4), 1363 –
1387. Carty, L.V.; Lieberman, D. (1996): Defaulted Bank Loan Recoveries, Moody’s Investors Ser-
vice, November 1996. Carty, L.V. (1998): Bankrupt Bank Loan Recoveries, Moody’s Investors Service, Juni 1998. Chabaane, A.; Laurent, J.P.; Salomon, J. (2004): Double Impact: Credit Risk Assessment and
Collateral Value, Working Paper. Chan, Y.-S./ Kanatas, G. (1985): Asymmetric Valuations and the Role of Collateral in Loan
Agreements, Journal of Money, Credit and Banking, 17, 84-95. Düllmann, K., Trapp, M. (2004): Systematic Risk in Recovery Rates – An empirical Analysis
in U.S. Corporate Credit Exposures, Working Paper. Eales, R.; Bosworth, E. (1998): Severity of Loss in the Event of Default in small Business and
larger Consumer Loans, The Journal of Lending & Credit Risk Management, 58-65.

36
Emery, K. (2003): Moody`s Loan Default Database as of November 2003, Moody`s Investors Service, Dezember 2003.
Felsovalyi, A.; Hurt, L. (1998): Measuring Loss on Latin American defaulted Bank Loans: A
27-Year Study of 27 Countries, Journal of Lending & Credit Risk Management. Franks, J.; de Servigny, A. ; Davydenko, S. (2004): A comparative Analysis of the Recovery
Process and Recovery Rates for private Companies in the U.K., France, and Germany, Standard and Poor`s Risk Solutions, Juni 2004.
Frye, J. (2000a): Collateral Damage, Risk April, 91-94. Frye, J. (2000b): Collateral Damage detected, Federal Reserve Bank of Chicago, Working
Paper, Emerging Issues Series October, 1-14. Grossman, R.J.; Brennan, W.T.; Vento, J. (1997): Syndicated Bank Loan Recovery Study,
Fitch Research, Oktober 1997. Grossman, R.J.; O´Shea, S.; Bonelli, S. (2001): Bank Loan and Bond Recovery Study: 1997-
2000, Fitch Loan Products Special Report. Grunert, J.; Kleff, V.; Norden, L.; Weber, M. (2002): Mittelstand und Basel II: Der Einfluss
der neuen Eigenkapitalvereinbarung für Banken auf die Kalkulation von Kreditzinsen, Zeitschrift für Betriebswirtschaft 72, 1045-1064.
Gupton, G.M.; Gates, D.; Carty, L.V. (2000): Bank Loan Loss Given Default, Moody’s Inves-
tors Service, November 2000. Gupton, G.M.; Stein, R.M. (2002): Loss CalkTM: Moody’s Model for Predicting Loss Given
Default (LGD), Moody’s Investors Service, Februar 2002. Hamilton, D.T.; Carty, L.V. (1999): Debt Recoveries for Corporate Bankruptcies, Moody’s
Investors Service, Juni 1999.
Hamilton, D.T.; Gupton, G.; Berthault, A. (2001): Default & Recovery Rates of Corporate Bond Issuers: 2000, Moody’s Investors Service, Februar 2001.
Hamilton, D.T.; Cantor, R.; Ou, S. (2002) : Default & Recovery Rates of Corporate Bond
Issuers: A statistical Review of Moody’s Ratings Performance 1970-2001, Moody’s In-vestors Service, Februar 2002.
Hamilton, D.T.; Varma, P.; Ou, S.; Cantor, R. (2004) : Default & Recovery Rates of Corpo-
rate Bond Issuers: A statistical Review of Moody’s Ratings Performance 1920-2003, Moody’s Investors Service, Januar 2004.
Hester, D.D. (1979): Customer Relationships and Terms of Loans, Journal of Money, Credit,
and Banking 11, 349-357. Hu, Y.; Perraudin, W. (2002): The Dependence of Recoveries and Defaults, Bank of England
and Birkbeck College, Februar 2002.Hurt, L.; Felsovalyi, A. (1998): Measuring Loss on

37
Latin American Defaulted Bank Loans: A 27-Year Study of 27 Countries, Citibank, Juli 1997.
Jarrow, R.A.; Turnbull, S.M. (2000): The Intersection of Market and Credit Risk, Journal of
Banking and Finance 24, 271-299. Jarrow, J.A. (2001): Default Parameter Estimation using Market Prices, Financial Analysts
Journal 57 (5), 75-92. Jiménez, G.; Saurina, J. (2004) : Collateral, Type of Lender and Relationship Banking as De-
terminants of Credit Risk, Journal of Banking and Finance 28, 2191-2212. Jokivuolle, E.; Peura, S. (2003): A Model for Estmating Recovery Rates and Collateral Hair-
cuts for Bank Loans, erscheint in: European Financial Management.
Kabance, G. (2001): Mexican Bankruptcy and Recovery Rate Study, Fitch IBCA, Dezember 2001.
Keisman, D. (2003): 2084 defaulted Loans and Bond Issues that defaulted between 1987-
2003, Standard & Poor`s LossStats™ Database, Working Paper. Löffler, G. (2003): The Effects of Estimation Error on Measures of Credit Portfolio Risk,
Journal of Banking and Finance, 27, 1427-1453. Machauer, A.; Weber, M. (1998): Bank Behavior based on internal Credit Ratings of Borrow-
ers, Journal of Banking & Finance 22, 1355-1383. Manove, M.; Padilla, A.J. (1999): Banking (conservatively) with Optimists, RAND Journal of
Economics 30, 324-350. Manove, M.; Padilla, A.J. (2001): Collateral versus Project Screening: A Model of lazy
Banks, RAND Journal of Economics 32 (4), 726-744. Ohlson, J.A. (1980): Financial Ratios and the probalistic Prediction of Bankruptcy, Journal of
Accounting Research 18, 109-131. Orgler, Y.E. (1970): A Credit Scoring Model for commercial Loans, Journal of Money,
Credit, and Banking 2, 435-445. O’Shea, S.; Bonelli, S.; Grossman, R. (2001): Bank Loan and Bond Recovery Study: 1997-
2000, Fitch IBCA, März 2001. Pyktin, M. (2003): Unexpected Recovery Risk, Risk 16 (8), 74-78. Renault, O./ Scaillet, O. (2004) : On the Way to Recovery: A nonparametric Bias free Estima-
tion of Recovery Rates Densities, Journal of Banking and Finance, 28, 2915-2931. Schuermann, T. (2004): What do we know about Loss Given Default?, Financial Institutions
Center, Wharton.

38
Scott, J.A.; Smith, T.C. (1986): The Effect of the Bankruptcy Reform Act of 1978 on small business Loan Pricing, Journal if Financial Economics 16, 119-140.
Shleifer, A.; Vishny, R. W. (1992): Liquidation Values and Debt Capacity: A Market
Equlibrium Approach, The Journal of Finance 4, 1343-1366. Thorburn (2000): Bankruptcy Auctions: Costs, Debt Recovery and Firm Survival, Journal of
Financial Economnics 58, 337-368. van de Castle, K.; Keisman, D. (1999) : Recovering your Money: Insights into Losses from
Default, Standard & Poor’s Credit Week, 29-34. van de Castle, K.; Keisman, D.; Yang, R. (2000): Suddenly Structure mattered: Insights into
Recoveries from Defaulted, Standard & Poor’s Credit Week, 61-68. Wilson, T.C. (1997): Portfolio Credit Risk, Risk 9, S. 56-62.