Embed Size (px)
Citation preview

RECOVERY RATE AND DOSE-REDUCTION FACTOR
FRACTIONATED IRRADIATION IN CYSTEAMINE-TREATED MICE AFTER
Arne Nelson, Ola Hertzberg, Inga-Britt Henricsson
Division of Radiobiology, Forsvarels Forslcningsanstult, Research Institute of National Defence, Sundbgberg, Sweden
A considerable amount of information is accumulating on the pro- tective ability of numerous chemical compounds against the acute injuries, measured as lethality, caused by a single whole body-irradiation. (Re- viewed by Eldjarn and Pihl, 1960, and others.) Few attempts have, however, been made to investigate the effect of protective substances at fractional irradiation up to accumulated lethal doses, or at continuous long-term irradiation.
In 1953, Patt et al. investigated the protective effect of cysteine on mice by using a split-exposure technique. The interval between successive radiation fractions did not, however, exceed five minutes. The two frac- tions varied from 100 to 700 r and the amount of cysteine injected was proportional to the radiation dose. Patt concluded from his results that irradiation prior to cysteine administration does not influence the pro- tection against subsequent exposure, and that the lethal potential of small dosages of radiation cannot be reversed by cysteine under these conditions.
Rugh and Clugston (1954) could not observe any protective effect of cysteamine on mice given 100 r per day. The protected mice died after an average accumulated dose of 1,230 r, the corresponding value for the controls being 1,440 r.
LangendorfT and Catsch (1956) gave two doses of 175-500 r with 24- hour intervals and found a protective effect of cysteamine which, however, was less than at single doses.
In this case they gave three fraction doses of 505-1,100 r with 30-day intervals and 750-1,050rwith 15day intervals, and observed a good protective effect.
Noble et al. (1960) gave ten daily doses of 50-200 r to mice and noticed a protective effect with AET. In a similar investigation, Doull et al. (1960) observed significant reduction in the 30day mortality with serotonin and dimethyldithiocarbamide acid but no effect with cysteamine.
The few studies on protective effects have given equivocal results due to the rather limited range of fraction dose, intervals, and accumulated doses. I?t is likely that an investigation with a wider range of these factors would give valuable information concerning the mechanisms of
630
Later, Langendorff et al. (1959) tested the effect of serotonin.
Nelson et al. : Reduction Factor in Cysteamine 63 1
protection and of recovery. An answer could perhaps be given to the question whether the chemical protection is due to a “dose-reduction” effect or to an enhanced recovery.
The present investigation is an attempt to elucidate some of these problems.
Material and Methods
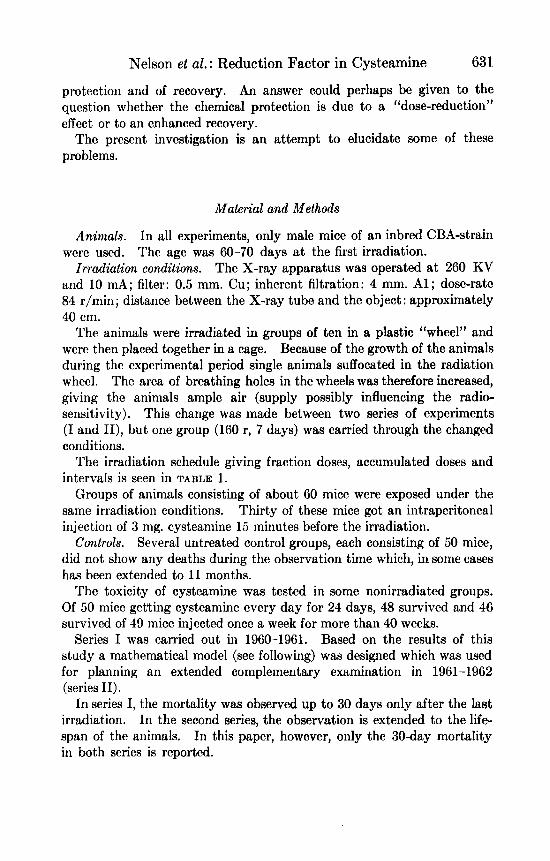
Animals. I n all experiments, only male mice of an inbred CBA-strain were used. The age was 60-70 days at the first irradiation.
Irradiation conditions. The X-ray apparatus was operated at 260 KV and 10 mA; filter: 0.5 mm. Cu; inherent filtration: 4 mm. A l ; dose-rate 84 r/min; distance between the X-ray tube and the object: approximately 40 em.
The animals were irradiated in groups of ten in a plastic “wheel” and were then placed together in a cage. Because of the growth of the animals during the experimental period single animals suffocated in the radiation wheel. The area of breathing holes in the wheels was therefore increased, giving the animals ample air (supply possibly influencing the radio- sensitivity). This change was made between two series of experiments (I and 11), but one group (180 r, 7 days) was carried through the changed conditions.
The irradiation schedule giving fraction doses, accumulated doses and intervals is seen in TABLE 1.
Groups of animals consisting of about GO mice were exposed under the same irradiation conditions. Thirty of these mice got an intraperitoneal injection of 3 mg. cysteamine 15 minutes before the irradiation.
Several untreated control groups, each consisting of 50 mice, did not show any deaths during the observation time which, in some cases has been extended to 11 months.
The toxicity of cysteamine was tested in some nonirradiated groups. Of 50 mice getting cysteamine every day for 24 days, 48 survived and 46 survived of 49 mice injected once a week for more than 40 weeks.
Series I was carried out in 1960-1961. Based on the results of this study a mathematical model (see following) was designed which was used for planning an extended complementary examination in 1961-1962 (series 11).
In series I, the mortality was observed up to 30 days only after the last irradiation. In the second series, the observation is extended to the life- span of the animals. In this paper, however, only the 30day mortality in both series is reported.
Controls.
632
Fraction dose (r)
80 80
160 160
160
320 320
320
Annals New York Academy of Sciences
TABLE 1 IRRADIATTON SCHEDULE
Accumulated dose (r)
Series I
960, 1280, 1600, 1920
1600, 1920, 2240
640, 960, 1280, 1600 960t, 1280t, 1600t, 1920t,
l280,1600,1920t, 2240t, 2560, 2240, 2560
2880, 3200
Series I1
640,960,1280,1600,1920 * 480, 800, 1120, 1440, 1760 1600, 1920, 2240, 2560, 2880,
2880, 3200, 3520, 3840, 4160, 3200, 3520
4480, 4800, 64001
* Irradiation continues until all animals are dead. t Repeated. 1 No survivors after 5920 r.
Results
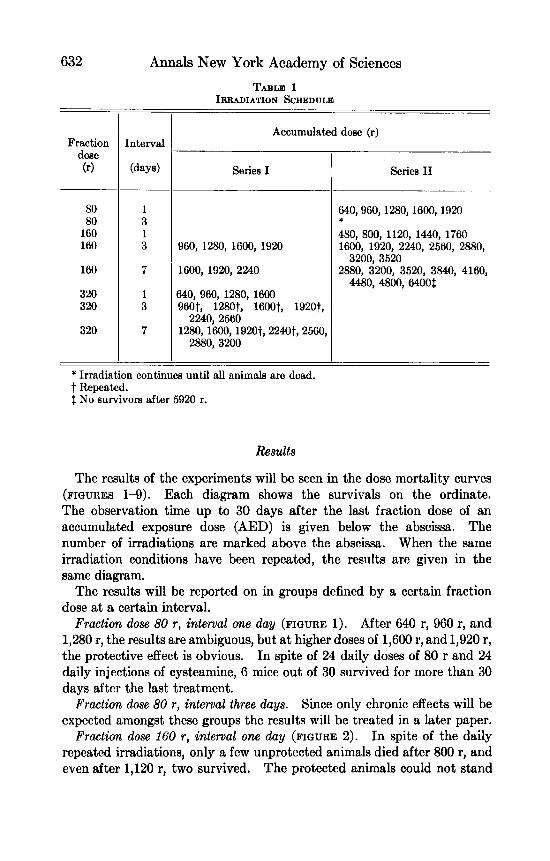
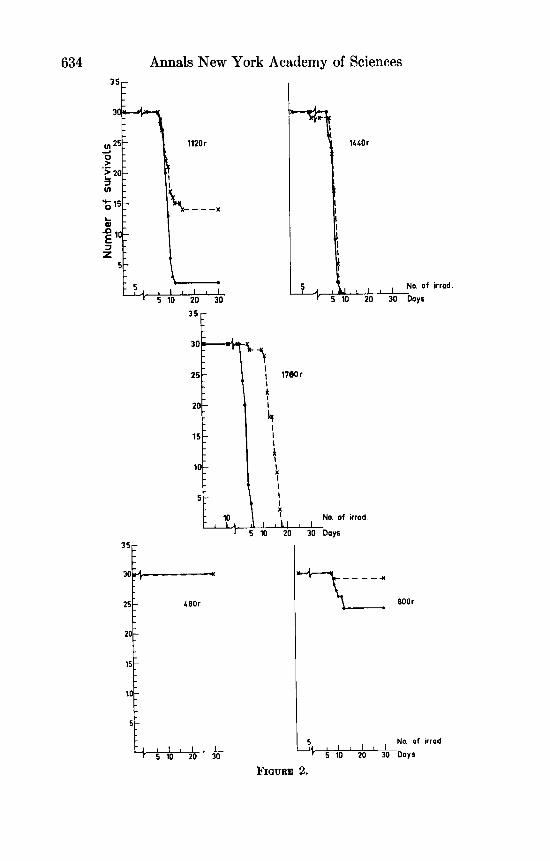
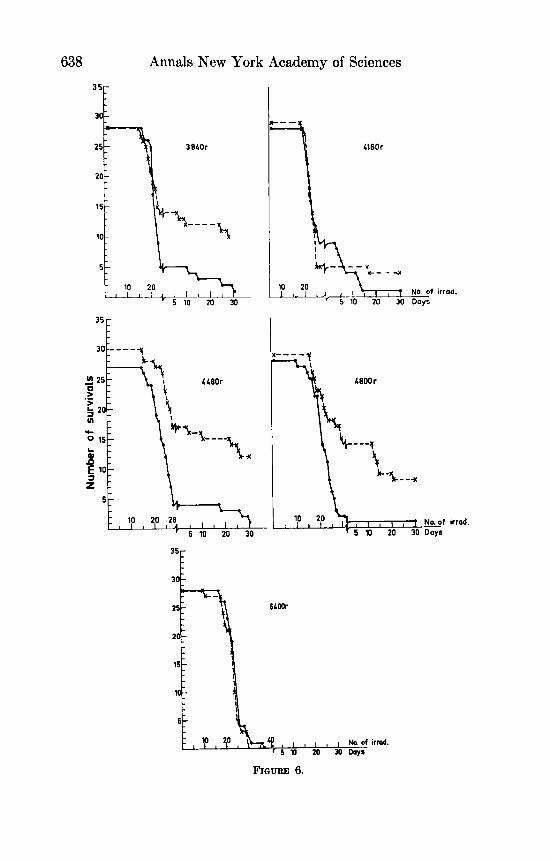
The results of the experiments will be seen in the dose mortality curves (FIGURES 1-9). Each diagram shows the survivals on the ordinate. The observation time up to 30 days after the last fraction dose of an accumulated exposure dose (AED) is given below the abscissa. The number of irradiations are marked above the abscissa. When the same irradiation conditions have been repeated, the results are given in the same diagram.
The results will be reported on in groups defined by a certain fraction dose at a certain interval.
Fraction dose 80 r, interval one day (FIGURE 1). After 640 r, 960 r, and 1,280 r, the results are ambiguous, but a t higher doses of 1,600 r, and 1,920 r, the protective effect is obvious. In spite of 24 daily doses of 80 r and 24 daily injections of cysteamine, 6 mice out of 30 survived for more than 30 days after the last treatment.
Fraction dose 80 r, interval three days. Since only chronic effects will be expected amongst these groups the results will be treated in a later paper.
Fraction dose 160 r, interval one day (FIGURE 2). In spite of the daily repeated irradiations, only a few unprotected animals died after 800 r, and even after 1,120 r, two survived. The protected animals could not stand
35-
30 25
20
15
10-
"1' - - &-----% 610r --I p - n -
-
L A I 1 I I I ~ ~ ~ r ~ ! ~ y ~ f irrd'
5-
1 s 5 10 20 30
.- 2 20- a -
0 '5 :
m - .k
L a : 10-
a - Z I
.
5 -
- w m m No of irrod 1 1 1 1 1 1 1 1 1 1 l b L . 4 I I I I I I
634 Annals New York Academy of Sciences
1u0r
1 r 5 10 20
, I No. of irrad. 30 Days
"EC;,, 25
5 No. of irrod I I I I I
5 10 20 30 Days
FIQURE 2.
Nelson et al. : Reduction Factor in Cystearnine 635 35-
30
25
20
15
10-
hi #
- 960r
-
-
5 - -
5 I I I I I ' 5 10 20 30
35
15
10 T 5
L
r"- 1280r
5 Na of irmd I I I I I
r s 10 20 30 DOYS
No. of irrod.
' 5 10 20 Y) Days -. &..A
irmd.
FIQURE 3.
636 Annals New York Academy of Sciences
30
3520r
5 x )
No of - 20 30 Doyr
mod
3200r
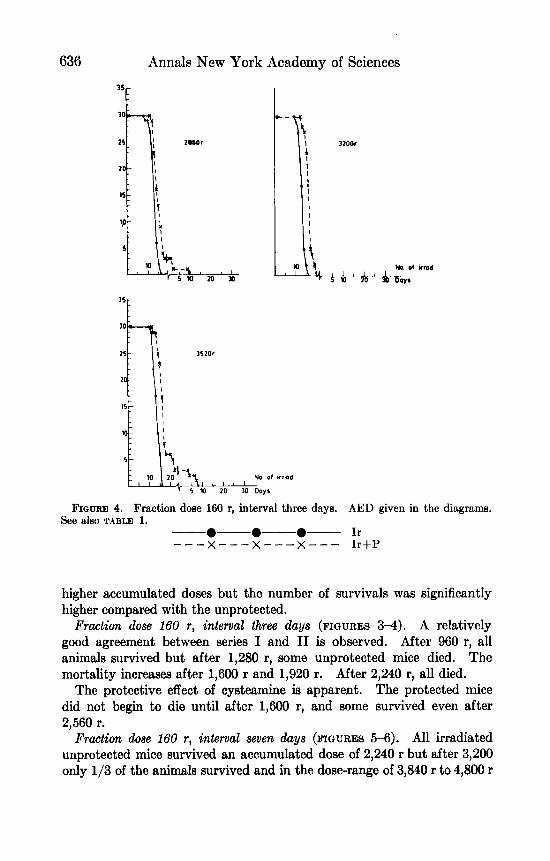
FIQURE 4. Fraction dose 160 r, interval three days. AED given in the diagrams. See also TABLE 1.
0- 0-0- Ir - - - x - - - x - - - x - - - Ir+P
higher accumulated doses but the number of survivals was significantly higher compared with the unprotected.
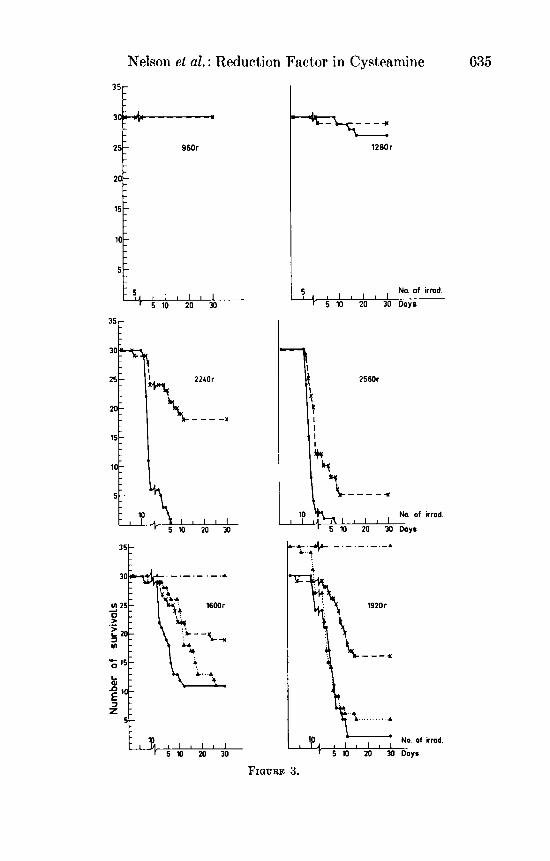
Fraction dose 160 r, interval three days (FIGURES 3 4 ) . A relatively good agreement between series I and I1 is observed. After 960 r, all animals survived but after 1,280 r, some unprotected mice died. The mortality increases after 1,600 r and 1,920 r. After 2,240 r, all died.
The protective effect of cysteamine is apparent. The protected mice did not begin to die until after 1,600 r, and some survived even after 2,560 r.
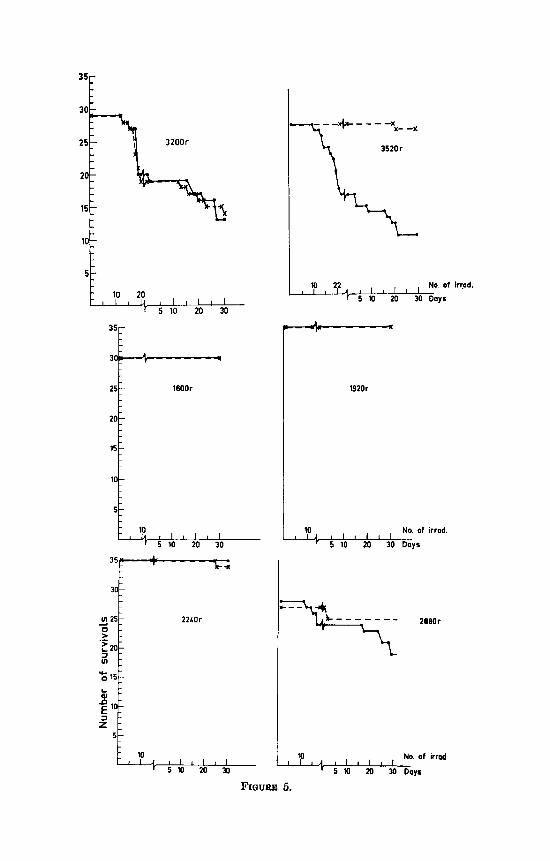
Fraction dose 160 r, interval seven days (FIGURES 5-6). All irradiated unprotected mice survived an accumulated dose of 2,240 r but after 3,200 only 1/3 of the animals survived and in the dose-range of 3,840 r to 4,800 r
35€
10 I I I I I
5 10 20 30
35 -T- I
1920r
10 No. of irrad.
5 10 20 30 Days I I I I I
2080r
638 Annals New York
351 30
38LOr
35€
Academy of Sciences
1 I A I 1 j, I , 7 NO. 01 irr0d. 10 20
" 5 10 20 30 Doys
irmd.
Nelson et al. : Reduction Factor in Cysteamine 639
”I
I irrod
irrod
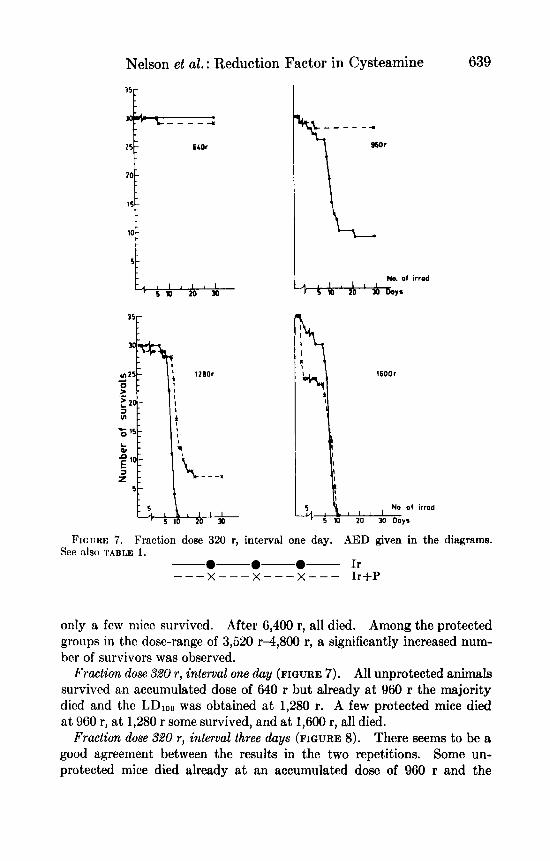
FIGURE 7. Fraction dose 320 r, interval one day. AED given in the diagrams. See also TABLE 1.
0- 0-0- Ir - - - x - - - x - - - x - - - Ir+P
only a few mice survived. After 6,400 r, all died. Among the protected groups in the dose-range of 3,520 r4,800 r, a significantly increased num- ber of survivors was observed.
Fraction dose 520 r , interval one day (FIGURE 7). All unprotected animals survived an accumulated dose of 640 r but already at 960 r the majority died and the LD,,, was obtained at 1,280 r. A few protected mice died a t 960 r, at 1,280 r some survived, and at 1,600 r, all died.
There seems to be a good agreement between the results in the two repetitions. Some un- protected mice died already a t an accumulated dose of 960 r and the
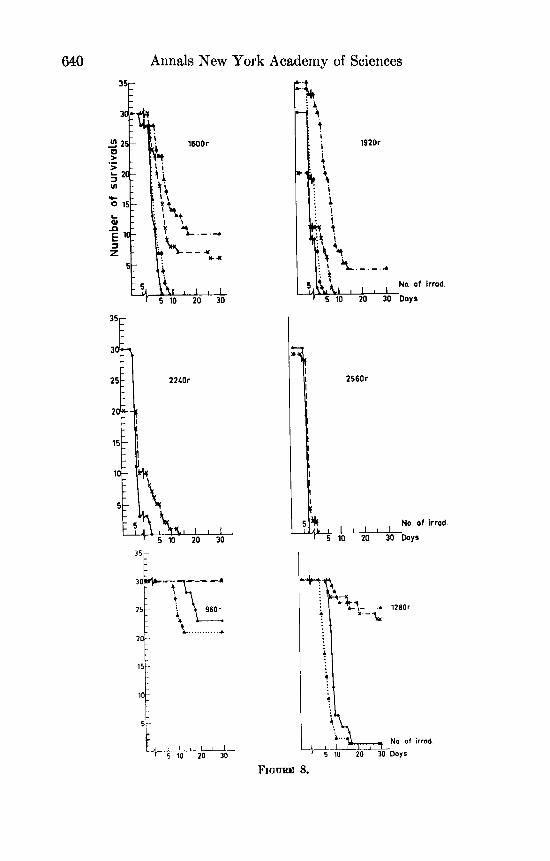
Fraclion dose 320 r, interval three days (FIGURE 8).
640 Annals New York Academy of Sciences
22LOr
3 5 r t t
960r
i.. . . . . . . . . . . . 20
I
1920r
: I ; i : !
irrad.
FIQURE 8.
Nelson et al.: Reduction Factor in Cysteamine
20
15-
10
25 128Or
-
-
-
5-
A 1 1 1 1 1 1
?q,+. - . - . - -.A Y: * ---
35-
30
25-
20-
15-
10-
L3 i t E +L-----,
2560r
1
5-
I 5 I 1 I l I r 5 10 20 30
No. of irrod
2880 r
641
irmd.
642 Annals New York Academy of Sciences
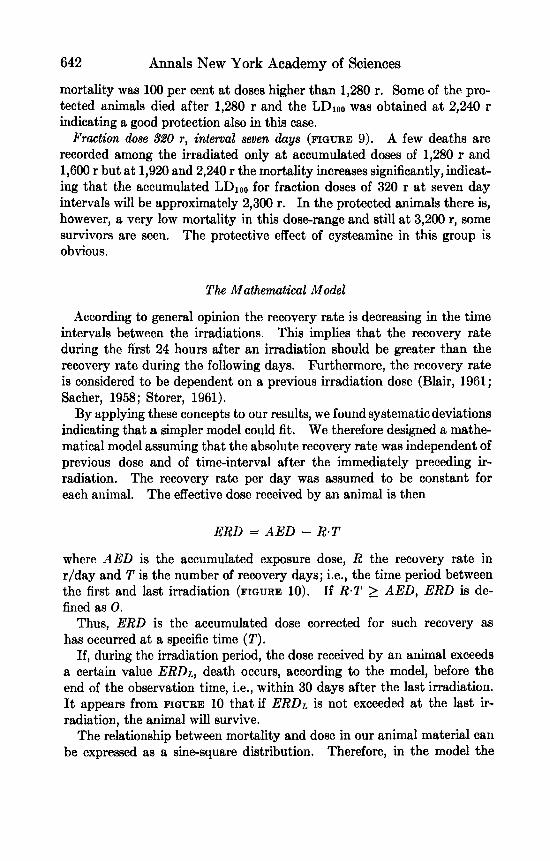
mortality was 100 per cent at doses higher than 1,280 r. Some of the pro- tected animals died after 1,280 r and the LDloo was obtained at 2,240 r indicating a good protection also in this case.
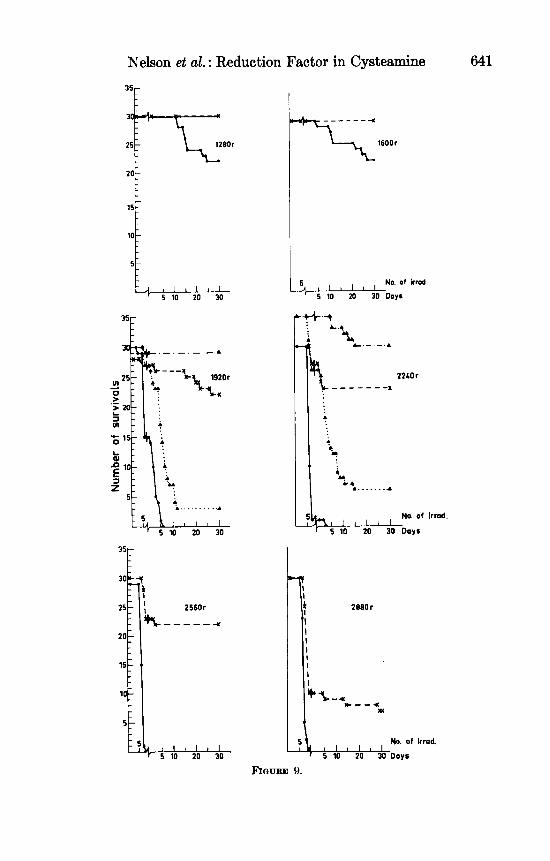
Fraction dose 320 r, interval seven days (FIGURE 9). A few deaths are recorded among the irradiated only a t accumulated doses of 1,280 r and 1,600 r but at 1,920 and 2,240 r the mortality increases significantly, indicat- ing that the accumulated LDloo for fraction doses of 320 r a t seven day intervals will be approximately 2,300 r. In the protected animals there is, however, a very low mortality in this dose-range and still a t 3,200 r, some survivors are seen. The protective effect of cysteamine in this group is obvious.
The Mathematical Model
According to general opinion the recovery rate is decreasing in the time intervals between the irradiations. This implies that the recovery rate during the first 24 hours after an irradiation should be greater than the recovery rate during the following days. Furthermore, the recovery rate is considered to be dependent on a previous irradiation dose (Blair, 1961; Sacher, 1958; Storer, 1961).
By applying these concepts to our results, we found systematicdeviations indicating that a simpler model could fit. We therefore designed a mathe- matical model assuming that the absolute recovery rate was independent of previous dose and of time-interval after the immediately preceding ir- radiation. The recovery rate per day was assumed to be constant for each animal. The effective dose received by an animal is then
ERD = AED - R - T
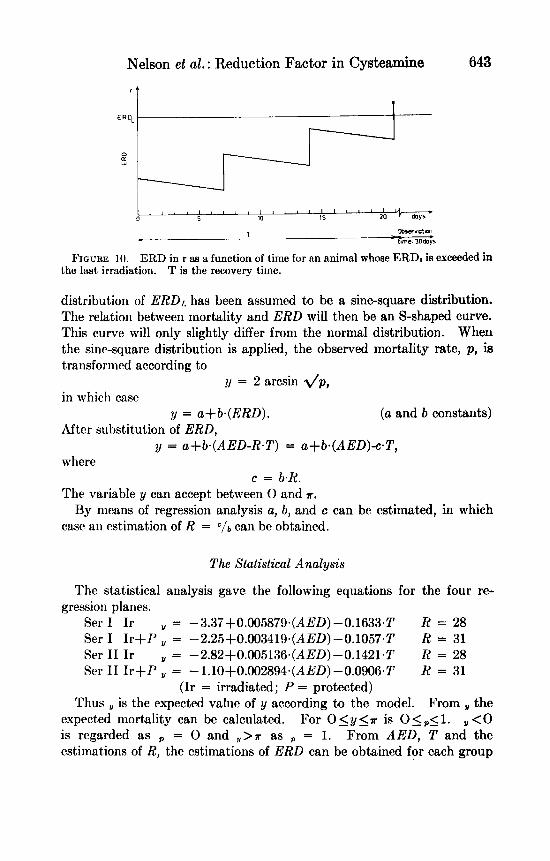
where AED is the accumulated exposure dose, R the recovery rate in r/day and T is the number of recovery days; i.e., the time period between the first and last irradiation (FIGURE 10). If R.T 2 AED, ERD is de- h e d as 0.
Thus, ERD is the accumulated dose corrected for such recovery as has occurred at a specific time ( T ) .
If, during the irradiation period, the dose received by an animal exceeds a certain value ERDL, death occurs, according to the model, before the end of the observation time, i.e., within 30 days after the last irradiation. It appears from FIGURE 10 that if ERDL is not exceeded a t the last ir- radiation, the animal will survive.
The relationship between mortality and dose in our animal material can be expressed as a sine-square distribution. Therefore, in the model the
Nelson et al. : Reduction Factor in Cysteamke 643
20 ' doys .
1s
T Obwrvotmn
ok---+-- I0 ' ' ' ' ' ' ' ' ' I A
. * ~. - h e 30&ys
ERD in r aa a function of time for an animal whose ERD, is exceeded FIGURE 10. the last irradiation. T is the recovery time.
distribution of ERDL has been assumed to be a sine-square distribution. The relation between mortality and ERD will then be an S-shaped curve. This curve will only slightly differ from the normal distribution. When the sine-square distribution is applied, the observed mortality rate, p , is transformed according to
in which case
After substitution of ERD,
where
The variable y can accept between 0 and K.
case an estimation of R = c / ~ can be obtained.
= 2 arcsin d p ,
y = a+b.(RRD). (a and b constants)
y = a+b.(AED-R.T) = a+b.(AED)-c.T,
c = b.R.
By means of regression analysis a, b, and c can be estimated, in which
The Statistical Analysis
The statistical analysis gave the following equations for the four re- gression planes.
Ser I Ir = -3.37+0.005879.(AED)-0.1633.T R = 28 Ser I I r+P ,, = -2.25+0.00341Y~(AED)-O.1057~T R = 31 Ser 11 Ir ,, = -2.82+0.005136.(AED)-0.1421-T R = 28 Sw I1 I r + P 2/ = -1.10+0.002894.(AED)-O.O906*T R = 31
(Ir = irradiated; P = protected) Thus ,, is the expected value of y according to the model. From I the
expected mortality can be calculated. For O<y<n is O l , < l . ,<O is regarded as = 0 and ,,>T as = 1. From AED, T and the estimations of R, the estimations of ERD can be obtained for each group
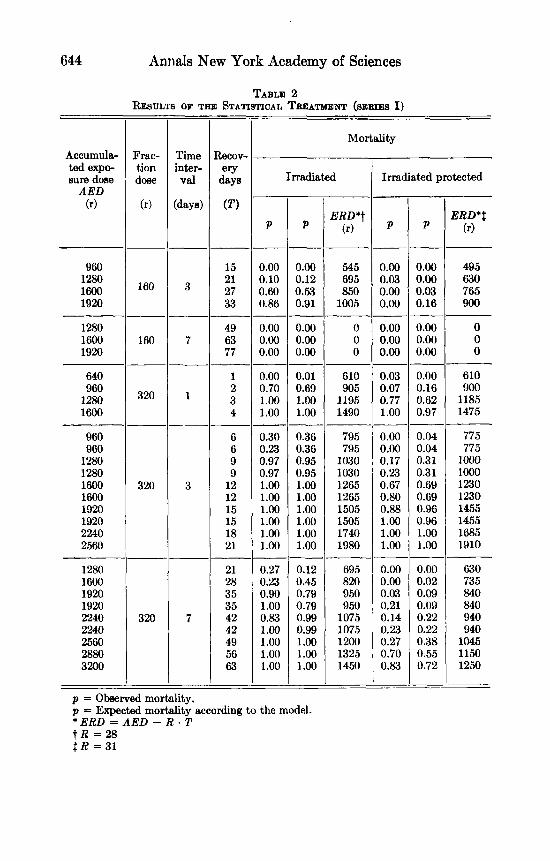
644 AnnaIs New York Academy of Sciences
RESULTS
Accumula- Frac- ted expo- tion suredose dose
(4 (r) AED
960 1280 1600 160 1920
1280 1600 160 1920
640
li:: 320 1600
960 960
1280 1280 1600 320 1600 1920 1920 2240 2560
1280 1600 1920 1920 2240 320 2240 2560 2880 3200
p = Observed
OF TI~E STATISTICAL TREATMENT (mms I)
Mortality Time Recov- inter- ery
(days) (TI
Val days Irradiated Irradiated protected
ERD*t ERD*$ P * (r) P P (r)
---_____--___-
15 0.00 0.00 545 0.00 0.00 495 21 0.10 0.12 695 0.03 0.00 630 27 0.60 0.53 850 0.00 0.03 765 33 0.86 0.91 1005 0.00 0.16 900
49 0.00 0.00 0 0.00 0.00 0 7 63 0.00 0.00 0 0.00 0.00 0
77 0.00 0.00 0 0.00 0.00 0
1 0.00 0.01 610 0.03 0.00 610 2 0.70 0.69 905 0.07 0.16 900
1 3 1.00 1.00 1195 0.77 0.62 1185 4 1.00 1.00 1490 1.00 0.97 1475
6 0.30 0.36 795 0.00 0.04 775 6 0.23 0.36 795 0.00 0.04 775 9 0.97 0.95 1030 0.17 0.31 lo00 9 0.97 0.95 1030 0.23 0.31 1000
3 12 1.00 1.00 1265 0.67 0.69 1230 12 1.00 1.00 1265 0.80 0.69 1230 15 1.00 1.00 1505 0.88 0.96 1455 15 1.00 1.00 1505 1.00 0.96 1455 18 1.00 1.00 1740 1.00 1.00 1685 21 1.00 1.00 1980 1.00 1.00 1910
21 0.27 0.12 695 0.00 0.00 630 28 0.23 0.45 820 0.00 0.02 735 35 0.90 0.79 950 0.03 0.09 840 35 1.00 0.79 950 0.21 0.09 840
7 42 0.83 0.99 1075 0.14 0.23 940 42 1.00 0.99 1075 0.23 0.22 940 49 1.00 1.00 1200 0.27 0.38 1045 56 1.00 1.00 1325 0.70 0.55 1150 63 1.00 1.00 1450 0.83 0.72 1250
---------
---__-----
---------
---------
mortality.
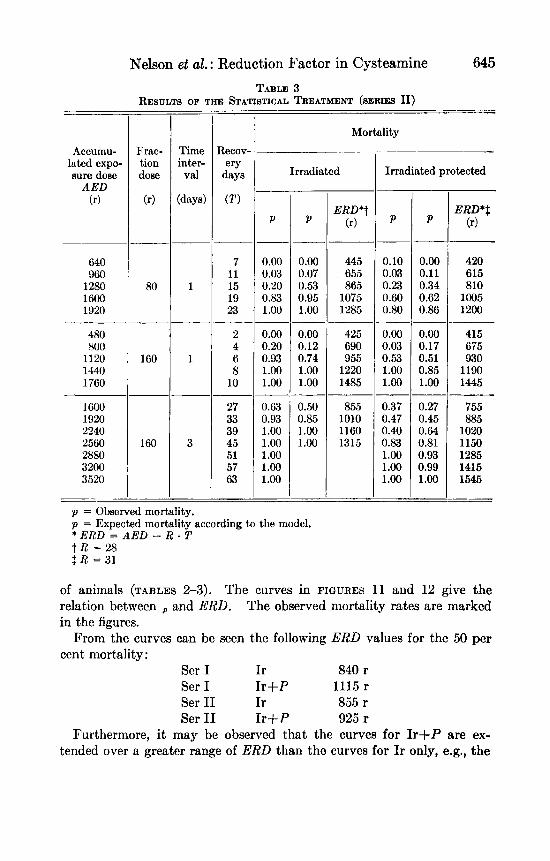
Nelson et UI?.: Reduction Factor in Cysteamine 645
TABLE 3 RESULTS OF THE STATISTICAL TREATMENT (SERIES 11)
P
0.00 0.07 0.53 0.95 1.00
0.00 0.12 0.74 1.00 1.00
0.50 0.85 1.00 1.00
-~ __.___
Accumu- lated expo- sure dose
AED (r)
640 960
1280 1600 1920
480 800
1120 1440 1760
1600 1920 2240 9560 2880 3200 3520
ERD*t (r)
______
445 655 865
1075 1285
425 690 955
1220 1485
855 1010 1160 1315
______
_____
___ -
Frac- tion dose
(r)
80
160
-
160
~ -
__ -
Time inter-
val
(days)
1
7 11 15 19 23
2 4 6 8
10
27 33 39 45 51 57 63
__
~
- -
Mortality .~
Irradiated
P
0.00 0.03 0.20 0.83 1.00
0.00 0.20 0.93 1.00 1.00
0.63 0.93 1 .oo 1.00 1.00 1.00 1.00
-
- -
Irradiated protected -
P -
0.10 0.03 0.23 0.60 0.80
0.00 0.03 0.53 1.00 1.00
0.37 0.47 0.40 0.83 1.00 1.00 1.00
-
- __
~
P -
0.00 0.11 0.34 0.62 0.86
0.00 0.17 0.51 0.85 1.00
0.27 0.45 0.64 0.81 0.93 0.99 1.00
__
- -
ERD*$ (r)
420 615 810
1005 1200
415 675 930
1190 1445
755 885
1020 1150 1285 1415 1545
p = Observed mortality. p = Expected mortality according to the model. * ERD = AED - R * T t R = 2 8 $ R = 3 1
of animals (TABLES 2-3). The curves in FIGURES 11 and 12 give the relation between and ERD. The observed mortality rates are marked in the figures.
From the curves can be seen the following ERD values for the 50 per cent mortality:
Ser I Ir 840 r Ser I I r+P 1115 r Ser I1 Ir 855 r Ser I1 I r + P 925 r
Furthermore, it may be observed that the curves for Ir+P are ex- tended over a. greater range of ERD than the curves for I r only, e.g., the
i

646 Annals New York Academy of Sciences
w. - - d
f q50:
0,w
$ 0.50
' I , , , , ,
P
ERD ERD
ERD
FIQURE 11. Mortality as a function of ERD (series I). a, Irradiated. b, Irradiated and protected. Legends: 160 r, 3 days:.; 320 r, 1 day: X ;
320 r, 3 daya:O; 320 r, 7 daya: V
standard deviation of ERDL is greater for the protected than for the unprotected animals. The mean square deviation of the observed values around the function that indicates the relationship between dose and mortality, should not be significantly greater than the theoretical variance determined by the binomial distribution. The mean square deviation around the lines in FIGURES 11 and 12 is, however, significantly greater than the theoretical variance. This might depend on those age differences which arise due to the long duration of the experiment, even if the animals were of the same age at the beginning of it. In addition, it should be pointed out that the various groups are investigated at different times.
The most important control investigation of the validity of the model is an observation of systematic deviations, e.g., if points with the same sym- bol in FIGURES 11 and 12 tend to show a systematic shift in relation to the curves. In FIGURE l l a it can be seen that some points show a deviation from the curve which is great in comparison with the expected deviation defined by the binomial distribution but a systematic deviation is not
Nelson et al. : Reduction Factor in Cysteamine 647
‘I
1.w -
LOO 500 600 100 OW OW 1WO llm 12M) 1300 1100 lYYlr
ERD
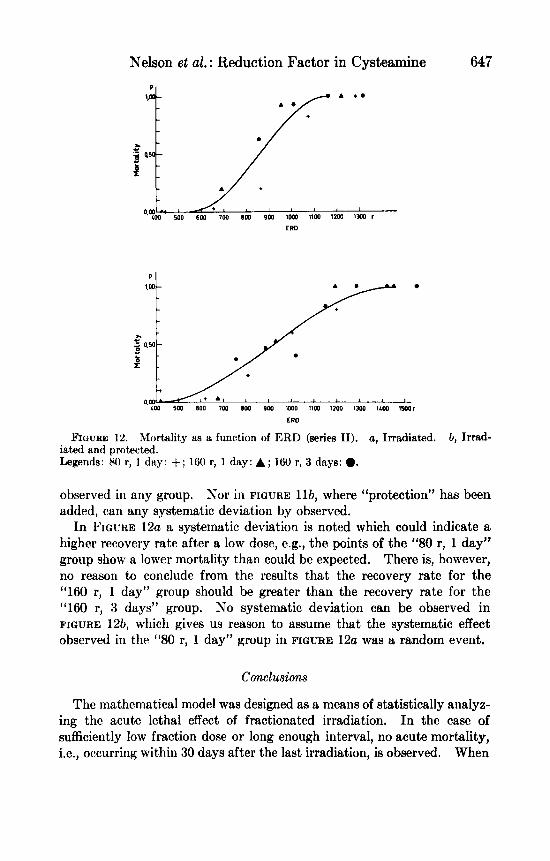
E’IQURE 12. Mortality a8 a function of ERD (series 11). a, Irradiated. b, Irrad- iated and protected. Legends: 80 r, 1 day: +; 160 r, 1 day: A; 160 r, 3 days: 0.
observed in any group. Nor in FIGURE l l b , where “protection” has been added, can any systematic deviation by observed.
In FIGURE 12a a systematic deviation is noted which could indicate a higher recovery rate after a low dose, e.g., the points of the “SO r, 1 day” group show a lower mortality than could be expected. There is, however, no reason to conclude from the results that the recovery rate for the “160 r, 1 day” group should be greater than the recovery rate for the “160 P, 3 days” group. No systematic deviation can be observed in FIGURE 124 which gives us reason to assume that the systematic effect observed in the “SO r, 1 day)) group in FIGURE 12a was a random event.
cmc1usions
The mathematical model was designed as a means of statistically analyz- ing the acute lethal effect of fractionated irradiation. In the case of sufficiently low fraction dose or long enough interval, no acute mortality, i.e., occurring within 30 days after the last irradiation, is observed. When
648 Annals New York Academy of Sciences
the duration of the experimental period is very extended, chronic effects will influence the results and a systematic deviation from the model is introduced, e.g., in the ‘‘160 r, 7 days” groups. Such a systematic devia- tion has, however, not been observed within 90 days from the first ir- radiation in our study. Since no experiment has been carried out with shorter intervals than 24 hours between the fractions, no conclusions can be drawn regarding the validity of the model at shorter times.
Of great interest is the good agreement between the recovery rates of the irradiated, as well as of the irradiated protected groups both in series I and 11, in spite of the fact that the experiments have been carried out at different times. Somewhat higher recovery rates have certainly been observed among the animal groups which have received cysteamine but the difference must be regarded as relatively insignificant.
There is also a good agreement between the LDbOs of the unprotected groups in the two series. In the protected groups, the LDso in series I1 is significantly lower than the corresponding value in series I. The LDSOs of the two protected groups are, however, sufEciently high to show that a protective effect of cysteamine is at hand. This effect is significant with high ERD, but in series I1 it is lacking at low ERD. This difference will, however, be further investigated.
Since the protective effect of cysteamine is apparent, and the recovery rates are practically the same in the protected and unprotected groups, the opinion that the effect of cysteamine is an initial, i.e., a dose-reduction effect, is further substantiated.
Acknowledgment
The authors are indebted to C. Ronnback, S. Jiiger, I. Andersson and R. von Knorring for their excellent technical assistance.
Summary
In order to investigate the protective effect of cysteamine at sublethal doses of irradiation, groups of mice were exposed to the following fraction doses: 80, 160, 320 r a t time-intervals of one, three and seven days. The total doses were chosen to give lethalities from 0 to 100 per cent. Half of the animals were given cysteamine before each irradiation. A simple mathematical model was used which fitted the results regarding the short- term lethal effects. The effect of cysteamine appeared to be a dose-re- duction effect and not an enhancement of the recovery. The dose-re- duction factor seem to be of the same order of magnitude at sublethal as at lethal doses.
Nelson et al. : Reduction Factor in Cysteamine
References
649
BLAIR, H. A.
DOULL, J., V. PLZAK & M. ROOT.
1961. Some properties of reparable and irreparable radiation injury. Univ. of Rochester Rep. UR-602.
The influence of exposure to low levela of gamma and fast neutron irradiation on the life span of mice. I. Chemical pro- tection against chronic radiation injury. USAF Radiation Lab. Quarterly Progr. Rep. 37: 53.
ELDJARN, L. & A. PIHL. 1960. Mechanisms of protective and sensitizing action. In Mechanism in Radiobiology. M. Errera and A. Forssberg, Eds. Academic Press. New York and London. Vol. 2, Chapt. 4.
LANOENDORFF, H. & A. CATSCH. 1966. Untersuchungen uber einen biologischen strahlenscliutz. XVI. Mitteilung. Vber die schutzwirksamheit des cysteamin bei fraktionierter ganzkorperbestrahlung von miiusen. Strahlentherapie. 101: 536.
1959. Untersuchungen uber einen biologischen strahlenschutz. XXXII. Mitteilung. Zur frage des bio- logischen strahlenschutzes nach wiederholter ganzkorper-bestrahlung nlit letal wirkenden strahlendosen. Strahlentherapie. 110: 34.
NOBLE, J. F., M. ROOT & J. DOULL. 1960. The influence of exposure to low levels of gamma and fast neutron irradiation on the life span of mice. Chemical pro- tection against chronic irradiation injury in mice. USAF Radiation Lab. Quarterly Progr. Ilept. 36: 107.
1953. Radiation dose reduction by cysteine. J. Cell. Comp. Physiol. 42: 327.
1954. The time-intensity relations of whole-body acute X-irradiation and protection by Bmercaptoethylamine.
Reparable and irreparable injury: A survey of the position in experiment and theory. In Radiation Biology and Medicine. Chap. 4. W. D. Claus, Ed. Addison-Wesley Publishing Co. Reading, Mass.
Effect of dose size on rate of recovery from radiation damage in mice. Radiation Res. 14: 206.
1960.
LANQENDORFF, H., H. J. MELCHINQ & H. A. LADNER.
I.
PAIT, H. M., 8. H. MAYER, R. L. STRAUBE & E. M. JACKSON.
I~UGH, It. & H. CLUGSTON.
SACHER, G. A. Radiation Res. 1: 437.
1958.
SixomR, J. B. 1961.
Discussion of the Paper
E. E. SCHWARTZ: Do you have any data regarding the cumulative toxicity of MEA?
NELSON: The investigation of the toxicity of cysteamine only will be reported in the full printed paper.
J. DOULL: These very interesting findings stimulate comment since they differ somewhat from the results which we presented at the Radiation Research Society meetings in Colorado Springs. In our study which involved a more chronic radiation exposure than that used by Nelson, we did not observe protective effects with MEA, PAPP, AET, 5-HT or any of the other agents tested when they were given prior to daily X-ray exposures at dose-rates of 50 r/day to death or at lower dose-rates. With higher dose-rates, in the range used by Nelson, protective effects were observed. I would ask, therefore, if there is any indication in these studies that decreasing the dose-rate from 320 r to 80 r or increasing the fractionation from seven-day to one-day intervals resulted in a decrease in the degree of protection seen.
650 Annals New York Academy of Sciences
NELSON: The protective effect of cysteamine is decreased at fraction doses of 80 r/one-day intervals, which seems to be due to some kind of amplified toxic effect of cysteamine by irradiation and appears after about 10 injections and 10 irradiations. The same effect is not observed at 160 r/one-day intervals, when fewer injections and irradiations are needed in order to obtain ERDL.