Embed Size (px)
Citation preview

International Journal of Applied Science and Technology Vol. 2 No. 7; August 2012
46
Recovery of Waste of Construction, Demolition and Mining Tailings
Francisco Prieto García1*; Yamile Rangel Martínez2
Otilio A. Acevedo Sandoval3, Alberto J. Gordillo Martínez1
1Chemical Researches Center, 2Engineering Academic Area 3Center of Researches in Materials and Metallurgy. Universidad Autónoma del Estado de Hidalgo -
Mexico.
Abstract
The reuse of construction and demolition waste (CDW) is an economic strategy that is practiced in most industrialized countries to add value to solid waste. The ability to retrieve and combine them with mining waste (tailings) in the reprocessing of new rock aggregates implies a high economic effect and a new source of employment. The aim of this work has been to present a technical-economic feasibility study for this purpose. The results indicate that a plant design capacity of 61T/h would have an initial investment of $24 543 377.73 Mexican pesos (about $1 817 828.00 U.S. dollars) with annual revenues of $1 500 000.00 minimum and a maximum recovery in 16 years. Retrieving and marketing materials that often accompany CDW, annual earnings can be as high as $12 500 000.00 and an accelerated recovery in 2 years.
Keywords: economic feasibility, recovery, investment, profits, value added
1.0 Introduction
In Mexico and specifically in the Federal District (FD) approved the Environmental Statement [1] which establishes the classification and management specifications CDW in the City, with the aim of promoting its use and minimizing improper disposal. The standard specifies the phases of the management of CDW, depending on the volume produced, considering that, for those who produce a minimum of 7m3, you must submit a waste management plan, which consists in: a) Separation at source, as classified A, B or C (see Table 1), b) Storage c) Collection and transport d) Use that in the case of waste listed in section A, must recycle at least 30% during the first year of implementation of the standard and the percentage increase 15% annually to reach 100%. For classification B, be reused at least 10% and for the classification C, considered the best option for their use. For subsequent works must be replaced at least 25% of virgin material recycled as long as the technical and economic specifications of the project permit and finally e) Disposal.
Potentially recyclable materials are found in the classification A of Table 1. The CDW recycled, they are defined as the result of a physical treatment process to be used in the construction, either alone or in combination [2]. From the standpoint of production the CDW are classified into three groups according to their composition, homogeneity, particle size and degree of cleanliness, be it basic for proper recovery and recycling. Based on these criteria is established the following classification:
1. CDW clean not mixed with other waste
Are those from demolitions and demolitions, they understood as the set of actions performed on a structure aimed at its total or partial demolition. They are characterized by their high percentage of homogeneous materials, concrete, stone, among others, free to a large extent on other residues. They usually arrive very clean and made of large pieces of structure, with a low proportion of fines. Present the best talents and possibilities for recycling.
2. CDW mixed with other waste
Reform processes and new buildings. Often show a remarkable degree of mixing other non-inert waste. They are characterized by greater homogeneity and lower fines content.

© Centre for Promoting Ideas, USA www.ijastnet.com
47
This includes all stone materials mixed with other construction materials such as lime, gypsum, cement, rubble, concrete debris, etc., presenting certain talents and possibilities of recycling, provided it is subjected to a pretreatment cleaning and decontamination, aggregates obtained with this type of waste is of average quality.
3. Soils, land clearing and excavation.
Materials from civil works and new buildings which are mainly excavated soil and land low in coarse aggregate. Its main feature is its high content of fine (almost all are surplus land excavation). They have no aptitude for recycling but for recovery in landfills and reclamation of quarries. Based on what is reported in the literature, about a recent study [4] of demand and supply of stone aggregates, prepared for the City, was considered to make the same assessment level technical and economic feasibility for the city of Pachuca and its metropolitan area which can be extrapolated to the entire state of Hidalgo and other states, this has been the focus of this work.
Table 1. Non-exhaustive classification given CDW. [[[[1]]]]
A. Potentially recyclable waste for the production of aggregates and fillers - Precast mortar or concrete (blocks, partition wall, pavers, pipes, etc.) - Plain concrete
- Reinforced concrete - Ceramic - Asphalt concrete
- Concrete products - Masonry products - Tepetates
- Prefabricated clay annealed (walls, bricks, blocks, etc.).Blocks - Mortar
B. Excavation waste - Organic soil - Unpolluted soil and clay materials, natural stone granular and contained in them - Mineral materials and non-hazardous contained in contaminated soil
C. Solid waste 1. Cardboard
2. Wood 3. Metals 4. Paper 5. Plastics 6. Garden waste 7. Drywall 8. Glass 9. Others
The continuous growth that occurs in the construction industry, leads to the generation of a large amount of waste, known as construction and demolition waste (CDW) and, improperly handled, can cause environmental problems, reducing soil quality, air and water. These wastes may be utilized, reused or recycled as practiced in most industrialized countries. The market "Environment" of the CDW relates to the economic chain that has to do with the use of these residues [4].
2.0 Methodology
For the quantitative estimate of the future evolution of demand is analyzed (for study in the FD), using basic statistical series, using multiple linear regression method, considering the variables of time, 5 years (period 2008-2012), historical data, defendants and three decision factors as economic indicators that represent the behavior of Mexican economic (gross domestic product - GDP, inflation and the national index of consumer prices - NICP). The trend shown in Figure 1, here you can estimate approximate growth CDW generation of a 25 500 T/year. Likewise, it is planned to offer, making an adjustment with three variables, under the same criteria. Similarly this is done for fields of study in Pachuca and its metropolitan area. In Figure 2, we see that the offer (for FD) from 2008 will decrease, leading in 2012, there is a shortage of product, so that you can not meet demand, forcing the application of environmental regulation in Mexico City (FD).

International Journal of Applied Science and Technology Vol. 2 No. 7; August 2012
48
These authors [4] analyzed the difference in prices of natural aggregate from different companies, and recycled aggregates produced in the only plant of this type of recycled materials, located in Mexico City (Table 2), for the 4 sizes of aggregate, according to what is produced in that plant material (1/4 ", 3/8", 3/4 "and 3").
Figure 1. Projection of stone aggregate demand in Mexico City
The table shows that prices for recycled aggregates are below the average 50% of natural aggregates, and thus obtained a good chance of successfully penetrating the Mexican market. Another factor impacting the cost of waste disposal is the transfer of waste to the landfill or recycling plant, directly impacting fuel consumption and maintenance of garbage trucks. These same price criteria are taken into account in the study in Pachuca and its metropolitan area. The Ministry of Environment of Mexico City, stated in its document Diagnosis and Management of Waste Minimization of the Construction Industry 2002 [5], transferring costs from the government RCD delegational (Table 3). Private costs for transportation services range depending on the following characteristics (Table 4). For the region studied in this paper followed the same criteria for transfer costs and government operations and individuals.
Figure 2. Projected supply of rock aggregates in Mexico City
T
Projected years
T
Projected years

© Centre for Promoting Ideas, USA www.ijastnet.com
49
Table 2. Comparative prices. Reference: Chamber of Industry sandbox FD and the State of Mexico. * C &
D Recycling Plant
NAME OF COMPANY
PRICE OF AGGREGATE BY m3
GRANZON NORMAL NORMAL ROCK SUBBASE
1/4" 3/8" 3/4" 3" DIMIX GROUP $60.00 $60.00 $58.00 - AGGREGATES CHILUCAN $59.00 $59.00 $89.00 - MEXICAN SAND $38.00 $60.00 $60.00 - MARVI $130.00 $95.00 $58.00 - MINE “EL OCHO Y MEDIO” $130.00 $55.00 $130.00 - MACHINERY AND QUARRY - $80.00 $70.00 - MINE “DON JUAN” - $98.00 $56.00 - CRUSHED VOLCANIC OF MEXICO $80.00 $42.00 $53.00 - ARENAS Y GRAVAS XALTEPEC $100.00 $100.00 $60.00 $60.00 MINE “LA ESTANCIA” $100.00 $100.00 $60.00 $60.00 MINE “MONSERRAT” - $100.00 $58.00 $58.00 CRUSHED SAN MIGUEL - $98.00 $55.00 $60.00 FERREMAGIC - $110.00 $65.00 $65.00 JOVAGA - - $60.00 $60.00 AVERAGE $87.13 $81.31 $66.57 $60.50 * RECYCLED CONCRETE $25.00 $40.00 $25.00 $25.00
Table 3. Cost ratio for the transfer and operation. Reference: SMA – FD
District zone Distance to move a truck of 7m3 Cost of transportation and operation
Álvaro Obregón 13km West Bordo $576.00 (monthly) Azcapotzalco 35 km West Bordo $563,600.78 (annual)
Cuauhtémoc 5 km Transfer Station Venustiano Carranza y Azcapotzalco
$200.00 for trip
Gustavo A. Madero 26km West Bordo $280.00 for trip Iztapalapa 40km (round trip), West Bordo $276.25 for trip Miguel Hidalgo 50km $655,000.00 for annun Tlalpan 47km West Bordo 2hrs of way $635.00 Venustiano Carranza 25 km West Bordo $250.00 Xochimilco 40 km West Bordo $600.00
Table 4. Cost ratio for the transfer and operation. Particular Reference: SMA – FD
Cost Material conditions Maximum distance
Rising material Site Truck Capacity
$750.00 (with invoicing)
No carpeting, rods, furniture and household garbage or hazardous.
35 km A foot truck 7
$345.00 (without invoicing)
No household garbage 35 km A foot truck 7
$450.00 (with invoicing)
No carpets, furniture or trash. 50 km Full service 7
The environmental inventory was made considering among other things, the location of the study area, its physiography, soils and population behavior. The study area, metropolitan area of Pachuca, Hidalgo, is north 20°11'south 20°01' north latitude east 98°41'west and 98°52' west longitude.
The dominant city in the metropolitan area, Pachuca de Soto, representing 0.76% of the surface across the state, bordered on the north by the municipalities of San Agustin Tlaxiaco and Mineral del Chico; to east by the municipalities of Mineral del Monte and Mineral de la Reforma, to the south with the municipalities of Mineral de la Reforma, Juárez Zapotlán Zempoala and on the west by the municipality of San Agustin Tlaxiaco (Figure 3). The physiography of the area contains, saw a 22.39% of the total area, hills mountains with a 28.26% 10.89% lomerío in a plain and a 38.46%. The geology of the municipality has the following composition (Table 5). The dominant soils in the municipality are: Cambisols, feozem, Lithosols, luvisol, regosol and Vertisol. The weather reported in the municipal area are semi-temperate and temperate subhumid with summer rains in lower humidity.

International Journal of Applied Science and Technology Vol. 2 No. 7; August 2012
50
Within the behavior of the population of the metropolitan area of Pachuca, the growth rate of population growth of 3.55 observed in the period 1990 to 1995, declining to 2.51 in the period from 1995 to 2000 and subsequently increased in the period from 2000 to 2005 to 3.12, the municipality Pachuca is the most representative and which exceeds one hundred thousand inhabitants, the municipality that has a greater increase in population is Mineral de la Reforma, while municipalities Mineral del Chico and Mineral del Monte have a lower growth.
Figure 3. Pachuca, metropolitan area, ZMP, State of Hidalgo. Reference: INEGI
Table 5. Local geology. Pachuca, Hidalgo. SOURCE: INEGI. Geographic Data Set of the Geological Map, 1:250 000.
PERIOD ROCK OR SOIL LITHOLOGICAL UNIT % SURFACE
KEY NAME NAME KEY NAME MUNICIPALITY
Q QUATERNARY EXTRUSIVE IGNEOUS
(bvb) BASIC VOLCANIC BRECCIA
0.84
SOIL (al) ALLUVIAL 24.23
T TERTIARY EXTRUSIVE IGNEOUS
(r) RHYOLITE 0.52
(at) ÁCID TOBA 2.80 (bt) BÁSIC TOBA 0.29
(bvb) BASIC VOLCANIC BRECCIA
4.49
(ag) ANDESITE GAP 15.79 (ma) MIDDLE VOLCANIC (at-b) ÁCID TOBA -BRECCIA 8.73 (va) VOLCÁNIC ÁCID (b-b) BASALT-BRECCIA 5.25 (vb) VOLCÁNIC BÁSIC VOLCANICLASTIC (vc) VOLCANOCLÁSTIC 20.65 N/A N/A JALES N/A 1.54 N/A N/A S/lt N/A 14.87
N/A: Not available.
Growth rate of the
metropolitan area of
Pachuca, 2005
Growth rate
Source: Census of
Population and Housing,
2005

© Centre for Promoting Ideas, USA www.ijastnet.com
51
In recent years, due to increasing housing supply, mainly in the municipalities of Pachuca and Mineral de la Reforma increased number of homes that were built and 22.845 houses in the period 2000 to 2005, within the metropolitan area Pachuca (Figure 4). In the period 2006-2010 is estimated to have had a proportion of housing at least similar or higher (25,000 homes).
With no real references and statistically reliable and generation of construction waste volumes in the study area, we used the procedure used elsewhere [6], which it established, based on economic data reported in the census of the National Institute of Statistics, Geography and Informatics (INEGI), in relation to the production values in the state of Hidalgo, in the field construction. To obtain the amount of production value in the city of Pachuca, was calculated based on the percentage of total construction investment (in thousands of dollars), representing the municipality within the state, reported by the INEGI, in its 2009 economic census, which reported a total state investment of $240,520.00 (Mexican pesos) and the municipality of Pachuca reported amount of $63,266.00 (Mexican pesos), this represents 38% compared to the state.
Figure 4. Housing construction in the metropolitan area of Pachuca, Hidalgo. SOURCE: II Counting of Population and Housing 2005. INEGI.
Then we applied the estimated cost per m2 in order to obtain the values of m2 per year, based on the study conducted by the company "Cost Engineering Varela" [7], which provides, for the city of Pachuca, a amount of $0.912/m2 construction. For volume estimates of CDW, we applied the estimated factor of 0.85. In the field studies found that the volume of work in m3, was approximately 6.75% which becomes construction debris. (SMA DF, 2002). Finally, the volume in m3 of this waste is converted to tons considering a volumetric weight of 1.5 T/m3. Below is presented (Table 6) a summary of the results obtained in the period of five years (2005-2009).
Table 6. Estimated annual generation of CDW in the town of Pachuca. Authors.
Year
Production value generated in Hidalgo (INEGI)
Production value generated in Pachuca (38%)
Estimated area (construction cost in Pachuca $0.912/m2)
Estimated volume of construction (0.85 m3)
Estimated Generation CDW (6.75%)
Generation in Ton. CDW (factor 1.50)
2005 $2,691,209.60 $1,022,659.65 1,121,337.33 953,136.73 64,336.73 96,505.09 2006 $2,210,866.00 $840,129.08 921,194.17 783,015.04 52,853.52 79,280.27 2007 $2,869,121.00 $1,090,265.98 1,195,467.08 1,016,147.02 68,589.92 102,884.89 2008 $5,999,197.00 $2,279,694.86 2,499,665.42 2,124,715.60 143,418.30 215,127.45 2009 $3,305,986.00 $1,256,274.68 1,377,494.17 1,170,870.04 79,033.73 118,550.59

International Journal of Applied Science and Technology Vol. 2 No. 7; August 2012
52
3.0 Results and discussion
• Conditions for the design of the recovery plant
In order to minimize noise generation, those elements likely to cause higher levels of acoustic emission (screens, mills, crushers, etc.). Will be equipped with closed shells that minimize the noise impact. You should also install a dust suppression spray connected to a purification equipment in those parts where providing higher levels of dust generation. As it is expected segregation of waste is classed as dangerous in the preliminary classification of waste, should build a ship or porch roof for storage until shipment to an approved management center. The floor must be waterproof, and equipped with a spill collection system that ends in a tank. In order to reduce the visibility of the elements of treatment plant waste, vegetable display is proposed to set around the perimeter of the plot, samples of Pinus pinea, in 1.25 m in height, should be placed in three rows with a staggered distribution at a distance of 3 m between trees. The shrub layer raised to species Lonicera japonica and Parthenocissus quinquenifolia should be placed sandwiched between the specimens of pine.
Conditions relating to the operation phase for the acceptance of waste states that may be received at the facilities that waste from demolition and construction (Level II as defined in the Plan for Integrated Management of Construction and Demolition Waste in the Community of Madrid 2002-2011), that is, those wastes generated primarily in the activities of construction, demolition, home repair and deployment of services. In any case, work procedures should be developed to prevent the acceptance of waste listed as hazardous (Chapter 17 of the list of European Waste Catalogue published in the ORDER MAM/304/2002, February 8) and their segregation in the sorting facility in anticipation that they may receive mixed with inert waste construction and demolition. For the acceptance of waste at the landfill should be adopted the criteria for landfills for inert waste (Article 6 of Royal Decree 1481/2001 of December 27, which regulates the disposal of waste by landfill).
Concerning the management of leachate and prior to the evacuation of the leachate pond, there must be sampling and analysis of the leachate. The parameters for analysis are those contained in Annex Table Title IV of the Royal Decree 849/86 of April 11 (1986), therefore approves the regulation of public water. In the event that any of the leachate exceed the limit values indicated in Table first of the said Annex of the Public Water Regulation, it must undergo treatment prior to disposal to bed. Periodically cleaning shall be based on the raft. The sludge that can be collected from the bottom of the basin should be analyzed to define the type of waste to which it belongs according to Law 10/98, Waste, and develops regulations. Once characterized, must be managed according to their nature.
The conditions for the restoration of the landfill from each of the phases under the project will be carried out either simultaneously with the work of farm or at the end of each operating phase. Also, must comply with all the measures outlined in the section on the restoration of areas affected by the deposit of the Environmental Impact Study. Conditions for hazardous waste operations segregated waste sorting facilities, and that are considered hazardous waste and Hazardous wastes generated in the work of repair and maintenance of plant machinery for the treatment of waste should be stored in a craft designed for this purpose and to be sent to an authorized service center for management.
For the conditions for the protection of the atmosphere does not exceed the average concentration of settleable particles in twenty-four hours, 30 mg/m2 in the area of influence of the activity (established by Decree 833/75 of February 6, which develops the Law 38/72 of protection of atmospheric environment in terms of air quality criteria, in particular). A simple scheme stage, function and purpose of the installation shown in Figure 5.

© Centre for Promoting Ideas, USA www.ijastnet.com
53
Figure 5. How a recovery plant of RCD. SOURCE: GEDESMA, Spain.
An RCD recovery plant must have the following areas for their operation (Figure 6).
1. Reception and Weighing: has 2 scales from 60 tons to 16 meters for weighing trucks and semi-rigid. The computer will handle all inputs and outputs of the plant.
2. Downloading and seeding: there are 2 large platforms, the first platform, where the trucks unload the waste. This will be a seeding of the residue with the bulky mechanical drawing. In the second platform, selected products are collected and fed the selection lines and crushing. It has a sorting area for bulky items recoverable and non-recoverable. There will be mobile machinery and containers for their classification, which aims to minimize the rejection of the landfill.
3. Waste sorting line > 250 mm: Once the waste is metered seed to a vibrating feeder. The thick> 250mm will be selected from a plate feeder. Ferrous elements are separated by a magnetic separator, as well as plastics, wood and cardboard items by hand sorting in a cabin of triage.
4. Line RCD mixed classification: The product fed into the feeder of size less than 250 mm is subjected to a mechanical sorting through trommel and magnetic separators and manual selection of light in the cabin of triage. As a result of all this selection process the following fractions are obtained: - Arid 0 – 20 mm - Arid 20 – 40 mm - Plastics light - Cardboard - Plastics dense - Wood - Scrap - Products classified as toxic or hazardous.
Also get a 40-250 mm aggregate fraction free of fines and higher purity to be sent to the line of grinding. The plant design elements must be flexible to adapt to the high variability of the waste. Therefore, the mechanical equipment will:
- Change size trommel screening. - Expansion of triage to the second transmission line trommel intern. Spaces be provided for installation of equipment that enables the plant to adapt to new techniques that improve the performance ranking of recovery.
RECEPTION AND WEIGHING
CLASSIFICATION OF PLATFORM
RECOVERY OF BULKY
CRUSHING
CDW CLEAN
MIXED CDW
RATING
CRUSHING
DENIALS RECYCLED
AGGREGATE
PRODUCTS RECYCLED
RECYCLED PRODUCTS
RECYCLED AGGREGATES
DENIALS RECYCLED
AGGREGATE

International Journal of Applied Science and Technology Vol. 2 No. 7; August 2012
54
Figure 6. Distribution of the areas in a plant for recovery of CDW. SOURCE: GEDESMA, Spain.
5. Crushing Line: This line was assayed sorted waste and sliced to a maximum size of 500 mm. The residue is chopped to a primary mill dosed. Line are extracted primary crushing thin <40 mm to control pollutants and classification and reduced particle size 500 - 40 mm in sizes 0 - 160 mm, obtained by primary screening the following fractions: - Secondary crushing coarse aggregate to 40 to 160 mm. - Arid fine for secondary classification from 0 to 40 mm.
The primary crushing line goes through two branch lines:
In the secondary line is provided a grinding mill for grinding the thick 40 to 250 mm from the sorting line of dirty, thick 40 to 160 mm from the primary screening and thickness > 40 mm sieve rejected by the school.
Another dry mill to reduce these sizes 0 - 40 mm recirculating the secondary screening product. In the secondary line selection screening is performed on the fraction 0 - 40 mm, yielding the following fractions:
- Arid 0 – 12 mm. - Arid 12 – 20 mm. - Arid 20 – 40 mm.
The thick> 40 mm are sent to the secondary mill for further refining them. On fractions 20 to 40mm of prescreening and 0 – 160mm in the power of the primary screening is performed to remove slight separation of particulate pollutants clean incoming CDW. Also performed magnetic separation for the extraction and metal rebar incoming residue.
5. Collection and preparation of materials: These are the areas of the plant for the collection and preparation of materials for further management by recyclers or authorized agents. Will undertake the following operations:
- Collection container for recovered materials. - Ferrous. - Plastics dense. - Collection in Trojan:
� recycled aggregates. � Wood. � Rejects.

© Centre for Promoting Ideas, USA www.ijastnet.com
55
- Densification of lightweight plastics and cardboard recovered and storage platform. - Storage products ship hazardous materials that must be managed by authorized agents.
6. Effluent treatment: These are very important to comply with the parameters required by the legislation in the gaseous and liquid effluents produced in the facility. This provides control elements:
- Raft of leachate for the control of contaminated effluent produced by the plant and reservoir. These will be collected by an authorized agent.
- Settling ponds dirty rainwater will be used to control runoff generated in the process of operating the plant and warehouse.
- Dust reduction system by water spray and screen capture.
7. Multipurpose Building:
- The building for multiple uses, has dimensions 15.00 x 10.00 x 3.80 m. - The program needs to be raised is the need to have ownership of different spaces within the building,
it is to achieve a distribution so that houses the following departments: three offices, warehouse, office, fourth cleaning, classroom and meeting room and toilets needed for normal use of the property.
- It has raised the need to use the same for people with disabilities, so it is designed in such a manner that complies with the Law 8/1993 of June 22, for the Promotion of accessibility and removal of architectural barriers in the community Madrid, and all decrees concerning this aspect.
- The foundation is by concrete isolated footings to support concrete pillars also supports a floor which unidirectional horizontal reinforced concrete with precast concrete slab and prestressed beams.
- The pads are connected by tie beams at the perimeter of the building that will also serve to support the construction of the enclosure.
- The enclosure is comprised of two factories, the exterior will be made by precast concrete blocks received with cement mortar and river sand, the interior will double hollow brick partition wall placed 7 cm. thick. Exist between the two sheets in an air chamber which is placed a foam insulation polyurethane.
- The deck will be implemented through Palomero partitions supported on the slab, the seat of concrete prefabricated slabs that support the ceramic tiles. Be placed on the slab insulation.
8. Building Services
- The building for services has dimensions 14, 00 x9, 00 x 3.80 m. - This will house the staff changing rooms and rest area for which the program has been proposed
distribution is placing two changing rooms with toilets, one for men and one for women, as well as a unit to house a kitchen with living dining room also has a clean room and a distributor for access.
- The foundation is by concrete isolated footings to support concrete pillars also supports a floor which unidirectional horizontal reinforced concrete with precast concrete slab and prestressed beams.
- The pads are connected by tie beams at the perimeter of the building that will also serve to support the construction of the enclosure.
- The enclosure is comprised of two factories, the exterior will be made by precast concrete blocks received with cement mortar and river sand, the interior will double hollow brick partition wall placed 7 cm. thick. Exist between the two sheets in an air chamber which is placed a foam insulation polyurethane.
- The deck will be implemented through Palomero partitions supported on the slab, the seat of concrete prefabricated slabs that support the ceramic tiles. Be placed on the slab insulation.
9. Building Control
- The building used to control access to and control complex weighing of the goods has dimensions of 6.00 x 4.00 x 3.80 m.
- This will house the necessary equipment to control scales and personnel for their use.

International Journal of Applied Science and Technology Vol. 2 No. 7; August 2012
56
- The foundation is done by support footings for wall cladding, which will load bearing of the upper
horizontal boundary. This will consist of a horizontal cast concrete way, with precast concrete slab and prestressed beams.
- The enclosure is comprised of two factories, the exterior will be made by precast concrete blocks received with cement mortar and river sand, the interior will double hollow brick partition wall placed 7 cm. thick. Exist between the two sheets in an air chamber which is placed a foam insulation polyurethane.
- The deck will be implemented through Palomero partitions supported on the slab, the seat of concrete prefabricated slabs that support the ceramic tiles. Be placed on the slab insulation.
10. Process Vessel
- The ship, attached to the vessel maturation is rectangular with dimensions 65 x 40 m height pillars of 11.35 m. The precast concrete structure and consists of frames spaced 20 m wide 7.50 m. and 10.00 m each.
- The eaves will be concrete firm formed by artificial ballast 20 cm and 20 cm concrete layer HP-4, 0 with mesh of 150 x 150 x 6.
- The roof is projected to two waters and will consist of pre-painted steel sheet of 0.60 mm thick on precast concrete belts. Part of the roof covering panels have translucent polyester naturally illuminate the interior of the ship.
- Stormwater from the roof is collected by gutters and downspouts are conducted through a system of manholes downspout walk from where they are taken to a rainwater collector.
11. Vessel Shop
- A ship is designed for repair and maintenance of mobile machinery and various equipment, and spare parts storage.
- The vessel, attached to the vessel maturation is rectangular with dimensions 25.45 x 14.20 m with a minimum gauge of 5.00 m. The precast concrete structure and consists of three frames Light 14.20 m 12.62 m spaced every. The foundation is solved with isolated footings pads connected by the curtain walls. Laterally, the enclosure is provided the ship with concrete walls and concrete blocks split type precast concrete.
- The floor will be concrete firm formed by artificial ballast 20 cm and 20 cm concrete layer HP-4, 0 with mesh of 150 x 150 x 6.
- The roof is projected to two waters and will consist of pre-painted steel sheet of 0.60 mm thick on precast concrete belts. Part of the roof covering panels have translucent polyester naturally illuminate the interior of the ship.
- Stormwater from the roof is collected by gutters and downspouts are conducted through a system of manholes downspout walk from where they are taken to a rainwater collector.
- Vessel Storage and Hazardous Recyclable Products. - We have designed a whole building for storage of recyclables and hazardous waste. The building has
a length of 23.58 x 10.57 m holes partitioned into two useful dimensions of 11, 50 x 10 m. - The building is executed based on isolated footings reinforced concrete beams joined by struts. The
floor is concrete HP-4, 0 of 0.20 m thick concrete set on cleaning. - The structure is metal pitched roof with roof made based on pre-painted sheet of 0.6 mm thick. The
closing of the ship of dangerous products is made based on prefabricated concrete blocks. In the case of the reusable closure is performed with a simple twist mesh.
- Stormwater from the roof is collected by gutters and downspouts are conducted through a system of manholes downspout walk from where they are taken to a rainwater collector.
- Deposits - A warehouse set is designed for water supply and fire with a capacity of approximately 100 m3 each.
The operation arose independently, but you can connect the two vessels by valves located on the edge of the two vessels.
- Two glasses are made of inner dimensions 6 x 5.6 m and 3 m working height (3.5 m total). Adjacent to vessels running the pump house interior dimensions 10.85 x 3.30 m made of concrete block split type. The tank cover is made based on a flat roof slab. The cover of the pump house is through a slab of concrete to water that sit on the tiles. The structure is made of reinforced concrete.

© Centre for Promoting Ideas, USA www.ijastnet.com
57
• Economic evaluation.
To make a reliable economic evaluation is necessary to take into consideration all the factors involved in the production process and recycled aggregate current market prices of traditional aggregates. So you must first establish a basis of calculation to substantiate the results achieved. Like any economic evaluation of this kind is a cost point of production. Presents each of the component indicators. The annual production of the project is estimated at 100 000 tons which corresponds to the average calculated for the study area. For social and ecological interest in having this work may be considered to be exempt from taxes and that the land could be donated by the state government concerned. To be attractive to the cost obtained is proposed sales price and the approximate time that the initial investment is recovered. It also analyzes alternative to the marketing of the recycled product, which contains the additional revenue that can be obtained at the facility. The basic ideas for the economic evaluation were obtained from the work described by other authors [8].
1. Calculation Basis:
Time and annual production …………………………………………. 61T/h and 120 000T/year Production Hours ……………………………………………………… 2000 h Production Days ………………………………………………………. 250 days Equipment life …………………………………………………………. 15 years (30 000h) Average volumetric weight natural aggregates (NA) …………………. 1450 Kg/m3 Average Volumetric Weight recycled aggregates (RA) ………………. 1250 Kg/m3 Sales price RA …………………………………………………………. 15% additional cost Sales price NA …………………………………………………………. $150/m3 Reception Price Solid Waste Landfill (WL) …………………………… $160/T Euro Dollar Conversion ………………………………………………… 1:1.5 Mexican Peso Dollar Conversion ………………………………………. 12:1 Plant Manager Salary …………………………………………………… $20 000.00 Mexican Pesos Salary skilled workers ………………………………………………….. $5 000.00 Mexican Pesos Salary workers assistants ………………………………………………. $3 000.00 Mexican Pesos Average number of working hours per month …………………………. 176h
2. Economic indicators
a) Cost of purchase. The full price of a plant or Type B Level 3 is approximately 2.4 million Euros (Table 7. Gedesma Quote, Spain. 2005) which in this case amounts to the same dollar value, including freight USA-Mexico. Includes the concept of laboratory equipment and utensils with which the final cost of equipment acquisition totaled 42.6 million Mexican pesos (3.55 million USD).
b) Cost of Installation. It is estimated that the cost of installation is 15% of computers that require it. According to the study [8] developed in the United States is considered that 75% of whole plant installation required. At this point the added costs for expenses in civil works for the construction of foundations, office, laboratory, sanitation and other infrastructure requirements of the installation.
c) Total Initial Investment. It is the sum of the points a and b.
d) Depreciation, usd/hour. Is the cost of acquisition of equipment between the hours of useful life of equipment. No salvage value was considered because it is estimated that decommissioning costs are roughly equivalent to the income of such equipment as scrap.

International Journal of Applied Science and Technology Vol. 2 No. 7; August 2012
58
Table 7. Direct costs of mechanical equipment for a plant CDW type 3. Source: Gedesma. Spain. 2005.
DESCRIPTION UNIT COST €
TOTAL € Conversion ($17.5/€)
Total $
MECHANICAL EQUIPMENT 1,218,518.13 21,324,067.28
ACCESS CONTROL 5,587.67 97,784.14 Supply and installation of scale BP-001 5,587.67 97,784.14 CDW RATING LINE 435,844.09 7,627,271.49
dirty classification
Vibrating feeder AL-101 s/ E.T. 17,063.57 298,612.39 SM-103 Electromagnet, structure, stairs, discharge hopper s/ET
12,990.99 227,342.33
CT-104 conveyor inclined to select. > 250 mm s/E.T.
5,456.86 95,495.05
CT-105 conveyor selection fraction> 250 mm s/ET
12,510.13 218,927.19
Platform Selection PS-105.1 s/ E.T. 14,395.56 251,922.30 Cabin Selection CS-105.1 s/ E.T. 13,198.05 230,965.79 Conveyor belt. CT-106 collected. Fracc. <200 and alimentac. s/E.T.
7,354.55 128,704.54
CR-109 Tromel classifier fractions 20, 40 and 80 mm s/ET
72,687.70 1,272,034.66
Light extraction system SL-112.1 s/ E.T. 19,107.88 334,387.90
cabin output
Fixed Conveyor CT-108 s/ E.T. 3,097.15 54,200.04 Light extraction system SL-112.2 s/ E.T. 54,454.50 952,953.75 Coupling rotary hopper TO-115.1 s/ E.T. 10,209.75 178,670.54 Conveyor belt. CT-110 slanted selection. coarse fraction s/E.T.
9,823.95 171,919.13
vol classification
CT-111 conveyor selection coarse fraction s/ET
14,496.98 253,697.06
Platform selection PS-111.1 s/ E.T. 14,395.92 251,928.51 Cabin Selection CS-111.1 s/ E.T. 13,198.05 230,965.79 Plate Feeder AL-102 s/ E.T. 33,508.52 586,399.01 SM-107 Electromagnet, structure, stairs, discharge hopper s/ E.T
12,990.99 227,342.33
CT-113 conveyor output triage s / ET 5,879.42 102,889.76
gathering 0-20
CT-120 Conveyor under trommel fraction 0-20 mm s/ E.T.
4,403.86 77,067.46
CT-121 conveyor output fraction 0-20 mm s/ E.T.
7,354.55 128,704.54
CT-122 conveyor belt for collection fraction 0-20 mm s/ E.T.
23,198.21 405,968.59
gathering 20-40
Conveyor belt. CT-123 trommel regogida under fracc. 20-40 s/ E.T
4,403.86 77,067.46
CT-124 Conveyor fraction collection 20-40 mm s/ E.T.
7,354.55 128,704.54
CT-125 Conveyor fraction collection 20-40 mm s/ E.T.
23,198.21 405,968.59
Light suction system SL-126 s/ E.T. 19,110.42 334,432.26 CRUSHING AND SCREENING LINE 402,928.98 7,051,257.15
Secondary crushing
Conveyor belt. CT-116 to mill sub s/E.T. 9,665.92 169,153.51 Impact Crusher MO-117 APKE -1010 s/ E.T.
32,113.67 561,989.14
Conveyor belt. CT-118 to mill sub s/ E.T.
7,088.34 124,045.95
Conveyor belt.. CT-119 bypass a primary screening s/ E.T.
7,088.34 124,045.95

© Centre for Promoting Ideas, USA www.ijastnet.com
59
Fine Food
Vibrating feeder AL-201 s/ E.T.
41,546.75 727,068.13
Conveyor belt CT-302 s/ E.T. 3,998.20 69,968.50 Primary crushing
Crusher MC-202 MH-1.070 s/ E.T. 75,484.83 1,320,984.44 Conveyor belt CT-203 to screen s/ E.T. 9,665.92 169,153.51
Primary screening
Conveyor belt CT-205 to screen s/ E.T. 7,088.34 124,045.95 Light extraction system SL-206.2 s/ E.T. 51,674.17 904,297.98 A plate vibrating screen CV-207 s/ E.T. 29,793.84 521,392.20 Conveyor belt CT-208.1 transport fraction >40 mm s/ E.T.
4,398.37 76,971.39
Conveyor belt CT-208.2 rejection > 40 to mill s/ E.T.
6,443.95 112,769.04
Secondary screen
Vibrating screen three trays CV-209 s/ E.T.
31,848.72 557,352.60
Conveyor belt CT-210 collection. Size 0-12 mm s/ E.T.
6,910.87 120,940.23
Conveyor belt CT-210.1 Size 12-20 s/ E.T.
3,998.20 69,968.50
Conveyor belt CT-210.2 collection. Size 20-40 mm s/ E.T.
3,998.20 69,968.50
Conveyor belt CT-210.3 material rejection > 40 mm s/ E.T.
6,443.95 112,769.04
Feeding Conveyor belt CT-211 sterile output s/ E.T.
6,443.95 112,769.04
Vibrating feeder AL-301 s/ E.T. 11,341.35 198,473.54
Screening
Conveyor belt CT-212 to sieve material 0-80 mm s/ E.T.
7,088.34 124,045.95
Vibrating screen CV-213 two trays S/ E.T.
21,132.76 369,823.30
Conveyor belt CT-214 collection. Sizer 0-20 mm s/ E.T.
3,672.84 64,274.61
Conveyor belt CT-214.1 collection. Size 20-40 mm s/ E.T.
6,910.87 120,940.23
Conveyor belt CT-214.2 rejection. Size 40-80 mm s/ E.T.
7,088.34 124,045.95
Light extraction system SL-206.1 s/ E.T. 19,110.42 334,432.26 MOBILE EQUIPMENT 256,701.41 4,492,274.59 Truck amplirrol CM-301 y GC301.1 s/E.T. 46,565.42 814,894.85 Loader PC-302 / PC-303 s/E.T. 73,946.91 1,294,070.84 Rotating hydraulic backhoe cab MG-304 s/E.T. 87,468.63 1,530,700.94 Telehandler MT-305 s/E.T. 35,494.52 621,154.01 Piquersa Dumper Model 15005-VH or similar DM-306 s/E.T.
10,859.64 190,043.61
Container 30 m3 open box with hook s/E.T. 1,394.43 24,402.53 Tippers CB-404 5 m3 s/ E.T. 971.88 17,007.81 AUXILIARY EQUIPMENT 117,456.00 2,055,479.91 Generator GE-401 s/ E.T. 39,922.88 698,650.40 Self-compacting SC-402 s/ E.T. 7,777.53 136,106.69 Fuel Tank FT-403 s/ E.T. 2,916.89 51,045.49 Treatment plant with tertiary system total oxidation TP-405 s/ E.T.
12,481.82 218,431.76
Dust collection system DC-406 s/ E.T. 49,157.79 860,261.33 Lobby clean water LC-408 s/ E.T. 2,352.78 41,173.65 Group Industrial water pressure GI-409 s/ E.T. 2,846.32 49,810.60

International Journal of Applied Science and Technology Vol. 2 No. 7; August 2012
60
e) Depreciation of plant, usd/hour. Refers to the amortization of installation costs. Its value is obtained by dividing the subsection b) between the hours of useful life of equipment. f) Cost of maintenance and repairs, usd/hour. Is 90% of the cost of depreciation. g) Cost of Labor, usd/hour. To calculate the labor costs incurred by the staff took into consideration the occupational classification wages each time under work. h) Cost of Energy (fuels, lubricants and electricity) usd/hour. The calculation was done through the display appeared in the publication of reference [8]. We identified the increased cost of the plant that appears in the work cited above and also took into consideration that the indicator of 45.85 usd/h is related to 750 hours of production while the proposal say 2000 hours. i) Indirect costs, usd/hour. The value is obtained 0.5% of the total initial investment by the number of annual operating hours. j) Interest and Insurance, usd/hour. Although forecasts of interest rates in Mexico in 2008 are 7.93% [9], is considered a 9% on the total initial investment. As insurance is 1% use the same value. Both numbers are added and divided by the number of annual operating hours. k) Total Cost per hour. Is the sum of the paragraphs of d) to j). l) Cost of production, usd/T. It can be calculated through the ratio of total cost per hour between production times. The results of the production cost of the recycling plant are summarized as follows:
� Investment in equipment, Mexican Pesos (MP)------------------ $21 342 067.28 � Installation costs, MP-------------------------------------- $3 201 310.09 � Total Initial Investment, MP ----------------------------------- $24 543 377.37 � Depreciation, MP/hora---------------------------------------- 711.40 � Depreciation several, MP/hora--------------------------------------- 106.71 � Maintenance and Repair Cost, MP/hora------- 640.26 � Labor, MP/hora-------------------------------------- 232.93 � Energy, MP/hora----------------------------------------- 1 383.74 � Indirect Costs, MP/hora----------------------------------- 613.58 � Interest and Insurance MP/hora--------------------------------- 1 227.17 � Total Cost per hour, MP/hora-------------------------- 4 915.79 � COST OF PRODUCTION, MP/T------------------------- 98.32
Below is the percentage of investment in equipment, plant recovery of RCD. (Figure 7).
Figure 7. Percentage of direct cost of mechanical equipment used in a plant for recovery of RCD. Authors.

© Centre for Promoting Ideas, USA www.ijastnet.com
61
• Price of recycled aggregate and amortization of the total initial investment (without considering additional revenues to the plant).
For a better understanding of the profitability or otherwise of the investment must undertake an analysis of prices in the equivalent of the Mexican currency and a conversion higher than currently exists (1:12) which, if positive, will give a margin in favor of the proposal. If one considers a gain of 15% over the cost, then the sale price would be: Plant Sale Price = Production Cost x 1.15 = $ 113.06/T Since there is an acceptable margin between the selling price of recycled aggregate of $ 113.06/T ($141.33/m3), and the traditional aggregate of $ 150m3, this allows to continue exploring the possibility of a broker to market the product. In Mexico it is known [10] that retailers gain is in the order of 20-30% for this study estimates a gain of 25%. Broker Price = Price in Plant x 1.25 = $141.33/T At these prices the consumer has, performance being equal between the two added a net savings of $28.27 MP/T of recycled aggregate purchases from a broker. Expressed in units of volume that is commonly sold as this product would get a profit of $35.33 MP/m3. If purchased directly from the savings would plant more logically. The amortization period of the total initial investment depends on the amount of such investment and the annual profit from sales. Time Payback = Initial Investment / Total Annual Profit (a)
Total Initial Investment---------------- $24 543 377.73 Annual gain = Annual Income from sales - Annual Expenses (b) Annual Income = Annual Production x Price in Plant = 100 000 t x $113.06/T = $11 306 323.67 Annual Expenses Cost = Annual production x recycled aggregate production (RA) = 100 000 t x $98.32/T = $9 831 585.80 Substituting in (b) would be: Annual gain = $ 1 474 737.87 Now with the value of the total initial investment and the result obtained in (b) is replaced in (a) and determined: Investment Recovery Time = $24 543 377.37/ $1 474 737.87= 16.64 años In analyzing the payback time on the ground shows that this is greater than the depreciation period for fixed installation equipment that is 15 years, adding to the above proper use of equipment and a systematic plan of maintenance recovery should be achieved by the calculated time and with it an anticipated availability of annual earnings.
• An alternative for reducing the recovery time the total initial investment. Additional revenue contribution.
a) Fee income from sale of waste debris and no stone If the plant is receiving income from selling recyclable debris and no stone could then reduce the overall cost of production of recycled aggregates. The price to be considered by the entry of debris into the plant must be less than currently charged at the landfill and a magnitude as to constitute an incentive for them not deposited indiscriminately on illegal sites. According to a personal consultation with those who have used the services of trucks for hauling of this debris is suggested that the charter price hovers around $400 per truck of about 4.0 m3 (5-6 T) obviously would not be the final destination in landfill and the amount paid for each trip would be 800-960 MP plus the value of freight. As the transport current price is about $400 per truck and the price of disposal in landfills is $160/T was estimated settlement price of entry to the plant for $10 per T rubble. Thus, the carrier will only pay for the recycling facility, a $60 pesos per truck (6 T) and you have $340 for expenses and profits of their work also allows legal behavior in society.
As for the price of stone materials that can be recycled in another process can be seen from the average price had these marketing materials (cardboard, plastics, scrap metal, wood, aluminum and others) in 1996 [9] and whose value was $1000/T. To assess the transformation of this magnitude in time is estimated 10% annual inflation and the application of a mathematical expression [11] for calculating the price at the present time, the result is $1949/T. For the purposes of this paper proposes an average selling price of non-recyclable materials stone, or 50% of $974.50/T. If higher inflation were applied to 10% the price obtained would also be higher and would give higher investment income raised.

International Journal of Applied Science and Technology Vol. 2 No. 7; August 2012
62
With respect to the composition indicated in Table 8 [12] shows that about 10% of all the debris can not be recycled as aggregate. It is estimated that only 4% of that amount may be sold and another 6% rejection, composed mainly of recycled aggregates unsuitable for use in mortar and concrete, would be given free municipal or state government to fill jobs or other useful application.
Table 8. Waste Composition in the Federal Building, in %
Type work
Material of excavation
Concrete Block partition
Drywall plaster
Ceramic Wood Others materials
Land routes 64.12 2.94 23.53 2.00 - 3.53 3.88 Water Works 52.41 37.93 9.66 - - - - Urbanization 42.75 29.77 14.09 6.12 1.60 0.81 4.86 Installations 28.57 40.82 30.61 - - - - Non-residential building - 1.79 70.46 24.30 - 0.77 2.68 Dwelling 85.94 3.52 2.64 - 0.88 4.22 2.80 Debris on public roads 45.23 39.64 7.38 - 2.09 1.53 4.13 Others 26.28 38.62 28.24 - 2.24 1.33 3.29 TOTAL 345.30 195.03 186.61 32.42 6.81 12.19 21.64 Average Percent 43.16 24.38 23.33 4.05 0.85 1.52 3.60
• Calculation Basis:
Price entry to the plant debris------------ $10/T Price recyclables no stone----------- $974.50/T % No stone rubble------------------------------------- 10% % Rubble stone of non-marketable ---------------- 4% Annual Income debris ------------------------ 100 000 T Annual income per catch debris = 100 000T x $10/t = $1 100 000 Annual income from sales of non-stone = 100 000t x 0.04 x $974.50/T = $3 898 600 Total Additional Revenue = $10 775 600 Total Annual Income = Income from Sale of AR + additional Revenue Total = $ 22 081 923.67 With this result is recalculated annual profit and then the payback time of the plant. Annual gain = Annual Income - Total Annual Expenditure = $ 12 250 337.87 Investment Recovery Time = $ 24 543 377/ $ 12 250 337.87 = 2 años
As can be seen in the two analyzes income above the ground are greatly favored if only charges a 6.25% tax they currently landfill to receive debris from the construction and sale, half price , of stone no other recyclable materials. For this concept is possible to reduce the payback period on investment of 16.64 plant to 2 years. This considerable difference in the amortization period as a result of the additional revenue to the plant, to analyze other variants related to the sale prices of RA. One possibility could be the reduction of the selling price of the RA to achieve a greater incentive in their marketing and thus offset any technical deficiency that can present the recycled aggregate concrete in use in hydraulic systems.
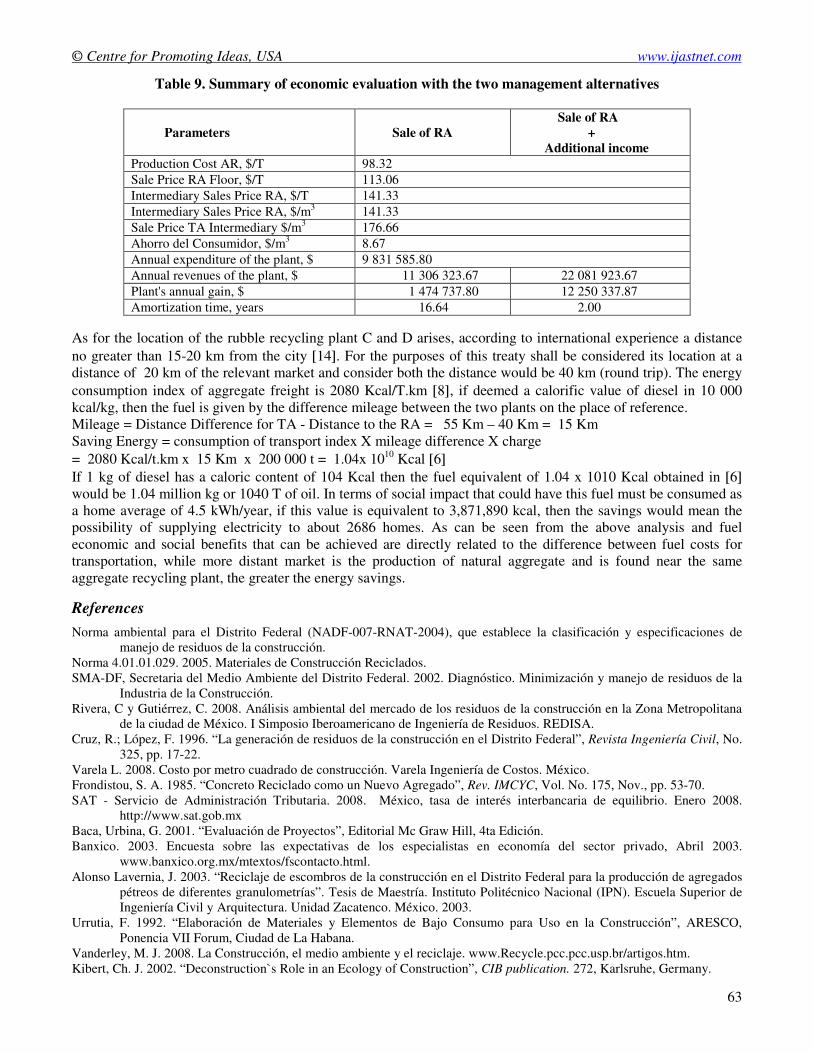
You can analyze multiple variants that combine the fundamental interests of the investment: price of recycled aggregate (RA) competitive, annual profit and capital recovery. Is presented in Table 9 an overview of economic evaluations without considering selling at cost price RA.
As noted in previous chapters these aggregates can also be used in shaping blocks. According to the claim Urrutia and colleagues at work [13], 1992) if using the aggregate total of 100 000 t, making it be enough to block the construction of 3 500 houses. Although there are reports indicating that the debris requiring less power in crushing the stones and natural rocks [14] there is insufficient reports strongly endorse this statement. But savings can be significant if energy is transportation. The amount of aggregate transported in both cases for comparison is the same or of 100 000 T/ year.
© Centre for Promoting Ideas, USA www.ijastnet.com
63
Table 9. Summary of economic evaluation with the two management alternatives
Parameters Sale of RA Sale of RA + Additional income
Production Cost AR, $/T 98.32 Sale Price RA Floor, $/T 113.06 Intermediary Sales Price RA, $/T 141.33 Intermediary Sales Price RA, $/m3 141.33 Sale Price TA Intermediary $/m3 176.66 Ahorro del Consumidor, $/m3 8.67 Annual expenditure of the plant, $ 9 831 585.80 Annual revenues of the plant, $ 11 306 323.67 22 081 923.67 Plant's annual gain, $ 1 474 737.80 12 250 337.87 Amortization time, years 16.64 2.00
As for the location of the rubble recycling plant C and D arises, according to international experience a distance no greater than 15-20 km from the city [14]. For the purposes of this treaty shall be considered its location at a distance of 20 km of the relevant market and consider both the distance would be 40 km (round trip). The energy consumption index of aggregate freight is 2080 Kcal/T.km [8], if deemed a calorific value of diesel in 10 000 kcal/kg, then the fuel is given by the difference mileage between the two plants on the place of reference. Mileage = Distance Difference for TA - Distance to the RA = 55 Km – 40 Km = 15 Km Saving Energy = consumption of transport index X mileage difference X charge = 2080 Kcal/t.km x 15 Km x 200 000 t = 1.04x 10¹⁰ Kcal [6] If 1 kg of diesel has a caloric content of 104 Kcal then the fuel equivalent of 1.04 x 10¹⁰ Kcal obtained in [6] would be 1.04 million kg or 1040 T of oil. In terms of social impact that could have this fuel must be consumed as a home average of 4.5 kWh/year, if this value is equivalent to 3,871,890 kcal, then the savings would mean the possibility of supplying electricity to about 2686 homes. As can be seen from the above analysis and fuel economic and social benefits that can be achieved are directly related to the difference between fuel costs for transportation, while more distant market is the production of natural aggregate and is found near the same aggregate recycling plant, the greater the energy savings.
References
Norma ambiental para el Distrito Federal (NADF-007-RNAT-2004), que establece la clasificación y especificaciones de manejo de residuos de la construcción.
Norma 4.01.01.029. 2005. Materiales de Construcción Reciclados. SMA-DF, Secretaria del Medio Ambiente del Distrito Federal. 2002. Diagnóstico. Minimización y manejo de residuos de la
Industria de la Construcción. Rivera, C y Gutiérrez, C. 2008. Análisis ambiental del mercado de los residuos de la construcción en la Zona Metropolitana
de la ciudad de México. I Simposio Iberoamericano de Ingeniería de Residuos. REDISA. Cruz, R.; López, F. 1996. “La generación de residuos de la construcción en el Distrito Federal”, Revista Ingeniería Civil, No.
325, pp. 17-22. Varela L. 2008. Costo por metro cuadrado de construcción. Varela Ingeniería de Costos. México. Frondistou, S. A. 1985. “Concreto Reciclado como un Nuevo Agregado”, Rev. IMCYC, Vol. No. 175, Nov., pp. 53-70. SAT - Servicio de Administración Tributaria. 2008. México, tasa de interés interbancaria de equilibrio. Enero 2008.
http://www.sat.gob.mx Baca, Urbina, G. 2001. “Evaluación de Proyectos”, Editorial Mc Graw Hill, 4ta Edición. Banxico. 2003. Encuesta sobre las expectativas de los especialistas en economía del sector privado, Abril 2003.
www.banxico.org.mx/mtextos/fscontacto.html. Alonso Lavernia, J. 2003. “Reciclaje de escombros de la construcción en el Distrito Federal para la producción de agregados
pétreos de diferentes granulometrías”. Tesis de Maestría. Instituto Politécnico Nacional (IPN). Escuela Superior de Ingeniería Civil y Arquitectura. Unidad Zacatenco. México. 2003.
Urrutia, F. 1992. “Elaboración de Materiales y Elementos de Bajo Consumo para Uso en la Construcción”, ARESCO, Ponencia VII Forum, Ciudad de La Habana.
Vanderley, M. J. 2008. La Construcción, el medio ambiente y el reciclaje. www.Recycle.pcc.pcc.usp.br/artigos.htm. Kibert, Ch. J. 2002. “Deconstruction`s Role in an Ecology of Construction”, CIB publication. 272, Karlsruhe, Germany.