Embed Size (px)
Citation preview

Recovery of Lignin Derived Phenolics by
Liquid-Liquid Extraction
Project


i
Title Sheet
Master Thesis
Thesis Title: Recovery of Lignin Derived Phenolics by Liquid-Liquid Extraction
Group: K10OG-5-F16
Semester: 10th
Semester
Supervisor: Marco Maschietti
University: Aalborg University Esbjerg
Project Period: 01/02/2016 - 09/06/2016
Initial Problem:
Hydrothermal conversion of lignin as a viable process to produce
fuel and valuable chemicals. How can the extraction of phenolic
components from an aqueous stream add value to the process and
make it more economically feasible?
Student:
Nikolaos Montesantos


ii
Abstract
The main focus of this project was the extraction of phenolic components from an
aqueous stream that is generated during the hydrothermal conversion of lignin to bio-
oil. Since water is utilized as a reaction medium in this process, a large amount is used
continuously and it has to be recirculated. The water ends up containing high
concentrations of phenolic components like guaiacols and catechols that are valuable
chemicals for the industry. This fact provides an opportunity to recover the phenolics
and add value to the conversion process of lignin. The recovery of the phenolic
components from the aqueous phase can be considered a part of the optimization that
could give an edge to the process and can make it a sustainable and financially
competitive method of fuel and chemicals production.
Within the framework of this master thesis a liquid-liquid extraction experimental
setup and a related procedure for the acquisition of liquid-liquid equilibrium (LLE)
data were developed. Literature indicated Methyl Isobutyl Ketone (MIBK) as one of
the most promising organic solvents for liquid-liquid extraction. The system that was
studied in this frame was the ternary system, Water – Guaiacol –MIBK. The
equilibrium experiments were performed in separating funnels under temperature
regulation and both of the two distinct liquid phases (aqueous and organic) were
withdrawn after equilibration for analysis. Gas Chromatography (GC) and Karl
Fischer titration (KF) were used for the compositional analysis.
The experimental procedure resulted to be very good for attaining the goal of this
master thesis and it presented some very interesting advantages. For example the use
of separation funnels gave the opportunity to accurately measure the weight of the
two liquid phases. Additionally, the use of KF gave an accurate analytical
measurement for the water in the organic phase whereas most of the authors of similar
works are using mass balance to calculate it.
Equilibrium data for the ternary system Water – Guaiacol – MIBK were successfully
measured experimentally for the temperatures 30 and 55 °C under atmospheric
pressure. Using the measured mass fractions, extraction yields, selectivities and
distribution coefficients were measured to evaluate the extracting performance of
MIBK. The extraction yields for the single stage extraction procedure applied in this
work were up to 96%, depending on the relative amount of solvent to the feed (S/F).
The values of S/F ranged from 0.05 up to 1 and it was indicated that the optimum
value would be between 0.1 and 0.25. In all accounts, the work performed showed
that MIBK can effectively be used as an organic solvent for the extraction of guaiacol
from water and the experimental procedure that was adopted can very satisfactorily
work for the acquisition of experimental LLE data.


iii
Preface
This is a 10th
semester Master Thesis project which was written in the spring
semester of 2016 by a student enrolled in the Oil and Gas Technology Master’s
programme at Aalborg University Esbjerg.
The Bibliography is found in the back of the report, on page 50. The
references are enclosed in square brackets such as [X] and the sources are referred to,
using numbers.
In this report the decimal number is represented by a dot.
After the Perspective, the appendix can be found. The appendix contains the
detailed methodology used for the Gas Chromatography including the program used
with the instrument and the preparation of standard solutions.
Acknowledgements
I would like to thank:
My supervisor, Marco Maschietti, for his critical and substantial support for
matters both theoretical and practical in all levels of the realization of this master
thesis.
The laboratory staff and especially Dorte Spangsmark for her assistance and
insight in technical matters related to experimental work.


iv
Table of Contents
Title Sheet ....................................................................................................................... i
Abstract .......................................................................................................................... ii
Preface .......................................................................................................................... iii
Acknowledgements ...................................................................................................... iii
1. Introduction ............................................................................................................ 1
1.1. Lignin .............................................................................................................. 3
1.2. Hydrothermal Conversion of Lignin ............................................................... 4
1.3. Recovery of Phenolics from the Aqueous Phase ............................................ 7
1.4. Literature Overview ........................................................................................ 8
1.5. Project Delimitation ...................................................................................... 10
1.6. Project Definition .......................................................................................... 11
2. Experimental Procedure and Materials ................................................................ 12
2.1. Experimental Apparatus ................................................................................ 12
2.2. Chemicals ...................................................................................................... 13
2.3. Preparation of stock solution ......................................................................... 15
2.4. Liquid-Liquid extraction ............................................................................... 16
2.5. Analytical Methods ....................................................................................... 19
2.5.1. Gas Chromatography ................................................................................. 19
2.5.2. Karl Fischer Titration ................................................................................ 26
3. Results and Discussion ........................................................................................ 29
3.1. Water-Guaiacol-MIBK .................................................................................. 29
3.1.1. Performance of MIBK as an Extraction Agent ...................................... 33
3.1.2. Phase Equilibrium Behaviour ................................................................ 37
3.1.3. Further Data Investigation ..................................................................... 38
4. Conclusion ........................................................................................................... 44
5. Perspective ........................................................................................................... 46
Appendix I. GC Program and Standard Solutions ................................................. 48
Bibliography ................................................................................................................ 50


1
Chapter 1
1. Introduction
In the previous century the abundance of cheap fossil fuel like coal and petroleum
created a sustainable energy source. However, this dependence on fossil fuel seems to
act negatively in the sustainable growth of human society and economy. Mainly
because of the definite need in reducing the greenhouse emissions and the constantly
increasing demand on fuels [1]. In order to keep up with a sustainable industrial and
economic growth, new sources of energy products had to be explored.
A lot of research has been conducted the last years on biomass as a promising source
of a variety of energy related products including bio fuel and chemicals [2]. Different
conversion processes are being studied in order to make biomass a more
commercially viable raw material for the production of fuels and valuable chemicals.
An important goal of research on the subject is to allow biomass to become a type of
substitute to petroleum. This means that by processing the biomass, a wide variety of
products may be produced. Similar to a conventional petroleum refinery the term
biorefinery was introduced to define a combination of processes that can convert
different biomass types to products equivalent to the ones that are derived from fossil
oil [3]. The basic concept of the biorefinery is shown in Figure 1.1.
Figure 1.1: The general concept of Biorefinery [3]

2
Biomass has the advantage to be a “bio-renewable” raw material for the production of
transportation fuel and a wide variety of chemicals [4]. Some of the technologies that
are used in the petroleum refineries could be shared with the biorefineries. Although a
substantial amount of research has to be performed for the many processing
technologies that are needed for biomass conversion. This is crucial since the initial
biomass source can be very different, from wood to municipal waste.
Additionally, biomass derived fuel is at the moment more expensive than petroleum
but there seems to be prospect of creating value by the production of chemicals during
the process. Those chemicals can be environmentally friendly additives for perfume,
pesticide and other industries. Another utilization of bio fuel could be the mixing with
conventional fuel in order to gradually reduce the amount of fossil oil that is being
burned for energy [2].
There are a few important reasons why research is carried out on biomass conversion
to a source of energy related products. Firstly it can be sustainable source. Biomass is
renewable and also the utilization of the products has low environmental footprint
(e.g. minimal greenhouse gas emissions) [5]. Another reason is that the last decade
showed that the oil price can be unstable which makes planning of resources and
production difficult. When oil demand is high and fossil oil supply is decreasing the
utilization of biomass can be a viable way to substitute the lost supply. Additionally,
petroleum production is only in control of a few countries and this creates a great
political and financial inequality which had led from minor corporate corruption to
wars between nations.
In general, biomass consists of different constituents. For example carbohydrates (e.g.
starch), lignin or fats and proteins [5]. The characteristics of biomass vary a lot in
accordance to the source. The source can be plants, waste of crops, cattle or municipal
waste. The utilization of such sources of biomass can reduce the need of waste
disposal which is detrimental to the environment [5]. The resulting biomass
conversion products are dependent on the source of the biomass and also on the
transformation process (liquid, gas or solid).
Lignin is considered one of the most interesting biomass resources that can be
processed in order to produce bio fuel and chemicals, like phenolics [6]. Lignin is a
complex organic chemical structure existing in woods [7]. It is a co-product of the
paper pulping industry and currently a part of it is burned in order to generate energy.
This practice has a lot of disadvantages like the increased emissions and that the
produced energy cannot be stored easily [8]. Many different processes for the
conversion of lignin into fuel and chemicals are being studied. Some of them are
pyrolysis, hydrothermal conversion, electrochemical degradation enzymatic or
catalysed degradation and others [8].
The hydrothermal processes have become important in chemical conversion because
of the unique properties of water as a solvent. Furthermore, water is a benign

3
component in regard of environmental implications [9]. This report is focused on the
products of the hydrothermal conversion of lignin. In this process, compressed water
at high temperatures is utilized as a reaction medium [10]. The chemicals that are
produced by lignin conversion together with the bio fuel can add value which makes
their recovery very important for the overall feasibility of the process.
1.1. Lignin
Lignin is a component that exists in all plants. After cellulose it is the second most
abundant natural organic polymer on earth [11]. The name lignin defines the polymer
located in the woody cell wall. It represents a 10-25 % of most of the plant based
biomass. The structure of the molecule depends on the type of biomass and the
recovery method. However the unifying chemical feature of lignin is a branched and
cross-linked network polymer of phenylpropenyl units [7]. The three main monomers
of which lignin is built of, are shown in Figure 1.2.
Figure 1.2: Major monomers of lignin [12]
Some important facts about lignin could be summarized in the following [7]:
Large amounts available.
Environmental concerns if disposed as waste.
High energy content owing to the aromatic nuclei.
Good adsorbent and ion exchange and adhesive properties.
A direct source of various kinds of phenolic and aromatic compounds.
As it was previously mentioned, this project is interested in the phenolics that can be
recovered from the transformation of lignin to bio oil.

4
1.2. Hydrothermal Conversion of Lignin
Hydrothermal processes are defined as chemical and physical transformations in
water at elevated pressure and temperature. Typical conditions are 200-600 °C of
temperature and 5-40 MPa pressure [13]. This process has the advantage that wet
materials do not need to get dried and also that water is used as the reaction medium.
This temperature suffices to initiate pyrolysis of the lignin biopolymers and the high
pressure keeps the water in liquid phase [14].
Hydrothermal processing can be separated to three processes that depend on the actual
conditions of pressure and temperature. For temperature lower than 200 °C the
process is called hydrothermal carbonization and the product is a hydrochar which can
be compared with low rank coal [14]. At temperatures between 200 and 370 °C, the
process is called hydrothermal liquefaction and the product is liquid fuel (biocrude)
[13]. Biocrude resembles petroleum and can be upgraded to the same range of fuel
products. At temperatures above 370 °C the process becomes a hydrothermal
gasification which produces a synthetic fuel gas [13]. In Figure 1.3 the phase diagram
of water is shown. The regions of gasification and liquefaction are reported in the
relevant temperature and pressure areas.
Figure 1.3: Phase diagram of water. Regions of liquefaction and gasification [13]
This report is focused on one of the streams generated during the liquefaction process,
which is an aqueous stream. A simplified flow diagram of the process is shown in
Figure 1.4. The figure is an adapted generalization found on literature [15] in which

5
the main process blocks and streams are depicted. In this figure it is important to
observe that a water stream out of the reactor can be treated and recirculated to a
previous stage of the process. The treatment that is suggested in this case would be the
liquid-liquid extraction (indicated by the dashed blue rectangle) which would add
value to the process and also allow the water to be reused in a continuous way.
Feed
Handling
Feed
Preparation
Reactor &
Separations
Liquid-Liquid
Extraction
Solids
Bio Oil
Reactor Gas
Figure 1.4: Hydrothermal Conversion block diagram with proposed liquid-liquid
extraction process of the aqueous stream
The aqueous stream is interesting because it contains valuable chemicals and
particular interest is put on the phenolic components that exist in it. These
components are very important for numerous industries and also are considered high
tier pollutants for water that is to be introduced to the ecosystem. Among them there
can be cresols, catechol, guaiacol and others [8].
The phenolics that are used in industry are typically derived from phenol. Phenol was
originally recovered from coal but nowadays more than 95% is industrially
synthesized by oxidization of cumene, which is a product of crude oil [16]. The
worldwide production of phenol was approximately 20 million tons per year in 2010
with the demand at the same levels [16]. Considering that lignin is a renewable
feedstock coupled with the fact that by hydrothermal conversion it can provide
phenolic components, the study extracting those from one of the process streams
makes for a reasonable research goal. The current production of lignin is
approximately 100 million tons per year and only 2% is isolated to be used for other
purposes than burning for energy [17]. In the case that a larger amount of lignin was
dedicated for the production of bio-oil, it could have the potential to become a large
part of the production of valuable chemicals like phenol.
To highlight the importance of phenolics for the chemical industry, a number of
applications can be mentioned as examples. Catechol is used as a raw material for
many applications. In its pure form, it is used in photographic developers but it is
mostly used through the form of its derivatives like guaiacol [18]. Guaiacol has a very
strong flavor that makes it an important chemical for the perfume and food industry.
Other guaiacol derivatives are used in medicine as expectorants, hemostatics, anti-

6
infectives and in a lot more drug production processes. An additional use of catechol
is as an agricultural chemical to produce insecticides [18].
The other important family of phenolics, which is met in the aqueous stream of lignin
conversion, is cresol. Cresol is an important raw material that was originally obtained
by coal tar. Since the 1960s cresol is another petrochemical derivative[19]. Cresol
derivatives are being used as herbicides and insecticides and also as polymerization
inhibitors (eg. distillation of styrene). Another important application of cresol is the
production of resins that are used for structural and sealing material. The bactericidal
properties make cresols also useful as disinfectants in soap [19]. The chemical
structures of the above mentioned phenolics are shown in Figure 1.5.
Figure 1.5: Chemical structure of phenol and phenolics
The fact that the aqueous phase of the conversion of lignin contains these phenolics
makes it interesting for recovery methods to be studied. Additionally, as it is shown in
Figure 1.4, the process entails recirculation of water which makes it necessary to
remove the phenolics.
Liquid-Liquid extraction by using an organic solvent is being studied for the
separation of phenolics from water. In the past, several studies have been performed
on ternary systems that contain water, phenolics and an organic solvent in order to
accumulate equilibrium data on these systems and evaluate different solvents. The
initiative of this project was to study such a system, for which there are no
experimental data and may be useful in the modeling of the industrial process of
hydrothermal conversion of lignin. Liquid-liquid equilibrium data for ternary
water-phenolic-solvent systems is one of the first steps for modeling processes of
multicomponent systems.

7
1.3. Recovery of Phenolics from the Aqueous Phase
Liquid-liquid extraction using organic solvents may be an effective way to remove
pollutants from industrial aqueous phases. The same process can be very useful
recovering chemicals that can be used in other industries [20]. The extraction in
industrial level is typically done in columns in which the solvent and the feed are
coming into contact. In Figure 1.6, a simplified process flow diagram (PFD) of a
typical industrial level liquid-liquid extraction process is shown.
Feed
Solv
ent
Reco
very
Extractio
n
Colu
mn
Organic Phase
Solvent
Aq
ueo
us P
hase
Recirculating Solvent
Recovered Phenolic
Figure 1.6: Process Flow Diagram (PFD) of typical industrial extraction process
Figure 1.6 represents the details of the liquid-liquid extraction block that is included
inside the dashed blue line in the overall lignin hydrothermal conversion process
block diagram of Figure 1.4. Systems like this normally include a distillation column
to separate the high value components and the solvent which can then be reused for
the continuous process of extraction.
Liquid-liquid extraction experiments on the perspective of such an industrial
application can help the optimization of the process of extraction by finding for
example optimal amounts of solvent or temperature. Additionally, the initial step of
process design is constituted by the experimental study of binary or ternary sub-
systems that combined can simulate the original process. The typical practice for the
latter is to perform liquid-liquid equilibrium (LLE) experiments in order to acquire

8
distribution coefficients of the phenolics in the aqueous and organic (solvent rich)
phases respectively.
Literature indicates that polar organic solvents like ketones, ethers and esters are
promising because of their property of hydrogen-bonding with phenolics but not with
themselves [20]. Methyl isobutyl ketone (MIBK) is one of the most promising of
these solvents for the recovery of phenolics from water [11–13]. The chemical
structure of MIBK is shown in Figure 1.7. The electronegativity of the oxygen that is
present in this molecule favors the creation of hydrogen bonding with the phenolic
molecules that were shown in Figure 1.5. Additionally, the MIBK molecule does not
have hydrogen connected to a highly electronegative atom, which deter the molecules
of hydrogen bonding with themselves.
Figure 1.7: Chemical structure of Methyl Isobutyl Ketone
1.4. Literature Overview
The interest of this project falls in the study of ternary systems of water phenolics and
MIBK. In the past, there has been research on the subject for some of the phenolics.
At the extent of the knowledge of this work there are no experimental LLE data for
guaiacol. The importance of the specific phenolic in the chemical industry was
underlined in Section 1.2.
In Table 1.1 the main research papers on the subject are summarized in order to give
an insight of what has been realized until now. This literature study was used as a
guide to decide the planning some aspects of the present work. From this study some
very important conclusions have been extracted and are reported as follows:
MIBK is one of the most promising solvents for liquid-liquid extraction.
The temperature have to be carefully controlled during liquid-liquid
equilibrium experiments.
Gas chromatography is a viable method to measure the concentration of
organic components in both aqueous and organic phases.
For most phenolic components that are derived from the hydrothermal
conversion of lignin, there is a significant lack of equilibrium data. Especially
for guaiacol there are no data, according to the extent of this literature
research.

9
The above points were derived from studies on systems similar to the one that was
planned in this project. These were systems of water, a phenolic component and an
organic solvent. These indications were considered in order to decide the organic
solvent to be used for this work and additionally the specific phenolic component that
would be studied.
Table 1.1: Literature review
Paper Temp
(°C) System of Components
Analytical
Instruments
Narasimhan et al
1962 [21]
30
44.4 Water-Phenol-Butyl Acetate GC-FID
Won and Prauznitz
1975 [20]
25
45
Water-Phenol-Butyl Acetate
or MIBK
or Isopropyl Ether
GC-FID
Greminger et al
1980 [22]
30
50
75
Water-Phenol-MIBK
or Diisopropyl Ether GC-FID
Chufen Yang et al
2007 [23] 25 Water-Phenol-Hydroquinone-MIBK GC-FID
Yong Lei et al
2013 [24]
25
40
50
Water-Phenol-Methyl tert butyl ether GC-FID
Yun Chen et al
2014 [25]
25
50 Water-Phenol-Hydroquinone-MBK GC-FID
Zhuo Wang et al
2015 [26]
25
40 Water-Cresol (o-, m-, p-)-MIBK GC-FID
* Where:
MIBK: Methyl Isobutyl Ketone, MBK: Methyl Butyl Ketone
GC-FID: Gas Chromatography-Flame Ionization Detector
With all the above considered, it seemed that liquid-liquid equilibrium data of
aqueous systems containing phenolic components and MIBK could give an edge in
simulation of industrial liquid-liquid extraction. Additionally, studies of equilibrium
for such systems can give indications on the performance of MIBK and possibly other
organic solvents on extracting the valuable phenolic components from water in
numerous industrial applications.


10
1.5. Project Delimitation
In the current state of environmental awareness and instability of the petroleum
industry, research about biomass derived fuels and chemicals, thrives. The object of
this research is to create energy related products and valuable chemicals that can
supplement the ones derived from petroleum and in some cases even substitute them.
Different sources of biomass are being studied extensively and ways to optimise the
utilization of the promising ones are being researched. Lignin being one of the most
abundant biomasses coupled with the fact that its utilization until now is very limited
makes it a good candidate for the above.
As in all modern processes, a large part of their viability rests with their effective
modelling. Modelling is almost always based on data that are provided by
experimental work on systems that simulate individual parts of the real process which
when combined can create a complete and accurate prediction tool. One of these
processes is the hydrothermal liquefaction of lignin. Water is used for this process as
a reaction medium and it has been proved that during the conversion the water ends
up to contain a considerable amount of phenolic components. In addition to the high
value of the phenolics, the water needs to be reused continuously in a sustainable
manner and therefore it has to be free of them. This fact makes extraction of phenolic
components from water an important part of the process.
Liquid-liquid extraction has appeared as an effective process of recovering phenolics
from water. The experimental data that are needed to simulate a liquid-liquid
extraction process are typically equilibrium data for ternary systems that can be
combined by using a thermodynamic model in order to simulate the original
multicomponent system. Therefore in this project after literature research on existing
experimental data it was observed that there are no data at all for one of the most
valuable phenolics which is guaiacol. Additionally it was realized by the literature
study that Methyl Isobutyl Ketone (MIBK) is one of the most promising organic
solvents that can be used to extract phenolic components from water. In light of these
discoveries, the present project was decided to focus on experimental work for the
liquid-liquid equilibrium of the ternary system Water – Guaiacol – MIBK.


11
1.6. Project Definition
Based on the problem delimitation, the main focus of this project was:
Develop and utilize a laboratory scale liquid-liquid extraction method for Guaiacol
by using Methyl Isobutyl Ketone (MIBK) as an organic solvent. The method should
provide accurate experimental liquid-liquid equilibrium data for the ternary system
Water-Guaiacol-MIBK.
The work performed for this project was the liquid-liquid equilibrium study of a
ternary system for which no published experimental data exist. Such data for a
number of ternary systems of water-MIBK and different phenolics are very important
in order to enable the modelling of an industrial process. In this case the extraction of
valuable phenolics from the aqueous stream that is recirculated during the
hydrothermal conversion of lignin.
The experimental equilibrium data were obtained for two temperatures (30 and 55 °C)
and the goals that were set in order to successfully acquire accurate data can be
summarized as:
Set a procedure of mixing the three components and settle the system adequate
time to obtain equilibrium.
Set an accurate procedure of separately withdrawing the two liquid phases
from the separation funnels.
Develop analytical measurement methods that are able to provide accurate
compositional results for the two liquid phases.
Analyse the data and compare with similar systems to assess the reliability of
the experimental data.


12
Chapter 2
2. Experimental Procedure and Materials
2.1. Experimental Apparatus
The liquid-liquid equilibrium experiments took place in a controlled environment,
using pure substances to create a synthetic solution. This solution was produced
resembling the aqueous phase of the hydrothermal conversion of lignin, containing a
phenolic that was to be recovered. The temperature was regulated by a heating
immersion circulator in a water bath as shown in Figure 2.1. The model of the heating
immersion circulator was a Julabo ED with a heating capacity of 2 𝑘𝑊 and a
recirculating pump with a flow rate capacity of 15𝐿
𝑚𝑖𝑛. The manufacturer states in the
specification sheet that this model is appropriate for water baths up to 50 𝑙𝑖𝑡𝑒𝑟𝑠. The
water bath was a mgw LAUDA model with operating dimensions of
49 𝑐𝑚 𝑥 30 𝑐𝑚 𝑥 20 𝑐𝑚 (30 liters). Additionally, the surface of the water was filled
with insulating material in order to limit heat loss.
Figure 2.1: Temperature regulating water bath

13
The experiments for this project were performed at two temperatures, 30 and 55
degrees Celsius (°C). The lower temperature was chosen in order to always be above
the ambient temperature which would ensure that it can be regulated by the heater.
The higher temperature was chosen after a few experimental runs at 45 °C that
showed no significant differences compared to similar runs at 30 °C.
For both temperature levels, several measurements were taken inside separation
funnels filled with water. Ensuring that the funnels were covering different space in
the water bath the temperature was measured and showed that it was stable within a
limit of ±0.1 °C.
The separation funnels that were used for the experiments were either 100 or 250 ml
depending on the convenience of the material that had to be contained in them.
The two types are shown in Figure 2.2.
Figure 2.2: Separation funnels (250 and 100 ml)
2.2. Chemicals
In order to create a solution that could simulate the water generated by the
hydrothermal conversion of lignin, an aqueous stock solution was produced. The
model component that was used was pure natural guaiacol. The organic solvent for
the extraction process was methyl isobutyl ketone (MIBK) since literature suggested
that it has better extraction yield than other solvents and also create less implications
[20], [22]. In this section the chemical and physical properties of the chemicals that
were used in this project are stated.

14
Throughout the experiments, distilled water was used. The water that was distilled
originated from purified water by reverse osmosis. The quality of the distilled water
was not measured but the manufacturer of the distillation apparatus reports that it
produces water with a conductivity value lower than 2.3 micro Siemens per cm (𝜇𝑆
𝑐𝑚)
at ambient temperature [27] which ensures a high quality of water.
The chemicals that were used for this work, including the ones used for analytical
measurements are reported in Table 2.1. In this table the supplier information and the
purity of the chemicals is reported.
Table 2.1: Suppliers and purity of chemicals used in this work
Component Supplier Assay Product No.
Methyl Isobutyl Ketone Sigma Aldrich ≥98.5% 360511
Guaiacol Sigma Aldrich ≥99.0% W253200
Bromobenzene (IS) Merck Millipore ≥99.0% 8017861000
Methyl Ethyl Ketone (IS) VWR ≥99.0% 25654.292
n-propanol (IS) VWR ≥99.0% 20858.293
* The chemicals noted as IS were used as internal standards for Gas
Chromatography.
Table 2.2: Chemical and physical properties of Methyl Isobutyl Ketone and Guaiacol
Component MIBK Guaiacol
CAS no. 108-10-1 90-05-1
Formula C6H12O C7H8O2
Molecular weight 100.16 𝑔
𝑚𝑜𝑙 124.14
𝑔
𝑚𝑜𝑙
Description Colorless liquid Colorless oily
liquid
Density @ 25 °C 0.801 𝑔
𝑚𝑙 1.129
𝑔
𝑚𝑙
Solubility @ 25 °C in water
17.39 𝑔
𝐿 [28] 23.33
𝑔
𝐿 [28]
Solubility @ 25 °C of water in
1.90 𝑔
𝐿 [29] -
Boiling point 117 °C 202 °C
Psat @ 25 °C 2.20 𝑘𝑃𝑎 0.0133 𝑘𝑃𝑎
pKa 9.93 [30] 25 [31]
In Table 2.2, the physical and chemical properties of the two components that were
used in this project for the liquid-liquid extraction experiments are reported. All

15
information was taken from the manufacturer specification sheet except if another
literature source is stated. The values that were stated by the manufacturer were also
cross checked in literature and were found in good agreement.
2.3. Preparation of stock solution
A stock solution (feed) that could simulate the water generated by the hydrothermal
conversion of lignin was produced for the extent of the experiments. The stock was an
aqueous solution of guaiacol in distilled water. The general procedure can be
described as follows:
An appropriate volumetric flask was mounted on a micro balance and was
tared.
The desired amount of guaiacol was charged in the volumetric flask and the
balance was tared again after the exact weight of the phenolic was taken.
The volumetric flask was then filled with distilled water and the weight of the
added water was measured on the balance.
A magnetic stirrer was inserted in the flask, which was then sealed with a cap
and mounted on a magnetic stirring engine.
Stirring took place for 1 hour to ensure the complete dissolution of the
phenolic and the visible homogeneity of the solution.
The stock solution was stored in a cabinet protected from light until usage.
Figure 2.3: OHAUS Pioneer analytical balance

16
The production of the stock solution was performed in ambient conditions. The
amount of stock solution prepared never exceeded 1 𝑘𝑔, which was used in a span of
a few days. All weight measurements for this project were performed on an OHAUS
Pioneer (PA214C) analytical balance with readability of four decimal digits (0.0000),
which is shown in Figure 2.3.
2.4. Liquid-Liquid extraction
Since the goal of this project was to study the extraction of phenolic components from
an aqueous stream, using an organic solvent, several extraction experiments were
performed with varying the process conditions and analyzing the resulting liquid-
liquid equilibrium. These conditions were the temperature and the composition by
varying the solvent to feed ratio (S/F).
The general description of the procedure can be reduced to the following points:
An amount of feed solution was weighted according to the S/F ratio of each
experimental run.
The appropriate amount of MIBK was afterwards weighted in a sealed
container to avoid vaporization losses. After mounting and taring the glass
container on the balance, with a syringe the appropriate amount of MIBK was
weighted.
The two substances were charged in a separation funnel and the containers
were back weighted to account for losses during the transfer.
Each funnel was shaken vigorously three times for 3 minutes.
Between the shaking the funnels would remain in the water bath in order for
the system to reach the chosen process temperature.
Finally the funnels were positioned in the water bath and the system left to
settle for 2 h.
The above mentioned procedure was applied for both temperature levels on which the
experiments were performed. However there were a few details that changed in the
procedure for the higher temperature. These changes were the result of observations
made after a number of preliminary experiments at elevated temperature (e.g. 45 and
55 °C). The modifications in the procedure were as follows:
After the feed and the solvent were in the funnels, the latter were positioned
inside the water bath to achieve the desired temperature before the shaking
procedure took place (typically 20-30 minutes).
All weight measurements were performed in sealed containers because the
evaporation losses could potentially be higher due to the elevated temperature.
The organic samples that were collected for analysis purposes were diluted
with pure MIBK in order to avoid possible demixing at ambient temperature.

17
Inspired by literature, it was assumed that 2 hours is enough time for the equilibrium
to take place [20]. Additionally, some preliminary experimental runs were performed
in order to study how settling time was influencing the extraction yield. Experiments
at the same conditions and varying settling time from 2 to 24 hours showed that the
system would reach a stable equilibrium state after 2 hours of settling.
In this project the mixing of the stock solution with the solvent was performed by
manual shaking. The procedure was inspired by literature [32] and after the
performance of some preliminary experiments with a variation of shaking time it was
decided that repeating a 3 minute vigorous manual shaking was enough for the mixing
of the components.
After the settling time, two liquid phases with a well-defined interphase existed in the
separating funnel. On the top the lighter organic phase (MIBK rich), and on the
bottom the heavier aqueous phase. The general procedure for the withdrawal of the
two phases from the separating funnels can be described by the following:
From the top of the funnel, an appropriate amount (typically 3-8 ml) of the
organic phase was retrieved carefully using a syringe. The mass of the sample
was measured and the sample was stored in a closed glass container for
analytical measurements.
An appropriate amount of the aqueous phase (typically 15-25 ml) was
afterwards extracted from the bottom of the funnel. The mass of the sample
was measured and it was sealed and stored in a glass container for analytical
measurements
The remaining aqueous phase was conveyed in a beaker and the mass was
measured. This part of the aqueous phase was disposed after it was weighted.
The remaining organic phase was discharged from the bottom of the funnel in
a beaker in order to be weighted and then disposed.
By weighting the two liquid phases, the overall mass balance between their sum and
the feed-solvent sum was calculated for each individual run. The average discrepancy
was -0.7% which was reckoned reasonable considering evaporation and small
amounts of remaining material in the funnel during the procedure. In general this
discrepancy remained under -1% and only in a few cases of extractions at 55 °C it
reached as high as -1.5% which was assumed reasonable since the evaporation can be
higher at that temperature.
The use of separation funnels had the advantage of allowing the retrieval of the two
phases separately with a reasonably high accuracy. This enabled the weighting of the
phases in order to find an accurate relative weight ratio. This ratio is the phase
fraction (α) and it is defined as the ratio of the aqueous phase mass divided by the
overall mass of the two extracted phases:

18
𝛼 =𝑚𝑎𝑞
𝑚𝑎𝑞 + 𝑚𝑜𝑟𝑔 [2. 1]
Where:
𝛼 : Phase fraction (𝑔
𝑔)
𝑚𝑎𝑞 : Mass of aqueous phase at equilibrium (𝑔)
𝑚𝑜𝑟𝑔 : Mass of organic phase at equilibrium (𝑔)
The equilibrium experiments were performed in a thermostatic bath at a predefined
temperature. After the equilibrium was ensured, the funnels were removed from the
water bath and mounted on clamps to withdraw the two phases. In Figure 2.4 a
separation funnel mounted on the clamps is shown with a magnified view of the
interphase between organic and aqueous phase. The sampling procedure of the two
phases took place relatively quickly in a range of a few minutes. Therefore the system
at equilibrium temperature was expected not to be disturbed at the few moments of
the sampling procedure.
Figure 2.4: Separation funnel in which the two phases have a well-defined interphase

19
2.5. Analytical Methods
2.5.1. Gas Chromatography
Gas chromatography (GC) is an analytical measurement procedure that involves the
volatilization of an injected mixture sample followed by the separation of the different
components in a chromatographic column. One important rule for GC to be applicable
is that components (analytes) that are going to be measured have to be able to
vaporize without decomposing [33]. A carrier gas is used for the transfer of the
components from the injection device (injector) to the column. In the case of the
instrument that was used for this project the carrier gas was helium. The principle of
determination in GC applications is the distribution of the components between the
mobile phase (carrier gas) and a stationary phase that exists in the column. The timing
of elution of a component is what determines the separation and that makes possible
for a detector to quantify the components in the mobile phase after elution. In Figure
2.5, a simple figure of a gas chromatograph is presented.
Figure 2.5: Schematic representation of GC [33]
The separation of the components takes place inside the heated column that contains
the stationary phase. The components move with the carrier gas and they are
selectively retarded by the stationary phase. As the temperature of the oven is
increasing the components that are retained by the stationary phase are successfully
released to the mobile phase depending on their boiling point [33]. Each component
then is led to the detector in order to be quantified.

20
Detectors are specially designed for gas chromatography and some of them are
thermal conductivity (TCD), flame ionization (FID) or a more complex mass
spectrometer (MS) [33]. For this project a GC-FID configuration was used to
quantitate the organic components in the aqueous and organic phases. More
specifically a Perkin Elmer Clarus 500 gas chromatograph was used with a Perkin
Elmer BAC-1 Advantage column (Inner diameter: 0.32 mm, Length: 30 m, Film
thickness: 1.80 μm). The configuration that was used for the analytical measurements
in the present work is available in Appendix I. The FID is one of the most commonly
used detectors for hydrocarbon characterization [33] and as it was observed in section
1.3 it is the detector that is typically used for analysis of ternary systems containing
water, phenolics and organic solvents.
The detector uses a combination of hydrogen and air which are burned. The flame
burns the analytes that elute the column and produce ions which create a current flow.
That current flow is what provides a signal that is used to quantitate the components
of the mixture that is being analyzed [33]. The use of a gas mobile phase dictates that
the analytes are volatile in order to separate between the two phases [34].
Additionally, since the analysis is based on burning the analytes, it follows that water
is a component that cannot be quantitated by the GC-FID. In Figure 2.6, a cross
section of a typical FID detector is shown.
Figure 2.6: Flame ionization detector cross section [35]
Εach liquid-liquid extraction experiment produced an organic and an aqueous liquid
phase which both were analyzed by the GC to acquire the concentration (𝑔
𝐿) of the
guaiacol in the organic phase and both guaiacol and MIBK in the aqueous phase. In
order to smooth the potential error of the gas chromatography measurements, every

21
sample of unknown concentration was analyzed in triplicates and the average value
was taken. The average absolute deviation was no higher than the following values:
0.010 𝑔
𝐿 for guaiacol in the organic phase.
0.016 𝑔
𝐿 for MIBK in the aqueous phase.
0.040 𝑔
𝐿 for guaiacol in the aqueous phase.
The GC was separately calibrated for each of the two phases, every time a batch of
samples was accumulated. A combination of the external and internal standard
methods was used for the calibration of the instrument and the measurements.
The calibration of the gas chromatograph is referring to a procedure that is performed
prior the quantitation of samples with unknown concentrations. That typically
includes measurement of samples with a known concentration and using the GC
response of those in order to compare to the response of the samples to be analyzed.
The samples with the known analyte concentrations are the standard solutions and that
is how they will be referred to from here onwards. Details about the preparation of the
standard solutions are available in Appendix I.
The success of the calibration depends on accuracy factors like the accuracy in the
preparation of the standard solutions and the reproducibility of the same measurement
conditions. The accuracy of the standard solution preparation was ensured by the use
of volumetric flasks with high accuracy (A class) of ± 0.01 𝑚𝑙 up to ± 0.1 𝑚𝑙
depending on the overall size of the flask which ranged from 5 𝑚𝑙 up to 100 𝑚𝑙. For
smaller quantities a precision pipette was used. More specifically, the Gilson
Microman M100 (10 − 100 𝜇𝑙) and M1000 (100 − 1000 𝜇𝑙) were used, along with
a positive displacement tip in order to accurately sample small amounts of the liquid
chemicals that were used in this project.
The additional factor, on which the analyte quantitation accuracy depends on, is the
amount of sample that is analyzed after an injection in the GC. There are two
important conditions that affect this and these are the split ratio, and the overall
amount that is injected by the automatic sampler (injector) of the GC. Only a part of
the amount injected reaches the column and the remaining of the injection is vented
(split). Accordingly, the split ratio (SR) is defined as [33] :
SR =Column Flow + Vent Flow
Column Flow [2. 2]
Typical split ratios range between 10:1 to 400:1 [33]. The split ratio is regulated by
the instrument after the operators programming and is intended to be constant
throughout repeated injections of the same sample. This fact makes the amount that
the automated sampler injects, the only factor that can change the amount which is
entering the column. GC injectors may not be completely accurate in consecutive
injections and that is the reason why in this project internal standards (IS) were used

22
for the analysis along with the external standard calibration. This basically means that
an external standard calibration was used where additionally, in each injection of an
unknown sample (or standard), a constant amount of the internal standard ensured that
imperfections in the injected amount were compensated.
The external standard calibration method utilizes the comparison of the analytical
response of a component that is to be quantitated and that of the same component in
the standard solutions. The response in the case of the FID detector that was used in
this project is the area of a peak. An example of a GC result is reported in Figure 2.7,
in which the response in form of peaks is shown for guaiacol as the analyte and
bromobenzene as the IS.
Figure 2.7: Gas chromatograph response example
The standard solutions were prepared by dissolving known amounts of pure analyte in
the same solvent which was present in the samples to be quantitated (MIBK). During
the preparation of the standards the chosen internal standard was added in the same
amount for all the standard solutions. The analytical response (peak areas) of these
standards provides a calibration curve for the analyte. In certain concentrations this
curve can be linear. Under this condition the response is proportional to the
concentration of the analyte.
In the case that the response is linear the calibration curve would follow the relation:
𝑦 = 𝑎 ∙ 𝑥 + 𝑏 [2. 3]
In this case 𝑦 would be the peak area of the analytical response and 𝑥 the
concentration of the analyte. Under the assumption that the intercept (𝑏) is very small
it can be omitted. This practically means that in the absence of analyte from a
measurement, there would be no response. Under these assumptions and introducing
convenient symbols equation 2.3 can be rewritten:

23
Aan = RFan · Can [2. 4]
Where:
Aan : Peak area of analyte
RFan : Factor of proportionality of analyte (response factor)
Can : Concentration of the analyte
If equation 2.4 is solved for 𝐶𝑎𝑛 the concentrations of analyte would be:
𝐶𝑎𝑛 =𝐴𝑎𝑛
𝑅𝐹𝑎𝑛 [2. 5]
Additionally, the concentration of the IS is always constant between measurements
and therefore the response factor (𝑅𝐹𝐼𝑆) can be introduced in a similar way and
solved for the concentration of the IS:
𝐶𝐼𝑆 =𝐴𝐼𝑆
𝑅𝐹𝐼𝑆 [2. 6]
Where:
𝐶𝐼𝑆 : Concentration of IS in injected sample
𝐴𝐼𝑆 : Peak area of internal standard
The ratio of the concentration of the analyte and the concentration of the IS would
therefore be given by:
𝐶𝑎𝑛
𝐶𝐼𝑆=
(𝐴𝑎𝑛
𝐴𝐼𝑆)
(𝑅𝐹𝑎𝑛
𝑅𝐹𝐼𝑆)
[2. 7]
In order to add the IS correction of the injected amount the relative response factor of
the analyte (RRF) can be introduced and defined as:
𝑅𝑅𝐹 =RFan
𝑅𝐹𝐼𝑆 [2. 8]
Solving equation 2.7 for the concentration of the analyte and substituting with
equation 2.8:
𝐶𝑎𝑛 = 𝐶𝐼𝑆 ∙(
𝐴𝑎𝑛
𝐴𝐼𝑆)
𝑅𝑅𝐹 [2. 9]
In this way the internal standard method is combined with the external standard in
order to compensate for inaccuracies of the injection system of the gas
chromatograph. This is possible due to the fact that the injection inaccuracy affects
the response of the analyte in the exact same way as it affects the response of the IS
and that mutual effect is calculated by the 𝑅𝑅𝐹.

24
As it can be observed by equation 2.4 the units of the response factors and areas are
not relevant since they cancel each other and therefore they are not reported. The
compositional results of the GC analysis in this project were calculated in
concentration units (𝑔
𝐿). However the results were conveniently converted to mass
fractions as they are more useful for reporting equilibrium data. This conversion was
performed by using the experimentally measured density (𝜌) of each phase as
follows:
𝑤 =
𝐶1000
𝜌 [2. 10]
Where:
𝑤 : Mass fraction of component (𝑔
𝑔)
𝐶 : Analytical measured concentration of the component (𝑔
𝐿)
𝜌 : Experimental density of liquid phase (𝑔
𝑚𝑙)
The density of the phases was measured experimentally by the weighting of small
volume samples on the analytical balance. The accuracy of the volume samples was
ensured by the use of the precision pipette with the same tip for all measurements.
The additional measure taken to improve the precision of this procedure was the
calibration of the pipette with distilled water. The calibration was performed by
measuring the mass of several samples of distilled water. Afterwards, the room
temperature was measured and the accurate density of water was acquired from the
National Institute of Standards and Technology (NIST) to be used to calculate the real
volume that the specific pipette configuration was sampling.
Since the method of quantitation was explained above, examples and typical values
for the method can be reported. An example of a calibration curve using the
combination of the external and internal standards is shown in Figure 2.8. The x-axis
represent the ratio between the analyte concentration and the IS concentration,
whereas the y-axis represents the ratio between the peak area of the analyte and the
IS. Each level of the line represents triplicate injections of the standard solutions. In
the example of Figure 2.8, the linearity is displayed by the value of the coefficient of
determination (𝑅2), which the closer it is to 1 the higher the linearity is.

25
Figure 2.8: Calibration curve example for guaiacol in the organic phase
New calibrations where performed often in order to ensure that the gas chromatograph
performed at the same level of accuracy. The typical 𝑅2 values for the calibrations in
this project were approximately 0.999 for the organic phase similar to the example of
Figure 2.8. In the case of the aqueous phase the linearity was somewhat lower as in
the example shown in Figure 2.9.
Figure 2.9: Calibration curve for Guaiacol in the aqueous phase
There was an apparent difficulty to get linearity values of above 0.999 for the aqueous
phase. However whenever that was the case it was ensured that the relative difference
between the values calculated by the regression line and the experimental value of the
y = 1.3178x
R² = 0.9998 0.0
0.5
1.0
1.5
2.0
2.5
0.0 0.2 0.4 0.6 0.8 1.0 1.2 1.4 1.6
Guai
acol/
IS r
esponce
rat
io
Guaiacol/IS concentration ratio
y = 0.9116x
R² = 0.9988 0.0
0.2
0.4
0.6
0.8
1.0
1.2
0.0 0.2 0.4 0.6 0.8 1.0 1.2 1.4
Gu
aiac
ol/
IS r
esponce
Guaiacol/IS concentration ratio

26
standards were not higher than ±3 %. In addition, the reproducibility of the results for
triplicate injections of the standards was controlled before a calibration was used for
unknown samples. When continuous measurements of a large amount of samples
were programmed to be analysed, one or more of the standards were measured in
between to ensure that the response results did not drift more than an acceptable level
(e.g. 2% of the initial response).
A linear calibration curve that is acquired by the external standard method represents
only a narrow range of analyte concentrations. The samples that were to be analyzed
had unknown concentrations that sometimes would fall outside of that linear range.
For that reason, it was necessary that some of the samples should be further diluted
with pure solvent (MIBK or distilled water). This dilution was performed accordingly,
in order to reach an analyte concentration inside the calibration limits and give an
analytical result that is reasonable. This procedure was performed depending on the
expectation of analyte concentration or in some cases after a GC measurement that
gave quantitative results outside of the linear range.
In the aqueous phase the concentration of the two components was sometimes very
different with MIBK being as higher as 40 times than the concentration of guaiacol.
Each component had its own calibration and the linear range could not be achieved
for both of them in a single injection. That was compensated by performing one
injection for the guaiacol measurement and a second one with a more diluted sample
for the measurement of MIBK.
2.5.2. Karl Fischer Titration
Karl Fischer titration (KF) is a well-established method of determining the water
content in an organic phase. The method is able to measure both dissolved and
suspended water with high accuracy in a wide range of concentrations [36]. Typically
the accuracy of KF is approximately 1% of the available water and the concentration
ranges from 100 % down to 0.01% [37].
The method that was used for this project is a volumetric method in which water is
participating in a reaction with sulfuric dioxide and iodine in a methanolic solution. A
base is used as a buffer for the reaction. Fischer used pyridine as a base in his initial
experiment but later it was discovered that any appropriate base (RN) can be used
[36]. The components that are used nowadays are less toxic than pyridine.
The reaction equation can be represented as follows:
𝐻2𝑂 + 𝐼2 + [𝑅𝑁𝐻]+ 𝑆𝑂3𝐶𝐻3− + 2𝑅𝑁 ⟶ [𝑅𝑁𝐻]+𝑆𝑂4𝐶𝐻3
− + 2[𝑅𝑁𝐻]+𝐼− [2. 11]

27
The determination of the water content is done by measuring the amount of iodine
that is consumed. For example, in the case of a methanolic solvent the consumption
ratio of 𝐼2 is 1:1 with 𝐻2𝑂. This ratio is what allows the titration instrument to give an
accurate value of the water content in a sample injected to the titration vessel.
There are different solutions (titrants) that are used to determine that ratio. These
solutions are chosen, mainly according to the expected concentration of water in the
organic mixture that is going to be measured. Additionally, the amount of titrant
(volume) that is used for a known concentration of water has to be determined in
order for the titration to be successful for samples of unknown concentration. This
determination is typically done with a standard solution and it is called titer
determination.
In the case of this project the titer was determined by using a standard solution of 1%
water content. The titer was expected to always be approximately 2 𝑚𝑙 of titrant for
1 𝑚𝑔 water as it is suggested by the manufacturer of the titrant. The titer
determination took place every few days to ensure that air humidity did not cause any
drift in the measurements.
The solvent, the titrant and the water standard that were used for the KF in this project
are reported in Table 2.3.
Table 2.3: Chemicals used for the Karl Fischer Titration
Purpose Supplier Commercial Name Product
No.
Water Standard Sigma Aldrich HYDRANAL-Water Standard 10.0 34849
Titrant Sigma Aldrich HYDRANAL-Titrant 2 34811
Solvent Sigma Aldrich HYDRANAL-Solvent 34800
In order to evaluate the compatibility of MIBK with the KF procedure and the
chemicals that were available, a number of test measurements were performed.
Standard solutions of MIBK containing up to 1.33% water were prepared and the KF
results showed a deviation no more than 0.1% of the expected amount of water.
Additionally, the tests showed that the titration vessel had to be emptied and filled
with fresh solvent once every approximately 6-10 injections. This is typical for KF
but for some ketones like MIBK it is required more often.
In Figure 2.10, the titration instrument that was used for this project is shown. Karl
Fischer titrations were performed at least in triplicates for each of the extraction
samples with an average absolute deviation no higher than 2 %.

28
Figure 2.10: Metrohm 870 KF Titrino plus


29
Chapter 3
3. Results and Discussion
This project was inspired by the extraction of phenolics from an aqueous stream that
is present during the hydrothermal conversion of lignin to biofuel. This is an
innovative process on a multicomponent system. As with all processes modelling is a
very good way to optimize the operating conditions. One of the initial requirements
that enable the modelling is experiments from which equilibrium data can be
obtained. Typically this is done by studying simpler systems of components (e.g.
binary, ternary). Since this project was focused on the aqueous phase of the process,
and given the time frame, a specific ternary system was chosen to be studied. In the
following sections the results of the experiments that took place in this work and their
significance are being discussed.
3.1. Water-Guaiacol-MIBK
The significance of guaiacol for the chemical industry, the lack of published
experimental data and the fact that it is one of the most abundant phenolics present
during the hydrothermal conversion of lignin, led it to be the main component for the
liquid liquid extraction experiments for this project. The experiments took place for
the ternary system of Water (1) – Guaiacol (2) – Methyl Isobutyl Ketone (MIBK) (3).
The aim of the experiments was mainly the acquisition of liquid-liquid equilibrium
(LLE) data for the said system. Additionally, the performance of MIBK as an
extraction medium was studied.
The study of the ternary system was performed by varying the equilibrium
temperature and also the overall initial composition of the mixture. The latter was
accomplished by changing the solvent to feed ratio for given feed stock solutions
between experimental runs:
𝑆/𝐹 =𝑚𝑠𝑜𝑙𝑣𝑒𝑛𝑡
𝑚𝑓𝑒𝑒𝑑 [3. 1]
Where:
𝑆/𝐹 : Solvent to feed ratio
𝑚𝑠𝑜𝑙𝑣𝑒𝑛𝑡: Mass of pure MIBK
𝑚𝑓𝑒𝑒𝑑 : Mass of stock solution (Water + Guaiacol)

30
The summary of the conditions that were varied during the experiments are reported
in Table 3.1. In this table the target values are reported and as expected the
experimental values could have a small difference than the nominal values.
Additionally, the number of experimental runs at each condition set is reported. The
conditions on which a lot of repetitions were performed (e.g 30 °C, 1 wt% stock, 0.25
S/F) were conditions on which reproducibility or condition effects (e.g. settling time,
shaking procedure) were tested.
Table 3.1: Experimental conditions for the Water – Guaiacol – MIBK ternary system
Temperature
(°C)
Stock Solution
Composition
(wt% Guaiacol)
S/F
(𝑔
𝑔)
Repetitions
30
1
1 2
0.5 3
0.25 8
0.1 4
0.08 1
0.05 1
2
0.1 1
0.08 1
0.05 1
55
1
0.5 1
0.25 1
0.1 2
0.05 2
2
0.25 1
0.1 2
0.08 1
0.05 2
Total number of experimental runs 37
The stock solutions that were produced for the experiments had a difference from the
target value no higher than 0.026 %. In the experimental runs the S/F ratio varied
reasonably, no more than 0.13 % of the target value. The temperature was stable
inside the separation funnels at the target value (±0.1 °𝐶) .
The two extracted liquid phases in this report are going to be noted by a unique
subscript as follows:
𝑎 : Aqueous phase
𝑏 : Organic phase

31
Additionally the three components will be characterized by a unique numeric
subscript:
1 : Water
2 : Guaiacol
3 : MIBK
The results of the LLE experiments are presented later in this chapter, in the form of
plots and ternary diagrams. In all figures the compositional data are reported as the
mass fractions of each of the components in each phase or percentages of those. The
mass fractions are defined as:
𝑤 =𝑚𝑐
𝑚𝑝ℎ [3. 2]
Where:
𝑤 : Mass fraction of component (g/g)
𝑚𝑐 : Mass of component in the specific phase (g)
𝑚𝑝ℎ : Overall mass of the phase (g)
The mass of the phases is the experimental value that was measured with the
analytical balance after the withdrawal of the two phases from the separating funnels.
The mass fraction of guaiacol in the organic phase was calculated from the GC
analysis by equation 2.10. The mass fraction of water in the organic phase was
calculated by the Karl Fischer titration as mentioned in section 2.5.2. The mass
fraction of MIBK in the organic phase was the subtraction of the mass fractions of
guaiacol and water from 1.
For the aqueous phase, both guaiacol and MIBK mass fractions were calculated by
equation 2.10. The mass fraction of water was then calculated as the subtraction of the
mass fractions of guaiacol and MIBK from 1.
For each experimental run the overall mass balance and the individual mass balances
for the components were calculated. That was done in order to support the accuracy of
the experimental procedure. The overall mass balance was calculated as:
𝑀𝐵𝑡𝑜𝑡 =(𝑚𝑎 + 𝑚𝑏) − (𝑚𝑓𝑒𝑒𝑑 + 𝑚𝑠𝑜𝑙𝑣𝑒𝑛𝑡)
𝑚𝑓𝑒𝑒𝑑 + 𝑚𝑠𝑜𝑙𝑣𝑒𝑛𝑡∙ 100 [3. 3]
Where:
𝑀𝐵𝑡𝑜𝑡 : Overall mass balance (%)
𝑚𝑎 : Mass of aqueous phase (g)
𝑚𝑏 : Mass of organic phase (g)

32
The mass balance for each component was calculated as:
𝑀𝐵𝑐𝑜𝑚𝑝𝑜𝑛𝑒𝑛𝑡 =(𝑚𝑐,𝑎 + 𝑚𝑐,𝑏 − 𝑚𝑐,𝑖𝑛)
𝑚𝑐,𝑖𝑛∙ 100 [3. 4]
Where:
𝑀𝐵𝑐𝑜𝑚𝑝𝑜𝑛𝑒𝑛𝑡 : Mass balance of component
𝑚𝑐,𝑎 : Mass of component in aqueous phase (g)
𝑚𝑐,𝑏 : Mass of component in organic phase (g)
𝑚𝑐,𝑖𝑛 : Overall mass of component in the mixture (g)
As it was mentioned in section 2.4 the overall mass balance value calculated by
equation 3.3 was no higher than 1.5 % with an average of 0.7 %. In the case of
individual mass balances as they were calculated by equation 3.4, discrepancies of
±3% were observed in the majority of the experimental runs. These were deemed
acceptable taking into account evaporation losses or small inaccuracies of the
analytical measurements. In cases that the discrepancies exceeded this limit, the
compositional analysis of the phases was repeated with GC calibrations in a narrower
range. In most cases the results of the reanalysis gave lower discrepancies and
therefore replaced the initial values.
In order to evaluate the ability of MIBK to extract guaiacol from an aqueous solution
the extraction yield was defined as:
𝑌 =𝑚2,𝑏
𝑚2,𝑡𝑜𝑡𝑎𝑙 ∙ 100 [3. 5]
Where:
𝑌 : Extraction yield percentage
𝑚2,𝑏 : mass of guaiacol in organic phase (g)
𝑚2,𝑡𝑜𝑡𝑎𝑙 : mass of guaiacol in feed (g)
Additionally the distribution coefficient of guaiacol was calculated as an additional
measure of the capability of MIBK to extract guaiacol from the aqueous phase. The
distribution coefficient is defined as:
𝐷 =𝑤2,𝑏
𝑤2,𝑎 [3. 6]
Where:
𝐷 : Distribution coefficient of guaiacol
𝑤2,𝑏 : Mass fraction of guaiacol in the organic phase
𝑤2,𝑎 : Mass fraction of guaiacol in the aqueous phase

33
The selectivity is another factor that measures the ability of the solvent to extract the
solute (guaiacol) from the aqueous phase and it is defined as:
𝑆 =(
𝑤2,𝑏
𝑤1,𝑏)
(𝑤2,𝑎
𝑤1,𝑎)
[3. 7]
Where:
𝑆 : Selectivity of the solvent (MIBK) to the solute (guaiacol)
𝑤1,𝑏 : Mass fraction of water in the organic phase
𝑤1,𝑎 : Mass fraction of water in the aqueous phase
In the following sections the LLE experimental data were used to evaluate the
performance of MIBK in liquid-liquid extraction. Additionally the data were
discussed in a qualitative manner in order to extract significant results.
3.1.1. Performance of MIBK as an Extraction Agent
In this subsection the extraction yields the distribution coefficients and the
selectivities were used as indicators for the general behaviour of the extraction of
guaiacol from the aqueous phase by MIBK. The extraction yield can be used as a
technical tool in order to understand the effect of the amount of solvent to its ability to
extract the solute. In Figure 3.1 and Figure 3.2 the extraction yield is plotted against
the solvent to feed ratio for different conditions.
Figure 3.1: Extraction yield of guaiacol with MIBK at 30 °C
60
65
70
75
80
85
90
95
100
0.00 0.20 0.40 0.60 0.80 1.00 1.20
Extr
acti
on Y
ield
(w
t%)
S/F ratio
1% stock
2% stock

34
Figure 3.1 shows the extraction yield for the experiments that were performed at 30
°C. The first observation of these results is that the higher the amount of solvent the
more guaiacol is extracted which was according to expectations. However, it can be
observed that for S/F 0.5 and 1, the yield of the extraction is increasing only
approximately 5% compared to 0.25. This fact could suggest that a compromise of
S/F ratio and extraction yield could be the case, at a value lower than 0.5.
A compromise on the amount of solvent used would be reasonable for example if the
solvent usage cost was higher of what could be gained by the extracted guaiacol.
Since in an industrial extraction process MIBK is supposed to be reused like it was
shown in Figure 1.6 these costs could pertain to a number of sources. For example
these could be the purchasing of make up MIBK for inevitable losses and the energy
that is needed for the recovery. Both of those costs depend mainly on the total amount
of MIBK that is being used. With these considerations, an increase of 50 or 100% to
the amount of solvent used for a 5% increase in the extraction yield might not seem
reasonable.
Figure 3.2 shows the extraction yield results for the experiments that were performed
at 55 °C. Similarly to the results at 30 °C the higher the amount of MIBK the higher
the extraction is. Also the small increase of extraction yield between S/F 0.5 and 0.25
verify the observation that it may not be economical to increase the S/F more than 0.5.
Figure 3.2: Extraction yield of guaiacol with MIBK at 55 °C
Another interesting comparison for the present system was the distribution of guaiacol
between the two phases and the temperature effect on that distribution. In Figure 3.3
the mass fraction of guaiacol in the aqueous phase is plotted against the mass fraction
of guaiacol in the organic phase at the two temperatures that were studied.
60
65
70
75
80
85
90
95
100
0.00 0.20 0.40 0.60
Extr
acti
on Y
ield
(%
)
S/F ratio
1% stock
2% stock

35
Figure 3.3: Distribution of Guaiacol in the aqueous (a) and organic (b) phase at 30 and
55 °C
From Figure 3.3 it may be observed that for the higher temperature the mass fraction
of guaiacol has a tendency to be higher in the aqueous phase for a given mass fraction
in the organic phase compared to the lower temperature. That seems to be the case for
overall guaiacol mass fractions 0.8% to 1.86%.
The opposite seems to happen for the highest guaiacol overall composition
(1.90 wt%) which could mean that for higher guaiacol content the higher temperature
is more effective during the extraction. For the lower guaiacol overall mass fractions
the temperature does not seem to have an effect on the distribution. The last two
observations could serve only as guides for further study because they are not
definitive since they could own to analytical measurement inaccuracies.
Regarding the absolute value of the distribution coefficient, it seems that compared to
the extraction of phenol with MIBK, the extraction of guaiacol is more difficult. The
typical distribution coefficients that are reported in literature [20], [22], [23] for
phenol are over 100 and the results of this work show the highest value being a little
over 70. Taking into account other phenolic molecules the literature reports
distribution coefficients for cresols (o-, p-, m-) much higher with values up to 385
[20], [26]. However these can only be loosely compared with the current work
because in one case [20] the author reports only one value and the other [25] is using
Methyl Butyl Ketone as a solvent. The only molecule that according to literature has
a much lower value of distribution coefficient is catechol with values reported up to
20 [20].
One of the factors that affect the distribution is the solubility the phenolics in water. It
is expected that molecules with higher solubility like catechol (~ 461.4 𝑔
𝐿 @ 30 °C)
[28] would be more difficult to extract than cresols (~ 22 𝑔
𝐿 @ 30 °C) [28] that have
0
5
10
15
20
25
30
35
0 0.1 0.2 0.3 0.4 0.5 0.6
w2b %
w2a %
30 C
55 C

36
lower solubility in water. And that seems to be the case according to literature for
cresols and catechol. In addition, the solubility of phenol falls higher than cresol and
much lower than catechol (~ 84 𝑔
𝐿 @ 30 °C) [28] . It seems that the extraction ability
of MIBK for those molecules follow the trend that as the solubility of the molecule in
water is increasing the distribution coefficient decreases. However, in case of
guaiacol, that its solubility is close to the one of cresol, the distribution coefficient that
was found in this work is much lower than the one reported for cresol. That could
leave the space of trying a different solvent for the case of extracting guaiacol and
also the study of other factors that can affect the distribution.
Considering the selectivity of the extraction process a comparison between the two
temperatures could give some interesting indications. In Figure 3.4 the selectivity was
plotted against an increasing overall guaiacol mass fraction for the two temperatures
that were studied. From this diagram a few general observations could be made.
Initially the selectivity seems to start from lower values for the higher temperature
which may indicate that the extraction would be more successful at the lower
temperature. This could add to the similar observation for the distribution of guaiacol
between the two phases.
Figure 3.4: Selectivity comparison between 30 and 55 °C for different overall mass
fractions of guaiacol
In this figure something that could be considered is that there seems to be a trend of
the selectivity to decrease as the mass fraction of guaiacol increases for the lower
temperature. That is reasonable since the increasing of initial guaiacol is performed by
increasing the stock feed and decreasing MIBK which leaves a lower amount of
MIBK to extract a higher amount of guaiacol and therefore the mass fraction of
guaiacol in the aqueous phase is higher.
0
500
1000
1500
2000
2500
3000
3500
4000
0 0.5 1 1.5 2 2.5
Sel
ecti
vit
y
Overall guaiacol mass fraction wt%
30C
55C

37
3.1.2. Phase Equilibrium Behaviour
The phase behaviour of the system that was studied was plotted in ternary diagrams
for the two temperatures that were studied. The ternary diagrams can give an overall
idea of how the composition of the two phases is changing in the ternary system. In
these diagrams the three apexes represent a composition in which only one of the
components exists in pure form. In this case the left apex represents water, the right
MIBK and the top guaiacol. The tie lines that were produced in these ternary
diagrams are the connection of the ternary composition of the aqueous phase (left
side) and that of the organic phase (right side).
Figure 3.5: Ternary diagram of mass fractions for the system Water – Guaiacol –
MIBK at 30 °C
In these ternary diagrams it is observed that the effect of temperature for the
equilibrium values is not very high. In both cases the aqueous phase retains a
relatively stable composition. For the organic phase the results show that the mass
fraction of water starts from a little higher value for the 55 °C but except for that the
value increases only a little as the mass fraction of guaiacol is increasing in the
organic phase.

38
Figure 3.6: Ternary diagram of mass fractions for the system Water – Guaiacol –
MIBK at 55 °C
3.1.3. Further Data Investigation
Some potentially interesting data analysis was inspired by the initial literature review
that was performed for this project. This entailed the comparison of the compositional
changes in the two liquid phases and well defined trends of increase or decrease for
one component of the ternary system compared to another.
Initially in literature [22- 25] is reported that in the organic phase when the phenolic
mass fraction is increasing the water also follows the same trend. Figure 3.7 and
Figure 3.8 show the mass fraction of water (𝑤1,𝑏) and guaiacol (𝑤2,𝑏) plotted against
the solvent to feed ratio (S/F) at 30 °C. In both cases the mass fraction of guaiacol is
decreasing substantially since it is dilute in a higher amount of organic phase. That
decrease is followed by a smaller decrease in the water mass fraction which suggests
that the presence of guaiacol increases the solubility of water in this mixture. That can
also be verified by the fact that according to literature [38] the solubility of water in
MIBK expressed in mass fraction is approximately 0.016 and 0.024 for temperatures
30 and 55 °C respectively. The value that was measured by Karl Fischer for all the
runs was always above the literature values for the binary system MIBK-water.

39
Figure 3.7: Mass fraction of water and guaiacol in the organic phase at 30 °C and for
1% w/w feed stock solution
Figure 3.8: Mass fraction of water and guaiacol in the organic phase at 30 °C and for
2% w/w feed stock solution
In Figure 3.9 and Figure 3.10 similar plots are shown this time for the temperature 55
°C. The same trend exists also with the water mass fraction slightly decreasing as the
guaiacol mass fraction decreases.
0
2
4
6
8
10
12
14
16
18
0.00 0.20 0.40 0.60 0.80 1.00 1.20
mas
fra
ctio
n w
t%
S/F ratio
w1b
w2b
0
5
10
15
20
25
30
0.00 0.02 0.04 0.06 0.08 0.10 0.12
mas
fra
ctio
n w
t%
S/F ratio
w1b
w2b
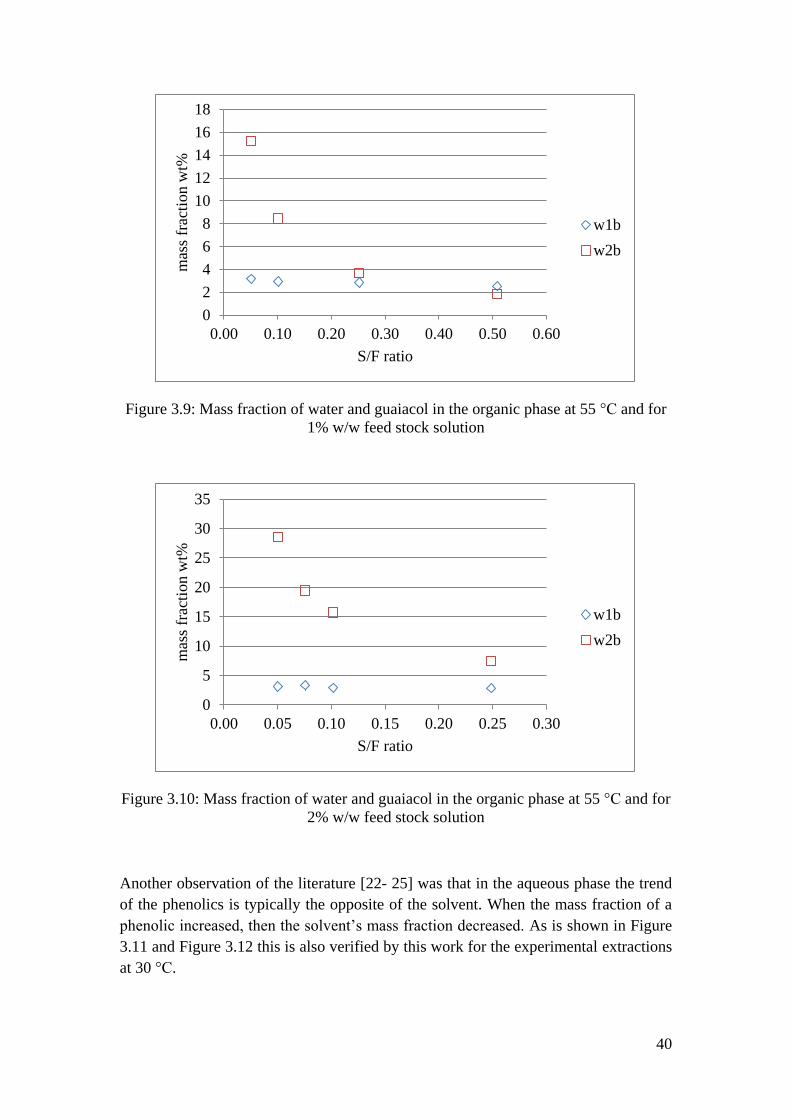
40
Figure 3.9: Mass fraction of water and guaiacol in the organic phase at 55 °C and for
1% w/w feed stock solution
Figure 3.10: Mass fraction of water and guaiacol in the organic phase at 55 °C and for
2% w/w feed stock solution
Another observation of the literature [22- 25] was that in the aqueous phase the trend
of the phenolics is typically the opposite of the solvent. When the mass fraction of a
phenolic increased, then the solvent’s mass fraction decreased. As is shown in Figure
3.11 and Figure 3.12 this is also verified by this work for the experimental extractions
at 30 °C.
0
2
4
6
8
10
12
14
16
18
0.00 0.10 0.20 0.30 0.40 0.50 0.60
mas
s fr
acti
on w
t%
S/F ratio
w1b
w2b
0
5
10
15
20
25
30
35
0.00 0.05 0.10 0.15 0.20 0.25 0.30
mas
s fr
acti
on w
t%
S/F ratio
w1b
w2b

41
Figure 3.11: Mass fraction of guaiacol and MIBK in the aqueous phase at 30 °C and
for 1% w/w feed stock solution
Figure 3.12: Mass fraction of guaiacol and MIBK in the aqueous phase at 30 °C and
for 2% w/w feed stock solution
However in the case of the experimental runs at 55 °C the results were not so clear.
The reason was that the gas chromatograph (GC) measurements were not always
completely accurate, as it was mentioned in section 2.5.1. Because of this, one of the
main advantages of the procedure adopted for this project was used. The phase
fraction (α) that was calculated for each extraction experiment was used in order to
calculate an ideal mass fraction for MIBK in the aqueous phase.
0.0
0.5
1.0
1.5
2.0
2.5
0.00 0.20 0.40 0.60 0.80 1.00 1.20
mas
fra
ctio
n w
t%
S/F ratio
w2a
w3a
0
0.2
0.4
0.6
0.8
1
1.2
1.4
1.6
0.00 0.02 0.04 0.06 0.08 0.10 0.12
mas
fra
ctio
n w
t%
S/F ratio
w2a
w3a

42
It was assumed that the mass of MIBK added in each extraction was accurately
measured by the analytical balance. Additionally, the measured by the GC mass
fraction of guaiacol in the organic phase and the measurement of water by the Karl
Fischer titration were assumed accurate. Using the calculated mass fraction of
guaiacol in the organic phase, the mass of guaiacol was calculated. Ultimately, the
calculated MIBK mass in the organic phase was subtracted from the original MIBK
mass and the mass fraction for the aqueous phase was calculated by:
𝑤3,𝑎𝑐𝑎𝑙𝑐 =
𝑚3,𝑎𝑐𝑎𝑙𝑐
𝑚𝑎𝑞 [3. 8]
Where:
𝑤3,𝑎𝑐𝑎𝑙𝑐 : Calculated mass fraction of MIBK in aqueous phase
𝑚3,𝑎𝑐𝑎𝑙𝑐 : Calculated mass of MIBK in aqueous phase (g)
𝑚𝑎𝑞 : Measured mass of aqueous phase (g)
The values for the mass fraction of MIBK that were calculated were plotted against
the S/F in addition to the GC resulting mass fractions in Figure 3.13 and Figure 3.14.
Figure 3.13: Mass fraction of guaiacol and MIBK (measured and calculated) in the
aqueous phase at 55 °C and for 1% w/w feed stock solution
0
0.5
1
1.5
2
2.5
3
0.00 0.10 0.20 0.30 0.40 0.50 0.60
mas
s fr
acti
on w
t%
S/F ratio
w2a w3a w3a calculated

43
Figure 3.14: Mass fraction of guaiacol and MIBK (measured and calculated) in the
aqueous phase at 55 °C and for 2% w/w feed stock solution
These two diagrams show that the calculated values of MIBK verify the expected
trend in the majority of the experimental runs. In general, since the results at 30 °C
are in agreement with literature for similar ternary systems it was assumed that this
should be the trend of change between water and guaiacol. This assumption suggests
that the issue could be mitigated by a number of changes in the method of GC
analysis that may be used in further work, since time limitation did not allow the
application of such changes. These changes are discussed in the perspective section of
this report as suggestions for future work.
0
0.5
1
1.5
2
2.5
0.00 0.05 0.10 0.15 0.20 0.25 0.30
mas
s fr
acti
on
S/F ratio
w2a w3a w3a calculated


44
Chapter 4
4. Conclusion
The work of this project was based on the definition of the problem which was:
“Develop and utilize a laboratory scale liquid-liquid extraction method for Guaiacol
by using Methyl Isobutyl Ketone (MIBK) as an organic solvent. The method should
provide accurate experimental liquid-liquid equilibrium data for the ternary system
Water-Guaiacol-MIBK.”
This project was based on the study of an aqueous stream that is present in the process
of the hydrothermal conversion of lignin to liquid fuel and industrial chemicals. The
recovery of phenolic components is a part of optimizing the process in order to make
it economically feasible. The recovery is typically performed by liquid-liquid
extraction with the use of an organic solvent. The aspects that have to be studied in
such a case are the performance of different solvents and the modeling of the system.
Both of the above require accurate liquid-liquid equilibrium data for the system.
Since this is a complicated multicomponent system, the typical strategy is the study of
individual ternary systems that can be combined using an appropriate thermodynamic
model which can simulate the original system. In this case such systems contain
water, an individual phenolic component and an organic solvent used for the
extraction. After the necessary literature study it was indicated that for some of the
phenolics there are no experimental data at all and one of the most prominent
components was guaiacol. Additionally, the literature indicated that Methyl Isobutyl
Ketone (MIBK) is a promising solvent for extraction purposes. Therefore the work of
this project was focused on the acquisition of liquid-liquid equilibrium experimental
data for the ternary system Water – Guaiacol – MIBK.
In order to succeed to the above, a procedure was planned for the liquid-liquid
extraction and the acquisition of the equilibrium data. The procedure that was adopted
was able to give good equilibrium results. The results were used to study the
effectiveness of MIBK for the extraction of guaiacol from water. It was observed that
MIBK is able to extract a high percentage of guaiacol (up to 96%) considering the
single stage procedure and the operating conditions that were applied in this project.
Performing similar experiments in the two different temperatures it was observed that
the extraction may be more successful in the lower temperature (30 °C). However, the
absolute differences between the two temperatures were low to give definitive choice
between the two. The lower temperature can also have the advantage of lower loss
due to evaporation but for the experimental setup used in this project this was not an
issue since sampling could be done in closed containers.

45
Regarding the industrial process of extraction, the initial temperature of the aqueous
stream exiting the reactor can be as high as 600 °C. That could mean that the highest
acceptable temperature for the extraction would be the prevalent choice since it would
need less cooling for the extraction process and less heating power when it is
recirculated to the hydrothermal process.
The comparison of present results with literature experimental data, for similar
systems, showed a reduced extraction capacity of MIBK for guaiacol in comparison
to other phenolic molecules like phenol or cresols. However, the extraction yield is
sufficiently high and since guaiacol is one of the most valuable of the phenolic
components, MIBK remains one of the most successful extraction solvents that are
available.
In total the procedure that was used in this project was deemed satisfactory in many
levels. The use of separation funnels as an equilibrium vessel gave the advantage of
enabling an accurate measurement of the mass of the two liquid phases. This was an
apparent advantage in the evaluation of the experimental runs by mass balances. In
the case of the present work, since the weight measurement was assumed accurate, the
phase fraction (α) could be used as a contingency measure when some of the gas
chromatography results seemed dubious. In that aspect, it was used to calculate the
mass fraction of MIBK in the aqueous phase for the experiments at 55 °C when they
were observed to divert from an expected trend.
Another advantage of the procedure used in this project was the measurement of the
water mass fraction in the organic phase by Karl Fischer Titration (KF). KF is
considered very accurate and in this work it was evaluated as such. This fact, coupled
with the consistency of the Gas Chromatography (GC) measurements for the organic
phase made the final results for the organic phase very trustworthy.
Concluding, during the work that took place for this project, it was possible to acquire
liquid-liquid equilibrium data for a ternary system that is relevant to the downstream
process of hydrothermal conversion of lignin. This kind of data is valuable in the
effort to make biomass a viable source of fuel and valuable chemicals. An additional
value to this work is that the data acquired are not only valuable in the specific
process but also in other industrial processes. For example the removal of phenolics
from water is a standard process in the petroleum refining industry and petrochemical
manufacturing since they are considered pollutants. In a lot of cases the
concentrations are high enough that propose added value by recovering them instead
of applying degradation methods.

46
Chapter 5
5. Perspective
During the experimental work of this master thesis project certain ideas were
presented for the expansion or the optimization of procedures that were used.
Regarding further work:
The ultimate goal of the acquisition of liquid-liquid equilibrium experimental data for
ternary systems is for them to be used in conjunction with thermodynamic models in
order to simulate an industrial process. In this case the liquid-liquid extraction of
numerous phenolic components that exist in an aqueous process stream. The
thermodynamic correlation of data offers a powerful tool for process simulation
which is essential in all industrial processes. For the ternary system that was chosen
for this project, and optimally after the acquisition of a few more experimental data
points, binary interaction parameters could be calculated and used with an appropriate
thermodynamic model.
The literature study showed that some of the relevant phenolic components have not
been studied in this frame. Phenol, guaiacol, catechol and cresols are the most
abundant components found in the aqueous phase of the lignin conversion process.
Since liquid-liquid equilibrium data for catechol are not available in literature, it
would be very relevant to perform a similar study for the ternary system Water –
Catechol – MIBK.
An interesting study related to the present work might be the liquid-liquid extraction
of quaternary systems with more than one phenolic component. This could show how
the presence of one phenolic changes the behavior of another. In addition, the aqueous
phase of an actual lignin hydrothermal conversion system could serve as feed for
extraction experiments. These two considerations could be used also as a validation
for the potential modeling of the system.
Except temperature it is expected that the pH on which the extraction is taking place
can be an affecting factor for the liquid-liquid equilibrium conditions. The
experimental data in this work were performed in slightly acidic conditions since the
water-guaiacol stock solution had an average pH of 5.5. Literature suggests that the
actual process stream contains potassium carbonate which increases the pH and
makes it alkaline [11]. Therefore a study of the pH effect to the extraction process
would be interesting for future expansion of this work.

47
Regarding the modification of the procedure that was used for this project:
A few adjustments to the experimental setup could make a more convenient
procedure. It was observed that the use of separation funnels provide certain
advantages compared to setups used by other authors. A possible modification could
be on the method of mixing by using a mechanical stirrer that could be attached to the
funnel cap from above. In this way the stirring could take place for a long time in the
set temperature and in a separation funnel.

48
Appendix I. GC Program and Standard Solutions
α. Gas Chromatograph Program
The gas chromatograph that was used throughout the analytical measurements of this
project was programmed as follows. The initial temperature of the oven of the GC
was kept for 1 minute at 110 °C. Then the temperature was increased at a rate of 30
°C per minute up to 250 °C and it was kept at this temperature for 1 minute. The
injector temperature was 250 °C. The split ratio was kept constant throughout the
measurements at the value of 50 and the pressure of the column at 10 psi.
β. Standard Solutions
Guaiacol in the organic phase
The standard solutions that were used for the calibration of the GC for the
measurement of guaiacol concentration in the organic phase, were produced as
follows.
A stock solution of 22.2 𝑔
𝐿 of guaiacol diluted in pure methyl isobutyl ketone (MIBK)
was produced. Additionally a stock solution of the Internal Standard (IS) was
produced with 15 𝑔
𝐿 of bromobenzene diluted in pure MIBK.
The standard solutions that were used are reported in the following table.
Table 5.1: Standard solutions for the analysis of Guaiacol in the organic phase
Standard
Guaiacol
Stock 𝟐𝟐. 𝟐 𝒈
𝑳
(𝑚𝑙)
IS- Stock
𝟏𝟓 𝒈
𝑳
(𝑚𝑙)
MIBK
(𝑚𝑙)
Guaiacol
(𝑔
𝐿)
Brombenzene (IS)
(𝑔
𝐿)
Std 1 0.50 5.00 4.50 1.11 7.50
Std 2 1.00 5.00 4.00 2.22 7.50
Std 3 3.00 5.00 2.00 6.66 7.50
Std 4 5.00 5.00 0.00 11.1 7.50

49
Guaiacol and MIBK in the aqueous phase
Similarly to the above mentioned procedure the standard solutions to calibrate the GC
for the concentration measurement of guaiacol and MIBK in the aqueous phase were
as follows.
A stock solution of 8.88 𝑔
𝐿 guaiacol and 8
𝑔
𝐿 MIBK diluted in distilled water were
produced. Additionally a stock solution of the Internal Standard (IS) was produced
with 8 𝑔
𝐿 of methyl ethyl ketone (MEK) diluted in distilled water. The standard
solutions that were used are reported in the following tables.
Table 5.2: Standard solutions for the analysis of Guaiacol and MIBK in the aqueous
phase
Standard
Guaiacol &
MIBK stock
𝟖. 𝟖𝟖 𝐠
𝐋 & 𝟖
𝐠
𝐋
(ml)
IS – Stock
𝟖 𝐠
𝐋
(ml)
Distilled
Water
(ml)
MIBK
(g
L)
Guajacol
(g
L)
MEK
(IS)
(g
L)
Std 1 0.05 5.00 4.95 0.04 0.044 4.00
Std 2 0.10 5.00 4.90 0.08 0.088 4.00
Std 3 0.50 5.00 4.50 0.40 0.444 4.00
Std 4 1.00 5.00 4.00 0.80 0,888 4.00
Std 5 3.00 5.00 2.00 2.40 2.660 4.00
Std 6 5.00 5.00 0.00 4.00 4.440 4.00

50
Bibliography
[1] P. Azadi, O. R. Inderwildi, R. Farnood, and D. A. King, “Liquid fuels,
hydrogen and chemicals from lignin: A critical review,” Renew. Sustain.
Energy Rev., vol. 21, pp. 506–523, 2013.
[2] S. N. Naik, V. V. Goud, P. K. Rout, and A. K. Dalai, “Production of first and
second generation biofuels: A comprehensive review,” Renew. Sustain. Energy
Rev., vol. 14, no. 2, pp. 578–597, 2010.
[3] A. Demirbas, “Biorefineries: Current activities and future developments,”
Energy Convers. Manag., vol. 50, no. 11, pp. 2782–2801, 2009.
[4] M. H. Farhad, M. Hasanuzzman, N. a Rahim, and K. Lumpur, “Required
Energy Form,” 2013.
[5] M. Verma, S. Godbout, S. K. Brar, O. Solomatnikova, S. P. Lemay, and J. P.
Larouche, “Biofuels production from biomass by thermochemical conversion
technologies,” Int. J. Chem. Eng., vol. 2012, 2012.
[6] B. M. Upton and A. M. Kasko, “Strategies for the Conversion of Lignin to
High-Value Polymeric Materials: Review and Perspective,” Chem. Rev., p.
acs.chemrev.5b00345, 2015.
[7] Khanal, S. K, Surampalli, and R. Y, Bioenergy and Biofuel from Biowastes and
Biomass. Reston, VA, USA: American Society of Civil Engineers, 2010.
[8] S. Kang, X. Li, J. Fan, and J. Chang, “Hydrothermal conversion of lignin: A
review,” Renew. Sustain. Energy Rev., vol. 27, pp. 546–558, 2013.
[9] X. F. Zhou, “Conversion of kraft lignin under hydrothermal conditions,”
Bioresour. Technol., vol. 170, pp. 583–586, 2014.
[10] J. Barbier, N. Charon, N. Dupassieux, A. Loppinet-Serani, L. Mahé, J. Ponthus,
M. Courtiade, A. Ducrozet, A. A. Quoineaud, and F. Cansell, “Hydrothermal
conversion of lignin compounds. A detailed study of fragmentation and
condensation reaction pathways,” Biomass and Bioenergy, vol. 46, pp. 479–
491, 2012.

51
[11] T. D. H. Nguyen, M. Maschietti, T. Belkheiri, L. E. ??mand, H. Theliander, L.
Vamling, L. Olausson, and S. I. Andersson, “Catalytic depolymerisation and
conversion of Kraft lignin into liquid products using near-critical water,” J.
Supercrit. Fluids, vol. 86, pp. 67–75, 2014.
[12] R. Vanholme, B. Demedts, K. Morreel, J. Ralph, and W. Boerjan, “Lignin
biosynthesis and structure.,” Plant Physiol., vol. 153, no. 3, pp. 895–905, 2010.
[13] A. a. Peterson, F. Vogel, R. P. Lachance, M. Fröling, M. J. Antal, Jr., and J. W.
Tester, “Thermochemical biofuel production in hydrothermal media: A review
of sub- and supercritical water technologies,” Energy Environ. Sci., vol. 1, no.
1, p. 32, 2008.
[14] D. C. Elliott, P. Biller, A. B. Ross, A. J. Schmidt, and S. B. Jones,
“Hydrothermal liquefaction of biomass: Developments from batch to
continuous process,” Bioresour. Technol., vol. 178, pp. 147–156, 2015.
[15] D. Knorr, J. Lukas, and P. Schoen, “Production of Advanced Biofuels via
Liquefaction Hydrothermal Liquefaction Reactor Design,” 2013.
[16] M. Weber, M. Weber, and M. Kleine-Boymann, “Ullman’s encyclopedia of
industrial chemistry - Phenol,” in Ullman’s encyclopedia of industrial
chemistry - Phenol, 2012, pp. 503–519.
[17] Mordor Intelligence, “Global Lignin Products Market - Segmented By Product
Type, Source, Application, And Geography - Trends And Forecasts (2015-
2020),” 2016. [Online]. Available:
http://www.mordorintelligence.com/industry-reports/global-lignin-products-
market-industry.
[18] H. Fiege, H.-W. Voges, To. Hamamoto, S. Umemura, T. Iwata, H. Miki, Y.
Fujita, H.-J. Buysch, D. Garbe, and W. Paulus, “Ullman’s encyclopedia of
industrial chemistry - Phenol Derivatives,” Ullman’s Encycl. Ind. Chem., pp.
503–519, 2012.
[19] H. Fiege, Ullman’s encyclopedia of industrial chemistry - Cresols and
Xylenols. 2012.
[20] K. W. Won and J. M. Prausnitz, “Distribution of phenolic water and polar
organic solutes between solvents,” Jorunal Chem. Thermodyn., vol. 7, pp. 661–
670, 1975.

52
[21] K. S. Narasimhan, C. C. Reddy, and K. S. Chari, “Solubility and Equilibrium
Data of Phenol-Water-Isoamyl Acetate and Phenol-Water-Methyl Isobutyl
Ketone Systems at 30° C,” J. Chem. Eng. Data, vol. 7, no. 4, pp. 457–460,
1962.
[22] D. C. Greminger, G. P. Burns, S. Lynn, D. N. Hanson, and C. J. King, “Solvent
extraction of phenols from water,” Ind. Eng. Chem. Process Des. Dev., vol. 21,
no. 1, pp. 51–54, 1982.
[23] C. Yang, Y. Qian, Y. Jiang, and L. Zhang, “Liquid-liquid equilibria for the
quaternary system methyl isobutyl ketone-water-phenol-hydroquinone,” Fluid
Phase Equilib., vol. 258, no. 1, pp. 73–77, 2007.
[24] Y. Lei, Y. Chen, X. Li, Y. Qian, S. Yang, and C. Yang, “Liquid−Liquid
Equilibria for the Ternary System 2-Methoxy-2- methylpropane + Phenol +
Water,” J. Chem. Eng. Data, vol. 58, pp. 1874–1878, 2013.
[25] Y. Chen, Z. Wang, and L. Li, “Liquid − Liquid Equilibria for Ternary Systems:
Methyl Butyl Ketone + Phenol + Water and Methyl Butyl Ketone +
Hydroquinone + Water at 298.15 K and 323.15 K,” J. Chem. Eng. Data, vol.
59, pp. 2750–2755, 2014.
[26] R. Lv, Z. Wang, L. Li, and Y. Chen, “Liquid–liquid equilibria in the ternary
systems water+cresols+methyl butyl ketone at 298.2 and 313.2K: Experimental
data and correlation,” Fluid Phase Equilib., vol. 404, pp. 89–95, 2015.
[27] ROWA Labortechnische Anlagen GmbH, “Automatic water distillation
apparatus RO 1034.” .
[28] S. H. Yalkowsky, Y. He, and P. Jain, Handbook of Aqueous Solubility Data,
Second Edition. CRC Press, 2010.
[29] DOW the chemical company, “Methyl Isobutyl Ketone -- Technical Data
Sheet,” 2002.
[30] M. Ragnar, C. T. Lindgren, and N.-O. Nilvebrant, “pKa-Values of Guaiacyl
and Syringyl Phenols Related to Lignin,” J. Wood Chem. Technol., vol. 20, no.
3, pp. 277–305, 2000.
[31] J. A. Dean, Lange’s book of chemistry, 15th ed., vol. 229, no. 1. 1997.

53
[32] D. L. Venter and I. Nieuwoudt, “Liquid-liquid equilibria for phenolic
compounds, neutral oils, and nitrogen bases at 313.15 K,” J. Chem. Eng. Data,
vol. 46, no. 4, pp. 813–822, 2001.
[33] O. D. Sparkman, Z. Penton, and F. G. Kitson, Gas Chromatography and Mass
Spectrometry: A Practical Guide. Elsevier Science, 2011.
[34] W. E. Katja Dettmer-Wilde, Practical Gas Chromatography: A Comprehensive
Reference, vol. 5. 2014.
[35] PerkinElmer Inc., “Clarus 500/580 GC User’s Guide.” 2010.
[36] P. Bruttel and R. Schlink, “Water Determination by Karl Fischer Titration,”
2003.
[37] Subcommittee E15.01, “Standard Test Method for Water Using Volumetric
Karl Fischer Titration - ASTM E203.” ASTM International.
[38] M. Góral and B. Wiśniewska-Gocowska, “IUPAC-NIST solubility data series.
86. Ethers and ketones with water. Part 5. C6 ketones with water,” J. Phys.
Chem. Ref. Data, vol. 37, no. 3, pp. 1575–1609, 2008.


![Preparation of Reducing Sugar Hydrolyzed from High-Lignin ...Preparation of Reducing Sugar Hydrolyzed from High-Lignin Coconut Coir Dust Pretreated by the Recycled Ionic Liquid [mmim][dmp]](https://img.dokumen.tips/doc/110x75/60f9bd983b8eea30bf3de9f2/preparation-of-reducing-sugar-hydrolyzed-from-high-lignin-preparation-of-reducing.jpg)


![Synthesis of Lignin-based Epoxy Resin using Ionic Liquid [BMIm]Cl · Synthesis of Lignin-based Epoxy Resin using Ionic Liquid [BMIm]Cl Z.L. YANG1, R.F.ZHANG1, M.Q. CHEN1 & W.T. LI1](https://img.dokumen.tips/doc/110x75/612f89de1ecc5158694382fc/synthesis-of-lignin-based-epoxy-resin-using-ionic-liquid-bmimcl-synthesis-of-lignin-based.jpg)