Embed Size (px)
Citation preview

The Journal of Neuroscience, June 1992, 12(6): 2266-2267
Reconstruction of Action Potential Development from Whole-Cell Currents of Differentiating Spinal Neurons
Shawn R. Lockery” and Nicholas C. Spitzer
Department of Biology and Center for Molecular Genetics, University of California at San Diego, La Jolla, California 92093
The duration and ionic dependence of action potentials are developmentally regulated. Voltage-clamp recordings of amphibian spinal neurons have revealed alterations in five currents. To determine whether the changes in the currents are sufficient to produce the change in action potential du- ration and ionic dependence, we constructed a Hodgkin- Huxley model of electrical excitability of these neurons. The model shows that the equations describing the voltage- clamped currents of young and mature neurons generate action potentials appropriate in duration and ionic depen- dence for each developmental stage. Moreover, the ob- served changes in the currents are quantitatively sufficient to produce the changes in the action potential. The effect of the change in each current is detectable in the model. However, the increase in amplitude of the.delayed-rectifier potassium current has the largest effect. The model further shows that changes in action potential duration could be achieved with changes in kinetics rather than amplitude of this current, or with changes in amplitudes of other currents. Thus, although increase in amplitude of the delayed rectifier plays a pivotal role in the maturation of excitability, it is not uniquely positioned to govern the action potential duration.
Action potentials of Xenopus spinal neurons first appear at the time of closure of the neural tube. At this stage, action potentials are long (60-90 msec) in duration and largely calcium depen- dent. Twenty-four hours later, at the tailbud stage, the action potential has been converted to a brief (2-3 msec), sodium- dependent impulse (Spitzer and Lamborghini, 1976; Baccaglini and Spitzer, 1977; Blair, 1983; O’Dowd, 1983). Forty-eight hours after neural tube closure, action potential duration decreases still further (1.3 msec) and spinal neurons lose the ability to fire repetitively (Ribera and Spitzer, 1989, 1990).
In whole-cell voltage-clamp experiments, five currents con- tributing to the action potential have been isolated and their
Received Aug. 22, 199 I; revised Jan. 7, 1992; accepted Jan. 13, 1992. We thank Jim Rapp for computational assistance, Melissa Martin and I-teh
Hsieh for contributions to programming, Eric Frank and Bill Zagotta for graphics software, and Paul Bush, Bill Lytton, Angeles Ribera, Terry Sejnowski, and Jack Wathey for penetrating comments on the manuscript. SRL acknowledges support of a NSF Predoctoral Fellowship, a Bank of America Giannini Foundation Fel- lowship, and a NIH Postdoctoral Fellowship. N.C.S. is a Fellow of the JS Gug- genheim Foundation. Grant support was provided by NS 25918 to N.C.S. and W.B. Kristan Jr.
Correspondence should be addressed to Nicholas C. Spitzer, Department of Biology and Center for Molecular Genetics, University of California at San Diego, La Jolla, CA 92093.
= Present address: Computational Neurobiology Laboratory, Salk Institute, La Jolla, CA 92037. Copyright 0 I992 Society for Neuroscience 0270-6474/92/122268-20$05.00/O
developmental changes characterized (O’Dowd et al., 1988; Ri- bera and Spitzer, 1990). The largest changes are observed in the delayed-rectifier potassium current (I,,), which exhibits a three- fold increase in amplitude and a twofold increase in its rate of activation during the first day. In addition, the sodium current (INa) doubles in amplitude and the calcium current (ZC,) exhibits an increase in its extent of inactivation during this period. The calcium-dependent potassium current (ZKc) increases in ampli- tude and extent of rectification and inactivation. The inacti- vating potassium A current (I,,), which is absent at the time of neural tube closure, is present in all neurons 2 d later.
Several questions are brought into focus by these findings. Have all currents underlying young and mature forms of the action potential been identified or are additional currents re- quired? What is the relative contribution to action potential shortening of each of the developmental changes in the currents? Is the delayed rectifier preeminent, as suggested by the fact that changes in it are the largest? If so, is this because the changes are large or because the action potential duration is especially sensitive to this current?
We addressed these questions by constructing a computer model of electrical excitability of the amphibian spinal neuron. Hodgkin-Huxley equations for membrane excitability were adopted (Hodgkin and Huxley, 1952). Parameters in the equa- tions were adjusted so that the model closely reproduced the amplitude and time course of whole-cell voltage-clamped cur- rents recorded from cultured neurons at the three stages of de- velopment. The sufficiency of observed developmental changes in accounting for the change in action potential duration was then tested by comparing simulated and experimentally record- ed action potentials at each stage. The relative contribution of the change in each current was tested by simulating action po- tentials in cells in which only one developmental change was allowed to occur, or in complimentary simulations in which all but one change were permitted.
We find that the identified currents are sufficient to produce the duration, waveform, and ionic dependence of action poten- tials observed at each stage of development. As expected, the delayed-rectifier potassium current makes the largest contri- bution to shortening of the action potential. Most of its effect is due to the increase in amplitude rather than to the increase in rate of activation. The effects of changes in other currents, though detectable, are smaller. Repetitive firing to sustained current injection at the mature stage is also predicted by the model. The model exhibits additional action potential short- ening and loss of repetitive firing upon addition of the A current and decrease in sodium current density, consistent with exper- imental observations (Kidokoro and Sand, 1989; Ribera and

The Journal of Neuroscience, June 1992, 12(6) 2269
Spitzer, 1990). However, we find that the duration of the young action potential is as sensitive to changes in amplitude of I,, and I,, as it is to changes in the delayed-rectifier potassium current, although such extensive changes are not observed ex- perimentally. More extensive changes in kinetics of Z,, would also be sufficient by themselves to achieve the developmentally observed shortening in duration. We conclude that in this sys- tem the amplitude of ZKv is not uniquely positioned to govern developmental changes in action potential duration, since these could have been accomplished by large changes in other cur- rents.
A preliminary account of some of these findings has appeared (Spitzer, 1988).
Materials and Methods Physiology. The model is based on voltage-clamp data from amphibian spinal neurons acquired previously (O’Dowd et al., 1988; Ribera and Spitzer, 1990). Supplementary unpublished data (A. B. Ribera and N.C.S.) were used for sodium- and for calcium-dependent and inactivating potassium A currents. These whole-cell currents were isolated by ion substitution, application of various blocking agents, or voltage proto- cols. Currents recorded between 6 and 9 hr, 26 and 29 hr, and 48 and 52 hr in culture, corresponding to neural tube, tailbud, and feeding stages of embryonic development, are designated “young,” “mature,” and “late,” respectively. For each ionic current, a single family of voltage- clamped traces was chosen that illustrated the mean current-voltage relation, as well as kinetics of activation and inactivation, at each de- velopmental stage. The contribution of noise in the physiological re- cordings was reduced by selection of exemplars that were relatively large but well controlled. Selection favored families in which peak or steady- state current was a smoothly graded function of clamp voltage, indi- cating that satisfactory control of membrane potential had been achieved. Action potentials were selected from previously unpublished data (N.C.S. and A. B. Ribera), chosen to reflect mean values (Blair, 1983; O’Dowd, 1983; Ribera and Spitzer, 1990).
Equations. Neurons were modeled as single electrical compartments (Segev et al., 1989) since the cultured cells from which voltage-clamp data were obtained were essentially isopotential (O’Dowd et al., 1988). In an isopotential compartment, there is no axial current, and
Four voltage- and time-dependent ionic currents underlie the action potential at young and mature developmental stages. Thus, the ex- panded form of Equation 1 is
-cg = I,, + I,, + Ic, + I,, f I,,
An additional term was added to the right side of the equation to model the action potential at the late stage of development when Z, is present. The value of the capacitance C was set to the mean capacitance recorded during whole-cell voltage-clamp experiments (18 pF); this corresponds to a cell with a surface membrane of about 1800 pm2. Ihak represents a voltage-independent conductance that remains when all other currents are inactivated or blocked. The leak was adjusted to achieve the mean input resistance recorded at the resting potential (Willard, 1980; Blair, 1983) and assigned a reversal potential equal to the potassium equilib- rium potential.
Parameters. The principal task in constructing the mode1 was to de- termine parameters governing the voltage and time dependence of A and B for each current at each developmental stage. This was achieved by fitting parameters for the voltage dependence of steady-state acti- vation and inactivation and their time constants using whole-cell volt- age-clamp data. The analysis also produced values for constants such as g. and E,. Least-squares fits to digitized data were obtained using a nonlinear least-squares fitting routine in the RS 1 data analysis package (Bolt, Beranek, and Newman, Inc., Cambridge, MA). Fitting some cur- rents required choice of values for parameters outside the voltage range in which the currents were recorded. In these cases, values were chosen to be consistent with the behavior of these parameters established in other systems and to achieve smoothly continuous functions.
Determination of parameters in the mode1 involved the following steps:
(1) For noninactivating currents, the maximum current at each voltage was taken as the steady-state current (I-) recorded at that voltage.
(2) For inactivating currents, the falling phase of the current at each voltage was extrapolated backward in time by fitting it with the equation
Each current exemplar in the model was multiplied by a scale factor I(t) = IOe-lJ~B.
Voltage- and time-dependent currents were modeled using a simpli- fication of the Hodgkin-Huxley (1952) equations (Connor and Stevens, 197 1 a,b; Byrne, 1980a,b). Accordingly, conductance for each current was calculated as the product of maximum conductance and activation and inactivation terms. Current was obtained as the product of con- ductance and driving force, giving an equation of the form
In = && (K O&if’, t)(V - En), (3)
where g, represents the maximum conductance achieved by the mod- eled exemplar, and A, and B, are, respectively, voltage-dependent ac- tivation and inactivation terms with values between 0 and 1. The sub- script n refers to the particular ionic current involved. The calcium dependence and unusual time course of calcium-dependent potassium current (I,,) required a slightly different treatment (see below). B,, was omitted for both the delayed rectifier (I,,) and the sustained component of the calcium-dependent potassium current (I,,,), for which voltage- clamp records indicate no inactivation. The power p of the activation term determined the delay in activation; values of p were chosen sep- arately for each exemplar. Activation and inactivation were assumed to be first-order processes governed by the equations
The steady-state activation of each current, A,,,(v), was given by
where V, is the voltage at which the current is half-activated and s determines the steepness with which steady-state activation occurs. The expressions for steady-state inactivation, B,,,(v) and for T,J P’) and T,.( t’) differed among exemplars, and are given in the Appendix, as are expressions for the voltage dependence of A,,,( t’). The relationships found for voltage dependence of activation, inactivation, and the time constants are shown graphically in Figures 14 and 6.
The driving force for each ion was usually given by V - IT,, where E, was determined from the Nemst equation. For calcium currents, the large difference between high external and low internal calcium con- centrations rendered the constant field equation appropriate (Hodgkin and Katz, 1949; Hagiwara and Byerly, 198 1).
(7)
fso that the maximum current amplitude matched as closely as possible the mean maximum current recorded in many different neurons (O’Dowd et al., 1988; Ribera and Spitzer, 1990). This procedure was adopted since each exemplar was recorded from a different cell. To find the scale factors for the modeled currents, the difference between maximum cur- rent for each exemnlar and the mean maximum recorded current was calculated for voltage clamps at 0, 10, and 20 mV, since the overshoot and plateau of action potentials occur in this range. A single scale factor was chosen to minimize the difference between exemplar and recorded current using a least-squares minimization routine.
IO, the value of the current extrapolated to t = 0, is an estimate of steady- state current at that voltage in the absence of inactivation. The fitting procedure also provided an estimate of rs, the time constant of inac- tivation.
(3) The power for the activation parameter p was chosen by a fit of
I(t) = I,(1 - e-‘/Tp (8)
to the foot and rising phase of the maximum recorded current. This yielded p, which was then rounded to the nearest integer. For sodium
2270 Lockery and Spitzer - Modeling Differentiation of Action Potentials
* 4 1 nA
Figure 1. Voltage and time depen- dence of delayed-rectifier potassium ? currents (I,,). A, Steady-state current. 2 0.5
B, Steady-state activation. C, Time a constant for activation. Solid circles are derived from currents recorded from a young cell; open circles are from a ma- ture cell. Broken lines, young cell; solid 0
-40
lines. mature cell. -100 -50
currents, the traditional value ofp = 3 was used. For calcium-dependent potassium currents, p was chosen in conjunction with other parameters contributing to the foot and rising phase.
(4) I, for noninactivating currents and Z0 for inactivating currents were fit against voltage using an equation of the form
4 V = WC W V - Lv) (9)
to find gand the constants in the equation for A( k’) (Eq. 6; see Appendix). This procedure was also used to estimate E,, since the intracellular sodium concentration was not known. For potassium currents, E, was calculated directly from known internal and external potassium con- centrations. For calcium currents, the constant field equation was sub- stituted for the term (V - E,,), and the equation for the current was fit as for sodium and potassium currents; the calcium permeability pc* was determined during this fitting step.
(5) For inactivating currents, steady-state inactivation was calcu- lated as
Bee = L(~~Mv) (10) and fitted to find B, as a function of voltage.
(6) The time constants of inactivation derived in step 2 were fit to obtain r8 as a function of voltage.
(7) The time constants of activation were evaluated by trial and error until the model reproduced the amplitudes and times to peak of the current at each voltage, and were then fit to yield r,, as a function of voltage.
Delayed-rectiJier potassium current (IKv). I,, was modeled as a Hodg- kin-Huxley delayed rectifier with an activation term A,, raised to a power p. The power of the activation term was chosen by assuming that current rises with the time course given by Equation 8. Different powers were chosen for young and mature exemplars. This most likely reflects the difference between particular exemplars rather than a systematic developmental difference, since this method also gave different powers for different exemplars at the same developmental stage.
Other parameters governing ZKv were determined by plotting the am- plitude of the current at steady-state (ZKv,J against voltage (Fig. 1A) and fitting with the equation
C 1000 mr
I
100 ---..
h 10
-;\-
-...
Pa
-... --..
-... -----me__
1
mV 0.1 ,
0 50 -100 -50 0 50
where g,, is the maximum conductance and AKv+,( f’) is given by Equa- tion 6. The values of g,, in Equation 11 and VO and s in Equation 6 were selected during the fitting procedure. The values of V, and s thus obtained yielded the function shown in Figure 1B. The rate constant for activation, rA.kv, was chosen to achieve a close fit to the rising phase of the current measured at each voltage (Fig. 1 C).
Sodium current (I,). INa was fit using the conventional Hodgkin- Huxley formulation. Conductance was governed by the product of ac- tivation and inactivation terms, A,, and B,,. Voltage-clamp analysis revealed the absence of steady-state inactivation at the resting potential (O’Dowd et al., 1988), and B,, was therefore assumed equal to 1 at this voltage. Under the additional assumption that macroscopic activation is much more rapid than inactivation, the declining phase of the current (after 0.6-1.6 msec) reflects only onset of inactivation. TB,Na and the theoretical steady-state ZNa,O were found by fitting this phase of the cur- rent by Equation 7 for each voltage. A power of 3 was chosen for the activation term since the delay in activation of both young and mature INa was similar to that observed in squid axon and other preparations.
ZNa,O (Fig. 2A) was then fitted against voltage with the equation
I i-WI = &J3Na.m( m v - J-L), (12) where &,, is the maximum conductance and AN.,,( k’) is given by Equa- tion 6. The value of &,* in Equation 12 and the values of V, and s in Equation 6 were selected during the fitting procedure. The values of VO and s yielded the function shown in Figure 2B.
The voltage dependence of steady-state inactivation, B,,,, was found by fitting an appropriate function of voltage to the experimental data for young and mature cells (O’Dowd et al., 1988; their Fig. 8C) (Fig. 20). Values of r8,Na were voltage dependent and fitted with a suitable equation (Fig. 2E). r,,,, was chosen to obtain satisfactory fits to the rising phase and peak of the current (Fig. 2C).
Calcium current &,I. IQ was modeled in many respects like I,, (Ba- rish, 1986; Kay and Wong, 1987; Belluzzi and Sacchi, 1989). Young and mature !c,, consisting of high-voltage-activated N- and L-currents, showed partial inactivation during 60 msec voltage-clamp steps. As with the sodium current, inactivation was assumed to be much slower than activation, so IQ,0 could be obtained by fitting the falling phase of the current (after - 10 msec) with the equation
The Journal of Neuroscience, June 1992, 12(6) 2271
A 1 nA
8m
z" 0.5 -
a
D
2- mm
l-
0.1
By this procedure, Zc-,O and initial estimates of TV,,-= were found for each voltage. The power of the activation term was chosen by assuming that the current rises with the time course given by Equation 8.
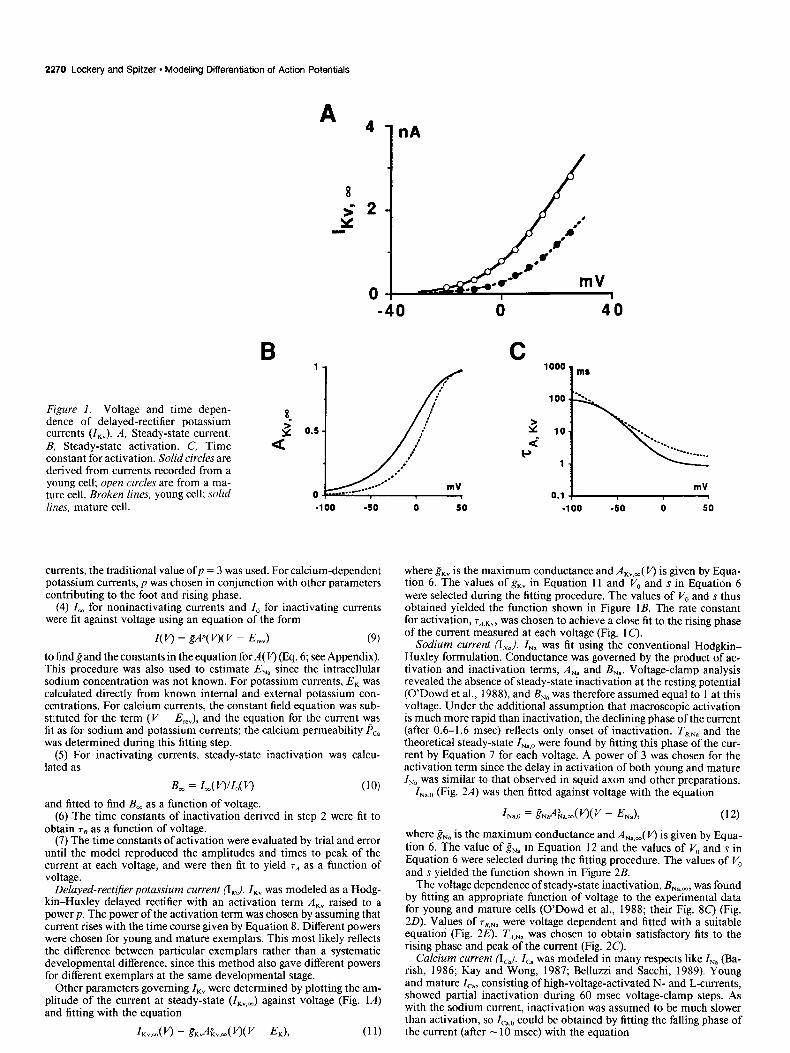
Zc.,O (Fig. 3A) was plotted against voltage and fit with the equation
&a,o( v = ~&&a,,( YK%a, (14)
where p, is the membrane permeability to calcium, Ac,,,( v) is given by Equation 6, and E, is the driving force, given by the constant field equation
E = 4W2{[Ca],e(2YP’RT) - [Cal,} ca ~~{eWF/.QT) - 1) . (15)
Values of pea in Equation 14, and V, and s in Equation 6 were selected during the fitting procedure. The values of VO and s gave the function shown in Figure 3B.
Inactivation was assumed to be absent at rest and voltage dependent -*hen elicited by depolarization. Calcium dependence of inactivation is unlikely since inactivation was similar when calcium was replaced by barium or strontium (A. B. Ribera and N. C. Spitzer, unpublished results), and thus was not considered. A first estimate of &,,, was obtained by assuming that the extent of inactivation was complete by
Figure 2. Voltage and time depen- dence of sodium currents (I,,). A, Steady-state current. The fortuitous similarity of current amplitudes does not reflect the mean developmental in- crease. B, Steady-state activation. C, Time constant for activation. D, Steady- state inactivation. E, Time constant for inactivation. Solid circles are derived from currents recorded from a young cell; open circles are from a mature cell. Broken lines, young cell; solid lines, ma-
0 50 ture cell.
the end of the 60 msec voltage-clamp step, and applying Equation 10. However, intracellular recordings of calcium-dependent action poten- tials in the presence of tetraethylammonium (TEA) to suppress potas- sium currents revealed that the plateau continues to decline in amplitude over periods longer than 60 msec (Holliday and Spitzer, 1990; N. C. Spitzer, unpublished observations). Since the plateau is attributable to I,-, (see below), this indicates that inactivation is not complete by the end of the clamp. The estimate of &, at each voltage was therefore reduced, by assuming that Z, was half’its value at 60 msec, to achieve satisfactory simulation of action potentials recorded in the presence of TEA. Values of BCa,, were plotted as a function of voltage and fitted (Fig. 30). New values of 7B,Ca were chosen such that the model fit the recorded currents; these values were voltage dependent and fitted with a suitable equation (Fig. 3E). &, was chosen to fit the rising phase of the current at each voltage (Fig. 3C).
Calcium accumulation can alter the amplitude and time course of Zc, under voltage clamp by changing the driving force, conductance, and kinetics. This effect was ignored in initial stages of fitting this current, since the change in driving force is expected on theoretical grounds to be small (Hudspeth and Lewis, 1988). After initial fits were obtained, and calcium accumulation parameters were adjusted in connection with I,, (see below), the driving force and activation and inactivation pa- rameters controlling the voltage dependence of activation were refined to correct for small changes in driving force.

2272 Lockery and Spitzer * Modeling Differentiation of Action Potentials
A 1 nA
Figure 3. Voltage and time depen- dence of calcium currents (1,). A, Steady-state current. B, Steady-state ac- tivation. C, Time constant for activa- tion. D, Steady-state inactivation. E, Time constant for inactivation. Solid circles are determined from currents re- corded from a young cell; open circles are from a mature cell. Broken lines, young cell; solid lines, mature cell.
B
O- 0
3
-l-
mV 1
8s (d
a!
D
8m a
m"
mV 0 < -100 -50 0 50
Intracellular calcium accumulation. Representation of calcium dy- namics in the model was required to link ZKc to Ic,. In the absence of data on the time course of submembrane calcium concentration, a sim- ple compartmental model of cytoplasmic calcium accumulation was adopted. Calcium was assumed to be delivered to a thin, well-mixed shell immediately under the membrane and transferred from this shell to an unspecified interior compartment by a first-order process (Beeler and Reuter, 1977). The time course of calcium concentration in the submembrane shell was governed by the equation
dD1 L = R(-IQ) - D([Ca], - lo-‘), dt
where R is a factor converting current to concentration and D is the rate constant for calcium removal. This model represents diffusion, buffering, and sequestration as a single process. The resting internal concentration of calcium in the shell and interior was taken to be lo-’ M (Holliday and Spitzer, 1990). Values ofR (lo-‘) and D (1) were chosen to facilitate fits of voltage-clamp data of ZKc (see below).
Calcium-dependent potassium current &J. IKc in mature cells exhib- ited both an inactivating peak (ZkJ and a sustained plateau (ZKes). The inactivating and noninactivating components appear to be independent since they are activated at different voltages; the peak can be selectively inactivated and is smaller or nonexistent at early stages of development (Ribera and Spitzer, 1987; O’Dowd et al., 1988). Accordingly, these two
40
C 2 ms
s ._____.___._--__-_____-
-. *. - ‘. Pa 1 / \ ‘.
‘. ‘.
**.. --.
m 0 -100 -50 0 50
E
s P
‘O” ms
_._-_.___-._____._________ .- ,/*
mV 0 -100 -50 0 50
components were modeled separately as an inactivating current super- imposed upon a noninactivating current. Both components of ZKc were calcium and voltage dependent in the model. The calcium dependence reflects the demonstrated requirement of calcium influx for both com- ponents of the current (O’Dowd et al., 1988). The voltage dependence reflects the fact that, in voltage-clamp experiments, both components of I,, continue to increase over a range ofvoltages in which I,, decreases (see below). These features of ZKc are similar to those of the currents recorded in rat sympathetic neurons (Belluzzi and Sacchi, 1990).
The nature of the calcium dependence of I,,, was inferred from (1) the detection of substantial I,,, with voltage clamps to -30 mV that elicit little calcium current, and (2) the graded effect of decreasing ex- ternal calcium concentration on the amplitude of the sustained com- ponent of the current when the voltage was stepped to +30 mV in mature cells (O’Dowd et al., 1988; Fig. 5). At -30 mV the change from resting calcium is likely to be small due to the small size of I,-, at this voltage. Therefore, the threshold calcium concentration for acti- vation of the calcium-dependent element must be near the resting level of lo-’ M at this potential, and the relationship between internal calcium concentration and activation of the calcium-dependent element must be steep. However, at +30 mV, where the calcium current is near its maximum, the amplitude of ZKcs depends in a graded way on the external calcium concentration and this dependence saturates only at external concentrations greater than 10e4 M (see Fig. 5). Since increases in [Cal, will increase voltage-dependent calcium entry and accumulation, the

The Journal of Neuroscience, June 1992, 12(6) 2273
A
C 0.50 nA
P
0
-z- 0.25
-*
L!E-
.’ .J”
2
0.0 .P. mV
-40 0 40
E 1 ms’ ’
L’ 0.5
_/
,.--- ,.*’
,:’ ,/
-* mV 0
. ..-*
-100 -50 0 50
D
8 .-- 0.5
F 1000 m*
-----.____. 100 -..*
*. ‘. .-
$* 10
*. ‘. ‘.
Pa *.
‘-.. %. ----W_.
1
0.1 ~ mV
-100 -50 0 50
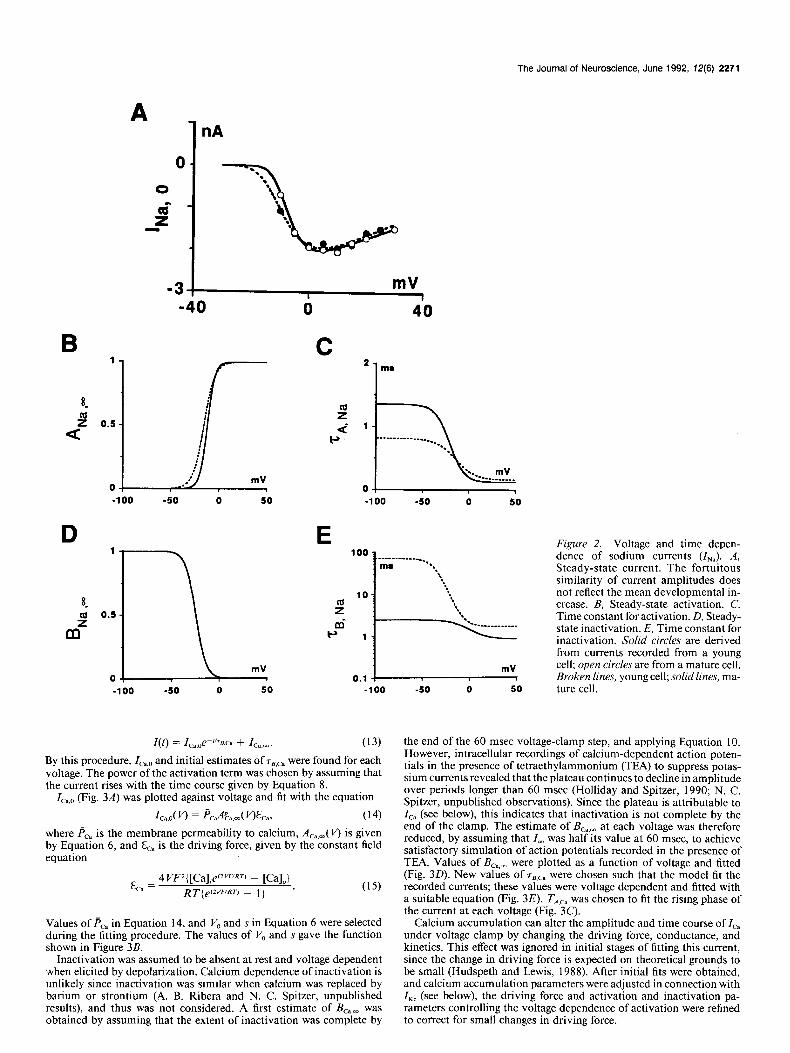
Figure 4. Voltage and time depen- dence of calcium-dependent potassium currents (Z,,). A, Steady-state ZKcr. B, Steady-state activation of ZKcs. C, Peak I,+ D, Steady-state activation of Z,,,. E, Inactivation rate constant of ZKci. F, Time constant for activation of Z,,,. Solid circles are determined from cur- rents recorded from a young cell; open circles are from a mature cell. Broken lines, young cell; solid lines, mature cell.
threshold for activation of the calcium-dependent process was assumed to be higher at +30 mV, and the relationship between [Cal, and acti- vation was taken to be less steep than at -30 mV.
Models of Z,, in other neurons have utilized a kinetic scheme in which activation is produced by transition of the ZKc channel from one or more closed states to one or more open states (Magleby and Pallotta, 1983; Moczydlowski and Latorre, 1983; Hudspeth and Lewis, 1988; Yamada et al., 1989; Gola et al., 1990; Borg-Graham, 1991). The voltage and calcium dependencies of the current are introduced by assuming that the rate constants for transitions between kinetic states of the channel are voltage and calcium dependent. Attempts to adapt this kinetic scheme for Z,, proved inadequate, due to its unusual calcium dependence and substantial delay in activation and inactivation (O’Dowd et al., 1988). We chose instead a more abstract representation of the dynamics of activation of ZKcs and ZKcl. Specifically, steady-state activation of each component of ZKc was assumed to be governed by two independent, voltage-dependent processes, H,( I’) and .Z,( v). Thus,
A Kcs,m( v) = HKc.d V JKcJ,.d V, [W), (17)
&,,A v) = HKcl,mV’VJKci,m( K Ka13. (18) HK,,,( I’) was a purely voltage-dependent factor analogous in form to A,,,( I’) (Eq. 6). .ZK,,-( V, [Cal,) was both voltage and calcium dependent, and served to introduce a sigmoidal dependence of steady-state acti- vation on internal calcium. This function had the form
J,(K [Cal,) = 1
1 + e2W(W-lCal#o(v)) ’ (19)
where 8 represents the calcium threshold for activation of the calcium-
Y
KCi 0 0
0 0
Figure 5. Calcium dependence of ZKc in physiological recordings and in the model. The graph shows the effect of different external calcium concentrations on the peak amplitude of sustained (ZKcr) and inactivating (I,,,) components of mature ZKc. Solid symbols are I,,, and open symbols are Z,,,. Circles are maximum simulated currents; squares are average maximum current from physiological recordings.

2274 Lockery and Spitzer - Modeling Differentiation of Action Potentials
Figure 6. Voltage and time depen- dence of inactivating potassium current (I,). A, Steady-state current. B, Steady- state activation. C, Time constant for activation. D, Steady-state inactiva- tion. E, Time constant for inactivation. Circles are derived from currents re- corded from a late cell. So/id lines are simulated responses from this cell.
dependent process and (r represents the steepness of the relationship. With its sigmoidal form, .ZKc J V, [Cal,) is analogous to the Michaelis- Menten expression for binding of calcium to the element of the channel that governs its calcium dependence. In functional terms, .ZKcm( V, [Cal,) acts as a switch that is on only when the calcium concentratibn exceeds a threshold, and introduces a delay in activation of Z,, in addition to that produced by the power p on the activation term (Eq. 8).
Satisfactory fits to the time course and unusual calcium dependence of ZKc in mature cells (see Figs. 5, 8D) required 0 and Q to be functions of voltage. For simplicity, 0 and (r were monotonic, increasing functions (see Appendix). The general form of calcium dependence of &,,,,( V, [Cal,) was assumed to be the same for young and mature cells. However, in young cells 0 and u were independent of voltage.
Parameters governing the dynamics of I,,, were determined in a man- ner similar to that for I,,. The value of p was assumed to be 1. The amplitude of the steady-state current was plotted against voltage (Fig. 4A) and fitted with the equation
Z,cs,m(v) = i%cP~cs,m( W V - Ed,
where gKes is the maximum conductance and AK,.,( P) is given by Equa- tions 17 and 6. The value of gKcs in Equation 20 and the values of V, and s in Equation 6 were selected during the fitting procedure. The values of V, and s thus obtained yielded the function shown in Figure
E 40
9 2
20
0
ms
mV
-100 -50 0 50
4B. For simplicity the time constant 7R,Kcr was assumed not to be voltage dependent. The model reproduced the experimental dependence of ZKcr on external calcium (Fig. 5).
Z,,, was calculated by subtracting from the total recorded current the ZKcr predicted by the model. ZKcl was modeled as an inverted sodium current, with activation and inactivation terms. Voltage-clamp data showed that the calcium and voltage dependencies of ZKci were quali- tatively similar to the calcium and voltage dependencies of ZKcr (O’Dowd et al., 1988). Calcium dependence for ZKci, .ZKci, was modeled as for Z,,,, with different voltage dependencies of 8 and 0 for the mature current. For simplicity, ZKci was assumed to inactivate fully at depolarized po- tentials. Z,,,,0 was estimated by fitting the declining phase of the sub- tracted current with Equation 7 and plotted as a function of voltage (Fig. 4C).
The full extent of the delay in activation of ZKc, was not achieved with the delay introduced by &,,J V, [Cal,) alone. Attempts to introduce ad- ditional delay by adjusting calcium dynamics (the values of R and D in Eq. 16) to retard calcium accumulation in the submembrane shell were unsuccessful; when calcium accumulation was sufficiently slow, acti- vation of I,,, at -30 mV failed to occur. 7 : activation term A,,,,, was therefore raised to a power of 5. Higher powers seemed implausible biophysically and did not improve fits appreciably. ZKci,O (Fig. 4C) was fitted with the equation

The Journal of Neuroscience, June 1992, 72(6) 2275
Young lNa Mature I Na
Young lea
60
Mature lea
60 O-
ms
Figure 7. Voltage-dependent inward currents. A-D, Simulated and recorded currents (lines and squares, respectively) in response to commands from a holding potential of -90 mV to the indicated voltages. A, Young ZNa. B, Mature Z,,. C, Young Z,,. D, Mature Z,,.
where &, is the maximum conductance and AK,,,,( I’) is given by Equa- tions 18 and 6. The value of gKci in Equation 21 and the values of VO and s in Equation 6 were selected during the fitting procedure. The values of V, and s yielded the function shown in Figure 40.
Analysis of inactivation (Eq. 7) revealed substantial deviation from a single exponential time course in the declining phase of the current, especially at higher voltages (see Fig. 80). As a consequence, a three- state model of inactivation having second-order kinetics was used:
rl rz B _ s, _ s,. r3 r4
Occupancy of each state was obtained using the equations
ds,- dt -
r,B + r,S, - (r, + r&S,,
It was assumed that B = 1 and S, = S, = 0 at the resting potential. Rate constants r,, r2, rj, and rq were chosen at each voltage by trial and error. Satisfactory fits were obtained for the mature cell by assuming rl to be voltage dependent (Fig. 4E) and rz, r3, and r, constant. For the young cell, the same scheme was used for inactivation of Zk=,, which is activated only with steps to more depolarized potentials. The difference was achieved by altering the voltage dependence of rI (Fig. 4E).
The time dependence of activation of I,,, was given by Equation 4. T AK.3 was determined by trial and error to achieve satisfactory fits to the rising phase and peak of the current at each voltage (Fig. 4fl. Si- multaneous adjustment of rA,Kcl, AKc,, and rl with a view to developing smooth, continuous functions of voltage for each allowed further re- finement of fits. So constructed, the model reproduced the observed
dependence of ZKcl on external calcium (Fig. 5). Total ZKc was the sum of ZKcs and Z,,,.
Inactivating potassium current (I&). ZG was also modeled like a so- dium current, for which the conductance was governed by the product of activation and inactivation terms, A,, and B,, respectively. Voltage- clamp analysis revealed the absence of steady-state inactivation at the resting potential (Ribera and Spitzer, 1990) at which B, was thus assumed equal to 1. Macroscopic activation was assumed to be much more rapid than inactivation, so that the declining phase of the current (after 2-4 msec) reflected only the onset of inactivation. TB,& and the theoretical steady-state Za,0 were found by fitting this phase of the cur- rent by Equation I for each voltage. A power of 4 was chosen for the activation term to provide sufficient delay in time to peak. Z,,0 (Fig. 6A) was then fitted against voltage with the equation
where & is the maximum conductance and A,,,( v) is given by Equation 6. The value of& in Equation 26 and the values of VO and s in Equation 6 were selected during the fitting procedure. Values of V, and s yielded the function shown in Figure 6B. Steady-state inactivation, B,. m, was found by fitting an appropriate function- of voltage to the experimental data (Ribera and Snitzer. 1990: their Fin. 4) (Fig. 60). Values of raw. were only weakly voltage’depenhent, and-fitted wyth a suitable equation (Fig. 6E). T,,, was then chosen to obtain satisfactory fits to the rising phase and peak of the current (Fig. 6C).
Computation. Differential equations governing activation, inactiva- tion, and membrane potential were solved numerically using modified Euler integration (Moore and Ramon, 1974; Rush and Larsen, 1978) in which it is assumed that variables change exponentially during each time step in the integration. Simulation of voltage-clamped currents during analysis of voltage-clamp data employed a fixed time step of 0.3 msec (Zc., I,,) or 0.1 msec for more rapidly activated currents (INa, ZKc, I&. Simulation of action potentials employed variable steps with a range of 0.03-l. 13 msec. Critical results were checked with a fixed time step of 0.03 msec, below which no change in the results was seen. Action

2276 Lockery and Spitzer - Modeling Differentiation of Action Potentials
Young I Kv
2 1 nA
1' ms
1.2 1 pM Ca
ms
0 30 E
B 3
Mature I Kv nA
I f-
.I I . ..a . . . - +25
. . . . . . - . . . . -..- c
Do 30
2
1
0
1.2
0
nA Mature I Kc
d 30
p.M Ca
ms
il I I I I 1
30
nA Late I KA
Figure 8. Voltage-dependent outward currents. A-E, Simulated and recorded currents (lines and squares, respectively) in response to commands from a holding potential of -90 mV to the indicated voltages. A, Young ZKv. B, Mature ZKv. C, Young ZKc. D, Mature Z,,. E, Iate Z&. Lower traces in C and D, Time course of intracellular submembrane calcium concentration in the model.
potential duration was measured between the points at which voltage crossed the line V = 0.
lation (1952). Conductance was the product of the maximal conductance and voltage-dependent activation and, when nec- essary, inactivation terms. Current was the product of the con-
Results ductance and driving force. Fits of the currents are shown for three voltages at which the currents are strongly activated (Figs.
Simulation of young and mature action potentials 7, 8). Each family of traces shows data from a single cultured Voltage-dependent currents at young and mature developmental neuron. Exemplars were chosen to reflect typical developmental stages were fitted using conventional Hodgkin-Huxley formu- changes in kinetics but not necessarily in amplitude. Develop-
Young Action Potential A
SO mV
1
C 80.mV
1 . KV
M
150
-2 .
E so- mV
40.
0-r
40.
-80.
The Journal of Neuroscience, June
Mature Action Potential B 60 mV
40 I 0.
ma
. I 30
: fk-
40.
40
1992, f2(6) 2277
D 80 mV
1
F 80 mV
j
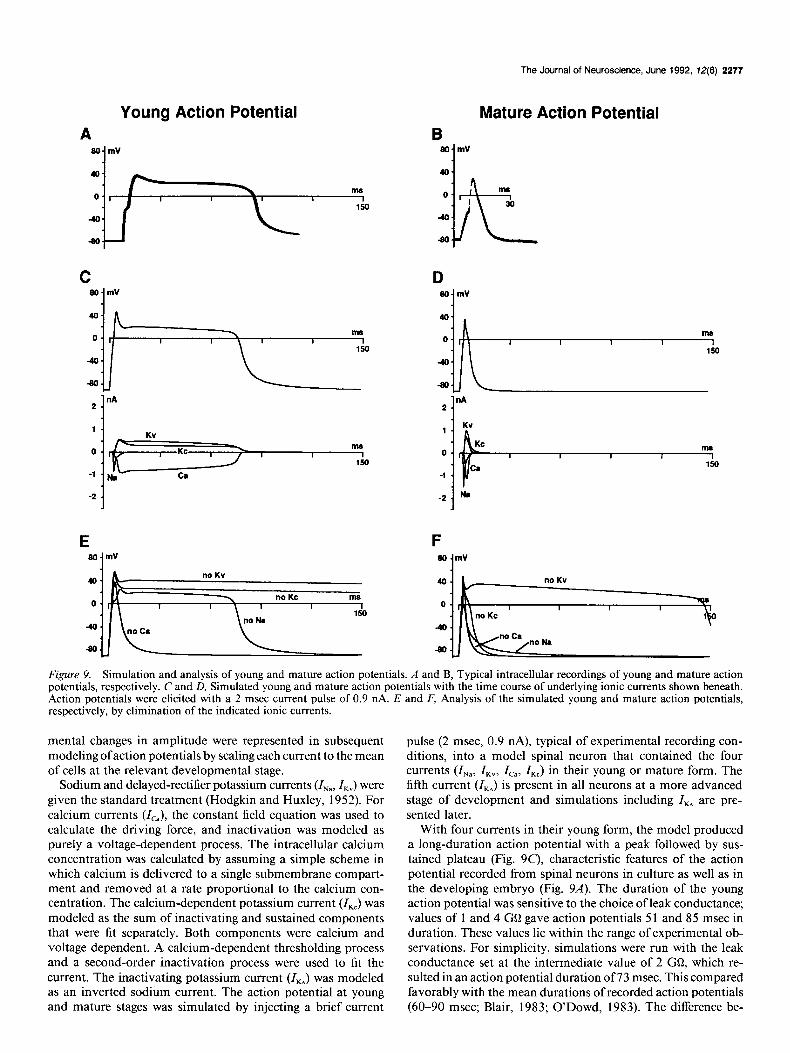
Figure 9. Simulation and analysis of young and mature action potentials. A and B, Typical intracellular recordings of young and mature action potentials, respectively. C and D, Simulated young and mature action potentials with the time course of underlying ionic currents shown beneath. Action uotentials were elicited with a 2 msec current nulse of 0.9 nA. E and F, Analysis of the simulated young and mature action potentials, respectively, by elimination of the indicated ionic currents.
mental changes in amplitude were represented in subsequent modeling of action potentials by scaling each current to the mean of cells at the relevant developmental stage.
Sodium and delayed-rectifier potassium currents (I,,, I,,) were given the standard treatment (Hodgkin and Huxley, 1952). For calcium currents (I,-,), the constant field equation was used to calculate the driving force, and inactivation was modeled as purely a voltage-dependent process. The intracellular calcium concentration was calculated by assuming a simple scheme in which calcium is delivered to a single submembrane compart- ment and removed at a rate proportional to the calcium con- centration. The calcium-dependent potassium current (ZKc) was modeled as the sum of inactivating and sustained components that were fit separately. Both components were calcium and voltage dependent. A calcium-dependent thresholding process and a second-order inactivation process were used to fit the current. The inactivating potassium current (I& was modeled as an inverted sodium current. The action potential at young and mature stages was simulated by injecting a brief current
pulse (2 msec, 0.9 nA), typical of experimental recording con- ditions, into a model spinal neuron that contained the four currents (ZN,,, I,“, I,,, ZKc) in their young or mature form. The fifth current (I& is present in all neurons at a more advanced stage of development and simulations including ZK* are pre- sented later.
With four currents in their young form, the model produced a long-duration action potential with a peak followed by sus- tained plateau (Fig. SC), characteristic features of the action potential recorded from spinal neurons in culture as well as in the developing embryo (Fig. 9A). The duration of the young action potential was sensitive to the choice of leak conductance; values of 1 and 4 GO gave action potentials 5 1 and 85 msec in duration. These values lie within the range of experimental ob- servations. For simplicity, simulations were run with the leak conductance set at the intermediate value of 2 GQ, which re- sulted in an action potential duration of 73 msec. This compared favorably with the mean durations of recorded action potentials (60-90 msec; Blair, 1983; O’Dowd, 1983). The difference be-

2278 Lockery and Spitzer * Modeling Differentiation of Action Potentials
tween the amplitude of the peak and that of the plateau was greater in the simulated action potential than in most recorded action potentials. This may reflect small discrepancies in relative amplitudes of the four currents in the model as compared to the four currents in real cells, since the difference was susceptible to small changes in the scaling factors used for each current (see Materials and Methods).
The mature action potential simulated in a model spinal neu- ron that contained the same four currents in their mature form was much briefer than the young action potential (Fig. 9D), and compared well with recordings of mature action potentials (Fig. 9B). The simulated action potential had a duration of 2.7 msec, as compared with mean recorded action potential durations of 3.3-3.7 msec (Blair, 1983; O’Dowd, 1983). The difference may be the result of small differences in the scaling factors for each current in the model. The duration of the mature action poten- tial was altered by less than 2% by variation in leak conductance over the range of l-4 GQ. The model does not exhibit an af- terhyperpolarization since the resting potential is at E, (Spitzer, 1976).
The satisfactory correspondence between simulated and re- corded action potentials at young and mature stages shows that the four identified currents are sufficient to account for the major characteristics of young and mature action potentials. No ad- ditional currents are required to achieve the amplitude, dura- tion, and waveform characteristic of action potentials in these cultured neurons. Further shortening of the mature action po- tential was achieved in the model by addition of a fifth current, Z,, which is present in a substantial fraction of neurons at this stage (see below). Furthermore, the correspondence between simulated and recorded action potentials establishes the central result that the ensemble of developmental changes in amplitude and kinetics of the four identified currents are sufficient to ac- count for the shortening of the action potential observed be- tween the young and mature stages.
Generation of the young and mature action potentials
Inspection of the time course of each of the four currents during the young and mature simulated action potentials showed how action potentials were generated by the underlying ionic currents in the model (Fig. 9C,D). In the simulated young action poten- tial, ZNa is the first current to activate fully and the first to decay; thus Z,, causes the fast initial rise and peak. As expected, elim- ination of this current in the model reduced the peak (Fig. 9E), but not the plateau, consistent with experimental data indicating that in young neurons action potentials can be elicited in the absence of sodium ions or in the presence of TTX (Spitzer and Lamborghini, 1976; Baccaglini and Spitzer, 1977). Next, the plateau of the action potential is established, and its level set, by the parallel increase of inward I,, and two outward currents, ZKv and I,,. After about 15 msec, these currents are approxi- mately balanced, such that the total inward current is nearly equal to the total outward current; the membrane potential changes very slowly (dV/dt z 0), and a plateau is created. The model showed that I,, is essential for the plateau, since its elim- ination from the model results in a brief action potential (Fig. 9E). Thus, the simulated young action potential, like the re- corded young action potential, is largely calcium dependent. The height of the plateau depends on the balance between sustained inward and outward currents. This was shown by reducing the total outward current through the elimination of either ZKv or ZKc in the model, which resulted in a higher plateau (Fig. 9E).
Termination of the plateau in the model is due to the gradual inactivation of Zc,; the young action potential simulated in the absence of inactivation (B,, = 1) did not repolarize (not shown).
The simulated mature action potential is generated in the model by the sequential activation of ZNa, Z,, and the outward currents Z,, and I,, (Fig. 9D). The peak is determined largely by ZNa, as shown by elimination of this current (Fig. 9fl. Thus, the simulated mature action potential, like the recorded mature action potential, is largely sodium dependent. The slight shoul- der on the falling phase of the simulated mature action potential is due to Z,,. This is suggested by the temporal correspondence between the occurrence of the shoulder and maximum I,,. Elim- ination of I,, in the model removed the shoulder, resulting in a briefer action potential (Fig. 9F) consistent with experimental data (Spitzer and Lamborghini, 1976; Baccaglini and Spitzer, 1977; Spitzer, 1979; Willard, 1980). Repolarization of the action potential is due in part to the action of both Z,, and ZKc, as elimination of either of these currents slows its rate of decay (Fig. 9fl.
The thresholds for initiation of simulated impulses and the effects of holding potential on their amplitudes and durations were evaluated for young and mature action potentials. The threshold for the young action potential lies at - 19 mV with a holding potential of - 90 mV, and more positive depolarizations elicit impulses with the same plateau overshoot and duration. Similarly, holding potentials positive to -90 mV (e.g., -30 mV) have little effect on the duration of the action potential as well as the potential of the plateau component. The initial, sodium-dependent overshoot is lost as ZNa becomes inactivated with depolarized holding potentials. These results agree with intracellular recordings of the long-duration action potentials elicited from depolarized holding potentials, and observations that their duration and amplitude are relatively insensitive to holding potential (Baccaglini and Spitzer, 1977). The threshold for the mature simulated action potential lies at - 13 mV, and depolarized holding potentials (e.g., - 20 mV) produce a loss of excitability of impulses as Z,, is inactivated. Thus, the model also reproduces the threshold behavior of mature action poten- tials (Spitzer, 1976).
Effect of TEA on simulated and recorded action potentials
In physiological recordings, bath application of TEA increases the duration of the young and mature action potential (Baccag- lini and Spitzer, 1977; Willard, 1980; Bixby and Spitzer, 1983). TEA also reduces the amplitude of voltage-clamped ZKv and Z,, (Ribera and Spitzer, 1987, 1990; O’Dowd et al., 1988). The ability of the model to predict changes in action potential du- ration was further tested by simulated bath application of TEA, in which Z,” and ZKc in the model were each reduced. Since the sensitivity of potassium currents to TEA has not been studied quantitatively in voltage-clamp conditions, we examined the effects on action potential duration of a range of decrements, and found the waveform and duration of simulated action po- tentials to be consistent with experimental observations. For example, with ZKy and ZKc each reduced by 33%, the young action potential increased in duration to 254 msec (342%) and the mature action potential to 5 msec (183%; Fig. lOA,B).
Contribution of each current to maturation of the action potential The contributions of differentiation of each current to the de- velopmental changes in the action potential were evaluated by

simulating action potentials in which only one current was al- lowed to differentiate, or in complementary simulations in which all but one current were allowed to differentiate.
Sodium current (I,J. The major developmental change in Z,, is a twofold increase in amplitude; increases in rates of activation and inactivation are small. In theory, the increase in amplitude and rate of activation will increase the amount of inward current and thus could prolong the action potential. The increase in rate of inactivation would have the opposite effect. Simulation of the young action potential with the mature form of Z,, produced action potentials that were only slightly longer than normal, indicating a small but dominant effect of increased amplitude and activation rate (Fig. 11, top panel). Simulation of the mature action potential with Z,, in its young form increased the duration slightly, indicating a small but dominant effect of the slower rate of inactivation. These results show that developmental changes in Z,, have little effect on action potential duration.
Calcium-dependent potassium current (‘I,J. Both components of I,, exhibit developmental changes. I,,,, the early, inactivating component, undergoes an increase in amplitude as well as in- creases in rates of activation and inactivation. The amplitude of ZKC,, the sustained component, becomes larger in response to small or moderate depolarizations. However, rectification of this current with larger depolarizations (not seen at earlier stages) tends to offset the increase in amplitude, so that for steps to +30 mV the current is the same at young and mature stages.
The increase in amplitude of I,,, was expected to have little effect on action potential duration, since inspection of simulated currents underlying the young action potential (Fig. 9C) showed that this component is inactivated before the plateau is estab- lished. By contrast, the increase in amplitude of ZKCs was expected to shorten the action potential by increasing the net outward (repolarizing) current. The duration of the action potential is determined by the length of the plateau, which in turn depends on a sustained balance between inward I,, and the two outward potassium currents, ZKv and I,,. To test these predictions, the young action potential was simulated with ZKC in its mature form (Fig. 11, second panel). The resulting action potential was short- er than the normal young action potential by 13 msec (18%). That this effect was attributable to the change in ZKCs alone was confirmed by simulating the young action potential with only ZKCs in its mature form (not shown).
These results suggest that a portion of the total developmental change in action potential duration can be attributed to ZKC. However, the simulated action potential was still much longer than the normal mature action potential. Thus, a substantial contribution to action potential shortening is made by one or more of the other currents. This conclusion was reinforced by simulation of the mature action potential with ZKC in its young form, which produced an action potential that was longer than normal by 1 msec and thus still largely mature in form.
Calcium current &J. The major developmental change in Z,, is an increase in the extent of inactivation, with a small change in activation rate and no change in amplitude. Inspection of simulated currents underlying the young action potential (Fig. SC) suggests that the duration of the young action potential would be decreased by an increase in inactivation of Z,,. This was tested by simulation of the young action potential with I,, in its mature form, which produced an action potential that was shorter than the normal young action potential by 25 msec (34%; Fig. 11, third panel). Restricting the maturation of Zca to the increase in extent of inactivation shortened the action potential
A 8op
The Journal of Neuroscience, June 1992, f2(6) 2279
Young Action Potential
.I
-40 i i
-80 <. ‘--.-..
B Mature Action Potential
m m I 1
60
Figure 10. Effects of TEA on the duration of simulated young and mature action potentials. Young (A) and mature (B) action potentials were reconstructed in standard saline and in the presence of TEA, re- ducing potassium currents by one-third (broken and solid lines, respec- tively).
by 21 msec (29%), demonstrating that most of the effect of differentiation of I,, is attributable to the change in inactivation. However, even with complete differentiation of I,,, the simu- lated action potential was still much longer than the normal mature action potential. Thus, again a substantial contribution to action potential shortening is made by one or more of the other currents. This was confirmed by simulation of the mature action potential with I,, in its young form, which produced an action potential that was essentially mature.
Delayed-rectifier potassium current (Id. Like other currents, Z,, undergoes several changes during development from the young to mature stage. It shows a 3.5-fold increase in amplitude and a 1.8-fold increase in rate of activation. Either of these changes was expected to decrease the duration of the young action po- tential, since they increase the amount of outward current. Sim- ulating the young action potential with ZKv in its mature form resulted in an action potential 4.5 msec in duration, a reduction of 94%, and thus nearly mature in form (Fig. 11, bottom panel). Most of the effect was attributable to the change in current amplitude, since increasing only this parameter produced a sim- ulated action potential 5 msec in duration, while increasing only the rate of activation produced an action potential that was 46 msec long (not illustrated).
The secondary role of other currents in normal shortening was confirmed by simulation of the mature action potential with Z,, in its young form. The resulting action potential was similar in form to that of young neurons, although somewhat shorter in duration. This is consistent with experimental observations of neurons in which maturation of ZKv is selectively blocked by RNA or protein synthesis inhibitors and the action potential fails to mature (Blair, 1983; O’Dowd, 1983). Inclusion of Z, in simulation of the action potential yields some further shorten- ing, in good agreement with results of expression of Z, following removal of RNA synthesis inhibition (Ribera and Spitzer, 1989) but leaves the action potential young in form. Thus, the model

2280 Lockery and Spitzer - Modeling Differentiation of Action Potentials
.mV
1 mV
1 mV
Figure 11. Contribution of each cur- rent to maturation of the action poten- tial. Solid lines show simulated action potentials in which one current was in its mature form and the others were in their young form (e.g., Young AP, Mu- ture Nu), or complimentary simula- tions in which one current was in its young form while others were in their mature form (e.g., Mature AP, Young Nu). Simulated normal young and ma- ture action potentials (broken lines) are shown in each panel for comparison. Arrows show the effect on action poten- tial duration of the developmental change in the indicated current, and have been omitted where the effect is small.
40 .
-80 . i
Young AP, mature Ca -“....-.. ......... - . . . . . . .
ms
1 mV
ms I I
120
shows that the developmental change in ZKV is the single most important factor in maturation of excitability. Changes in Z,, have the greatest effect in reducing the duration and eliminating the calcium component of the action potential. Furthermore, ZKy is the only current that must differentiate if the action po- tential is to achieve its mature duration.
Sensitivity of action potential duration to change in current amplitude and kinetics
Is the developmental increase in amplitude of ZKV the most ef- fective simply because it is the largest change (O’Dowd et al., 1988>, or because the duration of the young action potential is

The Journal of Neuroscience, June 1992, 72(6) 2261
especially sensitive to the amplitude of this current? To address this question, we simulated young action potentials in which the maximum amplitude of one of the currents was increased or decreased (Fig. 12A). Changes in ZNa had no effect on the duration, since this current is inactivated before the plateau of the young action potential is established. By contrast, strong effects were found for the other three currents, with a decrease in I,, or an increase in either of the potassium currents producing shorter action potentials. The steepness of the relationship be- tween current amplitude and action potential duration provides a measure ofthe sensitivity ofaction potential duration to changes in current amplitude. Comparison of the sensitivity for Z,,, Z,,, and ZKc shows that the young action potential was not especially sensitive to changes in amplitude of ZKv. Similarly, changes in leak conductance strongly affect the duration of the young action Potential (see above). Thus, the change in Z,, amplitude is the most important cause of shortening of the young action potential because the change in amplitude itself is large, and not because the young action potential is particularly sensitive to changes in Z,,.
The sensitivity of the duration of the mature action potential was evaluated in a similar manner, assessing the effect of both increases and decreases of all four currents. Considerable changes in any one of the four currents neither prolonged nor decreased the action potential duration appreciably (Fig. 12B). The du- rations of action potentials recorded from mature neurons have a compact distribution consistent with this finding (Blair, 1983; O’Dowd, 1983), and are rather insensitive to variation in leak conductance.
The duration of the action potential should also be sensitive to changes in kinetics of a given current, in addition to changes in its amplitude. In terms of the Hodgkin-Huxley model of excitability, a change in kinetics implies a change in the voltage dependence of forward or backward rate constants of activation or inactivation. At the level of whole-cell currents, changes in rate constants would appear as changes in voltage dependence of the time constant of activation or inactivation, and also in the voltage dependence of steady-state activation or inactiva- tion. In principle, either amplitude or kinetics could be under the control of a developmental program for action potential shortening. There is ample evidence that covalent or genetic modification of channel proteins can have large effects on volt- age dependence and activation rate (Choquet et al., 1987; Au- gustine and Bezanilla, 1990; Papazian et al., 199 1).
Why has evolution selected the change in amplitude of I,” in favor of a change in kinetics? This issue was addressed in the model by simulating the effect on duration of the young action potential of changes in activation kinetics of Z,,, with the effects of time constant and voltage dependence of activation consid- ered separately. The effect of a change in voltage dependence of the time constant of activation was tested by scaling the time constant by a uniform percentage at each voltage. This analysis showed that decreasing rA,Kv had little effect on action potential duration. Indeed, making activation instantaneous resulted in a longer action potential, 82 msec in duration.
The effect of the voltage dependence of activation was tested in two ways: (1) by shifting V,, the voltage at which the steady- state current is half-activated, and (2) by resealing s, the steep- ness of the voltage dependence (see Eq. 6). Values of V, and s were confined to the range in which I,, was not activated at the resting potential. For the young action potential, shifts in V, toward more hyperpolarized voltages produced action poten-
Young Action B
Potential
INa ‘C,
IK”
lKc
0 , 0 50 100 150 200 250 300 350
Current (%)
60
i
40
20
0
Mature Action Potential P
1’ / /
1’ 1’ -a - ka -a - ka
P P -1, -1,
--A- lKc --A- lKc
0 50 100 150 200 250 300 350
Current (%) Figure 12. Effect of the amplitude of each current on the duration of simulated young (A) and mature (B) action potentials. The indicated ionic currents were increased or decreased by the scaling factor on the abscissa in percent. The circled points show the duration of the action potential with the normal amplitude of each current.
tials that were essentially mature in form and duration (Fig. 13A). For example, when s was unchanged (asterisks), a - 10 mV shift in V, was sufficient to produce a nearly mature action potential. Smaller shifts were sufficient if the steepness of the voltage dependence of I,, was reduced by increasing s by factors of 1.5-2.0. These results show that the normal shortening of the young action potential could be achieved by changes in acti- vation kinetics of I,,, although shortening in fact normally re- sults from an increase in current amplitude.
We also considered the effect of changes in kinetics on the duration of the mature action potential (Fig. 13B). Shifts in V, toward more depolarized potentials produced substantially lon- ger action potentials. When s was unchanged (asterisks), a +30 mV shift in V, was necessary to produce an action potential that had nearly the duration of the young action potential. However, shifts of + 10 mV or less had little effect on action potential duration. This result indicates that the mature action potential is tolerant to substantial variability in the voltage of half-acti- vation. Tolerance was increased by increasing s, but drastically

2282 Lockety and Spitzer * Modeling Differentiation of Action Potentials
A A Mature and Late Action Potential
1501 Young Action Potential
s !z s .- 5 0’
loo-
50 -
n-r Y
+0.25
-0.50 -1.00 --cl.50 e2.00
” I
-40 -;o 40 -110 ; lb 2b 3:
Change in V,of I, (mv)
B Mature Action Potential
-e-O.25
ao.50 *1.00 41.50 +2.00
-40 -20 0 20 40 60 80 100
Change in V. of I, (mV) Figure 13. Effect of changes in kinetics of the delayed rectifier current (I,J on the duration of young (A) and mature (B) action potentials. Kinetics were altered by changing the voltage dependence of activation, given by AK,,,(V) = l/( 1 + Pm v’zs). Action potentials were simulated in which V,,, the voltage at which the current was half-activated, was increased or decreased by the number of millivolts plotted on the ab- scissa. The effect of V, was examined for five different values of (Y, a scaling factor that increased or decreased the range over which the current was partially activated. Each curve shows the duration of sim- ulated action potentials for a single value of a, as shown in the key. The circled points show the duration of the simulated action potential with kinetics unaltered, that is, no change in V, and 01 = 1.0.
reduced by decreasing s. Tolerance ensures consistent action potential phenotypes in the face of variability in Z,, channel function that might result from genetic or posttranslational dif- ferences among individual neurons.
Late-stage action potentials and repetitivejring At the late developmental stage, 48 h after closure of the neural tube, Z,, is unchanged but all spinal neurons now express an
B 80
-80
C 80
40
0
-40
-80
mV
Mature
mV Late
90
r
8O.mV
-80.'
80'm'J
40'
0 90
-40
-80 r
Figure 14. The effect on action potential duration and repetitive firing of late-stage changes in ionic currents: the appearance of IK* and a decrease in the amplitude of I,,. A, Simulation of mature and late-stage action potentials (broken and solid lines, respectively) in response to a 2 msec pulse of injected current (0.9 nA; bar). B, At the mature stage, cells exhibit repetitive firing in response to a 90 msec pulse of injected current (0.475 nA, simulation; 0.47 nA, recording; bars). The simulated response is shown on the left, and a typical intracellular recording is shown at the same scale on the right. C, At the late-stage cells have lost the ability to fire repetitively in response to a 90 msec pulse of injected current (0.475 nA, simulation; 0.50 nA, recording; bars). The simulated response is shown on the left, and a typical intracellular recording is shown at the same scale on the right.
inactivating potassium A current (I,,). The amplitude of Z,, has decreased by 50%, since a major source of this current-a group of proximal neurites-is located farther from the soma by this time (Kidokoro and Sand, 1989). These changes in ionic current parallel a further shortening of the action potential to 1.3 msec,

The Journal of Neuroscience, June 1992, 12(6) 2263
and the loss of repetitive firing to sustained current pulses (Ri- bera and Spitzer, 1990).
To determine whether the late changes in ionic current ac- count for the change in the mature action potential, we simulated a mature action potential that contained both I, and the late form of I,,, assuming I,, and I,, were unchanged. The duration of the simulated late action potential was shorter than the sim- ulated mature action potential, in accord with the additional shortening of the recorded action potential at this stage (Fig. 14A). To test the ability ofthe model to produce repetitive firing, sustained current pulses were applied in simulation of action potentials at the mature and late stages (90 msec, 475 nA; Fig. 14B,C). At the mature stage, the model produced a series of heavily damped action potentials, in agreement with many re- cordings under similar conditions (Ribera and Spitzer, 1990). With addition of the late developmental changes to the model, repetitive firing was eliminated. In simulations in which either Z, was added or Z,, was decreased (but not both), the model retained some of its ability to fire repetitively. These results show that the late changes in ionic current are consistent with observed changes in excitability of late-stage spinal neurons. A similar balance of sodium and potassium currents prevents re- petitive firing in amphibian amacrine cells (Eliasof et al., 1987).
Discussion Young and mature action potentials These results demonstrate that the identified currents are suf- ficient to account for the duration, waveform, ionic dependence, and repetitive firing of the action potential of amphibian spinal neurons at young, mature, and late stages of development. A calcium-dependent chloride conductance has recently been identified in these neurons (Hussy, 199 1). The results suggest that this current does not contribute significantly to individual action potentials, although it may have a role in regulating re- petitive firing to sustained current injection since it appears to be comparatively slowly activated.
Ionic basis of maturation of the action potential
Simulation of the young action potential with I,, in its mature form demonstrated that the change in this current is the most important factor in maturation of the action potential. Z,, ex- hibits a developmental increase in both amplitude and rate of activation. Simulations show that the more important factor is the increase in amplitude, since simulation of the young action potential with only the activation rate in its mature form has a relatively small effect on action potential duration. Furthermore, the effect of the change in amplitude of Z,, is due to the change in amplitude per se, and not to a particular sensitivity of the young action potential to changes in ZKV. The model shows that changes in amplitude of ZKc or I,,, comparable to those observed for ZKV, would be as effective in shortening the action potential as the changes in I,,. Since the experimentally observed changes in these two currents are far more modest, the pivotal role can be assigned to I,,.
Changes in amplitude or kinetics of other currents have de- tectable effects in simulations, but these are secondary to the large change in Z,, that alone can account for 97% of the short- ening of the simulated action potential. A large effect of one developmental change does not necessarily rule out a substantial contribution from many smaller effects acting synergistically. However, this possibility is excluded by simulations in which the mature action potential was calculated with only one current
in its young form. By this measure, too, the effect of the change in Z,, is clearly dominant. The model thus shows that the change in ZKV in Xenopus is both necessary and sufficient for shortening of the simulated action potential. The present simulations con- firm and extend those of the model of Barish (1986) who showed that the developmental changes in Z,, in cultured Ambystoma spinal neurons were sufficient to account for shortening of the action potential from 4 to 1 msec in duration.
Developmental strategies in action potential maturation
The model shows that I,, is not uniquely qualified to achieve the shortening of action potential duration. This raises the ques- tion why I,, is given the lead in development. The utility of calcium as a second messenger may have precluded substantial reduction in amplitude of this current in the transition from young to mature stage. Indeed, calcium influx plays a critical role in early development of Xenopus spinal neurons. These cells exhibit spontaneous transient elevations of intracellular calcium at early stages of development in culture, which require influx through voltage-dependent calcium channels to trigger release from intracellular stores (Holliday and Spitzer, 1990; Holliday et al., 1991). Neurite elongation and developmental expression of neurotransmitter are altered when calcium influx is suppressed. Furthermore, normal maturation of activation of I,, is arrested, through failure to activate protein kinase C (De- sarmenien and Spitzer, 199 1).
Other developing systems exhibit changes in various potas- sium currents, including I,,, Z,, and I,, (Bader et al., 1985; Salkoff, 1985; Krieger and Sears, 1988; Pettigrew et al., 1988; Aguayo, 1989; Nerbonne and Gurney, 1989; Fuchs and Soko- lowski, 1990 McCobb et al., 1990) but there appears to be no system in which total I,, is developmentally decreased. A small increase in Zc. is recorded from Ambystoma spinal neurons (Ba- rish, 1986). A decrease in low-voltage-activated I,, is compen- sated by an increase in high-voltage-activated current (McCobb et al., 1989). It appears to be a general rule that the action potential is regulated by developmental changes in potassium rather than calcium currents. Nonetheless, within the class of potassium currents any current can be expected to exhibit de- velopmental changes.
Scope and limitations of the model
The model was designed to fit whole-cell voltage-clamp data from cultured amphibian spinal neurons. After fitting param- eters governing the voltage and calcium dependence of ionic currents, the amplitude of each current was scaled to match the mean determined from many different neurons, and the result- ing model thereafter contained no free parameters. Thus, the ability of the model to reproduce characteristic young and ma- ture action potentials, as well as damped repetitive firing seen in some recordings, is a direct consequence of its ability to reproduce voltage-clamp data. No further parameter adjust- ments were required or allowed.
The model’s predictive capacity has several limitations, how- ever. First, voltage-clamp data were obtained with commands no longer than 60 msec in duration. Since some time constants in the model are substantially longer (e.g., the time constant for inactivation of I,,), the reliability of the model’s prediction of voltage trajectories over hundreds of milliseconds is untested. This potential problem could be corrected by obtaining data using longer voltage commands.
A second limitation of the model lies in the mechanism of

2284 Lockery and Spitzer + Modeling Differentiation of Action Potentials
calcium accumulation. The real time course of the calcium con- centration in the submembrane compartment is not yet known, although optical measurements of free cytosolic calcium are promising (Hemandez-Cruz et al., 1990; Holliday et al., 199 1). A simple first-order model of calcium removal from the region immediately beneath the membrane was used, since this in- volved the smallest number of unsupported assumptions. This scheme almost certainly errs in prediction of the time course of submembrane calcium. The time course of ZKc may thus be poorly defined at voltages and times for which no experimental data are available. Errors in calculating ZKc could have affected the ability of the model to produce undamped repetitive firing recorded in some neurons in response to sustained depolarizing current pulses.
The simple representation of calcium dynamics may also have contributed to the difficulty of fitting I,,, which required a cal- cium-dependent process that was itself voltage dependent in order to fit a calcium-dependent current activated at voltage- clamp levels yielding little I,,. However, we were unable to achieve a simple formulation of calcium dynamics, based on calcium diffusion and buffering, that would satisfy the unusual properties of this current. Recent evidence suggests that calci- um-dependent release from internal stores is a major contrib- utor to cytosolic calcium concentration (Holliday et al., 199 1). It will be important in the future to incorporate this process in the model, since it could cause large increases in submembrane calcium at low voltages.
Conjirmation of the model
These results emphasize the usefulness of Hodgkin-Huxley equations in determining specific contributions to action po- tential shortening of a range of underlying biophysical changes. Using this approach, we have identified one of these changes, the increase in amplitude of I,,, as the single most important developmental alteration. However, ultimate demonstration of the role of Z,, will require analysis of the action potential in neurons in which the developmental progression of individual ionic currents has been manipulated experimentally. Specifi- cally, it will be necessary to produce neurons that express the mature form of one ionic current and the young form of all the others, and neurons that express the young form of one ionic current and the mature form of the others. The recent cloning of potassium channel genes (Rudy, 1988; Jan and Jan, 1989; Ribera, 1990) suggests that this objective may be met in the near future.
Appendix
Young I,,
1,” = fK”&” A:“( v - Ed,
f,” = 0.41,
EK” = 19.78 nS,
E, = -90.00 mV,
Mature I,,
I,, =f~v&vA:v(V - &A
fKv = 0.67,
gKv = 36.41 nS,
E, = -90.00 mV,
103.25 7A.K” = 1 + e(Y+66.72)/13.60 + 0.87.
Young I,
zi-4, = fNa&AfsYa( v - J%a),
f,, = 0.92,
gt-3, - = 29.62 nS,
E,, = 75.48 mV,
1 - 0.20 rA,Na = 0.82 1 + ecV+ 14.64)/10.41 + 0.20 1 )
1 - 0.02 78. Na = 71.06 1 + e(Y+35.52)/7.03 + 0.02 1 .
Mature I,
I,, =fNa&a4LAa(V - ~%a), fNa = 1.91,
g,a - = 24.42 nS,
E,, = 90.00 mV,
= 1.36 1 - 0.09
~A.Na 1 + e(v+ZLo8)/7.9, + 0.09 I
)
Young I,
I,, = fcaPca A&Bc,Eca,
fca = 0.85,
PC, = 0.42, &v(V = 1
(1 + e(*3.78- V)/8.80)0.34 ’
470.10 7A.K” = 1 + ,(v+1,1.68)121.39 + 1.47.

The Journal of Neuroscience, June 1992, f2(6) 2285
Mature I,
Zca = fca~caAh&aL,
f,, = 0.80,
PC, = 0.38,
AA,,(V) = l 1 + &1.73-W7.48 ’
7A,Ca = 0.84 1 ’
&AI/) = 1 : ,v~;5,,,, + 0.23, TTdca
= 101.52 C 1 - 0.69 (1 + e(v+o.07)/o.77) + 0.69 1
Young I,
ZKC = z,, + z,,,.
Noninactivating component.
Z KCS = fKCS~,,,AKC,(V - Ed,
f,,, = 0.65,
g,cs - = 4.50 nS,
E, = -90.00 mV,
A Kcs,oa( v) = ffKcs,d OLm( K Ed,),
~KC%rn(V = 1
1 + e-(v+8.01)/13.84 ’
8 KCS = 1.00001’10-7,
*Kcr = 1.00.10~‘3,
TA. I&s = 4.50. Inactivating component.
I,, = f,,,&c,AL(V - EJ,
f,,, = 1.38,
gK,l - = 15.00 nS,
E, = -90.00 mV,
&l,ca(V = ~K,,,dWK,,,&T [Cal,),
B,,i = 1 .oooo 1.1 o-7,
UKCl = 1 .oo. 10-13,
1 - 0.0064
TA,K~~ = 208.59 [ + 1 + e(48.*cl+Y),12.39
0.0064 1 2
0.50 r, = 1 + eU6.34-w2.42 ’ rz = 1.5,
r, = 0.1, r, = 0.00001. Mature I,
ZKC = ZKC, + ZKCl.
Noninactivating component.
1,s = fKcr&cs&s(~ - EK),
f,,, = 0.62,
g,cs - = 4.36 nS,
E, = -90.00 mV,
A kA v) = ffKcA v)&,,,( V, Kal,),
HKcs,cJ v) = 1
1 + e-~Y+26.96,/4.79 ’
2.62.10’ (1 + e(loo-v)/3*.9s 8 1 I
’
flKCS = [email protected] v- 10.27)
T,+Kcs = 4.00.
Znactivating component.
Z,c, =f&LGcSI/- - Ed,
fKct = 0.56,
&, = 40.00 nS,
E, = -90.00 mV,
A Krl,m( v) = ffKc& VJKc,,,( V, [Cal,),
ffKci,m(q = 1 1 + e-(28.lI+V)/S.ZS ’ Jw-(~ [cm = 1 + e*~o-,c,,.,, >
B,,; = l.OO.lO-’ 1 + [
3.86.10’ (1 + e(99.56-v)/30.96)8 1 ’ UKCl = lo(o.lov-ll 00) ,
1 - 0.27
TA, KCI = 1.82 1 + eW3.28)/10.48
+ 0.27 1 ,

2288 Lockery and Spitzer * Modeling Differentiation of Action Potentials
0.55 Desarmenien MC, Spitzer NC (199 1) Role of calcium and protein Y, = 1 + e--(4.88+Y)/12.29 ’ r, = 1.5, kinase C in development of the delayed rectifier potassium current
in Xenopus spinal neurons. Neuron 7:797-805. r, = 0.1, r4 = 0.00001. Eliasof S, Barnes S, Werblin F (1987) The interaction of ionic currents
mediating single spike activity in retinal amacrine cells of the tiger
Late I KA salamander. J Neurosci 7:35 12-3524. Fuchs P, Sokolowski B (1990) The acquisition of Ca-activated potas-
sium currents by cochlear hair cells of the chick. Proc R Sot Lond lBiol1 241:122-126.
fKA = 1.52, Gala M, Ducreux C, Chagneux H (1990) Ca2+-activated K+ current involvement in neuronal function revealed by in situ single-channel
gKA = 8.12 nS, analysis in Helix neurones. J Physiol (Lond) 420:73-109.
Hagiwara S, Byerly L (198 1) Calcium channel. Annu Rev Neurosci
E, = -90.00 mV, 469-125. Hemandez-Cruz A. Sala F. Adams PR (1990) Subcellular calcium
1 transients visualized by confocal microscopy’ in a voltage-clamped
&,cm(V) = vertebrate neuron. Science 247:858-862. 1 + e-(41.24+ vy27.m ’ Hodgkin AL, Huxley AF (1952) A quantitative description of mem-
[
1 - 0.13 1 brane current and its application to conduction and excitation in
7AKA = 3.75 1 + ec”+ 18.73)/X.81 + 0.13 nerve. J Physiol (Lond) 117:500-544. ) Hodgkin AL, Katz B (1949) The effect of sodium ions on the electrical activity of the giant axon of the squid. J Physiol (Lond) 108:37-77.
B,,cn(V) = 1 Holliday J, Spitzer NC (1990) Spontaneous calcium influx and its
1 + eo*,92+ V)18.95 ’ roles in differentiation of spinal neurons in culture. Dev Biol 14 1: 13- 23.
Holliday J, Adams RJ, Sejnowski TJ, Spitzer NC (199 1) Calcium- ,rB,KA = 6.94
1 - 1.89 1 + e(zo.ls-Y)/6.88 + 1.89 1 . induced release of calcium regulates differentiation of cultured spinal
neurons. Neuron 7~787-796. Hudspeth AJ, Lewis RS (1988) Kinetic analysis of voltage- and ion-
dependent conductances in saccular hair cells of the bull frog Rana catesbiana. J Phvsiol (Land) 400:237-274.
References Aguayo LG (1989) Post-natal development of K+ currents studied in
isolated rat pineal cells. J Physiol (Lond) 414:283-300. Augustine GK, Bezanilla F (1990) Phosphorylation modulates potas-
sium conductance and gating current of perfused giant axons of squid. J Gen Physiol 95:245-27 1.
Baccaglini PI, Spitzer NC (1977) Developmental changes in the inward current of the action potential of Rohon-Beard neurones. J Physiol (Lond) 27 1:93-l 17.
Bader CR, Bertrand D, Dupin E (1985) Voltage-dependent potassium currents in developing neurones from quail mesencephalic neural crest. J Physiol (Lond) 366: 129-l 5 1.
Barish ME (1986) Differentiation of voltage-gated potassium current and modulation ofexcitability in cultured amphibian spinal neurones. J Physiol (Lond) 3751229-250.
Beeler GW, Reuter H (1977) Reconstruction of the action potential of ventricular myocardial fibres. J Physiol (Lond) 268: 177-2 10.
Belluzzi 0. Sacchi 0 (1989) Calcium currents in the normal adult rat sympathetic neuron& J Physiol (Lond) 4 12:493-5 12.
Belluzzi 0, Sacchi 0 (1990) The calcium-dependent potassium con- ductance in rat sympathetic neurones. J Physiol (Lond) 422:561-583.
Bixby JL, Spitzer NC (1983) Enkephalin reduces calcium action po- tentials in Rohon-Beard neurons in viva. J Neurosci 3: 10 14-l 0 18.
Blair LAC (1983) The timing of protein synthesis required for the development of the sodium action potential in embryonic spinal neu- rons. J Neurosci 3:1430-1436.
Borg-Graham LJ (199 1) Modelling the non-linear conductances of excitable membranes. In: Cellular neurobiology: a practical approach (Wheal H, Chad J, eds), pp 247-275. Oxford: IRL/Oxford UP.
Byrne JH (1980a) Analysis ofionic conductance mechanisms in motor cells mediating inking behavior in Aplysia calzjimzica. J Neurophysiol 43:630-650.
Byrne JH (1980b) Quantitative aspects of ionic conductance mecha- nisms contributing to firing pattern of motor cells mediating inking behavior in Aplysia calijhica. J Neurophysiol43:65 l-668.
Choquet D, Sarthou P, Primi D, Cazenave PA, Kom H (1987) Cyclic AMP-modulated potassium channels in murine B cells and their pre- cursors. Science 235:1211-1214.
Connor JA, Stevens CF (197 1 a) Voltage clamp studies of a transient outward membrane current in gastropod neural somata. J Physiol (Lond) 213:21-30.
Connor JA, Stevens CF (197 1 b) Prediction of repetitive firing behav- iour from voltage clamp data on an isolated neurone soma. J Physiol (Lond) 213:3 l-53.
Hussy N (199 1) Developmental change in calcium-activated chloride current during the differentiation of Xenopus spinal neurons in culture. Dev Biol 147:225-238.
Jan LY, Jan YN (1989) Voltage-sensitive ion channels. Cell 56: 13- 25.
Kay A, Wong RKS (1987) Calcium current activation kinetics in isolated pyramidal neurones of the CA1 region of the mature guinea- pig hippocampus. J Physiol (Lond) 392:603-6 16.
Kidokoro Y, Sand 0 (1989) Action potentials and sodium inward currents of developing neurons in Xenopus nerve-muscle cultures. Neurosci Res 6: 191-208.
Krieger C, Sears TA (1988) The development of voltage-dependent ionic conductances in murine spinal cord neurones in culture. Can J Physiol Pharmacol 66: 1328-l 336.
Magleby KL, Pallotta BS (1983) Calcium dependence of open and shut interval distributions from calcium-activated potassium chan- nels in cultured rat muscle. J Physiol (Lond) 344:585-604.
McCobb DP, Best PM, Beam KG (1989) Development alters the expression of calcium current in chick limb motoneurons. Neuron 2: 1633-1643.
McCobb DP, Best PM, Beam KG (1990) The differentiation of ex- citability in embryonic chick limb motoneurons. J Neurosci 10:2974- 2984.
Moczydlowski E, Latorre R (1983) Gating kinetics of Ca2+-activated K+ channels from rat muscle incorporated into planar lipid bilayers. J Gen Physiol 82:5 1 l-542.
Moore JW, Ramon F (1974) On numerical integration of the Hodgkin and Huxley equations for a membrane action potential. J Theor Biol 45~249-273.
Nerbonne JM, Gurney AM (1989) Development of excitable mem- brane properties in mammalian sympathetic neurons. J Neurosci 9: 3272-3286.
O’Dowd DK (1983) RNA synthesis dependence of action potential development in spinal cord neurones. Nature 303:6 19-62 1.
O’Dowd DK, Ribera AB, Spitzer NC (1988) Development of voltage- dependent calcium, sodium and potassium currents in Xenopus spi- nal neurons. J Neurosci 8:792-805.
Papazian DM, Timpe LC, Jan YN, Jan LY (199 1) Alteration of volt- age-dependence of Shaker potassium channel by mutations in the S4 sequence. Nature 349:305-3 10.
Pettigrew AG, Crepe1 F, Krupa M (1988) Development of ionic con- ductances in neurons of the inferior olive in the rat: an in vitro study. Proc R Sot Lond [Biol] 234: 199-2 18.
Ribera AB (1990) A potassium channel gene is expressed at neural induction. Neuron 5:69 l-70 1.

The Journal of Neuroscience, June 1992, f2(6) 2267
Ribera AB, Spitzer NC (1987) Both barium and calcium activate neuronal potassium currents. Proc Nat1 Acad Sci USA 84:6577-658 1.
Ribera AB, Spitzer NC (1989) A critical period of transcription re- quired for differentiation of the action potential of spinal neurons. Neuron 2:1055-1062.
Ribera AB, Spitzer NC (1990) Differentiation of I,, in amphibian spinal neurons. J Neurosci 10: 1886-l 89 1.
Rudy B (1988) Diversity and ubiquity of K channels. Neuroscience 25~729-750.
Rush S, Larsen H (1978) A practical algorithm for solving dynamic membrane equations. IEEE Trans Biomed Engin 253389-392.
Salkoff L (1985) Develonment of ion channels in the flieht muscle of Drosoph&z. J Physiol (Paris) 80:275-282.
Segev I, Fleshman JW, Burke RE (1989) Compartmental models of complex neurons. In: Methods in neuronal modeling (Koch C, Segev I, eds), pp 63-96. Cambridge, MA: MIT Press.
Spitzer NC (1976) The ionic basis of the resting potential and a slow
depolarizing response in Rohon-Beard neurones of Xenopus tadpoles. J Physiol (Lond) 255:105-135.
Spitzer NC (1979) Low pH selectively blocks calcium action potentials in amphibian neurons developing in culture. Brain Res 16 1:555-559.
Spitzer NC (1988) Reconstruction of action potentials of embryonic spinal neurons from whole cell voltage clamped currents. Biophys J 53:258a.
Spitzer NC, Lamborghini JE (1976) The development of the action potential mechanism of amphibian neurons isolated in cell culture. Proc Nat1 Acad Sci USA 73:1641-1645.
Willard AL (1980) Electrical excitability of outgrowing neurites of embryonic neurones in cultures of dissociated neural plate of Xenopus luevis. J Physiol (Lond) 301:115-128.
Yamada WM, Koch C, Adams PR (1989) Multiple channels and calcium dynamics. In: Methods in neuronal modeling (Koch C, Segev I, eds), pp 97-133. Cambridge, MA: MIT Press.