Embed Size (px)
Citation preview

1
Reconstructing the Population History of Puerto Rico by means of mtDNA
Phylogeographic Analysis
Juan C. Martínez-Cruzado1, Gladys Toro-Labrador1, Jorge Viera-Vera1, Michelle Y. Rivera-
Vega1,2, Jennifer Startek1, Magda Latorre-Esteves1,3, Alicia Román-Colón1,4, Rebecca Rivera-
Torres1,5, Iris Y. Navarro-Millán1,2, Enid Gómez-Sánchez1, Héctor Y. Caro-González1,6, and
Patricia Valencia-Rivera1,7
1Department of Biology, University of Puerto Rico at Mayagüez, Mayagüez, PR 00680; 2Escuela
de Medicina, Universidad Autónoma de Guadalajara, Guadalajara, Jalisco, CP45110, MÉXICO;
3Department of Pathology, Harvard Medical School, Harvard University, Boston, MA 02115;
4Medical Sciences Campus, University of Puerto Rico, San Juan, PR 00936; 5Department of
Comparative Pathology, University of California at Davis, Davis, CA 95616; 6Department of
Biological Sciences, Stanford University, Stanford, CA 94305; 7Department of Cell Biology,
Harvard Medical School, Harvard University, Boston, MA 02115
Total number of pages: 82
Abbreviated title: Puerto Rico mtDNA phylogeography
Key words: mtDNA haplogroups; Taínos; principal component analysis

2
Address for correspondence: Dr. Juan C. Martínez-Cruzado, Department of Biology, University
of Puerto Rico at Mayagüez, PO Box 9012, Mayagüez, Puerto Rico 00681-9012, USA. Tel:
(787) 832-4040 X-3357, 3751, 2405. Fax: (787) 265-3837. E-mail: [email protected]
Grant sponsorship: NSF Physical Anthropology Program grant SBR-9904252 to JCMC.
3
ABSTRACT
The haplogroup identities of 800 mtDNAs randomly and systematically selected to be
representative of the population of Puerto Rico were determined by AFLP, revealing maternal
ancestries in this highly mixed population of 61.3% Amerindian, 27.2% Sub-Saharan African,
and 11.5% West Eurasian. West Eurasian frequencies were low in all 28 municipalities sampled
and displayed no geographic patterns. Thus, a statistically significant negative correlation was
observed between the Amerindian and African frequencies of the municipalities. In addition, a
statistically highly significant geographic pattern was observed for Amerindian and African
mtDNAs. In a scenario in which Amerindian mtDNAs prevailed on either side of longitude
66o16' W, Amerindian mtDNAs were more frequent west of longitude 66o16' W than east of it,
and the opposite was true for African mtDNAs. Haplogroup A had the highest frequency among
Amerindian samples (52.4%), suggesting its predominance among the native Taínos. Principal
component analysis showed that the Sub-Saharan African fraction had a strong affinity to West
Africans. In addition, the magnitudes of the Senegambian and Gulf of Guinea components in
Puerto Rico were in between of those of Cape Verde and São Tomé. Furthermore, the West
Eurasian component did not conform to European haplogroup frequencies. HVR-I sequences of
haplogroup U samples revealed a strong North African influence among West Eurasian mtDNAs
and a new Sub-Saharan African clade.

4
Recent technical advances have facilitated the discovery of genetic polymorphisms in the
human population, many of which are useful as markers for prehistorical migrations that gave
rise to continental and regional populations. Continental-population histories have been
reconstructed using Y-chromosome markers, which are paternally inherited (Hurles et al., 1998;
Rosser et al., 2000; Bamshad et al., 2001; Hammer et al., 2001; Karafet et al., 2001; Kayser et
al., 2001; Malaspina et al., 2001; Underhill et al., 2001; Bortolini et al., 2002, 2003; Cruciani et
al., 2002; Lell et al., 2002; Pereira et al., 2002; Semino et al., 2002; Zerjal et al., 2002, 2003;
Zegura et al., 2004), and mtDNA markers, which are inherited maternally (Merriwether and
Ferrell, 1996; Comas et al., 1998; Starikovskaya et al., 1998; Richards et al., 2000, 2002; Forster
et al., 2001; Kaestle and Smith, 2001; Malhi et al., 2001; Torroni et al., 2001a,b; Keyeux et al.,
2002; Oota et al., 2002; Salas et al., 2002; Schurr and Wallace, 2002; Yao et al., 2002a,b; Kong
et al., 2003), usually finding remarkable differences in sex migration histories.
In this study, we developed a hierarchical strategy that makes use of haplogroup-defining
mtDNA restriction markers to identify maternal biological ancestries in a sample set randomly
and systematically selected to be representative of the Puerto Rico population, a mixed
Caribbean population of three principal components: Amerindian, Sub-Saharan African, and
West Eurasian. With some notable exceptions, most haplogroups are regarded as being
continent-specific. Thus, determining the haplogroup to which a mtDNA belongs usually
identifies the mtDNA biological ancestry. The HVR-I sequence was used when biological
ancestry could not be determined through restriction marker analysis.
The biological ancestries of a mixed people have implications in their population genetics
and thus in public health. In terms of mtDNA ancestry, studies on European and North
American populations have related particular West Eurasian haplogroups to higher frequencies

5
of some diseases such as Alzheimer’s (Hutchin and Cortopassi, 1995), Leber Hereditary Optic
Neuropathy (Johns and Berman, 1991; Brown et al., 1997; Hofmann et al., 1997; Lamminen et
al., 1997; Torroni et al., 1997; Howell et al., 2003), Wolfram Syndrome and Sudden Infant Death
Syndrome (Hoffman et al., 1997), and of some conditions such as asthenozoospermia and
nonasthenozoospermia (Ruiz-Pesini et al., 2000). Furthermore, it has been shown that the
+10394 DdeI state plays a protective role against Parkinson’s disease, and that its effect is
stronger when it is combined with other polymorphisms that are specific to haplogroups J and K
(van der Walt et al., 2003). Thus, the characterization of the mtDNA pool of any population may
be instrumental in determining risk factors for various diseases and conditions.
In addition, biological ancestries imply human migration routes that shed light on the
possible origins of introduced fauna and flora, including agricultural varieties. Moreover,
biological ancestries play a fundamental role in population history which, as one of the main
categories of cultural history, is essential to explain the social systems and behavioral guidelines
that rule all aspects of social life. Population history considers population growth in relation to
geographic regions, biological ancestries, and admixture, and thus plays a central role in the
cultural development of a people (Fernández-Méndez, 1970).
It is estimated that from 60,000 to 600,000 Arawak-speaking Taíno Indians lived in
Puerto Rico when it was discovered for the Europeans by Christopher Columbus in 1493
(Abbad, 1959; Fernández-Méndez, 1970). Traditional history tells us that they were decimated
by war, hunger, disease, and emigration, such that they had totally disappeared by the end of the
16th century. The vast majority of Spanish settlers were single men, and mixing with Indian
women commenced fully upon colonization in 1506. The Spanish Crown took measures to
increment the number of "white" people in the Island, including ordering "white" Christian
6
female slaves to be sent to Puerto Rico in 1512. However, the 1530 census reported that only 57
of the 369 "white" men in the Island were married to "white" women. Such "whites" were a
minority. The census reported 335 "black" female slaves and 1168 "black" male slaves, and a
total of 1148 Indians, both genders included (Brau, 1904). By this time, the base of the Puerto
Rican economy was shifting from gold mine exploitation to sugar cultivation. African slaves
became the cornerstone of the sugar industry.
Traditional history includes abundant evidence of the widely dispersed geographic
origins of the Sub-Saharan African peoples who were brought to the Americas, spanning from
Cape Verde on the northwest edge of Sub-Saharan Africa to Mozambique and the island of
Madagascar in the southeast. The arrival in Puerto Rico of people from various African regions
can be confirmed by traditional festivals and other activities held in the name of African gods
and by the use of words that can be found only in particular African regions. However, the lack
of a classification system for slaves by tribe or even by geographic region during the Atlantic
slave trade leaves doubts concerning the relative contribution of the different continental regions
(Álvarez-Nazario, 1974).
Slaves were first brought to Puerto Rico in 1508 by her conquistador, Juan Ponce de
León. These were residents of the Iberian Peninsula, many of North African, Senegambian or
Guinean origin (Álvarez-Nazario, 1974); others were Greek, Slavic, or Turkish (Thomas, 1997),
and others Jewish (Díaz-Soler, 2000). The capture of Sub-Saharan Africans with the goal of
providing Spanish and Portuguese colonies in the Americas with labor force, first in the search
for gold and later in sugar plantations, started in 1518 (Díaz-Soler, 2000). Up to the beginning of
the second half of the 16th century, almost all slaves originated in Senegambia and Guinea
(Alegría, 1985). The island of São Tomé, with slaves acquired mainly from the Gulf of Guinea,

7
was an important supplier thereafter. Throughout the 16th century and with the exception of one
in the west coast, all 13 sugar mills in Puerto Rico worked east of La Plata River, which streams
along longitude 66o16' W (Gelpí-Baíz, 2000).
The Portuguese were the legal source of African slaves until 1640, at which time Spain
suspended all contracts in retaliation for the revolution that removed their Spanish rulers. The
resulting shortage of slave labor provoked the collapse of the sugar industry, starting a period of
subsistence economy that lasted for a century and a half until the Crown suspended all taxes and
source restrictions on the slave trade in 1789. The poor state of the economy hindered the
importation of slaves, and the tax collected upon their sale made the illegal trade their main
source. The illegal slave trade was circuitous in that the main slave sources were the Dutch
colony of Curaçao and the English colony of Jamaica, in that order. Slaves brought from the
Gold Coast (Ghana) were the most common in these colonies at the time. The illegal Puerto
Rican harbors were located on the west and south coasts, where most of the island population
lived (Álvarez-Nazario, 1974). The only legal harbor was far away in San Juan, the capital, and
few legal immigrants made it to Puerto Rico during these times.
The importation of slaves increased dramatically as a consequence of the land and tax
reforms of the last decades of the 18th century, and approximately two-thirds of all slaves ever
brought to Puerto Rico arrived from that point in time until the abolition of slavery in 1873
(Álvarez-Nazario, 1974). By then, the African harbors most used by slave traders extended from
the Gold Coast to Angola (Thomas, 1997).
This new wave of slaves found Puerto Rico mainly inhabited by criollos, Puerto Rico
natives that were the product of centuries of admixture and generations living under a

8
subsistence economy with little or no Spanish government intervention (Fernández-Méndez,
2000).
The Spanish Empire started to crumble at the beginning of the 19th century, and an 1815
royal decree permitted the settlement in Puerto Rico of foreign Catholics with their wealth and
slaves. Thus, wealthy "white" refugees and other immigrants from Europe and the Americas
made it to Puerto Rico in great numbers, stimulating the economy by developing the sugar
industry in the coastal plains and the coffee and tobacco industries in the mountains.
International treaties banned importation of slaves directly from Africa north of the
Equator in 1817 and south of it in 1820. However, the enforcements of the treaties were
ineffective south of the Equator where the Portuguese had bountiful slave factories. Thus, the
illegal Angolan trade became substantial in the 19th century. Larger sources of Africans were
probably the West Indies, because trade within the Caribbean was not banned and because
escapees arriving to Puerto Rico were granted freedom. In this respect, migrations from the then
Danish-ruled island of Saint Thomas, which acquired its slaves mainly from the Gold Coast to
the Slave Coast in the Bight of Benin (Thomas, 1997), were a major source (Álvarez-Nazario,
1974).
Our results conform to most accounts of traditional history, but not at all with the
extermination of the Taíno people as early as the 16th century, thus showing that population
genetics has a lot to offer to studies on Caribbean population history. It is important to note that
people neglected rarely contribute to traditional history, and a great part of the cultural
development of the Puerto Rican people occurred in the “darkness” of history, far away from the
capital, as did the illegal trade that kept their subsistence economy alive.

9
In the interest of greater clarity, we often refer to Puerto Ricans carrying mtDNAs of
Amerindian, African, or West Eurasian origin in such terms as Amerindians, Africans, and West
Eurasians. However, it is important to keep in mind that we are referring to a thoroughly mixed
population composed of people of a single culture and whose phenotypes do not help to predict
individual mtDNA ancestries.
SUBJECTS, MATERIALS AND METHODS
Subjects
A random sample of 872 housing units representative of the island of Puerto Rico was
selected using a sampling frame developed by the Center for Applied Social Research
(University of Puerto Rico at Mayagüez) for survey research in Puerto Rico, based on the 1990
Census of Population and Housing. Excluding the island municipalities of Vieques and Culebra
from the sampling frame, 28 of the 76 municipalities in Puerto Rico were selected (Fig. 1) as per
the following description. The eight most populated municipalities were selected with
probability equal to one. Each was assigned a number of housing units proportional to its
estimated population size based on a total of 872 housing units for the entire island. To select
the remaining 20 municipalities, the remainder of the island was divided into five geographical
regions. Four municipalities from each region were selected at random with probability
proportional to estimated population size while stratifying by estimated population size. They
were assigned an equal number of housing units, proportional to the estimated population size of
the geographic region they represented.
Thirty percent of the census tracts within each municipality were selected at random with
probability proportional to estimated population size. Having established an estimated number

10
of housing units for each census tract based on the number of housing units for the municipality
and the relative population sizes of the selected census tracts, census blocks were selected within
them so that each would contribute an expected eight households to the sample. On the field,
housing units were chosen by systematic sampling with a pre-established random starting point
for each block. This means that the actual number of housing units obtained from each block
could be greater or smaller than initially expected depending on how the number of housing units
in it had changed since 1990. An adult was selected at random from each housing unit.
Participation in the project was agreed to by appropriate informed consent.
DNA manipulation
The sample collection and DNA extraction were performed as in Martínez-Cruzado et al.
(2001). Thereafter, a 200 µl aliquot from each 500 µl sample was purified using the QIAamp
DNA Mini Kit (QIAGEN). To each aliquot, 36 µl of 60 mM Tris-HCl pH 8.0, 60 mM
Na2EDTA pH 8.0, 0.6 M NaCl, 0.24 mM DTT and 12% SDS was added, followed by 250 µl of
Buffer AL and 250 µl of 100% ethanol. The aliquots were vortexed thoroughly, transferred to a
spin column, and spun at 8000 rpm for one minute. The filter was washed by adding 300 µl of
Buffer AW1, spinning at 8000 rpm for one minute, adding 300 µl of Buffer AW2, and spinning
at 14000 rpm for five minutes. The DNA was eluted from the filter into two 100 µl aliquots.
The eluate aliquots were kept at -80oC as backups until the end of the study.
Except for the cycling conditions (see below) and that 1.5 U of Taq DNA polymerase
were used in each amplification reaction, the DNA amplification, restriction digestion, and
agarose gel electrophoresis procedures were performed as in Martínez-Cruzado et al. (2001).
The amplification reactions were usually subjected to one cycle of 2.5 min at 94oC, 32 cycles of
11
30 sec at 94oC, 1 min at 54oC, and 70 sec at 72oC, and one cycle of 10 min at 72oC. Primer
annealing was achieved at 52oC to amplify the diagnostic site for macroparagroup L and at 56oC
to amplify the sites diagnostic for haplogroups G and L3d.
Haplogroup identification strategy and quality-control estimates
Studies involving high resolution restriction analysis (Ballinger et al., 1992; Torroni et
al., 1992, 1993a,b, 1994a,b,c,d, 1996, 1997; Chen et al., 1995, 2000), analyses of the complete
sequence of mitochondrial chromosomes (Kong et al., 2003; Reidla et al., 2003), or complete
(Herrnstadt et al., 2002) or partial (Silva et al., 2002) sequences of their coding region have
shown that all haplogroups are virtually monomorphic for the 10394 DdeI and 10397 AluI sites,
with the exception of haplogroup K. Thus, the a priori determination of the state of these sites
quickly reduces the number of candidate haplogroups to which an unknown mtDNA may belong.
Because these sites are close to each other, the 10394 DdeI/10397 AluI motif (hereafter referred
to as the motif) can be easily determined from a single amplicon.
Thus, each mtDNA sample was first tested for its motif. Depending on the result, each
sample was then tested for the markers diagnostic for all the haplogroups known to share its
motif. The haplogroups, their motifs, their defining markers, and the primers used are shown in
Table 1. Haplogroups that are defined by two or more markers invariably share at least one of
them with some other haplogroup. Thus, tests on the unshared haplogroup markers were
performed only when the samples showed the shared ones. The two markers that define
haplogroup L1b were tested on all (+/-) motif samples as each by itself defines another (+/-)
motif haplogroup. L is a macroparagroup, a large group of mtDNAs including several
haplogroups and other paraphyletic mtDNAs (Chen et al., 1995; Salas et al., 2002). Among

12
others, it includes haplogroup L2 (here further subdivided into L2a and L2* to pool
subhaplogroups L2b, L2c, and L2d), and subhaplogroups L1b and L1c. All other L haplogroups
and paraphyletic mtDNAs were included in paragroup L0 (Mishmar et al., 2003).
The testing of markers for all haplogroups within each motif group served as a quality-
control measure, as it allowed us to detect false positives. In the few instances in which the
mtDNA tested positive for no haplogroup-defining markers, its identity was determined by the
sequence of its HVR-I and confirmed by restriction analysis. Thus, false negatives were also
detected, and the likelihood of any error involving false haplogroup positives, false haplogroup
negatives, or motif group misdiagnoses could be estimated experimentally. Such estimates were
used to calculate the probabilities of any number of samples being misdiagnosed. Because all
tests were performed independently, the likelihood that any two errors were committed in
analyzing the same sample could be calculated based on the multiplicative rule of probability.
Amplicons to be sequenced were purified using the High Pure PCR Product Purification
Kit (Roche Molecular Biochemicals) as instructed by the manufacturer. Automated sequencing
was performed at the University of Medicine and Dentistry of New Jersey, New Jersey Medical
School Molecular Resource Facility using an Applied Biosystems (ABI) model 3100 capillary
sequencer after cycle sequencing with Dye Terminator mix version 2.0.
Biological ancestry determination and data analysis
Biological ancestries were inferred from haplogroup identity. Because only nine women
of Asian ancestry were reported living in Puerto Rico in 1899 (Sanger et al., 1900), mtDNAs of
haplogroups belonging to both the New World and Asia were assumed to be of Amerindian
origin unless participant interviews revealed otherwise.

13
Data analysis was performed using the program SPSS 10.0.5 for Windows. To determine
whether variations in participation rates or changes in population size occurring since 1990 in the
sampled municipalities would lead to biased estimates of the parameters, we devised a weighting
scheme. Through these weights, the number of samples provided by each municipality was
adjusted so that it would be equal to the number expected by applying the original sampling
proportions to the final sample size. The weights for the municipality samples (Wm) were a
function of the sampling proportion of the municipality (Pm), the final total obtained sample size
(n), and the number of samples provided by the municipality (nm) so that
Wm = (Pm x n)/nm.
A triangular graphic of ancestry distribution among municipalities was constructed using
MATLAB. A projected plane representing a linear function of form w = f(X, Y, Z), in which
plotted population dots were defined as the end of vectors with form w = Xi + Yj + Zk, where X,
Y, and Z represented Amerindian, African, and West Eurasian frequencies, respectively, was
produced. The sum of X, Y, and Z was equal to one. Their magnitudes were a function of the
30 and 60 degree angles. Vectors i, j, and k were their respective unit vectors in the positive
directions of the coordinate axes x, y, and z.
To illustrate the geographic distribution of Amerindian mtDNA frequencies,
municipalities were listed in order according to such frequencies and divided into 12 categories
by creating a new category every time that the difference between two municipalities was 1.6%
or more. Divisions were drawn halfway between the frequencies of such municipalities.
Principal component (PC) analyses were performed using the POPSTR program of Henry
Harpending (U of Utah). They were based on population haplogroup frequencies and included
only populations with 17 samples or more. Sub-Saharan African mtDNAs were classified as

14
follows. Macroparagroup L was divided into haplogroup L2 (further subdivided into L2a and
L2*), subhaplogroups L1b and L1c, and paragroup L0 to pool all other haplogroups and
paraphyletic mtDNAs within the macroparagroup. Paragroup L3A (Salas et al., 2002) was
divided into L3b, L3d, L3e, L3f, L3g and L3*. We designate U5b2 as a Sub-Saharan African
clade with the HVR-I sequence 16189-16192-16270-16320. Taken from one source were Shona
(n = 17), Tongas (20), Shangaan (22), Chopi (27), Chwabo (20), Lomwe (20), Makonde (19),
Makhwa (20), Ndau (19), Nyungwe (20), Nyanja (20), Ronga (21), Sena (21), and Tswa (19)
from Mozambique (Salas et al., 2002), Brazil (65) (Alves-Silva et al., 2000), Bubi (45), São
Tomé (49) (Mateu et al., 1997), Mandenka (118) (Graven et al., 1995), Serer (23), a group of
other Senegalese tribes (48), a pool of Mauritanian and West Saharan tribes (24) (Rando et al.,
1998), Tuareg (22), Yoruba (33), Hausa (20), Fulbe (60), Turkana (37), Somalia (27), Kikuyu
(22) (Watson et al., 1997), Nubia (46) (Krings et al., 1999), Khwe (31) (Chen et al., 2000), and
the southeastern islands of the Cape Verde Archipelago (169) (Brehm et al., 2002). From two
sources were Biaka (34) and Mbuti (35) Pygmies (Chen et al., 1995; Watson et al., 1997), Wolof
(66) (Chen et al., 1995; Rando et al., 1998), and !Kung (62) (Watson et al., 1997; Chen et al.,
2000). For West Eurasians, mtDNAs were classified as belonging to H, V, HV, (pre-HV)1, J, T,
I, W, X, M, N, R, K, U*, U2, U5*, U5(a+b), U6, and U(others) to pool the remaining clades (U1,
U3, U4 and U7). Populations were obtained from Rando et al. (1998) (23 Moroccan non-
Berbers and 58 Moroccan Berbers), Brakez et al. (2001) (37 Moroccan Souss Valley
inhabitants), and Richards et al. (2000). This last group of authors compiled data from several
authors concerning 13 populations from North Africa and the Near East, as well as several
populations from Europe. They classified the European populations into 10 geographic regions
and we observe those same classifications here. Amerindian populations were divided into 12

15
geographic regions and "Others". These were three from eastern North America [Mohawk (123)
(Merriwether and Ferrell, 1996) and Ojibwa from Manitoulin Island (33) and northern Ontario (28)
(Scozzari et al., 1997)], five from the Great Plains [Cheyenne/Arapaho (35), Sisseton/Wapheton
Sioux (45), Turtle Mountain Chippewa (28) and Wisconsin Chippewa (62) (Malhi et al., 2001), and
Siouan (34) (Lorenz and Smith, 1996)], six from the North American Southeast [Choctaw (27)
(Lorenz and Smith, 1996), Creek (39) and Seminole (40) (Weiss and Smith, 2003), Oklahoma
Muskoke (70) (Merriwether and Ferrell, 1996), and Oklahoma Red Cross Cherokee (19) and
Stillwell Cherokee (37) (Malhi et al., 2001)], 15 from the North American Southwest [Akimal
O'odham (43), Apache (38) Delta Yuman (23), Navajo (64), North Paiute/Shoshoni (94), Pai
Yuman (27), River Yuman (22), Tauno O'odham (37) and Zuni (26) (Malhi et al., 2003), and
California Penutian (17), Havasupai/Hualapai/Yavapai/Mojave (18), Jemez (36), Pima (37),
Quechuan/Cocopa (23) and Washo (28) (Lorenz and Smith, 1996)], four from Mesoamerica [Maya
(26), Mixtec (29) and Nahua/Cora (32) (Lorenz and Smith, 1996), and North Central Mexico (199)
(Green et al., 2000)], eight from eastern Central America [Bribri-Cabecar (24) (Torroni et al.,
1993a), Emberá (Panamá) (44) and Wounan (31) (Kolman and Bermingham, 1997), Guatuso (20)
and Teribe (20) (Torroni et al., 1994d), Huetar (27) (Santos et al., 1994), Kuna (63) (Batista et al.,
1995), and Ngöbé (46) (Kolman et al., 1995)], 14 from western Colombia and Ecuador including
the Andes [Cayapa (94) (Rickards et al., 1999), Chimila (34), Guambiano (23), Guane-Butaregua
(33), Ijka-Arhuaco (40), Kogui (30), Paez (31), Tule-Cuna (29), Waunana (30) and Yuco-Yukpa
(88) (Keyeux et al., 2002), and Emberá (Colombia) (41), Ingano (52), Wayuu (59) and Zenu (69)
(Mesa et al., 2000; Keyeux et al., 2002)], nine from Colombia east of the Andes [Coreguaje (19),
Curripaco (17), Guahibo-Sikuani (23), Guayabero (24), Huitoto (22), Murui-Muinane (18), Nukak
(20) and Piaroa (18) (Keyeux et al., 2002), and Tucano (71) (Mesa et al., 2000; Keyeux et al.,

16
2002)], seven from the Amazon [Belén (Brazil) (81) (Batista dos Santos et al., 1999), Brazilian
North (26) (Alves-Silva et al., 2000), Gaviao (27), Xavante (25) and Zoró (30) (Ward et al., 1996),
Ticuna (28) (Torroni et al., 1993a), and Yanomami (97) (Merriwether and Ferrell, 1996)], nine from
the Perú, Bolivia and Chile highlands around Lake Titicaca [Atacameño (50) (Merriwether et al.,
1995), Chimane (40), Ignaciano (21), Mosetén (19), Movima (22), Trinitario (33), Yuracaré (27)
(Bert et al., 2001), and Aymara (98) and Quechua (51) (Merriwether and Ferrell, 1996; Bert et al.,
2001)], six from northern Argentina [Mataco from the provinces of Chaco (28), Formosa (44) and
Salta (55), Pilaga (40), and Toba from the provinces of Chaco (28) and Formosa (26) (Demarchi et
al., 2001)], and five from southern South America [Huilliche (89) (Merriwether and Ferrell, 1996),
Mapuche-Argentina (50) (Bailliet et al., 1994), Mapuche-Chile (156) (Merriwether et al., 1995;
Moraga et al., 2000), Pehuenche (204) (Merriwether and Ferrell, 1996; Moraga et al., 2000) and
Yaghan (21) (Moraga et al., 2000)]. Two "Other" populations were Bella Coola (36) (Lorenz and
Smith, 1996), and Brazilian Southeast (33) (Alves-Silva et al., 2000).
Haplogroup diversity for the Amerindian mtDNAs was calculated using the method of
Tajima (1989), h = [1-Εxi2]n/(n-1), where xi is the frequency of each haplogroup and n is the
sample size.
RESULTS
Response rate
All selected housing units were identified between August 6, 1999 and March 19, 2000.
Based on the 1990 Census of Population and Housing, a total of 872 housing units was selected.
This translated into 1,067 because of housing growth through the decade. Eighty-one of the
housing units were uninhabited. From the 986 remaining housing units 876 selected individuals

17
were contacted. Exactly 800 of these agreed to participate, for a response rate of 81.1% based on
the 986 selected individuals. The sampling procedure results for each municipality and region
are detailed in Table 2.
Haplogroup identification data quality
The haplogroup identification strategy described above allowed the detection of
misdiagnoses of both motif and haplogroup-defining marker identities, and thus an estimation of
the probability that any misdiagnosis may have gone undetected. The largest margin of error lies
within the (+/-) motif group. Initially, all (+/-) samples were tested, among others, for the +3592
HpaI and +2349 DpnII markers but not for markers +9070 TaqI and +16389 HinfI, which are
necessary to discriminate L1c and L2, respectively, from all other mtDNAs within L (Table 1).
Thus, the samples belonging to L1b (+3592 HpaI / +2349 DpnII) and L3e (-3592 HpaI / +2349
DpnII) were quickly identified, while the samples with the +3592 HpaI / -2349 DpnII profile had
to be subjected to a second round of tests for markers +9070 TaqI and +16389 HinfI. HVR-I
sequencing of those samples with no haplogroup-defining markers showed that the +3592 HpaI
motif of one of the 79 samples with the +3592 HpaI / -2349 DpnII profile initially went
undetected. This gave us an experimental estimate of 1/79 for the frequency with which the
+3592 HpaI motif went undetected. Using such frequency and a base of 49 L1b samples, we
calculated a probability of 53.6% that none of the 38 samples identified as belonging to
haplogroup L3e (-3592 HpaI / +2349 DpnII) may actually belong to L1b (+3592 HpaI / +2349
DpnII). Using bases of 50, 51, and 52 L1b samples, we calculated probabilities of 33.9%,
10.9%, and 2.4% that one, two, or three samples identified as L3e actually belong to L1b.

18
There are two other scenarios by which misdiagnoses could occur. One is the
combination of a misdiagnosis of the sample motif group with a false positive for a haplogroup-
defining marker. The other is the occurrence of both a false negative and a false positive for
haplogroup-defining markers with the same sample. Based on the detection of 11 motif
misdiagnoses [three samples misdiagnosed as (-/-), seven as (+/-), and one as (+/+)], six false
positives (one each for the markers corresponding to A, D, HV, L, L3b and J/T), 11 false
negatives (three each for the markers of A and J/T, two for that of C, and one each for those of
HV, L and L3b), the number of samples belonging to each motif group [377 (-/-), 233 (+/-), and
190 (+/+)], and the number of samples belonging to each haplogroup (Table 3), we estimate that
the probability that no misdiagnoses were made under either of these two scenarios is 86.0%, and
that the probability that two or more misdiagnoses were made is insignificant.
Haplogroup identities
Table 3 shows the distribution by municipality of all haplogroups found, their
frequencies, and their biological origin. Only six of the 800 samples were confirmed, through
HVR-I sequencing, as having 10394 DdeI/10397 AluI motifs different from those corresponding
to their haplogroups (Table 1). Specifically, two L3e, one L2*, one L2a, and one L1c samples
were found to have (-/-) instead of (+/-) motifs. In addition, one haplogroup C sample had a (-/-)
motif instead of the (+/+) expected.
On six occasions samples were confirmed as having more than one haplogroup-defining
marker. The -8616 DpnII marker that characterizes haplogroup L3d was found in one L0 and
one L1c sample. Furthermore, two L1b samples had the +4216 NlaIII marker that characterizes
haplogroups J and T. These were all regarded as belonging to macroparagroup L because of the

19
known stability of the L-defining +3592 HpaI marker. The true haplogroup identities of the
remaining two samples were determined from their HVR-I sequences. One haplogroup H
sample had the 9 bp deletion between the tRNALys and COII genes that characterizes haplogroup
B, and one haplogroup C sample had the -7598 HhaI mutation that characterizes Asian
haplogroup E. Their respective HVR-I sequences were 16093-16362 and 16221-16223-16261-
16298-16325-16327. Thus, the first lacked the transitions at positions 16189 and 16217 that
characterize haplogroup B (Ginther et al., 1993; Horai et al., 1993), and the second possessed the
haplogroup C-specific transitions at positions 16298 and 16327 as well as the Amerindian-
specific transition at 16325 (Torroni et al., 1993b).
Samples that did not test positive for any haplogroup-defining marker were identified by
sequencing their HVR-I as well as specific sites in their coding regions. Nine (+/-) mtDNAs
were classified as L3* for having transitions at sites 10873 and 12705. The HVR-I sequences of
two (-/-) mtDNAs not having transitions at 10873 or 12705 were 16288-16311 and 16126-
16189-16362. The first (-/-) mtDNA had a transition at site 11719 but not at 16223, and was
thus classified as belonging to R. The transitions at sites 16126 and 16362 showed that the
second (-/-) mtDNA belonged to JT or (pre-HV)1 (Macaulay et al., 1999). The absence of a
transition at 11719 showed that it belonged to (pre-HV)1 (Richards et al., 2000). Finally, the
HVR-I sequence of one (+/+) sample that did not exhibit any haplogroup-defining marker was
16086-16183-16189-16223-16278-16298-16325-16327. Thus, it contained the 16223, 16298,
16325 and 16327 transitions specific for Native American haplogroup C, and transitions 16183,
16189, 16223, 16278, which are found in most haplogroup X mtDNAs (Brown et al., 1998).
However, it possessed the +10397 AluI motif specific of macrohaplogroup M, to which
haplogroup C but not haplogroup X belongs. This motif has been shown to be very stable

20
(Kivisild et al., 2002; Kong et al., 2003), and we thus regarded this mtDNA as belonging to
haplogroup C. One haplogroup C mtDNA lacking the +13262 AluI marker had been previously
described from the Amazonian Makiritare (Torroni et al., 1993a), and (+/+) mtDNAs lacking
defining markers for haplogroups C and D seem to be common in Colombia (Keyeux et al.,
2002; Rodas et al., 2003). No mtDNAs belonging to haplogroups E, F, G, I, M, N, JT, W or X
were found in our set of 800 samples.
Haplogroup U subdivisions
Among all haplogroups found here, U is the only one that has been reported in significant
numbers in more than one continental region (Torroni et al., 1996). It was thus necessary to
study such mtDNAs in more detail to identify their biological origin. The HVR-I sequence of
the 27 samples belonging to haplogroup U segregates them into 10 types (Table 4). Although
haplogroup U is mostly regarded as a West Eurasian haplogroup, it is apparent that nine of these
samples originate from Sub-Saharan Africa. All share the same sequence type, which has not
been found in Europe or the Near East despite the thousands of samples from these areas for
which the HVR-I has been sequenced (Alves-Silva et al., 2000; Richards et al., 2000; Finnilä et
al., 2001; Malyarchuk et al., 2002). However, it has been found in one out of 60 Fulbe
sequences (Watson et al., 1997), and in one of 38 and 23 Wolof and Serer sequences,
respectively (Rando et al., 1998). We classify it as a member of clade U5b* because of its
16189, 16192, 16270 motif (Richards et al., 2000). Its distinction is the addition of a transition at
position 16320. We designate it as clade U5b2 to represent a Sub-Saharan African clade with a
transition at 16320 as its signature.

21
Eleven samples seem to originate from North Africa and the Canary Islands. Two
samples sharing the same sequence exhibit the 16163 motif, which is diagnostic for the Native
Canarian-specific clade U6b (Rando et al., 1999). Nine samples segregate into three North
African sequence types. The most common type (16224-16270), comprising seven samples,
may correspond to the 16093-16224-16270 type of apparently North African ancestry that has
been found in two Canarian Islands (Pinto et al., 1996; Rando et al., 1999), because our
sequencing reactions did not extend to the left of the 16154 site in these samples. No other
mtDNAs have been found with the 16093-16224-16270 or the 16224-16270 sequence types
elsewhere. Of the two remaining North African sequence types, one (16224-16261-16270) may
have derived directly from the most common type, as it differs from it at only one site. The
remaining one has been found mainly in North Africa, but also in the Near East and Sub-Saharan
Africa. Its highest frequency has been reported in the Berber-speaking Mozabites of northern
Algeria: 10 out of 85 samples (Côrte-Real et al., 1996). Other populations with lower
frequencies are Moroccan Berbers and non-Berbers (Pinto et al., 1996; Rando et al., 1998),
Egyptians (Krings et al., 1999), Syrians (Richards et al., 2000), and some East and West African
tribes (Watson et al., 1997). It has also been found in two of 54 samples from Portugal (Côrte-
Real et al., 1996), but we believe its presence in the Iberian Peninsula is due to migrations related
to the slave trade.
Two samples share the motif 16189-16362. They likely belong to the U2 clade, which is
characterized by the 16051 motif (Kivisild et al., 1999; Macaulay et al., 1999), a site to which
our sequencing reaction did not extend. However, most West Eurasian U2 mtDNAs, but not
other haplogroup U clades, present substitutions at positions 16129 and 16362. Since these
samples do not present motifs that would classify them under any other clade, but possess the

22
16362 transition, they likely belong to clade U2. Clade U2 is virtually absent in North Africa
and is found in the Near East at somewhat higher frequencies than in Europe. However, the
precise sequence type is found at a higher frequency in the Iberian Peninsula than in any Near
Eastern population except the Kurdish (Richards et al., 2000). PC analysis does not assign the
Puerto Rican West Eurasian population a decisively higher affinity to the Kurdish or the
European Mediterranean Western Region population (see below). Thus, we can only conclude
that these samples should originate either in the Iberian Peninsula or the Near East.
The remaining four sequence types, encompassing only five samples, likely are of
European origin. One of them differs from the CRS only by a transition at position 16192.
Although the exact sequence type has not been reported elsewhere, it is regarded as European in
origin because of the instability of the 16192 site in haplogroup U mtDNAs and the fairly high
frequency of the otherwise resulting sequence type (CRS) in the Iberian Peninsula. The
remaining three European sequence types are either particular U5b* types common only
throughout Europe or belong to subclade U5a1a, which evolved in Europe (Richards et al.,
2000).
L3* subdivisions
The HVR-I sequences of the nine (+/-) samples for which no haplogroup-specific
markers were found are shown in Table 5. They segregate into eight sequence types sharing the
16223-16311 motif. Three of the sequence types possess the 16209 transition diagnostic of the
L3f clade and the 16292 transition of subclade L3f1 (Salas et al., 2002). Only these three
sequences showed a 1 bp deletion in the 5 bp T-stretch that runs from 15940 to 15944 in the
CRS. This deletion is not the result of errors in the CRS (Andrews et al., 1999); it may play a

23
significant role in RNA translation efficiency, as it makes the T*C arm loop of the tRNAThr only
two nucleotides long, and may become a useful phylogenetic marker to group L3* clades or to
further subdivide subclade L3f1.
Another sequence type contains the 16293T-16355-16362 motif of clade L3g. The four
remaining sequence types encompass five samples and cannot be grouped into any L3* clade.
These thus remain classified as L3*. However, four of these five samples seem to be not too
distantly related, as they all share the 16256A transversion. Two of them also share transitions at
positions 16129 and 16362.
Geographic distribution of mtDNAs by biological ancestry
Little change is observed when the biological ancestry frequencies are corrected by
sample weight. Frequencies and 95% confidence intervals of 61.0 + 3.4% Amerindian, 27.5 +
3.1% African, 11.4 + 2.2% West Eurasian, and 0.1 + 0.2% Asian (Table 3) are corrected to 61.3
+ 3.4% Amerindian, 27.2 + 3.1% African, 11.5 + 2.2% West Eurasian, and 0.0% Asian (Table
6).
Amerindian mtDNAs are the most common in all municipalities except Loíza, where
African mtDNAs are more frequent, and Cayey, where the population is equally divided into
African and Amerindian mtDNAs. Amerindian mtDNA frequencies are 50% or higher in all
municipalities except Loíza, San Juan, and Carolina (Table 3).
In addition, West Eurasian frequencies are low in all municipalities (0 – 17.9%). Thus, in
a triangular graph with axes representing biological ancestries, ancestry frequencies cluster close
to the vertex where the Amerindian frequency equals one, and scatter, next to the side defined by
zero West Eurasian frequency, towards the vertex where African frequency equals one (Fig. 2).

24
A negative Pearson correlation (-9.19) between African and Amerindian frequencies is observed
that is significant at the 0.01 level (2-tailed test). That is, the biological ancestry frequency of
municipalities can be virtually described by stating only their African or Amerindian
frequencies.
Figure 3 divides the 28 sampled municipalities into 12 categories according to their
Amerindian mtDNA frequencies, and divides Puerto Rico by longitude 66o16' W, as 12 of the 13
sugar mills that worked throughout the 16th century were built east of it. It can be observed that
the three municipalities with the lowest Amerindian frequencies are next to each other in San
Juan and further east. Furthermore, all 11 municipalities east of longitude 66o16' W are among
the 14 municipalities with the lowest Amerindian frequencies. There is a highly significant
deviation from the null hypothesis that frequencies for all ancestries are the same east and west
of longitude 66o16' W (Pearson X2 = 43.70, df = 2, p << .001). X2 tests also show highly
significant deviations from null hypotheses of equal frequencies on each side of longitude 66o16'
W for Amerindian (Pearson X2 = 41.72, df = 1, p << .001) and African (Pearson X2 = 34.40, df =
1, p << .001) mtDNAs. African mtDNAs are more frequent in the east than in the west; the
reverse is true for Amerindian mtDNAs. No significant difference is found for West Eurasian
mtDNAs.
Interestingly, the geographic distribution by biological ancestry does not fit expectations
based on traditional history that place Amerindians fleeing to the mountains and African slaves
working in sugar plantations on the coasts. The three municipalities with the highest Amerindian
frequencies are coastal (Fig. 3), and X2 tests show that Amerindian frequencies in noncoastal
municipalities are not significantly higher than those in coastal ones, and that African
frequencies are not significantly higher in coastal than noncoastal municipalities.

25
Principal component analyses
To learn more about the origins of African mtDNAs in Puerto Rico, their weighted
haplogroup frequencies (Table 7) were subjected to principal component (PC) analysis. Figure 4
plots the Puerto Rico African haplogroup frequencies with those of various contemporaneous
African populations for the first two PCs (panel A), and the first and third PCs (panel B). The
three PCs account for 28%, 23% and 15% of the variation, respectively.
Little difference is found between the plots, which separately group the populations of
West Africa and Mozambique, and scatter the East African populations in the lower side of PC2
and PC3. The Bubi from the island of Bioko are well separated from all these groups. Three of
four very old populations also separate well from these clusters. These are the Mbuti and Biaka
Pygmies and the !Kung from South Africa. The South African Khwe fall within the
Mozambique cluster. The ends of the West Africa cluster defined by PC1 are composed of
populations located on the western coast to the left and populations located inland or close to the
Gulf of Guinea to the right.
PC1 locates the population of Brazil outside of both the West African and Mozambican
clusters. All other populations created by the slave trade are placed within the West African
cluster. The southeastern Cape Verde Islands, which were uninhabited when discovered by the
Portuguese and populated with slaves from the western coast of West Africa and inland
thereafter (Thomas, 1997), fall in the middle of the West African cluster. To the right are located
the Puerto Rico and São Tomé populations in that order, the latter lying at the edge of the West
African cluster. Thus, a mainly West African origin is suggested for the African mtDNA
fraction of Puerto Rico.

26
Figure 5 plots the Puerto Rico West Eurasian haplogroup frequency (Table 8) with those
of European, Near Eastern and Moroccan populations for the first two PCs (panel A), and for the
first and third PCs (panel B). The three PCs account for 38%, 16% and 13% of the variation,
respectively. European and Moroccan clusters can be distinguished in the first plot but fuse
together in the second plot. The results are similar in many aspects to those obtained by
Richards et al. (2002). The European Southeastern, Mediterranean East, and Mediterranean
Central populations cluster a bit separately from the rest of the European populations, showing
affinities to the Near Eastern populations, and the long-isolated Basques lie the farthest away
from the Near Eastern populations. Another similarity is the scattering of Near Eastern
populations, with the exception that the Kurdish, Armenian, and Turkish populations cluster
together in both plots.
As Puerto Rico was a Spanish colony for four centuries, it is perhaps expected that its
West Eurasian mtDNA population would lie close to the Mediterranean West population; it is
noteworthy that on both plots the Mediterranean West population is the European population
closest to Puerto Rico, but the Puerto Rico population lies outside the European cluster. It lies
closest to and about equidistant between the European and Moroccan clusters in the first plot,
and closest to the Turkish-Armenian-Kurdish cluster in the second plot, suggesting that the West
Eurasian women that migrated to Puerto Rico had multiple origins.
The resolution power of the PC analysis of the Amerindian weighted haplogroup
frequencies (n for haplogroups A-D and X in Puerto Rico being 252, 42, 173, 14 and zero,
respectively) is limited by the small number of haplogroups employed (Fig. 6). However, its
frequent failure to group populations from particular geographic regions can often be explained by
prehistoric demographic events. PC1 accounts for 38% of the variation, and although PC2 accounts

27
for more variation (28%) than PC3 (20%), it is less effective at resolving most populations, as its
resolution power lies on separating well Bella Coola from all other populations (Fig. 6 insert). The
populations of five of the six North, Meso and Central American regions, as well as those around
Lake Titicaca and southern South America, lie generally closer to each other. Those from
Colombia and the Amazon are widely dispersed. The Puerto Rico population is found in the
bottom-left quadrant, next to the Western Colombian population of Paez.
DISCUSSION
Data quality and representativeness of the sample set
Our results can be deemed as being representative of the Puerto Rico population because
we used a sampling frame developed for survey research in Puerto Rico that produced a sample
set representative of the population based on the 1990 Census of Population and Housing, and
obtained a response rate (81.1%) that complies with the standards and experience for survey
research in the Island (Alegría et al., 2001; Colón et al., 2001). Furthermore, no municipality
had a particularly low response rate, San Juan (69.0%) having the lowest as the result of both the
difficulty of contacting the selected people and a relatively high declination rate (Table 2). In
addition, the biological ancestries among municipalities were not highly variable except for
Loíza (Fig. 2), the response rate of which was good (82.2%). Thus, all significant variants that
may exist in the population should have been adequately represented in the sample set. The very
small differences observed between weighted and unweighted results add confidence to the
assertion that the sample set is indeed representative.
We estimated a rather high likelihood (33.9%) that one, and a fair one (10.9%) that two
L1b samples may have been misdiagnosed as belonging to haplogroup L3e. Because both

28
haplogroups are Sub-Saharan African, the effects on our analyses of these possible misdiagnoses
would be limited to the PCs (Fig. 5). In such cases, the Puerto Rico population would have
plotted a little further to the left, as L1b is the haplogroup that contributes most significantly to
the left side of PC1 (not shown). It would have plotted closer to the populations of Cape Verde
and others found near the West Africa western coast, but still between Cape Verde and São
Tomé. In addition, there is a fair possibility (14%) of other kinds of misdiagnoses occurring, but
just once, and the effects of a single misdiagnosis in a set of 800 samples should be negligible.
Haplogroup-specificity of the 10394 DdeI/10397 AluI motif
Table 3 shows that five of the 211 African samples belonging to (+/-) haplogroups
instead possessed (-/-) motifs. Chen et al. (1995) studied 96 Senegalese and 39 Biaka Pygmies
belonging to (+/-) haplogroups, finding the (-/-) motif in five L1c Biaka Pygmies but none in the
Senegalese. Another study on South African tribes found the (-/-) motif in one L3e and five L0
out of 31 Khwe samples and in two L0 of 43 !Kung, for a total of 13 (-/-) motifs in 209 samples
(Chen et al., 2000). Our five (-/-) samples were found in two L3e and in one each of L1c, L2*,
and L2a. It is thus clear that the (-/-) motif has arisen independently several times in Africa as
well as in Europe (Finnilä et al., 2001; Herrnstadt et al., 2002), but it seems to be found in
African tribes at uneven frequencies, being more prevalent in old tribes of South Africa and
Central African Pygmies, and rare elsewhere. Our review of traditional history found no
evidence of Pygmies being brought to the Americas, and suggests that none or very few
members of South African tribes were brought to the Caribbean. Hence, our results may be
reflecting what is found in more recent and widespread African tribes, most of which are related

29
to Bantu expansions, and suggest that the (-/-) motif in (+/-) haplogroups is present at frequencies
of 2% to 3% throughout most of Sub-Saharan Africa.
The 10394 DdeI/10397 AluI motif behaves more consistently among Amerindian
mtDNAs, probably because these form a more recent group. Only one Amerindian mtDNA
showed a motif inconsistent with its haplogroup identity. It belonged to the (+/+) haplogroup C,
and probably suffered a back-mutation at position 10398, thus losing both restriction sites
simultaneously. Because, with the exception of haplogroup U, all African haplogroups are (+/-)
whereas none of the Amerindian haplogroups are, the few motif inconsistencies found here
suggest that testing the 10394 DdeI/10397 AluI motif is an excellent starting point for sorting out
African and Amerindian samples from mixed populations with high African and Amerindian
affinities, such as those in the Caribbean.
Non-specificity in haplogroup-defining markers
The 3592 HpaI site that defines macroparagroup L has proven to be highly stable, being
found strictly on mtDNAs belonging to haplogroups L1 or L2 in Sub-Saharan Africa and
elsewhere (Huoponen et al., 1997; Torroni et al., 1997). The story is not the same for the +4216
NlaIII and -8616 DpnII markers that define haplogroups J/T and L3d, respectively. Both, more
often -8616 DpnII than +4216 NlaIII, have been found occasionally in mtDNAs belonging to
other African and West Eurasian haplogroups (Finnilä et al., 2001; Herrnstadt et al., 2002).
Thus, we deemed it unnecessary to determine the HVR-I sequence of the two L1b samples that
exhibited the +4216 NlaIII motif and of the single L0 and L1c samples that had the -8616 DpnII
motif (Table 3).

30
Other haplogroup-defining markers that were found to occur out of their expected
haplogroups through HVR-I sequencing were the 9 bp deletion between the COII and tRNALys
genes that defines haplogroup B and the -7598 HhaI marker of haplogroup E. The multiple
independent emergences of the 9 bp deletion in Africa (Soodyall et al., 1996), India (Watkins et
al., 1999; Clark et al., 2000), East Asia (Wrischnik et al., 1987; Yao et al., 2002a), Europe
(Torroni et al., 1997), the New World (Torroni et al., 1993a) and Australia (Betty et al., 1996)
are well known. To our knowledge, this is the first time that it has been reported in a haplogroup
H background. However, the -7598 HhaI motif that defines haplogroup E is much more stable.
Hitherto, it had been found outside of a haplogroup E background only in Finnish belonging to
haplogroup K (Finnilä et al., 2001), and in all reported Han Chinese belonging to haplogroup G
(Yao et al., 2002a). It was found here in a haplogroup C background.
Designation of clade U5b2
Mitochondrial DNAs from northern Sub-Saharan Africa with the (-/-) motif were first
described by Chen et al. (1995). These turned out to belong to haplogroup U, as defined by the
acquisition of a HinfI site at position 12308 when using a mismatched primer (Torroni et al.,
1996). Studies in northern Sub-Saharan populations have often found mtDNAs whose HVR-I
sequence circumscribe their identity to haplogroups H or U, suggesting the reintroduction to
Sub-Saharan Africa of West Eurasian mtDNAs through North Africa (Macaulay et al., 1999).
Our results show that the sequence type 16189-16192-16270-16320 (Table 4) found in three
African tribes but not in Eurasia belongs to haplogroup U. Its absence in all other haplogroup U
sequences described to date strongly suggests that these mtDNAs have a very recent common
origin in northern Sub-Saharan Africa. Insofar as no coding region analysis other than at the

31
12308 site has been performed on these mtDNAs, we must depend on their HVR-I sequence for
their classification. Haplogroup U has been subdivided into eight clades plus haplogroup K,
clade U5 being distinguished by its 16270 motif. U5 has been further subdivided into U5a and
U5b, and since only one clearly unrelated haplogroup U mtDNA possessing the 16320 has been
reported (Malyarchuk et al., 2002), we depend on its transitions at sites 16189 and 16192, both
unstable (Macaulay et al., 1999; Finnilä et al., 2000), to classify the African clade. The
combination 16189, 16192 has been found in both U5a and U5b clades, but it has always been
accompanied by a transition at position 16256 within U5a, and by no substitution in particular
within U5b (Richards et al., 2000). Thus, the parsimony rule guides us to classify sequence type
16189-16192-16270-16320 as a U5b clade. As clade U5b1 with the 16144 signature has already
been described, we describe clade U5b2 with the 16320 signature. Coding region analysis must
be performed to confirm the assignment of these mtDNAs to subhaplogroup U5b.
L3 clades with no defining restriction markers
Within Africa, paragroup L3 is found at its highest frequencies in East Africa, where it
originated and gave rise to those mtDNAs that migrated out of Africa (Quintana-Murci et al.,
1999; Maca-Meyer et al., 2001). Salas et al. (2002) described haplogroups L3f and L3g, both
virtually restricted to East Africa except subclade L3f1, which is common in West Africa and
thus not surprisingly the only subclade of L3f found in Puerto Rico. Similarly, L3* is far more
common in East than in West Africa, but the C-to-A transversion at position 16256 that appeared
in four of the five Puerto Rican L3* mtDNAs (Table 5) has appeared just once in the continent,
among the West African Tuareg (Watson et al., 1997). It may thus represent the signature of a

32
small West African clade. However, the presence of one L3g mtDNA in our sample strongly
suggests that even some East Africans were victims of the slave trade.
Amerindian mtDNA frequencies and traditional history
The combination of the high Amerindian mtDNA frequency found and the
representativeness of the sample set leaves no doubts that the mtDNA pool of Puerto Ricans is
predominantly Amerindian. Such preponderance extends throughout the island with the
notorious exception of Loíza (Fig. 2). Many of the slaves in the San Juan region emancipated
upon the abolition of slavery in 1873 and not staying with their former masters were placed in
Loíza. Because San Juan had an unusually high proportion of female domestic slaves (Negrón-
Portillo and Mayo-Santana, 1992), their transference to this lightly populated municipality
increased its African maternal ancestry out of the range of all other municipalities.
Our results are in contrast with those based on genetic markers that estimate the
contribution of Amerindians to the Puerto Rican gene pool at 18% (Hanis et al., 1991). This may
be explained by the predominance of men among the Spaniards that arrived to the Island.
Population studies based on mitochondrial and Y-chromosome markers have found strong sexual
asymmetries in South America, mtDNAs usually being inherited from Amerindian women and
Y-chromosomes from European men (Batista dos Santos et al., 1999; Alves-Silva et al., 2000;
Carvajal-Carmona et al., 2000; Carvalho-Silva et al., 2001). Our preliminary results from Y-
chromosome studies (unpublished) strongly suggest a similar scenario for Puerto Rico. The
overall meaning of our mtDNA data is that the cumulative effect of female migrations to Puerto
Rico for the last five centuries has been the reduction of the Amerindian mtDNA frequency from

33
100% to 61% and, assuming equal reproductive rates, that about seven African women arrived in
Puerto Rico for every three West Eurasians who did.
Remarkably, our mtDNA frequencies mimic those obtained from a study in which JC
virus strains excreted by two groups of Puerto Rico residents were identified: 61% carried a JCV
strain of Asian and Amerindian origin, 26% of African origin, and 13% European (Fernández-
Cobo et al., 2001). The frequency distribution of the strains might be explained by fitness
differences among viral strains. However, our results support an alternate explanation: that the
viral transmission mechanism may favor the mother as vector. The combined identification of
JCV strains and mtDNA ancestries should be undertaken to test for a possible correlation
between them.
Traditional history provides abundant evidence that Amerindian slaves were brought to
Puerto Rico during colonial times from Iberian possessions such as the islands of Margarita,
Trinidad, Aruba, Bonaire, the Venezuelan coast (Fernández-Méndez, 1970), the Yucatán
peninsula (Zavala, 1948), and Brazil (Tapia, 1945). However, the haplogroup diversity of
Amerindian mtDNAs, calculated with weighted samples at 0.5934, is not high, as may have been
expected if the Amerindian predominance in Puerto Rico was the consequence of post-
Columbian migrations. Specifically, the Puerto Rico haplogroup diversity is higher than in 16
of 19 tribes in the American Southwest and Baja California (O’Rourke et al., 2000; Malhi et al.,
2003), where recent population replacement and expansion events may have reduced the
haplogroup diversity of the population (Kaestle and Smith, 2001). However, it is higher than in
only eight of 29 tribes in the remainder of the contiguous United States and subarctic Canada
(O’Rourke et al., 2000; Malhi et al., 2001; Weiss and Smith, 2003). Haplogroup diversities in
South America are generally lower than in North America, but the haplogroup diversity in Puerto

34
Rico is higher than in only 12 of 31 South American tribes outside Colombia (Demarchi et al.,
2001). In Colombia, the Andes function as a barrier dividing tribes of haplogroup diversities
higher to the east, and lower in the Andes and further west (Keyeux et al., 2002). Hence, the
Puerto Rico haplogroup diversity is higher than that of only five of 10 tribes to the east, but of 11
of 15 tribes in the Andes and further west. West of Colombia in eastern Central America, where
recent population bottlenecks followed by population expansion events have drastically reduced
haplogroup diversity, all five tribes examined have haplogroup diversities lower than Puerto
Rico (Santos et al., 1994; Batista et al., 1995; Kolman et al., 1995; Kolman and Bermingham,
1997). In conclusion, the Puerto Rico haplogroup diversity is within the lower half of tribes in
all regions of the subarctic New World, except for those regions were demographic histories
have been affected by strong and recent population expansion events. It is unlikely that the very
large number of post-Columbian migrants needed to catapult the Amerindian frequency in Puerto
Rico to 61% after the putative total extermination of the native population, arriving from various
Spanish and Portuguese colonies, would by chance form a population of approximately median
haplogroup diversity. More likely, most Amerindian mtDNAs in Puerto Rico have their origin in
the native Taíno population.
The scarcity and the geographic distribution of haplogroup D mtDNAs in Puerto Rico
suggest that it may have been imported during colonial times. Its geographic distribution is
similar to that of Sub-Saharan African mtDNAs, with a higher frequency on the eastern side of
longitude 66o16' W. It is known that, for centuries, one of the main Indian slave harbors in the
Americas was located in Coro, northwestern Venezuela (Sued-Badillo, 1995). It provided plenty
of Indian slaves to Aruba in the 19th century (Nooyen, 1965), where haplogroup D is
predominant (Toro-Labrador et al., 2003), and it is possible that it provided slaves to Puerto Rico

35
in that period of time. However, haplogroup D was found in six of 24 Taíno bone samples from
the La Caleta archaeological site in the Dominican Republic (Lalueza-Fox et al., 2001),
suggesting that genetic differences between Taínos on both islands were larger than the few
cultural differences that have been acknowledged (Veloz-Maggiolo, 1991; Rouse, 1992).
Indian slave trade notwithstanding, the predominance of Amerindian mtDNAs in modern
Puerto Rico coupled with the very large Atlantic slave trade strongly suggests that most of the
Amerindian mtDNAs found are native, and that haplogroup A was predominant among the
Puerto Rico Taínos. Thus, it is intriguing that ancient DNA studies on a total of 43 ancient
remains from three archaeological sites in Cuba and one each in Puerto Rico and the Dominican
Republic have found only one remain belonging to haplogroup A (Sánchez-Crespo, 1999;
Lalueza-Fox et al., 2001, 2003). One explanation for this is that genetic diversity in Taínos may
have existed mostly between and not within settlements. This could be explained by the
matrilineal descent system of the Taínos, in which newborns would join their maternal clan
(Keegan, 1997).
PC analysis was performed in an attempt to associate the Taínos to some continental region.
The general picture that emerged in the PC1-PC3 plot (Fig. 6) was that of regional continuity
affected frequently by population demographic events such as mass population movements,
admixture, and genetic bottlenecks. The populations of five of the six North, Meso and Central
American regions showed some clustering, as did the populations around Lake Titicaca and further
south. All three Eastern North American and four of the five Great Plains populations, which have
experienced population movement and admixture associated with the eastward migration of
Algonquian-speaking groups (Malhi et al., 2001), fell in the bottom-left quadrant. Nine of the 15
North American Southwest populations clustered in the bottom-right quadrant, the two recently

36
arrived (after A.D. 1000) Na-Dene-speaking populations (Navajo and Apache) being among those
scattered. In addition, the four Mesoamerican populations fell close to the axes intersection. In a
fashion similar to that of North American Southwest populations, five of the eight populations of
eastern Central America were found in the upper-right quadrant, the two populations strongly
influenced by recent migrations from Colombia (Emberá and Wounan) (Kolman and Bermingham,
1997) being among the three scattered. Not showing any cohesiveness were the populations of the
North American Southeast, whose populations may have experienced genetic bottlenecks produced
by drastic population declines after contact (Weiss and Smith, 2003), and those from Colombia, the
Amazon, and northern Argentina. Genetic isolation of small populations may have resulted from
the extreme topography of the northern Andes. Larger genetic drift as a consequence of the smaller
effective population sizes that may have resulted from restricted mobility in this topography, and
later through the dense tropical forests of the Amazon, may have been translated into widely
scattered populations in the PC plot for Colombia, the Amazon, and northern Argentina. By
contrast, most of the populations in the highlands around Lake Titicaca and further south that have
been found through control region sequence analysis to have had large long-term effective
population sizes (Fuselli et al., 2003), plotted close to each other. Five of the nine Lake Titicaca
populations formed a cluster in the upper-right quadrant, and all five southern South American
populations fell in the upper-left quadrant.
Our PC analysis failed to give an indication of the possible continental origins of the Taínos.
Their sophisticated social and political organization, their agroceramic culture, religious rituals and
Arawak language unmistakenly reveal the South American origin of their culture. However, the
scattering of Colombian and Amazonian populations in the plot, coupled with the fact that the
Taínos may have developed from the admixture of agroceramic South American cultures with

37
nomads originating elsewhere (Veloz-Maggiolo, 1991; Rouse, 1992), further complicated the
analysis. Clearly, expanded ancient DNA studies must be undertaken to better understand the
prehistoric migrations that gave rise to the Taínos. Studies on modern populations, although
affected by postcolonization migrations, may be useful in guiding and complementing ancient DNA
studies.
The results presented here led us to reinterpret previous results. The 72.5% Amerindian
mtDNA frequency found west of longitude 66o16' W is very similar to the 69.6% reported by
Martínez-Cruzado et al. (2001) for a group composed of 56 people living in communities known
historically for their strong Indian background or volunteers having a mother or maternal
grandmother with Indian-like phenotypic traits. Only four of these 56 people traced their
maternal lineage to the east of longitude 66o16' W, the remainder tracing it to the west. Thus,
their relatively high Amerindian maternal ancestry can be explained simply by the geographical
location of their maternal lineage west of longitude 66o16' W. That is, if they share the location
of their maternal lineages west of longitude 66o16' W, a Puerto Rican with maternal ancestors
with Indian-like phenotypic traits or living in communities known historically for their strong
Indian background is not more likely to have an Amerindian mtDNA than another who does not.
The significantly reduced Amerindian mtDNA frequency (52.6%) obtained from a random
sample of 38 Puerto Ricans (Martínez-Cruzado et al., 2001) can be explained by the high number
of participants that stemmed from east of longitude 66o16' W. If only those tracing their
maternal lineage west of longitude 66o16' W are considered, the difference with the general
population west of longitude 66o16' W turns out to be insignificant (not shown).
Traditional history holds that Indians became extinct from disease, war and slavery,
leaving the whole island for the development of the Spanish colony. However, a new current of

38
thought holds that although the number of Indians was lowered considerably by the conquest,
and that their political, cultural and religious systems disappeared in one or two generations,
many survived and adapted to the conditions imposed by the colonial order, most of them living
away from the colonial towns and plantations, but not in the hostile environment of the mountain
chains (Sued-Badillo, 1995). The numbers of colonial settlers and the lands occupied by them
were small enough to leave sufficient fertile cattle and crop land for Indians and mixed people of
Indian ancestry whose presence was largely ignored by the colonial government, and who
developed into the so-called criollos of the late 18th and 19th centuries. Our overall results and
the observed genetic bipartition defined by longitude 66o16' W strongly support this view.
Twelve of the thirteen sugar-producing mills in Puerto Rico during the 16th century were located
east of longitude 66o16' W (Gelpí-Baíz, 2000). It is thus to be expected that most of the people
related in any way to the colonial society established themselves in this region. However, and by
no reason that could be related to any initiative from Spain, the majority of the population lived
west of longitude 66o16' W by 1776. Our work suggests that these people had a very high
Amerindian ancestry. Furthermore, with the exception of San Juan and surrounding areas, the
eastern side of Puerto Rico was virtually uninhabited (Abbad, 1959). Thus, land availability may
have driven most of the 19th century immigrants to settle east of longitude 66o16' W. Because
most of the immigrants were of non-Amerindian origin, the result was a stronger reduction of the
Amerindian frequency east than west of longitude 66o16' W.
Sub-Saharan African and West Eurasian origins
It is apparent from a review of the literature on the Atlantic slave trade and Puerto Rico
that the coast that extends from Ghana to Cameroon was the largest source of slaves to Puerto

39
Rico, but that large numbers were also brought from the stretch extending from Senegambia to
Sierra Leone, and from Congo and Angola, perhaps in that order, in addition to smaller
contributions from other African regions.
Our PC analysis succeeds in distinguishing the West African populations from those of
Mozambique. Furthermore, it plots the Brazilian population, which must have a very large
Angolan component (Thomas, 1997), separate from both and next to the Bubi population that
lives in the island of Bioko close to the Cameroon coast. This suggests that when sufficient data
from Angola and Congo become available, PC analyses may be able to distinguish clusters
corresponding to West, Southeast, and Central-West Africa.
A geographic gradient can be observed within the West Africa cluster at the left half of
PC1 (Fig. 4), where the frequencies of L1b, L2* and L3b (all more frequent in West Africa than
in other African regions) are the main contributors in that order. Those populations in or very
close to Senegambia are found at the left edge of the cluster and those in or closer to the Gulf of
Guinea toward the right edge. The PC1 order of the populations created by the slave trade is
consistent with historical accounts. The Cape Verde Islands, composed mainly of Senegambians
but having also received people from other African regions, plot at the right edge of the
Senegambian group. São Tomé, located in the Gulf of Guinea, and receiving mainly people
from Ghana to northern Gabon (Tomás et al., 2002), lies at the right edge of the West African
cluster. Brazil, with the largest Angolan and smallest Senegambian components (Salas et al.,
2004), lies to the right of the West African cluster. The Puerto Rico population lies between the
Cape Verde and São Tomé populations, suggesting that it contains a Senegambian component
smaller than that of Cape Verde but larger than that of São Tomé, and Gulf of Guinea, Congo
and Angolan components smaller than those of São Tomé but larger than those of Cape Verde.

40
The PC analysis of West Eurasian mtDNAs suggests that many of the West Eurasian
women arriving to Puerto Rico were non-European in origin. The European populations cluster
tightly, but the Puerto Rico population falls out of the European cluster, and is as close to it as to
the Moroccan cluster in the first plot, and closer to the Turkish-Armenian-Kurdish cluster in the
second (Fig. 5). In addition, 11 of the 18 haplogroup U West Eurasian mtDNAs found in Puerto
Rico are likely not of European origin. This should not be surprising, as the vast majority of the
early colonizers were single men. This fact not only accounts for the disparity between West
Eurasian Y-chromosome and mtDNA frequencies in Puerto Rico (unpublished results), but
generated in the first decades of colonization a demand for white female slaves to the New
World. Historical documents show that in 1512 the Spanish Crown encouraged the exportation
of white female slaves to San Juan (Fernández-Méndez, 1970), and that in 1530 licenses were
granted to export white Moorish slaves to the Americas, including to people with strong ties to
Puerto Rico (Thomas, 1997). Raids of Arab towns produced many slaves for the Spaniards
through the 16th century, and Moorish and Berbers (Álvarez-Nazario, 1974), as well as Slavs and
Turkish (Thomas, 1997), could still be found among slaves late in the 17th century. Moreover, in
the 17th century, poor Canarian farmers moved with their families to Puerto Rico seeking
incentives that were granted as part of a concerted effort to increase the white population of
Puerto Rico (Fernández-Méndez, 1970). The location of the Puerto Rico population outside of
the European cluster in the PC plot suggests that the combined input to Puerto Rico of all these
sources was substantial as compared to the European input.
It is noteworthy that the motif of sequence type 16224-16270, which represents eight
samples and is by far the most frequent among our West Eurasian U mtDNAs (Table 4), has not
been found elsewhere except for one sample each in the Canarian islands of Tenerife and

41
Lanzarote that also possessed a transition at 16093, a site that was not sequenced in our samples.
It is thus evident that the samples possessing the 16224, 16270 motif are related to North Africa,
probably to the Canary Islands, and maybe to the guanches (Canarian natives), because
Lanzarote exhibits a strongly autochthonous genetic makeup (Rando et al., 1999). Furthermore,
two other samples were identified as belonging to the Canarian-specific U6b clade, and one other
to the North African-specific U6a. Thus, 11 of the 18 West Eurasian U mtDNAs may be related
to North Africans. Only the remaining seven samples could be of European origin. Combined
with the PC analysis, this observation suggests that the European contribution to the West
Eurasian mtDNA pool of Puerto Rico could be less than half. That North African and Sub-
Saharan African haplogroup U sequence types can be found at copy numbers of seven and nine,
while those of likely European origin are never found at more than two, suggests that most of the
European mtDNAs were introduced in Puerto Rico late in her history.
CONCLUSIONS
The hierarchical strategy employed here for RFLP mtDNA haplogroup identification was
shown to be effective in the highly admixed population of Puerto Rico. The 10394 DdeI/10397
AluI motif of each sample was determined first, followed by testing the haplogroup-defining
markers of all haplogroups within the predetermined motif, and using HVR-I sequences to resolve
inconclusive results. The effectiveness of the strategy depended largely on the stability of the motif,
which was found to be inconsistent with the mtDNA haplogroup in only 6 of the 800 samples.
Because, with the exception of haplogroup U, all African haplogroups have (+/-) motifs whereas
none of the Amerindian haplogroups are, these results suggest that testing the 10394 DdeI/10397

42
AluI motif is an excellent starting point for sorting out African and Amerindian samples from mixed
populations with high African and Amerindian affinities, such as those in the Caribbean.
The findings here reported are consistent with most historical accounts, with the notable
exception of the high frequency (weighted, 61.3%) of Amerindian mtDNAs found currently in
Puerto Rico, among which haplogroups A (52.4%) and C (36.0%) are the most common. Their
high frequency lead us to the conclusion that most Amerindian mtDNAs in Puerto Rico should stem
from the indigenous Taínos, and that haplogroups A and C were predominant among them. These
results are in agreement with ancient DNA studies only in the high frequency of haplogroup C.
Ancient DNA studies have so far found only one haplogroup A mtDNA among 15 Ciboney remains
in Cuba (Lalueza-Fox et al., 2003), and none in the remains of 24 Taínos in the Dominican Republic
(Lalueza-Fox et al., 2002), and four Pre-Taínos in Puerto Rico (Sánchez-Crespo, 1999).
Furthermore, the low frequency of haplogroup D (2.9%) currently in Puerto Rico and its
concentration in the areas of higher Sub-Saharan African ancestry suggests that it may have been
absent in pre-Columbian Puerto Rico, but it was found in six of the 24 Taíno remains of the
Dominican Republic and in five of the 15 Cuban Ciboney remains. Poor sampling and large genetic
differences between archaeological sites could explain the virtual absence of haplogroup A in
ancient samples. Substantial genetic differences between the islands, consisting of the absence in
Puerto Rico of haplogroup D but its presence elsewhere, may account for the disparity in
haplogroup D frequencies.
Because of their Arawakan culture, Taínos would be expected to be closely related to South
American tribes. A haplogroup frequency-based principal component analysis shows some
compartmentalization of regional populations, but not for Colombian or Amazonian populations,
which tend to show lower effective population sizes, lower haplogroup diversities, and be more

43
susceptible to genetic drift. Hence, these populations scatter widely throughout the plot, and the
Puerto Rico population cannot be related to any particular region.
A principal component plot identifies West Africa as the main supplier of Sub-Saharan
African mtDNAs to Puerto Rico and to other populations created by the slave trade such as São
Tomé and Cape Verde, but not Brazil. The main contributors to the first principal component of
this plot are haplogroups considered West African-specific. This component generates a geographic
gradient in which the westernmost populations of West Africa are placed at the left end of the plot,
and populations further to the east up to the Gulf of Guinea are placed further to the right. Along
this component, Puerto Rico falls between Cape Verde to the left, and São Tomé to the right,
suggesting a West African composition for Puerto Rico intermediate between these two
populations. The strong West African composition of the Sub-Saharan African fraction of Puerto
Rico becomes evident by the relatively high frequency of a U5b HVR-I sequence type previously
found hitherto only in West Africa, and defined here as clade U5b2.
For having been an European colony for 405 years, it would be expected that the West
Eurasian fraction of Puerto Rico would show strong affinities with Europe. Principal component
analysis shows that this is not the case. While European populations tend to cluster tightly, the
Puerto Rico population remains separated from all populations, being approximately equally close
to the European, Moroccan, and Turkish-Armenian-Kurdish clusters. HVR-I sequences of Puerto
Rican haplogroup U mtDNAs show sequence types closely related to North Africa and the Canary
Islands, as well as to Europe. North African and Canarian sequence types are not more varied that
those European but have a higher average copy number, suggesting that their presence in Puerto
Rico preceded that of most Europeans.

44
Within Puerto Rico, the expected difference in African mtDNA frequencies between coastal
and noncoastal municipalities was found to be statistically insignificant. However, a highly
statistically significant difference was found between the eastern and western sides of La Plata
River, east of which most of the 16th century sugar mills were established. The weighted
Amerindian frequency was higher in the western (72.3%) than in the eastern side (50.0%). In
addition, pockets of relatively low Amerindian frequencies were found surrounding harbors.
As the area of the island of Puerto Rico is only 9,104 km2, this work shows how much
population structuring can occur within small regions, especially between metropolitan-
cosmopolitan areas and nearby mountains which may hold old, traditional populations. This
observation suggests that studies based on careful sampling in traditional populations, unaffected by
frequent migrations common in metropolitan areas, may offer further information on the
prehistorical migrations that gave rise to continental populations around the world.
ACKNOWLEDGMENTS
We are deeply indebted to the 800 people who were randomly selected, received us at
their homes, and willingly participated in the project with informed consent. We are very
thankful to T. Arroyo-Cordero, A. Ayala-Rodríguez, H. Cerdá-Ramos, L. Colón-Negrón, J.
Henry-Sánchez, R. Hernández-Rodríguez, J. Irizarry-Ramos, D. Knudson-González, M. Lacourt-
Ventura, H. López-López, R. Lugo-Sánchez, F. Maldonado-Chamorro, N. Martínez-Aquino, A.
Merced-Alejandro, C. Montalvo-Vélez, P. Ochoa-Méndez, J.C. Ortiz-Santiago, T. Pagán-Ortega,
J. Pérez-Sepúlveda, E. Ríos-Santiago, R. Rodríguez-Ramos, F. Rosas-Rivera, A. Seda-Martínez,
C. Varela-Valentín, and L. Vélez-Ortiz, students of the University of Puerto Rico at Mayagüez
(UPRM) who undertook the strenuous task of identifying the selected households and adults,

45
contacting the selected adults, educating them on the project, interviewing them, and collecting
their participating signatures and samples. The significance of this project was greatly enhanced
by the contribution of Walter Díaz and the Center for Applied Social Research (UPRM) in terms
of its sampling frame for survey research and the facilities and resources it provided for data
analysis. Melissa Rodríguez-Sánchez and Mónica Vega-Hernández did a great job entering the
data in the SPSS program. We thank Robert Donnelly for his automated sequencing and
oligonucleotide synthesis services at the Molecular Resources Facility of the University of
Medicine and Dentistry of New Jersey. We are indebted to Julio Quintana, who constructed the
triangular graphic of ancestry distribution among municipalities, Roy Ruiz, who worked Figure
3, and Martin Richards, who provided us the PC computer package. We also thank Duane
Kolterman and John Uscian for reviewing our manuscript before submission, and two excellent
anonymous reviewers for their superb job. This project was supported by the National Science
Foundation Physical Anthropology Program grant SBR-9904252 to JCMC.

46
LITERATURE CITED
Abbad FI. 1959. Historia geográfica, civil y natural de la Isla de San Juan Bautista de
Puerto Rico. San Juan, Puerto Rico: Ediciones de la Universidad de Puerto Rico.
Alegría RE. 1985. Notas sobre la procedencia cultural de los esclavos negros de Puerto
Rico durante la segunda mitad del siglo XVI. La Revista del Centro de Estudios Avanzados de
Puerto Rico y el Caribe 1:58-79.
Alegría M, McGuire T, Vera M, Canino G, Matías L, and Calderón J. 2001. Changes in
access to mental health care among the poor and nonpoor: results from the health care reform in
Puerto Rico. Am J Public Health 91:1431-1434.
Álvarez-Nazario M. 1974. El elemento afronegroide en el español de Puerto Rico. San
Juan, Puerto Rico: Instituto de Cultura Puertorriqueña.
Alves-Silva J, da Silva Santos M, Guimarães PEM, Ferreira ACS, Bandelt HJ, Peña SDJ,
and Ferreira Prado V. 2000. The ancestry of Brazilian mtDNA lineages. Am J Hum Genet
67:444-461.
Anderson S, Bankier AT, Barrell BG, de Bruijn MHL, Coulson AR, Drouin J, Eperon IC,
Nierlich DP, Roe BA, Sanger F, Schreier PH, Smith AJH, Staden R, and Young IG. 1981.
Sequence and organization of the human mitochondrial genome. Nature 290:457-465.
Andrews RM, Kubacka I, Chinnery PF, Lightowlers RN, Turnbull DM, and Howell N.
1999. Reanalysis and revision of the Cambridge reference sequence for human mitochondrial
DNA. Nature Genetics 23:147.
Bailliet G, Rothhammer F, Carnese FR, Bravi CM, and Bianchi NO. 1994. Founder
mitochondrial haplotypes in Amerindian populations. Am J Hum Genet 54:27-33.

47
Ballinger SW, Schurr TG, Torroni A, Gan YY, Hodge JA, Hassan K, Chen KH, and
Wallace DC. 1992. Southeast Asian mitochondrial DNA analysis reveals genetic continuity of
ancient Mongoloid migrations. Genetics 130:139-152.
Bamshad M, Kivisild T, Watkins WS, Dixon ME, Ricker CE, Rao BB, Naidu JM, Prasad
BVR, Reddy PG, Rasanayagam A, Papiha SS, Villems R, Redd AJ, Hammer MF, Nguyen SV,
Carroll ML, Batzer MA, and Jorde LB. 2001. Genetic evidence on the origins of Indian caste
populations. Genome Res 11:994-1004.
Batista O, Kolman CJ, and Bermingham E. 1995. Mitochondrial DNA diversity in the
Kuna Amerinds of Panamá. Hum Mol Genet 4:921-929.
Batista dos Santos SE, Rodrigues JD, Ribeiro dos Santos AKC, and Zago MA. 1999.
Differential contribution of indigenous men and women to the formation of an urban population
in the Amazon region as revealed by mtDNA and Y-DNA. Am J Phys Anthropol 109:175-180.
Bert F, Corella A, Gené M, Pérez-Pérez A, and Turbón D. 2001. Major mitochondrial
DNA haplotype heterogeneity in highland and lowland Amerindian populations from Bolivia.
Hum Biol 73:1-16.
Betty DJ, Chin-Atkins AN, Croft L, Sraml M, and Easteal S. 1996. Multiple independent
origins of the COII/tRNALys intergenic 9-bp mtDNA deletion in aboriginal Australians. Am J
Hum Genet 58:428-433.
Bortolini MC, Salzano FM, Bau CHD, Layrisse Z, Petzl-Erler ML, Tsuneto LT, Hill K,
Hurtado AM, Castro-de-Guerra D, Bedoya G, and Ruiz-Linares A. 2002. Y-chromosome
biallelic polymorphisms and Native American population structure. Ann Hum Genet 66:255-259.
Bortolini MC, Salzano FM, Thomas MG, Stuart S, Nasanen SPK, Bau CHD, Hutz MH,
Layrisse Z, Petzl-Erler ML, Tsuneto LT, Hill K, Hurtado AM, Castro-de-Guerra D, Torres MM,

48
Groot H, Michalski R, Nymadawa P, Bedoya G, Bradman N, Labuda D, and Ruiz-Linares A.
2003. Y-chromosome evidence for differing ancient demographic histories in the Americas. Am
J Hum Genet 73:524-539.
Brakez Z, Bosch E, Izaabel H, Akhayat O, Comas D, Bertranpetit J, and Calafell F. 2001.
Human mitochondrial DNA sequence variation in the Moroccan population of the Souss area.
Ann Hum Biol 28:295-307.
Brau S. 1904. Historia de Puerto Rico. New York: Appleton and Co.
Brehm A, Pereira L, Bandelt HJ, Prata MJ, and Amorim A. 2002. Mitochondrial portrait
of the Cabo Verde archipelago: the Senegambian outpost of Atlantic slave trade. Ann Hum
Genet 66:49-60.
Brown MD, Hosseini SH, Torroni A, Bandelt HJ, Allen JC, Schurr TG, Scozzari R,
Cruciani F, and Wallace DC. 1998. mtDNA haplogroup X: an ancient link between
Europe/Western Asia and North America? Am J Hum Genet 63:1852-1861.
Brown MD, Sun F, and Wallace DC. 1997. Clustering of Caucasian Leber Hereditary
Optic Neuropathy patients containing the 11778 or 14484 mutations on an mtDNA lineage. Am J
Hum Genet 60:381-387.
Carvajal-Carmona LG, Soto ID, Pineda N, Ortiz-Barrientos D, Duque C, Ospina-Duque
J, McCarthy M, Montoya P, Álvarez VM, Bedoya G, and Ruiz-Linares A. 2000. Strong
Amerind/white sex bias and a possible Sephardic contribution among the founders of a
population in Northwest Colombia. Am J Hum Genet 67:1287-1295.
Carvalho-Silva DR, Santos FR, Rocha J, and Peña SDJ. 2001. The phylogeography of
Brazilian Y-chromosome lineages. Am J Hum Genet 68:281-286.

49
Chen YS, Olckers A, Schurr TG, Kogelnik AM, Huoponen K, and Wallace DC. 2000.
mtDNA variation in the South African Kung and Khwe-and their genetic relationships to other
African populations. Am J Hum Genet 66:1362-1383.
Chen YS, Torroni A, Excoffier L, Santachiara-Benerecetti AS, and Wallace DC. 1995.
Analysis of mtDNA variation in African populations reveals the most ancient of all human
continent-specific haplogroups. Am J Hum Genet 57:133-149.
Clark VJ, Sivendren S, Saha N, Bentley GR, Aunger R, Sirajuddin SM, and Stoneking
M. 2000. The 9-bp deletion between the mitochondrial lysine tRNA and COII genes in tribal
populations of India. Hum Biol 72:273-285.
Colón HM, Robles RR, Canino G, and Sahai H. 2001. Prevalence and correlates of DSM-
IV substance use disorders in Puerto Rico. Bol Asoc Med PR 93:12-22.
Comas D, Calafell F, Mateu E, Pérez-Lezaun A, Bosch E, Martínez-Arias R, Clarimon J,
Facchini F, Fiori G, Luiselli D, Pettener D, and Bertranpetit J. 1998. Trading genes along the silk
road: mtDNA sequences and the origin of Central Asian populations. Am J Hum Genet 63:1824-
1838.
Côrte-Real HBSM, Macaulay VA, Richards MB, Hariti G, Issad MS, Cambon-Thomsen
A, Papiha S, Bertranpetit J, and Sykes BC. 1996. Genetic diversity in the Iberian Peninsula
determined from mitochondrial sequence analysis. Ann Hum Genet 60:331-350.
Cruciani F, Santolamazza P, Shen P, Macaulay V, Moral P, Olckers A, Modiano D,
Holmes S, Destro-Bisol G, Coia V, Wallace DC, Oefner PJ, Torroni A, Cavalli-Sforza LL,
Scozzari R, and Underhill PA. 2002. A back migration from Asia to Sub-Saharan Africa is
supported by high-resolution analysis of human Y-chromosome haplotypes. Am J Hum Genet
70:1197-1214.

50
Demarchi DA, Panzetta-Dutari GM, Motran CC, López de Basualdo MA, and Marcellino
AJ. 2001. Mitochondrial DNA haplogroups in Amerindian populations from the Gran Chaco.
Am J Phys Anthropol 115:199-203.
Díaz-Soler LM. 2000. Historia de la esclavitud negra en Puerto Rico. San Juan, Puerto
Rico: Editorial de la Universidad de Puerto Rico.
Fernández-Cobo M, Jobes DV, Yanagihara R, Nerurkar VR, Yamamura Y,
Ryschkewitsch CF, and Stoner GL. 2001. Reconstructing population history using JC virus:
Amerinds, Spanish, and Africans in the ancestry of modern Puerto Ricans. Hum Biol 73:385-
402.
Fernández-Méndez E. 1970. Historia cultural de Puerto Rico. San Juan, Puerto Rico:
Ediciones El Cemí.
Fernández-Méndez. 2000. Desarrollo histórico de la sociedad puertorriqueña. In: Padilla-
Rodríguez C, editor. ¿Qué somos? San Juan, Puerto Rico: Instituto de Cultura Puertorriqueña. p
51-80.
Finnilä S, Hassinen IE, Ala-Kokko L, and Majamaa K. 2000. Phylogenetic network of
the mtDNA haplogroup U in northern Finland based on sequence analysis of the complete
coding region by conformative-sensitive gel electrophoresis. Am J Hum Genet 66:1017-1026.
Finnilä S, Lehtonen MS, and Majamaa K. 2001. Phylogenetic network for European
mtDNA. Am J Hum Genet 68:1475-1484.
Forster P, Torroni A, Renfrew C, and Röhl A. 2001. Phylogenetic star contraction applied
to Asian and Papuan mtDNA evolution. Mol Biol Evol 18:1864-1881.

51
Fuselli S, Tarazona-Santos E, Dupanloup I, Soto A, Luiselli D, and Pettener D. 2003.
Mitochondrial DNA diversity in South America and the genetic history of Andean highlanders.
Mol Biol Evol 20:1682-1691.
Gelpí-Baíz E. 2000. Siglo en blanco. San Juan, Puerto Rico: Editorial de la Universidad
de Puerto Rico.
Ginther C, Corach D, Penacino GA, Rey JA, Carnese FR, Hutz MH, Anderson A, Just J,
Salzano FM, and King MC. 1993. Genetic variation among the Mapuche Indians from the
Patagonian region of Argentina: Mitochondrial DNA sequence variation and allele frequencies
of several nuclear genes. In: Peña SDJ, Chakraborty R, Epplen JT, Jeffreys AJ, editors. DNA
fingerprinting: state of the science. Switzerland: Birkhauser Verlag Bassel. p 211-219.
Graven L, Passarino G, Semino O, Boursot P, Santachiara-Benerecetti S, Langaney A,
and Excoffier L. 1995. Evolutionary correlation between control region sequence and restriction
polymorphisms in the mitochondrial genome of a large Senegalese Mandenka sample. Mol Biol
Evol 12:334-345.
Green LD, Derr JN, and Knight A. 2000. mtDNA affinities of the peoples of North-
Central Mexico. Am J Hum Genet 66:989-998.
Hammer MF, Karafet TM, Redd AJ, Jarjanazi H, Santachiara-Benerecetti S, Soodyall H,
and Zegura SL. 2001. Hierarchical patterns of global human Y-chromosome diversity. Mol Biol
Evol 18:1189-1203.
Hanis CL, Hewett-Emmett D, Bertin TK, and Schull WJ. 1991. Origins of US Hispanics:
implications for diabetes. Diabetes Care 14:618-627.
Herrnstadt C, Elson JL, Fahy E, Preston G, Turnbull DM, Anderson C, Ghosh SS,
Olefsky JM, Beal MF, Davis RE, and Howell N. 2002. Reduced-median-network analysis of

52
complete mitochondrial DNA coding-region sequences for the major African, Asian, and
European haplogroups. Am J Hum Genet 70:1152-1171.
Hofmann S, Jaksch M, Bezold R, Mertens S, Aholt S, Paprotta A, and Gerbitz KD. 1997.
Population genetics and disease susceptibility: characterization of central European haplogroups
by mtDNA gene mutations, correlation with D loop variants and association with disease. Hum
Mol Genet 6:1835-1846.
Horai S, Kondo R, Nakagawa-Hattori Y, Hayashi S, Sonoda S, and Tajima K. 1993.
Peopling of the Americas, founded by four major lineages of mitochondrial DNA. Mol Biol Evol
10:23-47.
Howell N, Oostra RJ, Bolhuis PA, Spruijt L, Clarke LA, Mackey DA, Preston G, and
Herrnstadt C. 2003. Sequence analysis of the mitochondrial genomes from Dutch pedigrees with
Leber Hereditary Optic Neuropathy. Am J Hum Genet 72:1460-1469.
Huoponen K, Torroni A, Wickman PR, Sellitto D, Gurley DS, Scozzari R, and Wallace
DC. 1997. Mitochondrial DNA and Y chromosome-specific polymorphisms in the Seminole
tribe of Florida. Eur J Hum Genet 5:25-34.
Hurles ME, Irven C, Nicholson J, Taylor PG, Santos FR, Loughlin J, Jobling MA, and
Sykes BC. 1998. European Y-chromosomal lineages in Polynesians: a contrast to the population
structure revealed by mtDNA. Am J Hum Genet 63:1793-1806.
Hutchin T, and Cortopassi G. 1995. A mitochondrial DNA clone is associated with
increased risk for Alzheimer disease. Proc Natl Acad Sci USA 92:6892-6895.
Johns DR, and Berman J. 1991. Alternative, simultaneous Complex I mitochondrial DNA
mutations in Leber's Hereditary Optic Neuropathy. Biochem Biophys Res Commun 174:1324-
1330.

53
Kaestle FA, and Smith DG. 2001. Ancient mitochondrial DNA evidence for prehistoric
population movement: the Numic expansion. Am J Phys Anthropol 115:1-12.
Karafet T, Xu L, Du R, Wang W, Feng S, Wells RS, Redd AJ, Zegura SL, and Hammer
MF. 2001. Paternal population history of East Asia: sources, patterns, and microevolutionary
processes. Am J Hum Genet 69:615-628.
Kayser M, Brauer S, Weiss G, Schiefenhövel W, Underhill PA, and Stoneking M. 2001.
Independent histories of human Y chromosomes from Melanesia and Australia. Am J Hum
Genet 68:173-190.
Keegan WF. 1997. "No man [or woman] is an island": elements of Taíno social
organization. In: Wilson SM, editor. The indigenous people of the Caribbean. Gainesville:
University Press of Florida. p 111-117.
Keyeux G, Rodas C, Gelvez N, and Carter D. 2002. Possible migration routes into South
America deduced from mitochondrial DNA studies in Colombian Amerindian populations. Hum
Biol 74:211-233.
Kivisild T, Bamshad MJ, Kaldma K, Metspalu M, Metspalu E, Reidla M, Laos S, Parik J,
Watkins WS, Dixon ME, Papiha SS, Mastana SS, Mir MR, Ferak V, and Villems R. 1999. Deep
common ancestry of Indian and western-Eurasian mitochondrial lineages. Curr Biol 9:1331-
1334.
Kivisild T, Tolk HV, Parik J, Wang Y, Papiha SS, Bandelt HJ, and Villems R. 2002. The
emerging limbs and twigs of the East Asian mtDNA tree. Mol Biol Evol 19:1737-1751.
Kolman CJ, and Bermingham E. 1997. Mitochondrial and nuclear DNA diversity in the
Chocó and Chibcha Amerinds of Panamá. Genetics 147:1289-1302.

54
Kolman CJ, Bermingham E, Cooke R, Ward RH, Arias TD, and Guionneau-Sinclair F.
1995. Reduced mtDNA diversity in the Ngöbé Amerinds of Panamá. Genetics 140:275-283.
Kong QP, Yao YG, Sun C, Bandelt HJ, Zhu CL, and Zhang YP. 2003. Phylogeny of East
Asian mitochondrial DNA lineages inferred from complete sequences. Am J Hum Genet 73:671-
676.
Krings M, Salem AH, Bauer K, Geisert H, Malek AK, Chaix L, Simon C, Welsby D, Di
Rienzo A, Utermann G, Sajantila A, Pääbo S, and Stoneking M. 1999. mtDNA analysis of Nile
River Valley populations: a genetic corridor or a barrier to migration? Am J Hum Genet
64:1166-1176.
Lalueza-Fox C, Gilbert MTP, Martínez-Fuentes AJ, Calafell F, and Bertranpetit J. 2003.
Mitochondrial DNA from Pre-Columbian Ciboneys from Cuba and the prehistoric colonization
of the Caribbean. Am J Phys Anthropol 121:97-108.
Lalueza-Fox C, Luna-Calderón F, Calafell F, Morera B, and Bertranpetit J. 2001.
MtDNA from extinct Taínos and the peopling of the Caribbean. Ann Hum Genet 65:137-151.
Lamminen T, Huoponen K, Sistonen P, Juvonen V, Lahermo P, Aula P, Nikoskelainen E,
and Savontaus ML. 1997. mtDNA haplotype analysis in Finnish families with Leber Hereditary
Optic Neuropathy. Eur J Hum Genet 5:271-279.
Lell JT, Sukernik RI, Starikovskaya YB, Su B, Jin L, Schurr TG, Underhill PA, and
Wallace DC. 2002. The dual origin and Siberian affinities of Native American Y chromosomes.
Am J Hum Genet 70:192-206.
Lorenz JG, and Smith DG. 1996. Distribution of four founding mtDNA haplogroups
among native North Americans. Am J Phys Anthropol 101:307-323.

55
Maca-Meyer N, González AM, Larruga JM, Flores C, and Cabrera VM. 2001. Major
genomic mitochondrial lineages delineate early human expansions. BMC Genetics 2:13.
Macaulay V, Richards M, Hickey E, Vega E, Cruciani F, Guida V, Scozzari R, Bonné-
Tamir B, Sykes B, and Torroni A. 1999. The emerging tree of West Eurasian mtDNAs: a
synthesis of control-region sequences and RFLPs. Am J Hum Genet 64:232-249.
Malaspina P, Tsopanomichalou M, Duman T, Stefan M, Silvestri A, Rinaldi B, García O,
Giparaki M, Plata E, Kozlov AI, Barbujani G, Vernesi C, Papola F, Ciavarella G, Kovatchev D,
Kerimova MG, Anagnou N, Gavrila L, Veneziano L, Akar N, Loutradis A, Michalodimitrakis
EN, Terrenato L, and Novelletto A. 2001. A multistep process for the dispersal of a Y
chromosomal lineage in the Mediterranean area. Ann Hum Genet 65:339-349.
Malhi RS, Mortensen HM, Eshleman JA, Kemp BM, Lorenz JG, Kaestle FA, Johnson
JR, Gorodezky C, and Smith DG. 2003. Native American mtDNA prehistory in the American
Southwest. Am J Phys Anthropol 120:108-124.
Malhi RS, Schultz BA, and Smith DG. 2001. Distribution of mitochondrial DNA lineages
among Native American tribes of northeastern North America. Hum Biol 73:17-55.
Malyarchuk BA, Grzybowski T, Derenko MV, Czarny J, Wo niak M, and Mi cicka-
liwka D. 2002. Mitochondrial DNA variability in Poles and Russians. Ann Hum Genet
66:261-283.
Martínez-Cruzado, JC, Toro-Labrador G, Ho-Fung V, Estévez-Montero M, Lobaina-
Manzanet A, Padovani-Claudio DA, Sánchez-Cruz H, Ortiz-Bermúdez P, and Sánchez-Crespo
A. 2001. Mitochondrial DNA analysis reveals substantial Native American ancestry in Puerto
Rico. Hum Biol 73:491-511.

56
Mateu E, Comas D, Calafell F, Pérez-Lezaun A, Abade A, and Bertranpetit J. 1997. A
tale of two islands: population history and mitochondrial DNA sequence variation of Bioko and
São Tomé, Gulf of Guinea. Ann Hum Genet 61:507-518.
Merriwether DA, and Ferrell RE. 1996. The four founding lineage hypothesis for the
New World: a critical reevaluation. Mol Phylogenet Evol 5:241-246.
Merriwether DA, Rothhammer F, and Ferrell RE. 1995. Distribution of the four founding
lineage haplotypes in Native Americans suggests a single wave of migration for the New World.
Am J Phys Anthropol 98:411-430.
Mesa NR, Mondragón MC, Soto ID, Parra MV, Duque C, Ortiz-Barrientos D, García LF,
Vélez ID, Bravo ML, Múnera JG, Bedoya G, Bortolini MC, and Ruiz-Linares A. 2000.
Autosomal, mtDNA, and Y-chromosome diversity in Amerinds: pre- and post-Columbian
patterns of gene flow in South America. Am J Hum Genet 67:1277-1286.
Mishmar D, Ruiz-Pesini E, Golik P, Macaulay V, Clark AG, Hosseini S, Brandon M,
Easley K, Chen E, Brown MD, Sukernik RI, Olckers A, and Wallace DC. 2003. Natural
selection shaped regional mtDNA variation in humans. Proc Natl Acad Si USA 100:171-176.
Moraga ML, Rocco P, Miquel JF, Nervi F, Llop E, Chakraborty R, Rothhammer F, and
Carvallo P. 2000. Mitochondrial DNA polymorphisms in Chilean aboriginal populations:
implications for the peopling of the southern cone of the continent. Am J Phys Anthropol
113:19-29.
Negrón-Portillo M, and Mayo-Santana R. 1992. La esclavitud urbana en San Juan de
Puerto Rico: estudio del registro de esclavos de 1872. Río Piedras, Puerto Rico: Ediciones
Huracán.
Nooyen RH. 1965. Millefiori di Aruba. Aruba: Stitching Aruba Nostra.

57
Oota H, Kitano T, Jin F, Yuasa I, Wang L, Shintaroh U, Saitou N, and Stoneking M.
2002. Extreme mtDNA homogeneity in continental Asian populations. Am J Phys Anthropol
118:146-153.
O’Rourke DH, Hayes MG, and Carlyle SW. 2000. Spatial and temporal stability of
mtDNA haplogroup frequencies in native North America. Hum Biol 72:15-34.
Pereira L, Gusmão L, Alves C, Amorim A, and Prata MJ. 2002. Bantu and European Y-
lineages in Sub-Saharan Africa. Ann Hum Genet 66:369-378.
Pinto F, González AM, Hernández M, Larruga JM, and Cabrera VM. 1996. Genetic
relationship between the Canary Islanders and their African and Spanish ancestors inferred from
mitochondrial DNA sequences. Ann Hum Genet 60:321-330.
Quintana-Murci L, Semino O, Bandelt HJ, Passarino G, McElreavey K, and Santachiara-
Benerecetti S. 1999. Genetic evidence of an early exit of Homo sapiens sapiens from Africa
through eastern Africa. Nature Genetics 23:437-441.
Rando JC, Cabrera VM, Larruga JM, Hernández M, González AM, Pinto F, and Bandelt
HJ. 1999. Phylogeographic patterns of mtDNA reflecting the colonization of the Canary Islands.
Ann Hum Genet 63:413-428.
Rando JC, Pinto F, González AM, Hernández M, Larruga JM, Cabrera VM, and Bandelt
HJ. 1998. Mitochondrial DNA analysis of Northwest African populations reveals genetic
exchanges with European, Near-Eastern, and sub-Saharan populations. Ann Hum Genet 62:531-
550.
Reidla M, Kivisild T, Metspalu E, Kaldma K, Tambets K, Tolk HV, Parik J, Loogväli
EL, Derenko M, Malyarchuk B, Bermisheva M, Zhadanov S, Pennarun E, Gubina M, Golubenko
M, Damba L, Fedorova S, Gusar V, Grechanina E, Mikerezi I, Moisan JP, Chaventré A,

58
Khusnutdinova E, Osipova L, Stepanov V, Voevoda M, Achilli A, Rengo C, Rickards O, De
Stefano GF, Papiha S, Beckman L, Janicijevic B, Rudan P, Anagnou N, Michalodimitrakis E,
Koziel S, Usanga E, Geberhiwot T, Herrnstadt C, Howell N, Torroni A, and Villems R. 2003.
Origin and diffusion of mtDNA haplogroup X. Am J Hum Genet 73:1178-1190.
Richards M, Macaulay V, Hickey E, Vega E, Sykes B, Guida V, Rengo C, Sellitto D,
Cruciani F, Kivisild T, Villems R, Thomas M, Rychkov S, Rychkov O, Rychkov Y, Gölge M,
Dimitrov D, Hill E, Bradley D, Romano V, Calì F, Vona G, Demaine A, Papiha S,
Triantaphyllidis C, Stefanescu G, Hatina J, Belledi M, Di Rienzo A, Novelletto A, Oppenheim
A, Nørby S, Al-Zaheri N, Santachiara-Benerecetti AS, Scozzari R, Torroni A, and Bandelt HJ.
2000. Tracing European founder lineages in the Near Eastern mtDNA pool. Am J Hum Genet
67:1251-1276.
Richards M, Macaulay V, Torroni A, and Bandelt HJ. 2002. In search of geographical
patterns in European mitochondrial DNA. Am J Hum Genet 71:1168-1174.
Rickards O, Martínez-Labarga C, Lum JK, De Stefano GF, and Cann RL. 1999. mtDNA
history of the Cayapa Amerinds of Ecuador: detection of additional founding lineages for the
Native American populations. Am J Hum Genet 65:519-530.
Rodas C, Gelvez N, and Keyeux G. 2003. Mitochondrial DNA studies show
asymmetrical Amerindian admixture in Afro-Colombian and mestizo populations. Hum Biol
75:13-30.
Rosser ZH, Zerjal T, Hurles ME, Adojaan M, Alavantic D, Amorim A, Amos W,
Armenteros M, Arroyo E, Barbujani G, Beckman G, Beckman L, Bertranpetit J, Bosch E,
Bradley D, Brede G, Cooper G, Côrte-Real HBSM, de Knijff P, Decorte R, Dubrova YE,
Evgrafov O, Gilissen A, Glisic S, Gölge M, Hill EW, Jeziorowska A, Kalaydjieva L, Kayser M,

59
Kivisild T, Kravchenko SA, Krumina A, Kučinskas V, Lavinha J, Livshits LA, Malaspina P,
Maria S, McElreavey K, Meitinger TA, Mikelsaar AV, Mitchell RJ, Nafa K, Nicholson J, Nørby
S, Pandya A, Parik J, Patsalis PC, Pereira L, Peterlin B, Pielberg G, Prata MJ, Previderé C,
Roewer L, Rootsi S, Rubinsztein DC, Saillard J, Santos FR, Stefanescu G, Sykes BC, Tolun A,
Villems R, Tyler-Smith C, and Jobling MA. 2000. Y-chromosomal diversity in Europe is clinal
and influenced primarily by geography, rather than by language. Am J Hum Genet 67:1526-
1543.
Rouse I. 1992. The Taínos: rise and decline of the people who greeted Columbus. New
Haven, Connecticut: Yale University Press.
Ruiz-Pesini E, Lapeña AC, Diez-Sánchez C, Pérez-Martos A, Montoya J, Álvarez E,
Díaz M, Urriés A, Montoro L, López-Pérez MJ, and Enríquez JA. 2000. Human mtDNA
haplogroups associated with high or reduced spermatozoa motility. Am J Hum Genet 67:682-
696.
Salas A, Richards M, De la Fe T, Lareu MV, Sobrino B, Sánchez-Diz P, Macaulay V,
and Carracedo A. 2002. The making of the African mtDNA landscape. Am J Hum Genet
71:1082-1111.
Salas A, Richards M, Lareu MV, Scozzari R, Coppa A, Torroni A, Macaulay V, and
Carracedo A. 2004. The African diaspora: mitochondrial DNA and the Atlantic Slave Trade. Am
J Hum Genet 74:454-465.
Sánchez-Crespo A. 1999. Variación genética en una población indígena en Puerto Rico.
MSc thesis. Mayagüez, Puerto Rico: University of Puerto Rico.
Sanger JP, Gannett H, and Wilcox WF. 1900. 1899 census report of Puerto Rico.
Washington, DC: Government Printing Office.

60
Santos M, Ward RH, and Barrantes R. 1994. mtDNA variation in the Chibcha
Amerindian Huetar from Costa Rica. Hum Biol 66:963-977.
Schurr TG, and Wallace DC. 2002. Mitochondrial DNA diversity in Southeast Asian
populations. Hum Biol 74:431-452.
Scozzari R, Cruciani F, Santolamazza P, Sellitto D, Cole DEC, Rubin LA, Labuda D,
Marini E, Succa V, Vona G, and Torroni A. 1997. mtDNA and Y chromosome-specific
polymorphisms in modern Ojibwa: implications about the origin of their gene pool. Am J Hum
Genet 60:241-244.
Semino O, Santachiara-Benerecetti AS, Falaschi F, Cavalli-Sforza LL, and Underhill PA.
2002. Ethiopians and Khoisan share the deepest clades of the human Y-chromosome phylogeny.
Am J Hum Genet 70:265-268.
Silva WA, Bonatto SL, Holanda AJ, Ribeiro-dos-Santos AK, Paixao BM, Goldman GH,
Abe-Sandes K, Rodriguez-Delfin L, Barbosa M, Pacó-Larson ML, Petzl-Erler ML, Valente V,
Santos SEB, and Zago MA. 2002. Mitochondrial genome diversity of Native Americans supports
a single early entry of founder populations into America. Am J Hum Genet 71:187-192.
Soodyall H, Vigilant L, Hill AV, Stoneking M, and Jenkins T. 1996. mtDNA control
region sequence variation suggests multiple independent origins of an "Asian-specific" 9-bp
deletion in Sub-Saharan Africans. Am J Hum Genet 58:595-608.
Starikovskaya YB, Sukernik RI, Schurr TG, Kogelnik AM, and Wallace DC. 1998.
mtDNA diversity in Chukchi and Siberian Eskimos: implications for the genetic history of
ancient Beringia and the peopling of the New World. Am J Hum Genet 63:1473-1491.
Sued-Badillo J. 1995. The theme of the indigenous in the national projects of the
Hispanic Caribbean. In: Schmidt PR, Patterson TC, editors. Making alternative histories: the

61
practice of archaeology and history in non-Western settings. Santa Fe, New Mexico: School of
American Research Press. p 25-46.
Tajima F. 1989. Statistical method for testing the neutral mutation hypothesis by DNA
polymorphism. Genetics 123:585-595.
Tapia A. 1945. Biblioteca histórica de Puerto Rico. San Juan, Puerto Rico: Instituto de
Literatura Puertorriqueña.
Thomas H. 1997. The slave trade: the story of the Atlantic Slave Trade: 1440 - 1870.
New York: Simon & Schuster.
Tomás G, Seco L, Seixas S, Faustino P, Lavinha J, and Rocha J. 2002. The peopling of
São Tomé (Gulf of Guinea): origins of slave settlers and admixture with the Portuguese. Hum
Biol 74:397-411.
Toro-Labrador G, Wever OR, and Martínez-Cruzado JC. 2003. Mitochondrial DNA
analysis in Aruba: strong maternal ancestry of closely related Amerindians and implications for
the peopling of northwestern Venezuela. Carib J Sci 39:11-22.
Torroni A, Bandelt HJ, Macaulay V, Richards M, Cruciani F, Rengo C, Martínez-Cabrera
V, Villems R, Kivisild T, Metspalu E, Parik J, Tolk HV, Tambets K, Forster P, Karger B,
Francalacci P, Rudan P, Janicijevic B, Rickards O, Savontaus ML, Huoponen K, Laitinen V,
Koivumäki S, Sykes B, Hickey E, Novelletto A, Moral P, Sellitto D, Coppa A, Al-Zaheri N,
Santachiara-Benerecetti AS, Semino O, and Scozzari R. 2001a. A signal, from human mtDNA,
of postglacial recolonization in Europe. Am J Hum Genet 69:844-852.
Torroni A, Chen YS, Semino O, Santachiara-Benerecetti AS, Scott CR, Lott MT, Winter
M, and Wallace DC. 1994a. mtDNA and Y-chromosome polymorphisms in four Native
American populations from Southern Mexico. Am J Hum Genet 54:303-318.

62
Torroni A, Huoponen K, Francalacci P, Petrozzi M, Morelli L, Scozzari R, Obinu D,
Savontaus ML, and Wallace DC. 1996. Classification of European mtDNAs from an analysis of
three European populations. Genetics 144:1835-1850.
Torroni A, Lott MT, Cabell MF, Chen YS, Lavergne L, and Wallace DC. 1994b. mtDNA
and the origin of Caucasians: identification of ancient Caucasian-specific haplogroups, one of
which is prone to a recurrent somatic duplication in the D-loop region. Am J Hum Genet 55:760-
776.
Torroni A, Miller JA, Moore LG, Zamudio S, Zhuang J, Droma T, and Wallace DC.
1994c. Mitochondrial DNA analysis in Tibet: implications for the origin of the Tibetan
population and its adaptation to high altitude. Am J Phys Anthropol 93:189-199.
Torroni A, Neel JV, Barrantes R, Schurr TG, and Wallace DC. 1994d. Mitochondrial
DNA "clock" for the Amerinds with its implications for timing their entry into North America.
Proc Natl Acad Sci USA 91:1158-1162.
Torroni A, Petrozzi M, D'Urbano L, Sellitto D, Zeviani M, Carrara F, Carducci C, Leuzzi
V, Carelli V, Barboni P, De Negri A, and Scozzari R. 1997. Haplotype and phylogenetic analysis
suggest that one European-specific mtDNA background plays a role in the expression of Leber
Hereditary Optic Neuropathy by increasing the penetrance of the primary mutations 11778 and
14484. Am J Hum Genet 60:1107-1121.
Torroni A, Rengo C, Guida V, Cruciani F, Sellitto D, Coppa A, Luna-Calderón F,
Simionati B, Valle G, Richards M, Macaulay V, and Scozzari R. 2001b. Do the four clades of
the mtDNA haplogroup L2 evolve at different rates? Am J Hum Genet 69:1348-1356.

63
Torroni A, Schurr TG, Cabell MF, Brown MD, Neel JV, Larsen M, Smith DG, Vullo
CM, and Wallace DC. 1993a. Asian affinities and continental radiation of the four founding
Native American mtDNAs. Am J Hum Genet 53:563-590.
Torroni A, Schurr TG, Yang CC, Szathmary EJE, Williams RC, Schanfield MS, Troup
GA, Knowler WC, Lawrence DN, Weiss KM, and Wallace DC. 1992. Native American
mitochondrial DNA analysis indicates that the Amerind and the Nadene populations were
founded by two independent migrations. Genetics 130:153-162.
Torroni A, Sukernik RI, Schurr TG, Starikovskaya YB, Cabell MF, Crawford MH,
Comuzzie AG, and Wallace DC. 1993b. mtDNA variation of aboriginal Siberians reveals
distinct genetic affinities with Native Americans. Am J Hum Genet 53:591-608.
Underhill PA, Passarino G, Lin AA, Shen P, Lahr MM, Foley RA, Oefner PJ, and
Cavalli-Sforza LL. 2001. The phylogeography of Y chromosome binary haplotypes and the
origins of modern human populations. Ann Hum Genet 65:43-62.
van der Walt JM, Nicodemus KK, Martin ER, Scott WK, Nance MA, Watts RL, Hubble
JP, Haines JL, Koller WC, Lyons K, Pahwa R, Stern MB, Colcher A, Hiner BC, Jankovic J,
Ondo WG, Allen Jr FH, Goetz CG, Small GW, Mastaglia F, Stajich JM, McLaurin AC,
Middleton LT, Scott BL, Schmechel DE, Pericak-Vance MA, and Vance JM. 2003.
Mitochondrial polymorphisms significantly reduce the risk of Parkinson Disease. Am J Hum
Genet 72:804-811.
Veloz-Maggiolo M. 1991. Panorama histórico del Caribe precolombino. Dominican
Republic: Banco Central de la República Dominicana.
Ward RH, Salzano FM, Bonatto SL, Hutz MH, Coimbra Jr CEA, and Santos RV. 1996.
Mitochondrial DNA polymorphism in three Brazilian Indian tribes. Am J Hum Biol 8:317-323.

64
Watkins WS, Bamshad M, Dixon ME, Bhaskara R, Naidu JM, Reddy PG, Prasad BVR,
Das PK, Reddy PC, Gai PB, Bhanu A, Kusuma YS, Lum JK, Fischer P, and Jorde LB. 1999.
Multiple origins of the mtDNA 9-bp deletion in populations of South India. Am J Phys
Anthropol 109:147-158.
Watson E, Forster P, Richards M, and Bandelt HJ. 1997. Mitochondrial footprints of
human expansions in Africa. Am J Hum Genet 61:691-704.
Weiss DA, and Smith DG. 2003. Unexpected patterns of mitochondrial DNA variation
among Native Americans from the southeastern United States. Am J Phys Anthropol 122:336-
354.
Wrischnik L, Higuchi RG, Stoneking M, Erlich HA, Arnhelm N, and Wilson AC. 1987.
Length mutations in human mitochondrial DNA: direct sequencing of enzymatically amplified
DNA. Nucl Acids Res 15:529-542.
Yao YG, Kong QP, Bandelt HJ, Kivisild T, and Zhang YP. 2002a. Phylogeographic
differentiation of mitochondrial DNA in Han Chinese. Am J Hum Genet 70:635-651.
Yao YG, Nie L, Harpending H, Fu YX, Yuan ZG, and Zhang YP. 2002b. Genetic
relationship of Chinese ethnic populations revealed by mtDNA sequence diversity. Am J Phys
Anthropol 118:63-76.
Zavala S. 1948. Estudios indianos. México: Publicaciones del Colegio de México.
Zegura SL, Karafet TM, Zhivotovsky LA, and Hammer MF. 2004. High-resolution SNPs
and microsatellite haplotypes point to a single, recent entry of Native American Y chromosomes
into the Americas. Mol Biol Evol 21:164-175.

65
Zerjal T, Wells RS, Yuldasheva N, Ruzibakiev R, and Tyler-Smith C. 2002. A genetic
landscape reshaped by recent events: Y-chromosomal insights into Central Asia. Am J Hum
Genet 71:466-482.
Zerjal T, Xue Y, Bertorelle G, Wells RS, Bao W, Zhu S, Qamar R, Ayub Q, Mohyuddin
A, Fu S, Li P, Yuldasheva N, Ruzibakiev R, Xu J, Shu Q, Du R, Yang H, Hurles ME, Robinson
E, Gerelsaikhan T, Dashnyam B, Mehdi SQ, and Tyler-Smith C. 2003. The genetic legacy of
Mongols. Am J Hum Genet 72:717-721.

66
TABLE 1. Haplogroups with their motifs and defining markers, and primers used for their identification1
Motif2
Haplo-group
Defining markers
Primers3
Motif
Haplo-group4
Defining markers
Primers
(-/-)
A
+663 HaeIII
L612 (22) H742 (23)
(+/-)
I
-4529 HaeII
L4462 (21) H4620 (19)
(-/-)
B
9bp del regV
L8216 (20) H8296 (20) (+/-)
J
+4216 NlaIII
L4160 (19) H4291 (21)
(-/-)
F
-12406 HpaI
L12237 (21) H12485 (20)
(+/-)
K
+12308 HinfI -9052 HaeII
L8921 (19) H9086 (21)
(-/-)
HV
-14766 MseI
L14711 (20) H14885 (19)
(+/-)
L
+3592 HpaI
L3517 (19) H3667 (21)
(-/-)
H
-14766 MseI -7025 AluI
L6958 (20) H7104 (19)
(+/-)
L1b
+3592 HpaI +2349 DpnII
As in L and L3e
(-/-)
V
-14766 MseI -4577 NlaIII
L4462 (21) H4620 (19)
(+/-)
L1c
+3592 HpaI +9070 TaqI
L8921 (19) H9086 (21)
(-/-)
T
+4216 NlaIII
L4160 (19) H4291 (21)
(+/-)
L2*
+3592 HpaI +16389 HinfI
L16348 (21) H16401 (20)
(-/-)
U
+12308 HinfI
L12265 (21) H123084 (23)
(+/-)
L2a
As in L2* plus +13803 HaeIII
L13643 (19) H113809 (19)
(-/-)
K
+12308 HinfI -9052 HaeII
L8921 (19) H9086 (21)
(+/-)
L3b
+10084 TaqI
L9963 (21) H10127 (19)
(-/-)
W
+8249 AvaII
L8216 (20) H8296 (20)
(+/-)
L3d
-8616 DpnII
L8558 (20) H8657 (20)
(-/-)
X
+14465 AccI
L14390 (19) H14559 (19)
(+/-)
L3e
+2349 DpnII
L2272 (19) H2420 (19)
(+/+)
C
+13262 AluI
L13233 (24) H13392 (24)
(+/+)
D
-5176 AluI
L5121 (20) H5229 (20)
(+/+)
E
-7598 HhaI
L7492 (20) H7641 (22)
(+/+)
G
+4831 HhaI
L4754 (22) H4919 (19)
1L3* (+/-), M (+/+), N(-/-), (pre-HV)1 (-/-), and JT (-/-) have no defining marker. 2Refers to the state of the 10394 DdeI/10397 AluI sites. 3Letters “L” and “H” denote the extended mtDNA strand, light and heavy, respectively. Numbers indicate the first nucleotide to be extended from the primers, based on the Cambridge Reference Sequence (CRS) (Anderson et al., 1981). Numbers in parentheses indicate primer length. When the haplogroup is defined by more than one marker, primers shown belong to the last marker used in the procedure. 4H12308 is a mismatched primer with a G at position 12312, thus generating a HinfI site when the transition at position 12308 that characterizes haplogroup U is present.

67
TABLE 2. Sampling procedure results categorized by region
Region
Municipality
Number of housing units
Uninhabited housing units
Inhabited
housing units
Agreed to participate
Selected not
contacted
Declined to participate
Metro
Arecibo
33 3 30 26 (86.7%) 2 (6.7%)
2 (6.7%)
Bayamón
60 7 53 43 (81.1%) 6 (11.3%)
4 (7.5%)
Caguas
40 3 37 30 (81.1%) 7 (18.9%)
0
Carolina
51 3 48 39 (81.3%) 4 (8.3%)
5 (10.4%)
Guaynabo
23 2 21 16 (76.2%) 5 (23.8%)
0
Mayagüez
33 3 30 26 (86.7%) 0
4 (13.3%)
Ponce
37 3 34 27 (79.4%) 0
7 (20.6%)
San Juan
118 5 113 78 (69.0%) 22 (19.5%)
13 (11.5%)
Subtotal
395 29 366 285 (77.9%) 46 (12.6%)
35 (9.6%)
North
Florida
39 6 33 29 (87.9%) 4 (12.1%)
0
Toa Baja
28 1 27 22 (81.5%) 1 (3.7%)
4 (14.8%)
Vega Alta
50 3 47 38 (80.9%) 4 (8.5%)
5 (10.6%)
Vega Baja
41 6 35 25 (71.4%) 7 (20.0%)
3 (8.6%)
Subtotal
158 14 142 114 (80.3%) 16 (11.3%)
12 (8.5%)
East
Humacao
72 4 68 51 (75.0%) 11 (16.2%)
6 (8.8%)
Loíza
46 1 45 37 (82.2%) 4 (8.9%)
4 (8.9%)
Patillas
26 2 24 21 (87.5%) 1 (4.2%)
2 (8.3%)
San Lorenzo
43 3 40 31 (77.5%) 7 (17.5%)
2 (5.0%)
Subtotal
187 10 177 140 (79.1%) 23 (13.0%)
14 (7.9%)
South
Guayanilla
24 6 18 17 (94.4%) 0
1 (5.6%)
Juana Díaz
23 1 22 19 (86.4%) 2 (9.1%)
1 (4.5%)
Peñuelas
13 4 9 9 (100%) 0
0
Yauco
27 2 25 22 (88.0%) 0
3 (12.0%)
Subtotal
87 13 74 67 (90.5%) 2 (2.7%)
5 (6.8%)
West
Aguadilla
26 2 24 23 (95.8%) 1 (4.2%)
0
Hormigueros
33 1 32 28 (87.5%) 2 (6.3%)
2 (6.3%)
Moca
27 2 25 23 (92.0%) 0
2 (8.0%)
San Sebastián
29 2 27 23 (85.2%) 1 (3.7%)
3 (11.1%)
Subtotal
115 7 108 97 (89.8%) 4 (3.7%)
7 (6.5%)
Central
Barranquitas
38 2 36 30 (83.3%) 5 (13.9%)
1 (2.8%)
Cayey
31 1 30 22 (73.3%) 7 (23.3%)
1 (3.3%)
Corozal
29 1 28 23 (82.1%) 4 (14.3%)
1 (3.6%)
Jayuya
27 2 25 22 (88.0%) 3 (12.0%)
0
Subtotal
125 6 119 97 (81.5%) 19 (16.0%)
3 (2.5%)
Total Total 1067 81 986 800 (81.1%) 110 (11.2%) 76 (7.7%)

68
TABLE 3. Haplogroup distribution by municipality Haplogroups
Amerindian Sub-Saharan African West EurasianMunicipality A B C D L0 L1b L1c L2* L2a L3* L3b L3d L3e U1 H J K T U V HV R pre-HV Totals Aguadilla 6 4 7 1 1 1 2 1 23 Arecibo 10 1 8 1 3 1 1 1 26 Barranquitas 12 5 3 1 1 1 2 1 3 1 30 Bayamón 13 1 10 2 1 2 32 1 1 23 1 3 1 1 1 43 Caguas 11 1 5 1 1 1 1 4 4 1 30 Carolina 9 2 6 2 1 2 1 2 3 2 3 1 1 2 1 1 39 Cayey 7 4 2 33 1 4 1 22 Corozal 7 9 3 1 1 1 1 23 Florida 9 1 9 1 1 1 1 2 1 2 1 29 Guayanilla 3 5 2 2 1 1 14 1 1 17 Guaynabo 4 4 2 2 1 1 1 1 16 Hormigueros 11 2 83 1 2 1 1 2 28 Humacao 15 15 10 3 5 43 3 1 1 1 4 1 1 1 51 Jayuya 8 3 4 2 1 1 1 1 1 22 Juana Díaz 11 66 1 1 19 Loíza 5 2 3 7 3 3 83 5 1 37 Mayagüez 10 3 6 2 1 2 1 1 26 Moca 8 2 87 1 1 1 2 23 Patillas 9 2 2 1 2 1 1 1 1 1 21 Peñuelas 3 2 1 1 1 1 9 Ponce 13 2 6 1 1 1 1 1 1 27 San Juan 16 3 14 22 108 2 4 3 2 63 2 4 2 4 3 1 78 San Lorenzo 7 1 7 1 5 1 1 1 1 1 1 3 1 31 San Sebastián 10 2 3 2 2 1 1 1 1 23 Toa Baja 6 1 6 1 1 1 2 1 1 1 1 22 Vega Alta 13 2 9 1 3 1 2 3 2 1 1 38 Vega Baja 12 2 7 1 1 1 1 25 Yauco 8 2 4 1 4 1 2 22 Totals 256 42 174 17 12 49 22 16 29 9 15 21 38 9 29 23 7 8 18 1 3 1 1 800 1Corresponds to Sub-Saharan African clade U5b2 (see text). 2Two samples (one each from Bayamón and San Juan) showed the markers defining haplogroup L3d and macroparagroup L. These were regarded as belonging to macroparagroup L. 3Six samples (two belonging to haplogroup L3e and one each belonging to C, L1c, L2*, and L2a) contained (-/-) 10394 DdeI/10397 AluI motifs instead of those corresponding to their respective haplogroups. 4One sample exhibited the markers defining haplogroups H and B. Its HVR-I sequence showed that it belongs to haplogroup H. 5The Humacao participant belonging to haplogroup B was of Chinese maternal ancestry. 6One Juana Díaz sample exhibited the markers defining haplogroups C and E. Its HVR-I sequence showed that it belongs to haplogroup C. 7One Moca sample with the (+/+) motif did not exhibit any haplogroup-defining marker, but its HVR-I sequence revealed that it belongs to haplogroup C. 8Two San Juan samples exhibited the marker defining haplogroups J and T in addition to those defining haplogroup L1b. They were regarded as belonging to haplogroup L1b.

69
TABLE 4. Haplogroup U HVR-I sequence types Clade
Sequence type1
n (27)
Min reg cov2
Most likely origin
U6b
163, 172, 219, 311
2
081 – 526
Canary Islands
U6a
172, 189, 219, 278
1
161 – 526
North Africa
U5b2
189, 192, 270, 320
9
154 – 379
Sub-Saharan Africa
U5b*
189, 270
1
184 – 391
Europe
U5b*
189, 270, 311
1
184 – 394
Europe
U23
189, 362
2
184 – 391
Europe or Near East
U*
192
1
154 – 394
Europe
U5*
224, 261, 270
1
154 – 391
North Africa
U5*
224, 270
7
154 – 382
North Africa
U5a1a
256, 270
2
154 – 392
Europe
1Numbers represent positions at which transitions occur. They correspond to the CRS (Anderson et al., 1981) minus 16000. Transitions at the 16519 hypermutable site are ignored. 2Shows the minimum region covered with confidence in all samples in each sequence type. 3Their belonging to haplogroup U2 is likely but not definite (see text).

70
TABLE 5. L3* HVR-I sequence types
Clade Sequence type1
n (9)
Min reg cov2 L3g
15924, 114, 223, 293T, 311, 316, 355, 362, 399
1
15877 – 16400
L3*
086, 126, 179, 215, 223, 256A, 284, 311
2
15879 – 16395
L3*
129, 172, 174, 192, 218, 223, 256A, 311, 362
1
15860 – 16524
L3f1
129, 209, 223, 286, 292, 295, 311
1
15882 – 16395
L3*
129, 223, 256A, 311, 362
1
15860 – 16523
L3f1
145, 209, 223, 292, 295, 311
1
15882 – 16394
L3f1
209, 223, 274, 292, 311
1
15882 – 16384
L3*
223, 311, 362
1
16026 – 16400
1Numbers represent sites at which base substitutions occur. They correspond to the CRS (Anderson et al., 1981) minus 16000 if only three digits are shown. Transversions relative to the CRS are indicated by showing the base identity after the site number. Transitions at the 16519 hypermutable site are ignored. 2Shows the minimum region covered with confidence in all samples in each sequence type.

71
TABLE 6. Weighted biological ancestry frequencies per municipality
Ancestry Municipality
Amerindian
Sub-Saharan African
West Eurasian
Total
Weight
Aguadilla 221 (75.9)2 6 (20.7) 1 (3.4) 29 1.2873 Arecibo 18 (75.0) 3 (12.5) 3 (12.5) 24 0.8898 Barranquitas 15 (65.2) 4 (17.4) 4 (17.4) 23 0.7492 Bayamón 28 (60.9) 12 (26.1) 6 (13.0) 46 1.0658 Caguas 17 (56.7) 8 (26.7) 5 (16.7) 30 0.9791 Carolina 21 (48.8) 15 (34.9) 7 (16.3) 43 1.0980 Cayey 10 (50.0) 10 (50.0) 0 20 0.9183 Corozal 16 (69.6) 5 (21.7) 2 (8.7) 23 0.9817 Florida 19 (67.9) 6 (21.4) 3 (10.7) 28 0.9421 Guayanilla 8 (57.1) 3 (21.4) 3 (21.4) 14 0.8369 Guaynabo 12 (63.2) 6 (31.6) 1 (5.3) 19 1.2371 Hormigueros 21 (75.0) 4 (14.3) 3 (10.7) 28 1.0459 Humacao 14 (58.3) 7 (29.2) 3 (12.5) 24 0.4898 Jayuya 16 (69.6) 5 (21.7) 2 (8.7) 23 1.0544 Juana Díaz 15 (88.2) 2 (11.8) 0 17 0.8733 Loíza 5 (17.9) 22 (78.6) 1 (3.6) 28 0.7666 Mayagüez 19 (73.1) 5 (19.2) 2 (7.7) 26 0.9565 Moca 22 (78.6) 2 (7.1) 4 (14.3) 28 1.2396 Patillas 18 (62.1) 7 (24.1) 4 (13.8) 29 1.3563 Peñuelas 8 (57.1) 6 (42.9) 0 14 1.5450 Ponce 29 (80.6) 3 (8.3) 4 (11.1) 36 1.2969 San Juan 42 (42.0) 40 (40.0) 18 (18.0) 100 1.2878 San Lorenzo 13 (52.0) 8 (32.0) 4 (16.0) 25 0.8201 San Sebastián 17 (65.4) 6 (23.1) 3 (11.5) 26 1.1541 Toa Baja 17 (58.6) 8 (27.6) 4 (13.8) 29 1.3123 Vega Alta 18 (66.7) 8 (29.6) 1 (3.7) 27 0.7349 Vega Baja 19 (82.6) 2 (8.7) 2 (8.7) 23 0.8962 Yauco 10 (62.5) 4 (25.0) 2 (12.5) 16 0.7439 Total 489 (61.3) 217 (27.2) 92 (11.5) 798 ---- 1Numbers correspond to the number of samples from each municipality times the sample weight values rounded to integers. 2Percent frequencies are in parentheses.

72
TABLE 7. Weighted data for Sub-Saharan African haplogroups
Sub-Saharan African Haplogroups
L0
L1b
L1c
L2*
L2a
L3*
L3b
L3d
L3e
L3f
L3g
U5b2
Total
n
13
48
18
13
29
5
16
22
38
4
1
9
216
Frequency (%)
6.0
22.2
8.3
6.0
13.4
2.3
7.4
10.2
17.6
1.9
0.5
4.2
100
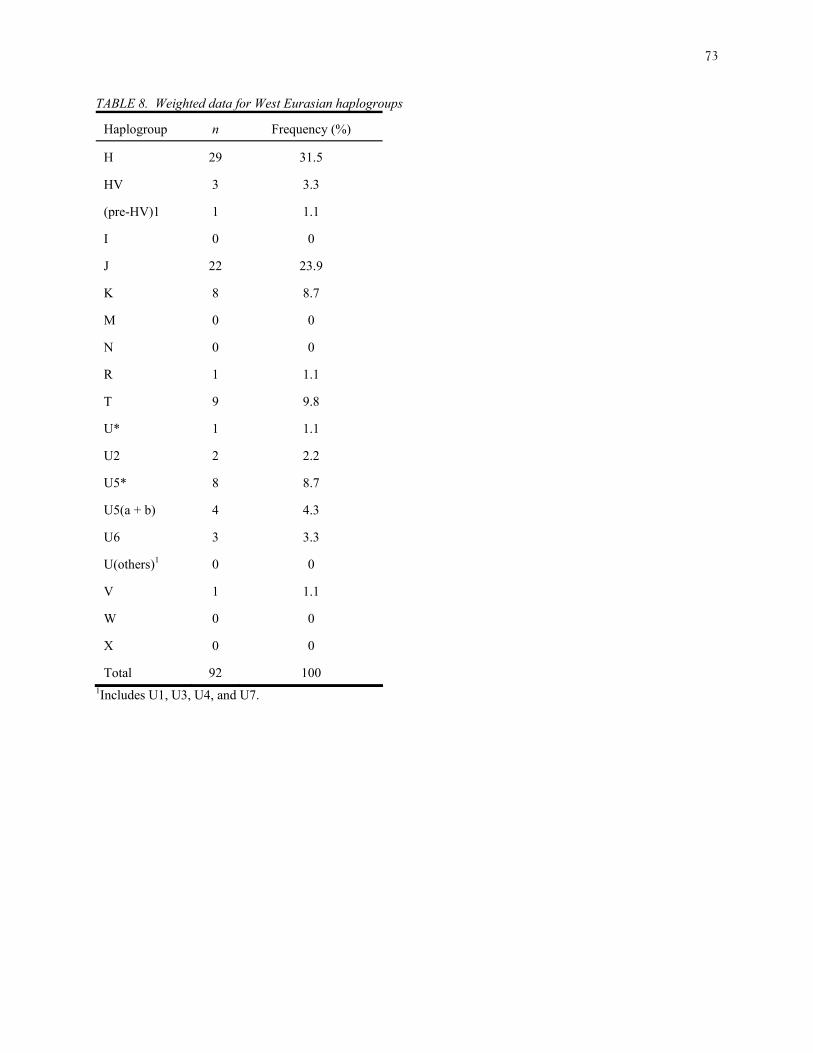
73
TABLE 8. Weighted data for West Eurasian haplogroups Haplogroup
n
Frequency (%)
H
29
31.5
HV
3
3.3
(pre-HV)1
1
1.1
I
0
0
J
22
23.9
K
8
8.7
M
0
0
N
0
0
R
1
1.1
T
9
9.8
U*
1
1.1
U2
2
2.2
U5*
8
8.7
U5(a + b)
4
4.3
U6
3
3.3
U(others)1
0
0
V
1
1.1
W
0
0
X
0
0
Total
92
100
1Includes U1, U3, U4, and U7.

74
FIGURE LEGENDS
Fig. 1. Municipalities selected.
Fig. 2. Biological ancestry triangular graphic showing the biological ancestry frequencies of the
28 municipalities. Municipalities are numbered as in Figure 1. Municipalities cluster close to
the vertex representing Amerindian frequencies equal to one, but with some degree of dispersion
toward the African vertex. The Loíza dot lies apart from all other municipalities.
Fig. 3. Amerindian frequencies in the 28 surveyed municipalities distributed in 12 categories.
Shown next to each category color indicator is the number of municipalities in the category and,
in parenthesis, the Amerindian frequency range represented by the category. The Amerindian
frequencies of the single municipalities that are in the first and last categories fall in the middle
of the ranges represented by their categories. The 14 municipalities with the lowest Amerindian
frequencies are the 11 located east of longitude 66o16’ W and the three surrounding Guayanilla
Bay. See text for categorization methodology.
Fig. 4. PC analysis of Sub-Saharan African populations based on mtDNA haplogroup
frequencies. Crosslines indicate 0.1 units. Panel A: PC1 vs PC2. Panel B: PC1 vs PC3.
Fig. 5. PC analysis of West Eurasian populations based on mtDNA haplogroup frequencies.
Crosslines indicate 0.1 units. Panel A: PC1 vs PC2. Panel B: PC1 vs PC3. Moroccan
populations are designated by letters: a = non-Berber Moroccans, b = Berbers, c = Souss Valley.
Populations of European regions are designated by numbers: 1 = Mediterranean East, 2 =

75
Mediterranean Central, 3 = Mediterranean West, 4 = Basque, 5 = South East, 6 = Alpine, 7 =
North East, 8 = North Central, 9 = North West, 10 = Scandinavia.
Fig. 6. PC analysis of Amerindian populations based on mtDNA haplogroup frequencies.
Foreground: PC1 vs PC3. Insert: PC1 vs PC2. Crosslines indicate 0.05 units. Number of
populations from each geographic region is indicated in parenthesis. Population codes are as
follows. From eastern North America Mo = Mohawk, MO = Manitoulin Island Ojibwa, OO =
Northern Ontario Ojibwa; from the Great Plains CA = Cheyenne/Arapaho, Cp = Turtle Mountain
Chippewa, Si = Siouan, SW = Sisseton/Wapheton Sioux, WC = Wisconsin Chippewa; from the
North American Southeast Ch = Choctaw, Cr = Creek, Mu = Muskoke, OK = Oklahoma Red
Cross, SC = Stillwell Cherokee, Se = Seminole; from the North American Southwest AO =
Akimal O’odham, Ap = Apache, CP = California Penutian, DY = Delta Yuman, HH =
Havasupai/Hualapai/Yavapai/Mojave, Je = Jemez, Na = Navajo, Pi = Pima, PS = North
Paiute/Shoshoni, PY = Pai Yuman, QC = Quechuan/Cocopa, RY = River Yuman, TO = Tauno
O’odham, Wa = Washo, Zu = Zuni; from Mesoamerica Ma = Maya, Mi = Mixtec, Mx = North
Central Mexico, NC = Nahua/Cora; from eastern Central America Br = Bribri-Cabecar, EP =
Emberá-Panamá, Gt = Guatuso, He = Huetar, Ku = Kuna, Ng = Ngöbé, Te = Teribe, Wo =
Wounan; from western Colombia Ci = Chimila, Cy = Cayapa, Gm = Guambiano, Gu = Guane-
Butaregua, EC = Emberá-Colombia, IA = Ijka-Arhuaco, In = Ingano, Ko = Kogui, Pz = Paez, TC
= Tule-Cuna, Wn = Waunana, Wy = Wayuu, YY = Yuco-Yukpa, Ze = Zenu; from eastern
Colombia Cg = Coreguaje, Cu = Curripaco, Gb = Guayabero, GS = Guahibo-Sikuani, Ht =
Huitoto, MM = Murui-Muinane, Nk = Nukak, Pa = Piaroa, Tu = Tucano; from the Amazon BB
= Belén-Brazil, BN = Brazilian North, Gv = Gaviao, Ti = Ticuna, Xa = Xavante, Ya =

76
Yanomami, Zo = Zoró; from around Lake Titicaca At = Atacameño, Ay = Aymara, Cm =
Chimane, Ig = Ignaciano, Ms = Mosetén, Mv = Movima, Qu = Quechua, Tr = Trinitario, Yu =
Yuracaré; from northern Argentina, MC = Mataco-Salta, MF = Mataco-Formosa, Mt = Mataco-
Chaco, Pl = Pilaga, TF = Toba-Formosa, To = Toba-Chaco; from southern South America Hu =
Huilliche, MA = Mapuche-Argentina, MC = Mapuche-Chile, Pe = Pehuenche, Yg = Yaghan.
Code for Puerto Rico is PR, and for “Other” populations are BC = Bella Coola, BS = Brazilian
Southeast.

77
Figure 1 (printing size)

78
Figure 2 (can be reduced to 80% of actual size)

79
Figure 3 (printing size)

80
Figure 4 (printing size)

81
Figure 5 (printing size)

82
Figure 6 (printing size)