Embed Size (px)
Citation preview

Mar
tin
Dee
Pho
tograp
h
November 20123Playing with the pros
4Food security: an urgent issue for B.C.
7A university library for the 21st century


!
"


HIV subtype B
HIV within a single patient Hepatitis C virus 6a
Influenza A virus H3N2
Hepatitis B virus genotype C
All trees depicted are approximately on the same scale.

"


IAS–USA Topics in Antiviral Medicine
158
MUTATIONS IN THE REVERSE TRANSCRIPTASE GENE ASSOCIATED WITH RESISTANCE TO REVERSE TRANSCRIPTASE INHIBITORS
Nucleoside and Nucleotide Analogue Reverse Transcriptase Inhibitors (nRTIs)a
Nonnucleoside Analogue Reverse Transcriptase Inhibitors (NNRTIs)a,m
Multi-nRTI Resistance: 69 Insertion Complexb (affects all nRTIs currently approved by the US FDA)
Multi-nRTI Resistance: 151 Complexc (affects all nRTIs currently approved by the US FDA except tenofovir)
Multi-nRTI Resistance: Thymidine Analogue-Associated Mutationsd,e (TAMs; affect all nRTIs currently approved by the US FDA)
Abacavirf,g
Didanosineg,h
Emtricitabine
Lamivudine
Stavudined,e,g,i,j,k
Tenofovirl
Zidovudined,e,j,k
Etravirinen
Efavirenz
Nevirapine
M41L
M41L
D67N
K65R
L74V
K65R
K65R
K65R
K65R
K65R
L74V
Y115
F
M184V
M184VIM
184VI
A62V
A62V
V75I
F77L
F116Y
Q151M
K70R
K70R
M41L
D67N
K70R
K70E
M41L
D67N
K70R
L210W
T215YF
K219QE
L210W
T215YF
K219QE
L210W
T215YF
V106
I
E138AGKQ
K103NS
V106M
V108
I
G190
SA
G190
SA
M230
L
L100
I
L100 I*
A98G
V90I
Y181
CI
Y188
L
K103NS
V106AM
V108
I
G190A
L100
I
Y181
CI
Y188
CLH
P225H
K219QE
L210W
T215YF
K219QE
!
69Insert
Y181 C* I * V*
V179DFT
K101
EH
P*
K101
P
K101
P
Rilpivirineo
E138AG
K*QR
M230
IL
Y181 C I V
F227
C
H221Y
V179
L
K101
EP

tip
root
branch
root
tip
branch
time

MAXIMUM LIKELIHOOD
METHOD
A method that selects the treethat has the highest probabilityof explaining the sequence data,under a specific model ofsubstitution (changes in thenucleotide or amino-acidsequence).
54 | JANUARY 2004 | VOLUME 5 www.nature.com/reviews/genetics
R E V I EW S
itself a composite of viruses, the descendants of whichare now found in red-capped mangabeys (Cercocebustorquatus, SIVrcm) and greater spot-nosed monkeys(Cercocebus nictitans, SIVgsn)8.
Dating the evolution of primate lentiviruses. To fullyunderstand the evolutionary history of HIV, it is alsonecessary to determine its timescale. At face value, thewide host-species range of the SIVs, as well as their lowVIRULENCE and strong association with specific species9,argues for an ancient evolutionary history, perhapsrepresenting virus–host co-divergence over severalmillion years. Indeed, in some cases the phylogeny ofthe SIVs matches that of their primate hosts, asexpected under a co-divergence model10. However,there are an increasing number of instances in whichhost and virus phylogenies are mismatched, implyingmore recent cross-species transfer in the SIVs8,11,12. Ifcross-species transfer is in fact the main mode of evo-lution, then any resemblance between host and virustrees might be because related primate species areoften found in adjacent geographical ranges, orbecause host switching is most likely to occur betweenclosely related host species13.
The timescale of evolution inferred from viralMOLECULAR CLOCKS also seems incompatible with long-term co-divergence. If co-divergence were true, thenthe divergence times of SIVs should broadly matchthose of their hosts, going back millions of years.However, all molecular clock estimates of primatelentivirus evolution are orders of magnitude morerecent than this14, and the rates of mutation and repli-cation are similar among these viruses15,16. Therefore, ifmolecular clocks are accurate, then the evolutionarytimescale for each epidemic of HIV-1 and HIV-2 ismeasured only in decades. Several methods are avail-able to measure substitution rates, and thereforedivergence times, in RNA viruses, although the mostreliable estimates come from analysing the temporaldistribution of nodes on trees (BOX 2). Application ofthese (and similar) methods have led to suggestionsthat the M group of HIV-1 originated in the 1930s,with a range of ~10 years on either side17–19 (but seeBOX 2). A broadly similar evolutionary timescale hasbeen proposed for HIV-2 (REF. 20).
Although most estimates for the time of origin ofHIV-1 are consistent, all can be subject to the same sys-tematic bias. Once again, recombination might con-tribute to this error. Recombination has complex effectson the estimation of divergence times, by increasingapparent variation in rates among nucleotide sites andreducing genetic distances between sequences21,22. Inthese circumstances, perhaps the only reliable indicatorsof the timescale of HIV evolution are archival viral sam-ples. The earliest HIV-1 M group sequence that is avail-able was sampled in the Democratic Republic of Congoin 1959 (REF. 23). That this sequence falls some distancefrom the root of the M group tree is strong evidencethat the diversification of these viruses occurred beforethis time (BOX 2). Accurately dating HIV evolution willrequire the analysis of more such ‘fossil’ viruses.
humans are thought to explain the current diversity ofHIV-1, such that groups M, N and O each have an inde-pendent origin3,6. However, inter-specific recombina-tion, which might be common among the primatelentiviruses, greatly complicates this analysis7. For exam-ple, HIV-1 group N seems to be a recombinant betweena SIVcpz strain and a virus related to the ancestor ofgroup M (REF. 3), but this event occurred before theestablishment of group M and N in humans. SIVcpz is
A
A
A
B
B
C
B
D
H
F
G
HIV-1 group M
HIV-2
HIV-2
HIV-1 group O
HIV-1 group N
SIVcpz
SIVcpz
SIVcpzSIVdrl
SIVmnd
SIVrcm
SIVsab
SIVsmSIVmac
SIVsyk
SIVgsnSIVmon
SIVver
SIVtan
SIVlhoestSIVsun
SIVmnd
SIVcol
SIVcpz
SIVcpz Pan troglodytes troglodytes
Pan troglodytes schweinfurthii
0.05 substitutions per site
Figure 2 | Evolutionary history of the primate lentiviruses. Because both the humanimmunodeficiency virus type 1 (HIV-1) and HIV-2 lineages (red branches) fall within the simian immunodeficiency viruses (SIVs) that are isolated from other primates, they representindependent cross-species transmission events. The tree and other evidence also indicate that HIV-1 groups M, N and O represent separate transfers from chimpanzees (SIVcpz), againbecause there is a mixing of the HIV-1 and SIV lineages. Similarly, HIV-2 seems to have beentransferred from sooty mangabey monkeys (SIVsm) on many occasions, although this is best documented in other phylogenetic analyses2. The tree was reconstructed using a MAXIMUM LIKELIHOOD METHOD on an alignment of 34 published nucleotide sequences of the viral polymerase (pol) gene (FIG. 1), excluding third codon positions (full details from the authors on request). Other abbreviations for viruses and their primate hosts are as follows: SIVcol, blackand white colobus; SIVdrl, drill; SIVgsn, greater spot-nosed monkey; SIVlhoest, L’Hoest monkey;SIVmac, macaque; SIVmnd, mandrill; SIVmon, Campbell’s mona monkey; SIVrcm, red-cappedmonkey; SIVsab, Sabaeus monkey; SIVsun, sun-tailed monkey; SIVsyk, Sykes’ monkey; SIVtan,tantalus monkey; SIVver, vervet monkey. For clarity, only some subtypes of HIV-1 and HIV-2 areshown. All gene sequences were taken from GenBank (see online links box).

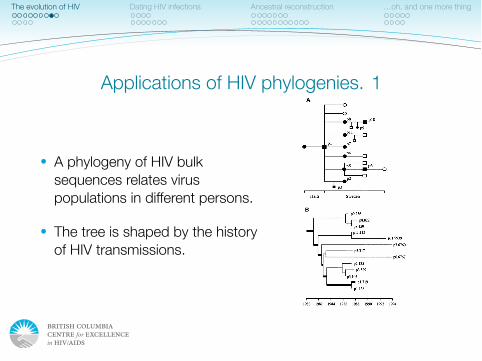
HIV within a single host
Global influenza A virus (H3N2)
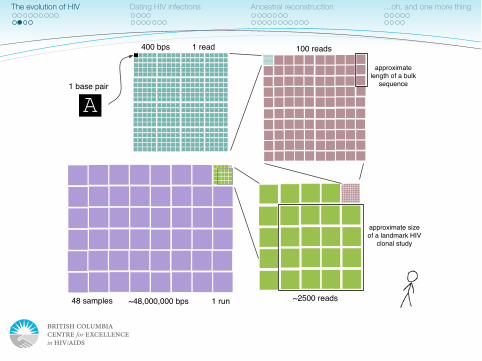
1 base pair
400 bps 1 read 100 reads
~2500 reads48 samples
approximate size of a landmark HIV
clonal study
~48,000,000 bps
approximate length of a bulk
sequence
1 run
A


#


HIV infectiontime
blood draw blood draw
root
2GS data 2GS data

$
BCCfE Forefront Lecture Series - April 13, 2011
The time of HIV infection is predicted by the TMRCA from 454 data.
200 300 400 500 600
200
300
400
500
600
Estimated date of infection (non-genetic)
Day
s si
nce
mos
t rec
ent c
omm
on a
nces
tor
12
3
5
6
7
8
9
10
11 13
14
15
16
1819Previous infection
Transmission bottleneck
New infection
TMRCA of new infection

"

1995 1996 1997 1998 1999 2000 2001
1995
1996
1997
1998
1999
2000
2001
Known date of seroconversion
Estim
ated
dat
e of
infe
ctio
nVIDUSVanguard
Mean difference = +1.2 months25%, 75% = –1.8, +6.5 months


A
G
t1
t2
x
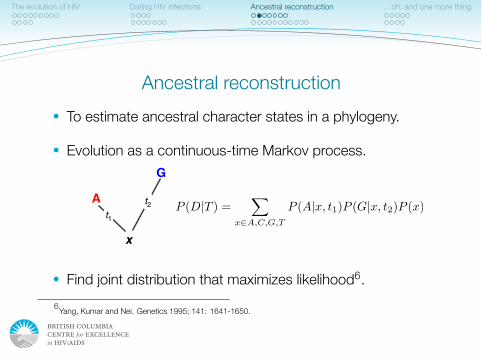
Probability = Pr(x is A) + Pr(x is C) + Pr(x is G) + Pr(x is T)P (D|T ) =
�
x∈A,C,G,T
P (A|x, t1)P (G|x, t2)P (x)

<

True ancestor
Early sample
ConsensusConsensus
Later samples


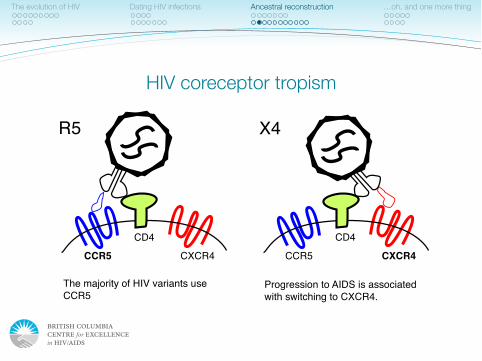
CD4
CXCR4CCR5
CD4
CXCR4CCR5
The majority of HIV variants use CCR5
Progression to AIDS is associated with switching to CXCR4.
R5 X4

fitne
ss
Genotype spaceCCR5-using CXCR4-using

0.0
0.2
0.4
0.6
0.8
1.0
Frequency
Fitness valley
0.0
0.2
0.4
0.6
0.8
1.0
Replications (x1000)
Frequency
Gradual
0 5000 10000 15000 20000


"

0 5 10 15 20 25 30 35
0.00
0.04
0.08
Amino acid position
Scor
ing
varia
tion
CTRP
NNNTRK
S
I
R
I GPGQAFY
ATG
D
I I GD I RQ
AHC
First sample
Positive MT-2
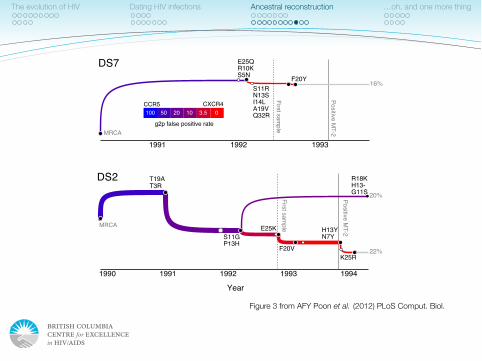
DS7S5NR10KE25Q
16%F20YS11RN13SI14LA19VQ32R
1991 1992 1993
03.5102050100
g2p false positive rate
DS2 20%G11S
H13-R18K
22%K25R
N7YH13YE25K
T3RT19A
S11GP13H
F20V
1990 1991 1992 1993 1994
Year
First sample
Positive MT-2MRCA
MRCA
CCR5 CXCR4

TIME
g2p
FPR
(log
sca
le)
0.1
3.5
100
range(tbins)
DS1
range(tbins)
log(range(fbins))
DS2
range(tbins)
log(range(fbins))
DS3
range(tbins)
log(range(fbins))
DS4
DS5
log(range(fbins))
DS6
log(range(fbins))
DS7
log(range(fbins))
DS8


Advice on Applying for a Grant, Writing Papers, Setting up a Research Team and Managing Your Time
Institute of Genetics, CIHRRoderick McInnes • Brenda Andrews • Richard Rachubinski
Guidebook for New Principal Investigators
C anadian Institutesof Health Re searc h
Instituts de rec herc heen santé du C anada