Embed Size (px)
Citation preview

w w w.environment-agency.gov.uk
Reconstructed river flow seriesfrom 1860s to present
Updating previously reconstructed series to 2002
Science Report SC040052/SR

Science Report Reconstructed river flow series from 1860s to present 2
The Environment Agency is the leading public body protecting andimproving the environment in England and Wales.
It’s our job to make sure that air, land and water are looked after byeveryone in today’s society, so that tomorrow’s generations inherit acleaner, healthier world.
Our work includes tackling flooding and pollution incidents, reducingindustry’s impacts on the environment, cleaning up rivers, coastalwaters and contaminated land, and improving wildlife habitats.
This report is the result of research commissioned and funded by theEnvironment Agency’s Science Programme.
Published by:Environment Agency, Rio House, Waterside Drive, AztecWest, Almondsbury, Bristol, BS32 4UDTel: 01454 624400 Fax: 01454 624409www.environment-agency.gov.uk
ISBN: 1 84432 313 7
© Environment Agency August 2004
All rights reserved. This document may be reproducedwith prior permission of the Environment Agency.
The views expressed in this document are notnecessarily those of the Environment Agency.
This report is printed on Cyclus Print, a 100% recycledstock, which is 100% post consumer waste and is totallychlorine free. Water used is treated and in most casesreturned to source in better condition than removed.
Further copies of this report are available from:The Environment Agency’s National Customer ContactCentre by emailing [email protected] or by telephoning 08708 506506.
Author(s):P.D. Jones, D.H. Lister and E. Kostopoulou
Dissemination Status:Publicly available
Keywords:Riverflow, reconstruction, England and Wales,droughts, floods, naturalisation
Research Contractor:Climatic Research UnitSchool of Environmental SciencesUniversity of East AngliaNorwich NR4 7TJTel : 01603 592722 Fax : 01603 507784.
Environment Agency’s Project Manager:Dr Rob Wilby, Trentside Office, Scarrington Road, WestBridgeford, Nottingham NG2 5FA
Science Project Number:SC040052
Product Code:SCHO0804BIDY-E-P

Science Report Reconstructed river flow series from 1860s to present 3
Science at the Environment Agency
Science underpins the work of the Environment Agency, by providing an up to dateunderstanding of the world about us, and helping us to develop monitoring toolsand techniques to manage our environment as efficiently as possible.
The work of the Science Group is a key ingredient in the partnership betweenresearch, policy and operations that enables the Agency to protect and restore ourenvironment.
The Environment Agency’s Science Group focuses on five main areas of activity:
• Setting the agenda: To identify the strategic science needs of the Agency toinform its advisory and regulatory roles.
• Sponsoring science: To fund people and projects in response to the needsidentified by the agenda setting.
• Managing science: To ensure that each project we fund is fit for purpose andthat it is executed according to international scientific standards.
• Carrying out science: To undertake the research itself, by those best placed todo it - either by in-house Agency scientists, or by contracting it out touniversities, research institutes or consultancies.
• Providing advice: To ensure that the knowledge, tools and techniquesgenerated by the science programme are taken up by relevant decision-makers,policy makers and operational staff.
Professor Mike Depledge Head of Science

Science Report Reconstructed river flow series from 1860s to present 4
CONTENTSPage
Executive Summary 7
1. Introduction 9
2. Flow Reconstruction Method 13
3. Catchment Rainfall Series 14
4. Results 18
5. Analysis and Discussion 20
6. Conclusions 25
7. Logistical Problems and Recommendations 267.1 Recommendations 26
Acknowledgements 28
References 29
Annex 1 Detailed discussion of reconstruction-model performance 31with the focus on validation
A1.1 Introduction 31
A1.2 Dee to Manley Hall/Erbistock 31A1.2.1 Catchment basics and flows 31A1.2.2 Model performance 31
A1.3 Derwent to Derby St Marys/Longbridge Wear 33A1.3.1 Catchment basics and flows 33A1.3.2 Model performance 33
A1.4 Eden to Temple Sowerby 33A1.4.1 Catchment basics and flows 33A1.4.2 Model performance 34
A1.5 Eden to Warwick Bridge/Great Corby 34A1.5.1 Catchment basics and flows 34A1.5.2 Model performance 35
A1.6 Exe to Thorverton 35A1.6.1 Catchment basics and flows 35A1.6.2 Model performance 35
A1.7 Itchen to High Bridge/Allbrook 35A1.7.1 Catchment basics and flows 35A1.7.2 Model performance 36
A1.8 Medway to Teston 36A1.8.1 Catchment basics and flows 36A1.8.2 Model performance 38
A1.9 Ely Ouse to Denver Complex 38A1.9.1 Catchment basics and flows 38A1.9.2 Model performance 39

Science Report Reconstructed river flow series from 1860s to present 5
CONTENTS continued …Page
A1.10 Teifi to Glan Teifi 40A1.10.1 Catchment basics and flows 40A1.10.2 Model performance 40
A1.11 Thames to Eynsham 40A1.11.1 Catchment basics and flows 40A1.11.2 Model performance 40
A1.12 Tees to Broken Scar 41A1.12.1 Catchment basics and flows 41A1.12.2 Model performance 42
A1.13 Tyne to Bywell 42A1.13.1 Catchment basics and flows 42A1.13.2 Model performance 43
A1.14 Wensum to Costessey Mill 43A1.14.1 Catchment basics and flows 43A1.14.2 Model performance 43
A1.15 Wharfe to Addingham 44A1.15.1 Catchment basics and flows 44A1.15.2 Model performance 44
A1.16 Wye to Redbrook 45A1.16.1 Catchment basics and flows 45A1.16.2 Model performance 45
Annex 2 Graphical Analyses for the Areal Rainfall 46Determination and Flow Reconstruction
Tables and Figure Captions
Table 1.1 The 15 catchments with their basic characteristics 10
Table 1.2 Details relating to catchment observed-flow series(gauged and naturalised) 12
Table 3.1 Descriptive statistics for the three annual rainfall series (mm) 1961-199316
Table 3.2 Average ratios (NRA and EA / MetO) for the 15 catchments 17
Table 4.1 Descriptive statistics for the observed and reconstructed river flow seriesover the period 1980-2002 (all flows in m3s-1) 19
Table 5.1 The occurrence of extreme high flows within the reconstructed flow 23record (1865-2002), for each catchment. The five most extremeannual (Jan-Dec.), autumn (SON) and autumn/winter (Oct.-April)highest mean-flows are ranked and expressed in percentage termswith respect to their mean values during the period 1961-90
Science Report Reconstructed river flow series from 1860s to present 6
CONTENTS continued …Page
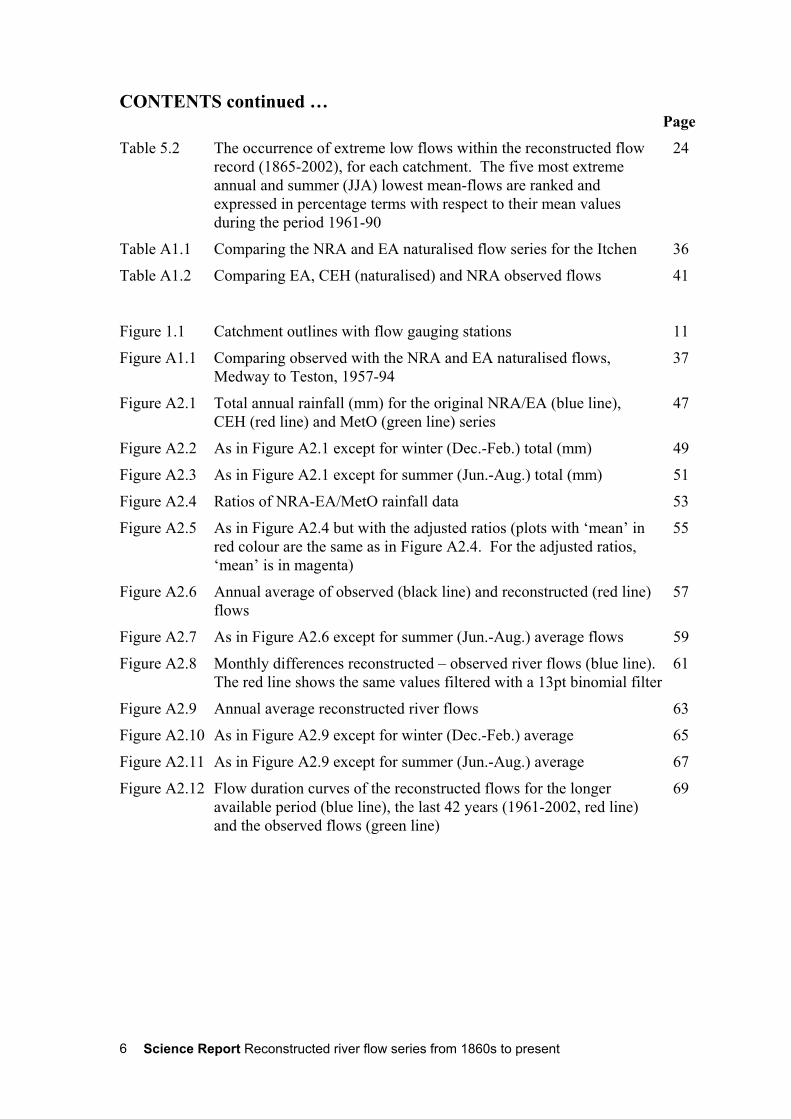
Table 5.2 The occurrence of extreme low flows within the reconstructed flow 24record (1865-2002), for each catchment. The five most extremeannual and summer (JJA) lowest mean-flows are ranked andexpressed in percentage terms with respect to their mean valuesduring the period 1961-90
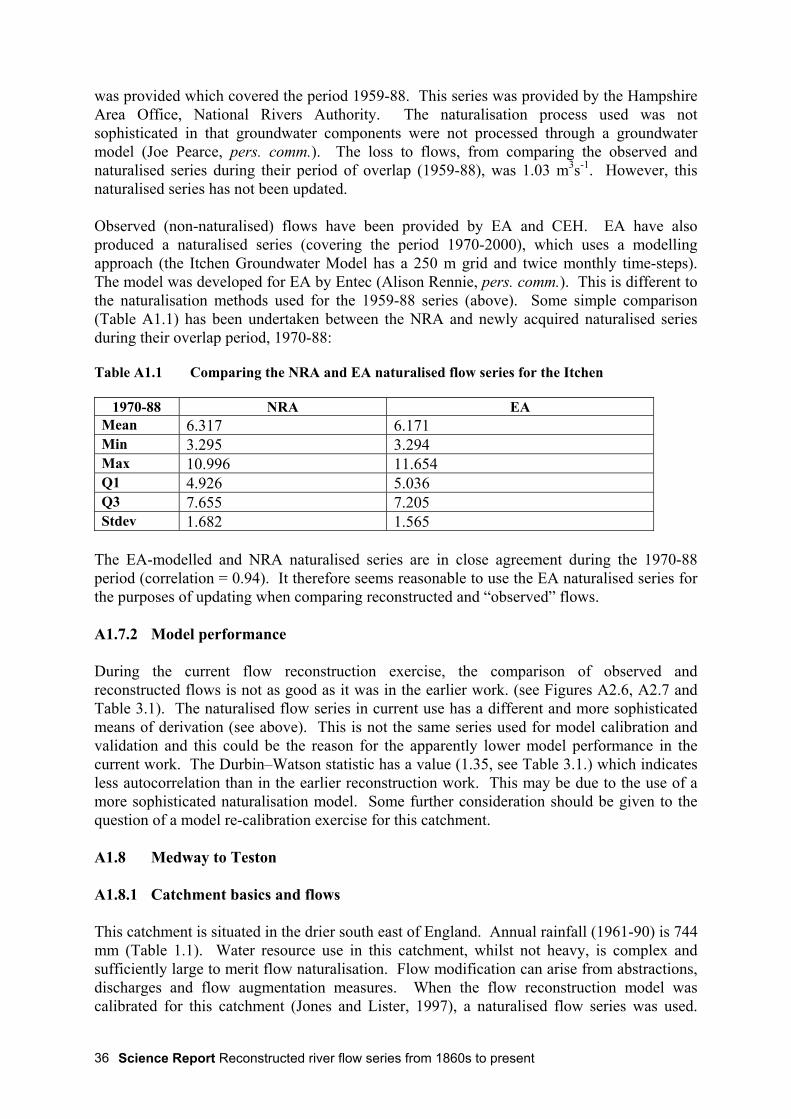
Table A1.1 Comparing the NRA and EA naturalised flow series for the Itchen 36
Table A1.2 Comparing EA, CEH (naturalised) and NRA observed flows 41
Figure 1.1 Catchment outlines with flow gauging stations 11
Figure A1.1 Comparing observed with the NRA and EA naturalised flows, 37Medway to Teston, 1957-94
Figure A2.1 Total annual rainfall (mm) for the original NRA/EA (blue line), 47CEH (red line) and MetO (green line) series
Figure A2.2 As in Figure A2.1 except for winter (Dec.-Feb.) total (mm) 49
Figure A2.3 As in Figure A2.1 except for summer (Jun.-Aug.) total (mm) 51
Figure A2.4 Ratios of NRA-EA/MetO rainfall data 53
Figure A2.5 As in Figure A2.4 but with the adjusted ratios (plots with ‘mean’ in 55red colour are the same as in Figure A2.4. For the adjusted ratios,‘mean’ is in magenta)
Figure A2.6 Annual average of observed (black line) and reconstructed (red line) 57flows
Figure A2.7 As in Figure A2.6 except for summer (Jun.-Aug.) average flows 59
Figure A2.8 Monthly differences reconstructed – observed river flows (blue line). 61The red line shows the same values filtered with a 13pt binomial filter
Figure A2.9 Annual average reconstructed river flows 63
Figure A2.10 As in Figure A2.9 except for winter (Dec.-Feb.) average 65
Figure A2.11 As in Figure A2.9 except for summer (Jun.-Aug.) average 67
Figure A2.12 Flow duration curves of the reconstructed flows for the longer 69available period (blue line), the last 42 years (1961-2002, red line)and the observed flows (green line)
Science Report Reconstructed river flow series from 1860s to present 7
EXECUTIVE SUMMARY
Riverflow records in the UK are generally relatively short in length, many beginning in thelate-1950s. Rainfall records, in contrast, are numerous with many extending back into theearly decades of the 19th century. In the early-1980s, work began to extend riverflow recordsfor a number of catchments using a simple rainfall-runoff model. The earliest work wasfunded by the Natural Environment Research Council and updated in the 1990s for theNational Rivers Authority (NRA) and the Environment Agency (EA). The principal resultsindicated that long and reliable reconstructions could be achieved provided the catchmentrainfall averages were homogeneous. The present report extends the reconstructions to 2002.Comparisons with observed flows for 1980-2002 imply that land-use changes are having littleeffect on flows, at least at the monthly timestep. Such reconstructions should prove useful inupdating naturalised flow series on some catchments.
The principal difficulty with undertaking the updating of the monthly flow records has beenin obtaining the necessary monthly rainfall and flow records for the last 8-10 years. Ourinitial expectation was that these data would be available from the various EA regions.Responses to initial enquiries soon revealed that, for many catchments, the required data werenot readily available. This was particularly the case for rainfall. For riverflow, naturalised aswell as measured monthly averages were required but some of the naturalised series wereeither no longer available or new (and different from those available in the mid-1990s) oneshad been introduced. In addition, some difficulty was experienced in trying to get hold ofrelevant metadata to complement the flow series (naturalised and measured) that weresupplied.
To complete the project on schedule we had to consider alternatives. We obtained a dailygridded (at 5km resolution) rainfall dataset, recently developed at the Met Office (MetO).This covers the period 1958-2002 and includes all of the standard meteorological variables.Whether the dataset will be regularly updated is not known, but the entire dataset would seemextremely useful for many EA activities and research projects. We also obtained monthlycatchment rainfall series from the Centre for Ecology and Hydrology (CEH, Wallingford).For riverflow, CEH also supplied monthly observed (and where available naturalised) series.This report, therefore, additionally includes comparisons of the series obtained from thevarious sources for monthly rainfall totals (NRA/EA from the original work, CEH and MetO)and monthly riverflow averages (earlier NRA/EA, CEH and new EA). A clearrecommendation from this study is for an extensive review of the EA’s data archiving,involving discussions with the Met Office and CEH.
The value of long homogeneous riverflow series is illustrated by example; with reference tothe flows produced by the extreme wet period during the autumn of 2000. The hydrologicalextremes experienced during 2000 and 2001 are put into the context of the flow-period 1865-2002. In addition, for some of the catchments, the inadequacy of flow gauging installationsunder such extreme flow conditions is illustrated.
Low flows, during the 1980-2002 period, were not as unusual as the high flows. The years1984, 1989 and especially 1995 rank in the five lowest flows since 1865 on more than onecatchment, but low flows during 1870, 1887, 1921, 1933/4 and 1976 were more spatiallyextensive.

Science Report Reconstructed river flow series from 1860s to present 8
The principal cost in extending the work to additional catchments would involve thedevelopment of long monthly catchment rainfall series before 1958. The Met Office hasextensive archives of hand-written monthly and daily rainfall data, but many series are notdigitised for periods prior to 1961. Many monthly series would need to be digitised from thehand-written 10-year books held by the Met Office and then assessed for long-termhomogeneity. Finally, with the newly constructed MetO daily gridded rainfall dataset, asoftware package could be developed to update the monthly flow series at annual intervals,provided the Met Office routinely update the high-resolution gridded rainfall dataset.

Science Report Reconstructed river flow series from 1860s to present 9
1. INTRODUCTION
The purpose of this work is to update the earlier river flow reconstructions for 15 catchmentsin England and Wales (Jones and Lister, 1995 and 1997). The reconstructions weredeveloped using a statistical catchment model developed by Wright (1978). More details ofthe model are given in Section 2. The earlier reconstructions covered the period c.a. 1860 tothe early/mid-1990s. The long series are also extensively discussed in Jones and Lister(1998). Some discussion of earlier extremes (cold/warm summers/winters and periods ofhigh/low flows) is given Jones et al (1984) based on documentary sources extending back to1556.
Most observed flow records only go back to the 1950s and these tend to suffer from problemsof inhomogeneity (with regard to flow behaviour in response to rainfall events), due toincreased use of water resources and the resultant increase in flow modifying activities. Theproduction/maintenance of long homogeneous flow records is, therefore, essential to theplanning of effective long-term water resource and water quality management strategies.
The homogeneity of reconstructed flow series depends upon the quality of rainfall/runoffmodels, their calibrations and the maintenance of homogeneous catchment rainfall series. Animportant component of this study is an extended evaluation of the rainfall/runoff modelperformance (by reference to observed flow series). Good model performance over a longertime-frame and thus potentially more varied climatic regime, will add confidence to the flowreconstruction technique and so to the resultant reconstructed flow series.
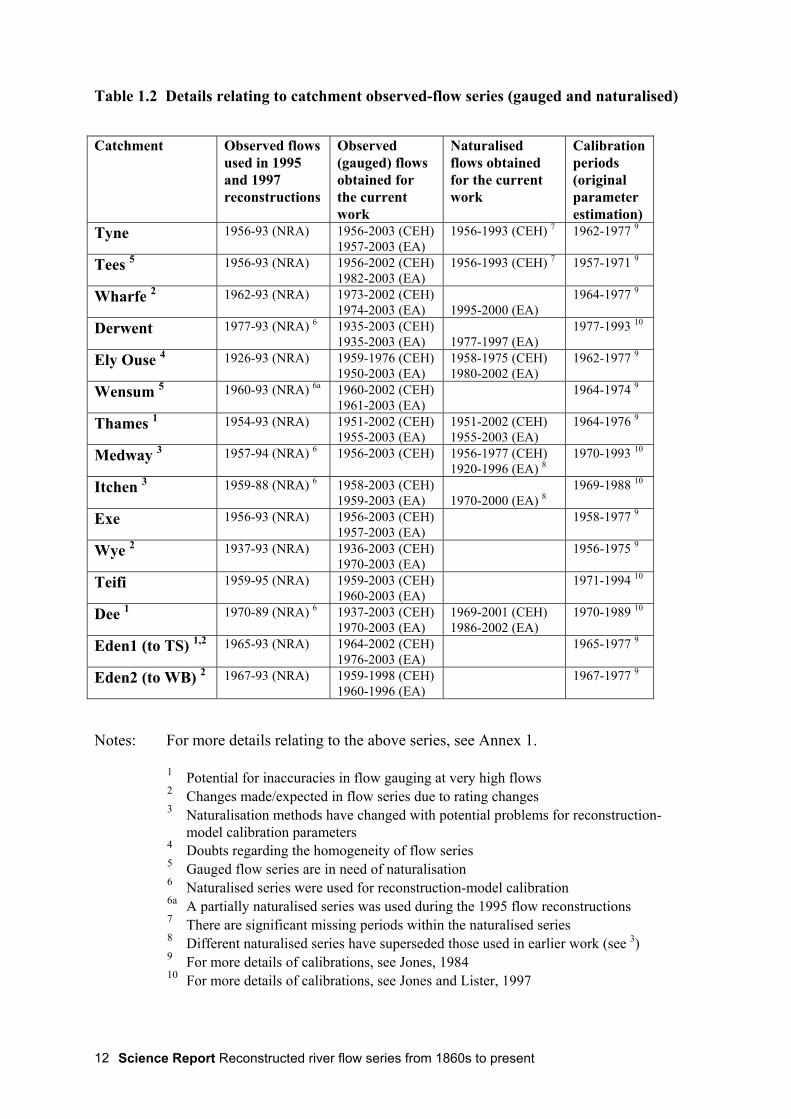
The original 15 catchments, for which reconstructed flow series were produced in the mid-1990s, were chosen to be representative of the catchments of England and Wales. It wasintended that basic flow behaviour, based on statistics from the long reconstructed series,could be “transferred” to other “similar” catchments on a regional basis. The 15 catchments,along with some of their important characteristics, are shown in Figure 1.1 and Table 1.1.Table 1.2 lists the availability of naturalised records on all 15 catchments, together with thecalibration periods (as used by Jones and Lister, 1995 and 1997) for the statistically-basedcatchment model. Of the original 15, ten catchments were chosen in the mid-1980s, with theadditional five chosen in the mid-1990s. At the time, they were chosen based on theavailability of long rainfall records and at least 30 years of monthly measured (andnaturalised, where necessary) riverflow data, based on advice from the National RiversAuthority (NRA) regions in terms of hydrometric practice and to achieve a fairlyrepresentative coverage of England and Wales. These criteria were relaxed a little in the mid-1990s flow reconstruction work when calibration and verification periods were shorter for thefive catchments concerned (see Table 1.2). As will become apparent in this report, some arenow no longer as appropriate (in terms of accuracy, or availability of naturalised flowmeasurements) as they were.

Science Report Reconstructed river flow series from 1860s to present 10
Table 1.1 The 15 catchments with their basic characteristics
River Flow gauge GaugeNo
NGR of gauge Catchmentarea
(km2)
61-90av.
precip.(mm)
Max.elevatio
n (m)
Mean flow(m3s-1)
Q95(m3s-1)
Q10(m3s-1)
Comments
Tyne Bywell 23001 45 (NZ) 038 617 2176 1015 893 45.2 6.1 102 Mainly uplandTees Broken Scar 25001 45 (NZ) 259 137 818 1141 893 16.9 1.8 41 Mainly uplandWharfe Addingham 27043 44 (SE) 092 494 427 1383 704 14.1 1.6 36 Mainly uplandDerwent Longbridge/St.
Mary’s Bridge28010 # 43 (SK) 356 363 1054 1012 636 17.8 5 37 Significant
upland influenceEly Ouse Denver Complex 33035 53 (TF) 588 010 3430 587 167 11.8 0 29 Lowland with
some g.w. inputWensum Costessey Mill 34004 63 (TG) 177 128 571 672 94 4 1.3 7.4 Lowland with
sig. g.w. inputThames Eynsham 39008 42 (SP) 445 087 1616 730 330 13.8 1.1 33 Mainly lowlandMedway Teston 40003 51 (TQ) 708 530 1256 744 267 11.2 1.5 25 LowlandItchen Highbridge +
Allbrook42010 41 (SU) 467 213 360 833 208 5.4 2.9 7.9 Major g.w. input
Exe Thorverton 45001 21 (SS) 936 016 601 1248 519 16.3 2 39 Mainly uplandWye Redbrook 55023 32 (SO) 528 110 4010 1011 752 74.3 11.6 175 Mainly uplandTeifi Glan Teifi 62001 22 (SN) 244 416 894 1382 593 28.9 3 67 Mainly uplandDee Erbistock/Manley
Hall67015 # 33 (SJ) 348 415 1019 1369 884 31.2 5.8 71 Mainly upland
Eden Warwick Bridge/Great Corby
76002 # 35 (NY) 470 567 1367 1272 950 34 6.9 73 Mainly upland
Eden Temple Sowerby 76005 35 (NY) 605 283 616 1146 950 14.4 1.9 33.4 Mainly upland
Notes: All data in Table 1.1 come from CEH’s Concise Register of Gauging stations (see www.nwl.ac.uk/ih/nrfa/station_summaries/crg.html) Some values are period specific and will differ slightly from statistics given elsewhere in this Report.
# These observed flow series are composite records combining the named gauges. The latter gauge is the one in current use. In the caseof the Eden to Warwick Bridge/Great Corby, catchment statistics relate to Warwick Bridge.

Science Report Reconstructed river flow series from 1860s to present 11
Figure 1.1 Catchment outlines with flow gauging stations
Science Report Reconstructed river flow series from 1860s to present 12
Table 1.2 Details relating to catchment observed-flow series (gauged and naturalised)
Catchment Observed flowsused in 1995and 1997reconstructions
Observed(gauged) flowsobtained forthe currentwork
Naturalisedflows obtainedfor the currentwork
Calibrationperiods(originalparameterestimation)
Tyne 1956-93 (NRA) 1956-2003 (CEH)1957-2003 (EA)
1956-1993 (CEH) 7 1962-1977 9
Tees 5 1956-93 (NRA) 1956-2002 (CEH)1982-2003 (EA)
1956-1993 (CEH) 7 1957-1971 9
Wharfe 2 1962-93 (NRA) 1973-2002 (CEH)1974-2003 (EA) 1995-2000 (EA)
1964-1977 9
Derwent 1977-93 (NRA) 6 1935-2003 (CEH)1935-2003 (EA) 1977-1997 (EA)
1977-1993 10
Ely Ouse 4 1926-93 (NRA) 1959-1976 (CEH)1950-2003 (EA)
1958-1975 (CEH)1980-2002 (EA)
1962-1977 9
Wensum 5 1960-93 (NRA) 6a 1960-2002 (CEH)1961-2003 (EA)
1964-1974 9
Thames 1 1954-93 (NRA) 1951-2002 (CEH)1955-2003 (EA)
1951-2002 (CEH)1955-2003 (EA)
1964-1976 9
Medway 3 1957-94 (NRA) 6 1956-2003 (CEH) 1956-1977 (CEH)1920-1996 (EA) 8
1970-1993 10
Itchen 3 1959-88 (NRA) 6 1958-2003 (CEH)1959-2003 (EA) 1970-2000 (EA) 8
1969-1988 10
Exe 1956-93 (NRA) 1956-2003 (CEH)1957-2003 (EA)
1958-1977 9
Wye 2 1937-93 (NRA) 1936-2003 (CEH)1970-2003 (EA)
1956-1975 9
Teifi 1959-95 (NRA) 1959-2003 (CEH)1960-2003 (EA)
1971-1994 10
Dee 1 1970-89 (NRA) 6 1937-2003 (CEH)1970-2003 (EA)
1969-2001 (CEH)1986-2002 (EA)
1970-1989 10
Eden1 (to TS) 1,2 1965-93 (NRA) 1964-2002 (CEH)1976-2003 (EA)
1965-1977 9
Eden2 (to WB) 2 1967-93 (NRA) 1959-1998 (CEH)1960-1996 (EA)
1967-1977 9
Notes: For more details relating to the above series, see Annex 1.
1 Potential for inaccuracies in flow gauging at very high flows 2 Changes made/expected in flow series due to rating changes 3 Naturalisation methods have changed with potential problems for reconstruction-
model calibration parameters 4 Doubts regarding the homogeneity of flow series 5 Gauged flow series are in need of naturalisation 6 Naturalised series were used for reconstruction-model calibration 6a A partially naturalised series was used during the 1995 flow reconstructions 7 There are significant missing periods within the naturalised series 8 Different naturalised series have superseded those used in earlier work (see 3) 9 For more details of calibrations, see Jones, 1984 10 For more details of calibrations, see Jones and Lister, 1997

Science Report Reconstructed river flow series from 1860s to present 13
2. FLOW RECONSTRUCTION METHOD
Few catchment models have been specifically developed for riverflow reconstruction.Exceptions are the conceptual models of Porter and McMahon (1971) and Manley (1978),and the empirical model developed by Wright (1978), at the Central Water Planning Unit(CWPU), used in this study. Two versions of Wright's model are available, depending on thetime base, monthly or daily. In the version used here, values of the logarithms of meanmonthly riverflow are related to linear combinations of data on soil moisture and effectiveprecipitation (precipitation minus actual evaporation) by regression techniques. The monthlymodel is described in detail in Jones (1983). Both the latter paper and Jones (1984) areincluded as Appendix C in the earlier Jones and Lister (1995) report.
The monthly incremental time-step of the model (used here) is one of the principal reasons forits simplicity of operation. The monthly time-step, however, can lead to (short-term)erroneous model output (reconstructed flow) in cold winter periods unless precipitation isstored as a snowpack until thaw conditions prevail. The model can be run in conjunction witha daily temperature database, which allows for the build-up and thawing of snowpacks, andthus allows a readjustment of the timing of the arrival of precipitation into the catchment flownetworks. For consistency with Jones and Lister (1995, 1997) the use of this modelcomponent has not been incorporated in the present updating of the reconstructed flow series.However, significant snowpacks only occur in particularly cold winters; usually in the moreupland parts of catchments in northern England. The relatively long run of mild winters in theUK means that the absence of the daily temperature model function has had minimal effect.
The model is straightforward to calibrate, the relationships between rainfall and riverflowbeing determined by regression techniques. The principal inputs required by the model aremonthly time series of catchment areal precipitation estimates. The model additionally usesconstant monthly values of actual evaporation (AE) based on long-term averages, rather thanvariable estimates of potential evapotranspiration (PET) calculated, for example, usingPenman's (1948) method. Wright (1978) argues that the use of these seasonally constantvalues leads to more accurate modelling of riverflow than estimating actual evaporation bymethods such as described by Thom and Ledger (1976). A study by Burt and Shahgedanova(1998) using long-term observations for Oxford suggests increases in PET since 1815.MORECS data for 1961-2002 would also suggest increases again for PET. Roderick andFarquhar (2002), in contrast, report global-scale decreases of pan evaporation over the last 50years, so AE trends may not follow those of PET. The modelling accuracy achieved by Jones(1984), Jones and Lister (1995, 1997, 1998) and this study, particularly in independentverifications, is further justification of the use of seasonally-constant AE values. Additionalsupport for the relative constancy of AE comes from Marsh (2001).
The current modelling exercise has used the same calibration parameters as thosecalculated/used in the earlier flow reconstruction exercises (Jones 1983, Jones 1984 and Jonesand Lister 1997). This is important to the maintenance of homogeneity of reconstructed flowseries. In all cases (during the earlier work), where the availability of observed flow datapermitted, an independent verification period was used, in addition to the calibration period,for model validation purposes. The current work has enabled us to extend the previous modelvalidation periods. The extension of validation periods has further tested the model under awider range of climatic conditions. Drought and low flows were very much a feature of theearlier work. Recent high rainfall periods have ‘exposed’ the model to extreme floodconditions (see Section 5).

Science Report Reconstructed river flow series from 1860s to present 14
3. CATCHMENT RAINFALL SERIES
During all previous flow reconstruction work (e.g. Jones 1984), catchment (areal) rainfall wasbased on a stable network of rain gauges, for all catchments. Stability is essential for themaintenance of homogeneity in areal rainfall calculations. Flow reconstruction modelcalibrations rely upon the homogeneity of rainfall and flow series so that flow reconstructionsoutside the calibration period range are reliable.
Stable networks were difficult to maintain during the updating exercise that took place in1994 (Jones and Lister, 1995, 1997, 1998), due to the closures of many raingauge stations.To maintain catchment networks when a gauge closes, it is necessary to find another currentrecord that is within a reasonable distance of the former. The new record can then beappended provided parallel records for a sufficient length of time are available to allow theadjustment of one record to that of the other (via scaling with respect to long-term annualaverages).
At the beginning of the current flow reconstruction work, requests were made to the EA forupdates to all previously used rainfall records. Early replies indicated that it was going to beimpossible to maintain anything like the original catchment raingauge networks. The pace ofchange, with regard to UK rain gauge network, appears to have accelerated in recent years.Alternative strategies were therefore invoked to enable updating of catchment rainfall seriesto 2001/2002, whilst maintaining homogeneity.
Two options became available. CEH maintain catchment/ sub-catchment rainfall series formost river basins in the UK. At the time of request, CEH areal rainfall series were updated tothe end of 2001. CEH were able to supply series for all 15 study catchments offering series(produced by the Met. Office), based on key raingauges on or near the catchment. However,due to the large-scale loss of key gauges by 1986, the Voronoi (a variant of the more well-known Thiessen polygon method) approach (which uses all available raingauges) has beenused after 1986 (Terry Marsh, CEH, pers. comm.). CEH also supplied areal series that werewholly based on the Voronoi approach and began in 1961. We found, during samplecomparisons, that the two (key to 1986 then Voroni from 1987 and solely Voronoi) serieswere very similar. We opted to further test the series based wholly on the Voronoi approach,in the belief that these may be marginally better with regard to homogeneity, as they havebeen produced in a consistent manner throughout their length.
The other option for extending our catchment rainfall series came via 5km x 5km griddedrainfall files that have been produced by the Met Office (henceforth MetO). These daily filesbegin in 1958 and are currently available to the end of 2002. Details of the production of thegridded time-series are in the form of an, as yet, unpublished report by Matthew Perry andDaniel Hollis, Met Office, Exeter (John Caesar, pers. comm.). All rainfall data available to theMet Office were used, with interpolation to the high-resolution grid, additionallyincorporating latitude/longitude/elevation and distance from the coast.
We were able to extract from the MetO dataset individual grid-box series by catchment. Bychoosing the grid boxes that contained our original (1995 and 1997) raingauge locations, wewere able to follow more closely the original methodology, which used the followingequation to produce catchment areal rainfall. The base periods 1941-70 and 1916-50 wereused in the original work, so were maintained here. For the current work, grid-box series aretreated as gauge series.

Science Report Reconstructed river flow series from 1860s to present 15
where, gi is the monthly total at gauge i of N gauges,AARi is the 1941-70 annual average rainfall at gauge i ,AAAR is the 1916-50 areal annual average rainfall for a catchment (derived by theMet Office in the 1960s) andACC will be the monthly average catchment rainfall
Catchment areal average rainfall series produced with this method and CEH’s Voronideterminations were compared with the overlap rainfall series from the previous work(overlap 1961-1993 or 1995). Catchment averages from the earlier (NRA/EA) work (e.g.Jones and Lister, 1995, 1997 and 1998) showed the best agreement with the series producedfrom the MetO data. Not all of the rainfall series produced from the 5km x 5km (MetO) fileswere closer to the original NRA/EA series, but the majority were. We opted for consistencyby choosing the MetO dataset and the above equation for the production of all areal rainfallseries. In addition, the use of these series allows the flow reconstructions to run through tothe end of 2002 – a year longer than would have been possible with the CEH series.
For a more detailed appraisal of the evidence that determined the outcome of our areal rainfallseries comparisons, see Figure A2.1. Here time series of annual totals, on a catchment bycatchment basis, show the NRA/EA, MetO and CEH series. Double-mass plots could havebeen used, but those in Figure A2.1 are more informative. The plots for, in particular, theTyne to Bywell, the Tees to Broken Scar, the Thames to Eynsham and the Ely Ouse toDenver Complex, show that the MetO data are closer to the NRA/EA than the CEH series.There is no notable problem with regard to the MetO series on any of the study catchments.
In addition, a similar exercise has been undertaken for winter (DJF) and summer (JJA)rainfall (Figures A2.2&.3). The closer fit of the MetO series for, notably, the Tyne, Tees,Thames and Ely Ouse is again evident. Table 3.1 compares the NRA/EA, CEH, and MetOareal rainfall series in terms of the annual average, maximum, minimum and standarddeviation (calculated over the period 1961-1993). The choice of the MetO rainfall series, overthose from CEH, is a direct result of our ability to follow the original methodology inconstructing the areal rainfall series. We are not in a position to say which of the series moreaccurately reflects the true catchment rainfall, but the more important consideration is themaintenance of homogeneity. The catchment rainfall/runoff model has been tuned (byregression) to the series used in the earlier NRA/EA work (Jones and Lister, 1995, 1997 and1998), so on this basis alone, the MetO data should produce more reliable and homogeneousrunoff series.
After calculating the catchment areal rainfall series, there is one further step required in orderto maintain the consistency (with regard to calibration periods) of the new rainfall series, andthus reconstructed flows. This is scaling (where necessary) of the MetO monthly arealrainfall series; so as to maintain the same period average as the NRA/EA areal rainfall seriesused earlier, during their overlap. Figure A2.4 shows these comparisons. Table 3.2 showsthe catchments where scaling of the new monthly rainfall series was deemed necessary. Allscaling factors (calculated based on annual average data) only adjust the MetO series bybetween ± 1 and 3%. In addition, the time-series comparisons in Figure A4.4 serve as afurther homogeneity test for the new rainfall series. Any significant differences would bevisible in these plots.
i
i
gAARAAAR
NACC
N
i∑=
=1
1

Science Report Reconstructed river flow series from 1860s to present 16
Table 3.1 Descriptive statistics for the three annual rainfall series (mm) 1961-1993
Catchment rainfall Minimum Maximum Mean St. Dev. Annual(1961-2002)
Wye_NRA/EA 752 1190 1006 111Wye_CEH 762 1165 1014 108Wye_MetO 746 1202 1015 112Exe_NRA/EA 951 1478 1232 133Exe _CEH 976 1477 1256 138Exe _MetO 962 1483 1235 134Eden1_NRA/EA 853 1474 1172 142Eden1_CEH 852 1446 1141 137Eden1_MetO 896 1525 1206 141Eden2_NRA/EA 935 1637 1304 150Eden2_CEH 903 1616 1273 148Eden2_MetO 999 1707 1351 150Tyne_NRA/EA 782 1277 1052 126Tyne _CEH 766 1212 1019 115Tyne _MetO 783 1296 1051 127Tees_NRA/EA 891 1497 1209 144Tees _CEH 863 1442 1148 136Tees _MetO 858 1430 1171 134Wharfe_NRA/EA 1108 1663 1422 164Wharfe _CEH 1072 1659 1383 165Wharfe _MetO 1081 1631 1389 160Wensum_NRA/EA 520 884 698 90Wensum _CEH 503 847 674 82Wensum _MetO 514 879 702 89Thames _NRA/EA 535 939 766 101Thames _CEH 510 884 737 94Thames _MetO 543 932 770 99Ouse_NRA/EA 456 778 619 82Ouse _CEH 460 724 592 74Ouse _MetO 457 783 621 84Medway_NRA/EA 570 974 751 88Medway _CEH 560 970 747 84Medway _MetO 563 966 751 87Itchen_NRA/EA 566 1123 840 110Itchen _CEH 584 1112 835 106Itchen _MetO 574 1118 850 111Teifi_NRA/EA 1074 1724 1376 153Teifi _CEH 1064 1721 1375 167Teifi _MetO 1080 1741 1407 161Dee_NRA/EA 1100 1664 1420 154Dee _CEH 1079 1585 1364 149Dee _MetO 1089 1621 1397 145Derwent_NRA/EA 719 1274 1000 131Derwent _CEH 724 1251 1008 125Derwent _MetO 736 1238 1002 127

Science Report Reconstructed river flow series from 1860s to present 17
Table 3.2 Average ratios (NRA and EA / MetO) for the 15 catchments
Catchment
Average ratio(NRA and EA/MetO)
1 Wye 0.992 Exe 1.003 EdenTemple 0.974 EdenWarwick 0.975 Tyne 1.006 Tees 1.037 Wharfe 1.028 Wensum 1.009 Thames 0.99
10 Ouse 1.0011 Medway 1.0012 Itchen 0.9913 Teifi 0.9814 Dee 1.0215 Derwent 1.00
If the MetO data deviated from the NRA/EA (original) series by a factor of more than +/-0.01 then theMetO records were adjusted (by multiplying them by the corresponding factor). The series whichneeded to be adjusted are shaded. The adjusted ratios are plotted in Figures A2.5 (note that in the newseries the mean is plotted in magenta).

Science Report Reconstructed river flow series from 1860s to present 18
4. RESULTS
Complete details of the catchment model calibration exercises are included in the previousstudies (Jones and Lister, 1995 and 1997). The calibration periods used are given in Table1.2. In this study the rainfall/runoff model has been further validated in a morecomprehensive manner for the 15 catchments in England and Wales via the use of longer andmore recent validation periods (and thus a greater range of climatic conditions). Thereconstructed flow series have been extended to the end of 2002. The flow reconstructionsrely upon the maintenance of homogeneous catchment monthly precipitation series (seeSection 3). The graphical analyses used in the maintenance of the precipitation series areshown in Figures A2.1-A2.5.
The results of the model validation exercise are shown graphically by the use of annual,seasonal and monthly time-series plots (Figures A2.6-A2.8), which compare observed andreconstructed flows. Discrepancies, on a short- or long-term basis are immediately apparentfrom the use of the graphical output. Table 4.1 compares various statistics between theobserved and reconstructed flows, for the period 1980-2002 (for three catchments the periodsare slightly shorter due to lack of available naturalised flows, see also Table 1.2). FigureA2.12 compares the distributions of observed and reconstructed flows through the use of flowduration curves. The period used here is generally 1961-2002, but this is reduced on a fewcatchments. These are a useful means of comparison, which look at the wider distribution offlows. As long as comparisons are made within a common timeframe, a close match betweenthe flow distributions of observed and reconstructed flows shows that the model is capturingthe catchment characteristics and how these translate into flow behaviour. The long (updated)flow series are shown in annual and seasonal time-series plots (Figures A2.9-A2.11). Avisual examination of these series allows a rapid appraisal of the temporal occurrence of wetand dry periods. The medium- to long-term fluctuations in flow behaviour (with a focus onannual and seasonal values) in response to climatic fluctuations, are easily recognized in theseplots.
Specific analysis on a catchment-by-catchment basis is given in Annex 1, with some generaldiscussion, when relevant to all catchments in section 5. In Table 4.1, model biases over the1980-2002 period are both positive and negative, but all are within a few percent of observedaverages. Reconstructed flows are higher than observed on 11 catchments on an annual basisand on 12 catchments for winter (December to February average). Lower flows than observedare reconstructed on the Wye, Exe and Tyne for annual and winter averages. In summer (Juneto August average), 7 reconstructions give higher flows and 7 lower, with the Medwayaverage exactly as observed. The standard deviation of annual average flows is higher thanobserved over the 1980-2002 period on 10 catchments, but only on the Thames and Ely Ouseare the differences large. Q95 is a well-used measure of low flows (being the flow exceeded95% of the time). Eight of the catchments have higher reconstructed Q95 than observed, butall values are within 15% of the observed values, except for the Wensum where the value isoverestimated by over 50%. Finally, the Durbin-Watson D statistic is a measure of theautocorrelation of the residual (observed minus reconstructed) flows. For the sample size of276 (23 years by 12 months) values below ~1.3 would indicate that the residuals are seriouslyautocorrelated (i.e. consistent differences of one sign or the other for long periods). It is notsurprising that these occur on the Wensum and Ely Ouse, catchments with high groundwatercontributions and thus long-term memories of past winter rainfall totals. The Wensum resultsare also influenced by the change in the abstraction point for public water supply for Norwichand this not being accounted for with a naturalised flow series.

Science Report Reconstructed river flow series from 1860s to present 19
Table 4.1 Descriptive statistics for the observed and reconstructed river flow series over the period 1980-2002 (all flows in m3s-1)
Annual Mean Winter (DJF) Mean Summer (JJA) Mean Standard Deviation(of annual average flows) Q95Catchments (Observed based on
1980-2002 unless stated)Obs Rec Obs Rec Obs Rec Obs Rec Obs Rec
Durbin-Watson D Statistic
Wye to Redbrook 83.11 79.10 150.11 142.97 27.91 26.73 14.70 14.81 13.00 11.55 1.34Exe to Thorverton 17.08 16.26 29.90 28.87 5.49 5.11 3.21 2.85 2.40 2.00 1.77Eden to Temple Sowerby 14.86 15.30 26.88 28.32 5.42 5.46 2.56 2.91 2.10 2.17 2.37Eden to Warwick Bridge 36.70 36.90 61.55 63.44 16.46 15.24 6.05 5.91 8.40 7.30 1.32Tyne to Bywell 47.76 46.39 79.40 74.11 22.34 21.45 7.94 8.32 9.20 7.16 2.12Tees to Broken Scar 17.22 20.63 28.84 35.76 7.73 7.81 3.47 3.94 4.10 2.35 1.37Wharfe to Addingham 14.21 14.93 23.07 23.42 6.41 6.79 2.74 2.61 2.20 2.96 1.66Wensum to Costessey Mill 4.05 4.90 5.83 7.12 2.31 2.78 1.13 1.35 1.20 1.88 0.81Thames to Eynsham 15.70 17.47 28.50 32.40 5.84 6.10 4.00 8.01 2.40 1.73 1.60Ely Ouse to Denver Complex 17.14 21.20 26.84 31.91 9.25 9.55 5.40 8.42 4.59 3.73 0.76Medway to Teston (1980-96) 10.94 11.64 21.25 21.80 2.86 2.72 2.98 4.24 1.23 1.34 1.59Itchen to Highbridge/Allbrook(1980-2000) 6.08 6.59 6.87 7.83 5.37 5.37 0.93 1.04 3.99 4.28 1.35Teifi to Glan Teifi 29.53 28.97 48.76 48.92 9.98 9.49 4.88 4.64 3.70 3.95 1.60Dee to Manley Hall/Erbistock 32.95 34.89 55.09 60.35 12.28 11.32 5.23 7.59 4.94 5.77 1.69Derwent to Derby/Longbridge(1980-1997) 19.94 21.41 32.61 33.56 9.76 10.38 3.84 4.78 5.30 5.57 1.96

Science Report Reconstructed river flow series from 1860s to present 20
5. ANALYSIS AND DISCUSSION
The results of the current flow reconstruction exercise (Section 4) indicate that the model hasworked well over the extended validation period. Most of the major differences between thereconstructed and observed flow series can be related to problems with the observed flowseries. On the Derwent, the Tees and Wensum, the naturalised flow series do not extend to2002. The use of different naturalisation techniques (as with the Itchen and Medway) hasaffected model performance. Here, it would be best to recalibrate the model using theimproved naturalised flows.
The relative simplicity, and thus ease of operation of the flow reconstruction technique usedhere, requires some clarification of the potential weaknesses that result from the simpleapproach (also see Section 2). The principal areas of possible error are:
• The use of constant monthly values for evapotranspiration losses• The potential for snowpacks to build up in winter periods, particularly in colder winters, on
the catchments having significant areas at high elevation• Possible modification of the regression relationships through time due to factors such as
changes in land use• Changes in the locations and numbers of raingauges on the catchments
Evaporation issues have been discussed in Section 2. The use of constant monthlyevapotranspiration values is vindicated by the accuracy of the reconstructions developed hereand in the earlier work (Jones, 1983; Jones, 1984; Jones and Lister, 1995 and Jones and Lister,1997). In summer, when evaporation is highest, average reconstructed flows (for 1980-2002,see Table 4.1) were higher on 7 catchments than observed and lower on 7 with the Medwaybeing exactly the same. Apart from the Wensum (where there is clear issue due to a change inabstractions, see Annex 1), all reconstructions are within 10% of observed summer averages.Errors due to snowfall in winter have not been serious due to the majority of winters in the past10 years being mild and also it is only a problem for monthly runoff averages if the snowpacklasts from one month to the next. The influence of changing model performance, due to factorssuch as land-use changes, is difficult to discern for some catchments, as first, differencesbetween naturalised flows used in the earlier NRA/EA work (Jones and Lister 1995 and 1997)and those recently available from the EA must be assessed. Changes to the raingauge networkcan influence areal catchment estimates, but these have been mitigated in this work by usingthe MetO data and only selecting grid boxes where gauges were located in the earlier NRA/EAwork.
In addition, it should be noted that the model calibration periods should be long enough toensure that sufficient extreme drought/low flow and high rainfall/flood flow periods are“experienced” by the calibration process. During all earlier flow reconstruction work (Jones,1983, Jones, 1984, Jones and Lister, 1995 and Jones and Lister, 1997), there was due regardfor the need for “full weather spectrum” calibration periods. However, this does not precludethe occurrence of even more extreme events (drought or flood) which may come along at somelater time. The current work has extended the validation period for all catchments by a furtherseven or nine years (see Sections 2 and 4).
From the perspective of model validation, it has been disappointing that maintenance of thehomogeneity of observed flow series (through naturalisation processes) has lapsed or not even
Science Report Reconstructed river flow series from 1860s to present 21
begun for several catchments. The main reasons for the inhomogeneity in the observed flowseries is the general increase in flow modifying activities due to increased use of waterresources. On two catchments, reassessment of rating curves has caused changes in historicobserved flows. Differences between observed and reconstructed flows, therefore, serve toemphasize the need for modelling exercises of this nature to maintain long-term homogeneousobserved flow series.
The high rainfall and extreme flood situations that affected many parts of the UK in the autumnof 2000, (Marsh and Dale, 2002) were certainly beyond the experience of earlier calibrations(see also Tables 1.2 and 5.1). It is possible that any discrepancies, between observed andreconstructed flows during this period, were due to conditions beyond the range experiencedby the statistical model. However, a more likely explanation of discrepancies during the year2000, for many of our study catchments, would be the inadequacy of flow gauging installationsduring such conditions (see Annex 1).
Despite the potential weaknesses of this model (see above), there is no evidence that it hasperformed less well than during the earlier calibration and validation work. An individualcatchment appraisal of model performance is given in Annex 1. The current work hasincreased confidence in the homogeneity of model output (reconstructed flows) and allows amore rigorous statistical examination of the long reconstructed flow series.
Table 5.1 (below) lists the five most extreme (reconstructed) high-flows for annual (Jan.-Dec.),autumn (SON) and autumn/winter (Oct.-April), on all 15 catchments, during the 138-yearperiod 1865-2002. Table 5.1 helps to illustrate the extreme nature of the autumn 2000 rainfalland resultant high flows into early 2001. For nine of the 15 catchments in the study, the annualmean flows, during 2000, equalled or exceeded the fourth most extreme event since 1865.Looking at autumn flows (September to November), nine catchments equalled or exceeded thefourth most extreme high flows since 1865. Indeed, for five of the catchments, the annual andautumn flows were either the most or second most extreme events in the 138-year period. Forthe other catchments, the events were still extreme for both annual and autumn flows, withrankings of tenth or below in all but two cases (Itchen for annual and Thames for autumn).Comparable periods to 2000/2001, on the long reconstructed series, occurred in 1903/1904 andin 1872/1873 and to a slightly lesser extent in 1954/1955 and 1960/1961. All periods, asexpected, were exceptionally wet, with 1872 the wettest year in the England and Wales rainfallseries, which extends back to 1766.
Shifting the focus to low flows, Table 5.2 lists the lowest five calendar-year and summer (Juneto August) average flows for the period 1865 to 2002. Extreme low flows were recorded onmany catchments during a number of years (e.g. 1870,1887,1921,1933/4,1976 and 1984). Inthe last 15 years, the years 1989 and 1995 are evident on more than one catchment, particularly1995.

Science Report Reconstructed river flow series from 1860s to present 22
The general increase in winter runoff during the last 15 years compared to the 1960s is likelydue to the shift in the North Atlantic Oscillation (NAO). More positive values of the NAOindicate stronger westerly airflow has prevailed over Britain since the late-1980s. This can beassociated with higher winter rainfall totals (Wilby et al, 1997). Various NAO indices areformerly defined by Jones et al (1997) and an NAO influence on British weather is clear duringthe months of November to April, most particularly for temperature. Climatological winter(DJF) NAO series explain about 40% of the variance of winter temperature variability forScotland and Northern Ireland (Jones and Lister, 2004).

Science Report Reconstructed river flow series from 1860s to present 23
Table 5.1 The occurrence of extreme high flows within the reconstructed flow record (1865-2002), for each catchment. The five mostextreme annual (Jan-Dec.), autumn (SON) and autumn/winter (Oct.-April) high mean-flows are ranked and expressed inpercentage terms with respect to their mean values during the period 1961-90
Tyne Tees Wharfe Derwent Ely Ouse Wensum Thames Medway Itchen Exe Wye Teifi Dee Eden1 Eden2Extreme high annual-mean flows
1 2000 1872 2000 2000 2001 2001 1951 2000 2001 1872 1872 1872 1872 1903 1903154% 172% 157% 167% 264% 190% 293% 239% 155% 158% 205% 175% 180% 181% 167%
2 1903 1903 1872 1872 1877 1872 1960 2001 1866 1960 1960 1903 2000 1872 1872153% 167% 142% 157% 213% 166% 292% 209% 141% 152% 175% 165% 177% 168% 161%
3 1872 1877 1954 1877 1937 1994 1916 1960 1951 1924 1903 1882 1903 1928 1954148% 161% 140% 153% 207% 163% 291% 191% 140% 150% 167% 152% 157% 163% 152%
4 1916 2000 1877 1966 1883 1912 1930 1951 1936 1882 2000 2000 1999 1954 2000145% 159% 137% 146% 187% 160% 271% 190% 135% 149% 166% 145% 156% 162% 150%
5 2002 1876 2002 1960 2000 1883 1915 1937 1961 2000 1877 1877 1960 1990 1877143% 146% 135% 142% 174% 158% 264% 181% 134% 145% 161% 143% 144% 156% 149%
Extreme high autumn-mean flows1 1903 1903 2000 2000 1875 1872 1960 2000 1960 1960 1872 1903 2000 1954 1954
267% 249% 242% 296% 347% 251% 832% 539% 175% 265% 308% 265% 307% 299% 258%2 2000 1954 1954 1960 1903 1993 1875 1960 1903 1924 1960 1872 1872 1967 1872
240% 242% 208% 231% 338% 241% 725% 427% 158% 244% 300% 228% 263% 214% 193%3 1944 2000 1967 1872 1882 2001 1903 1974 1879 1882 1875 2000 1954 1938 1967
230% 238% 178% 225% 316% 236% 670% 313% 150% 243% 272% 210% 258% 208% 188%4 1954 1872 1872 1903 1880 1912 1935 1935 1924 2000 1903 1954 1903 1903 2000
226% 218% 176% 222% 312% 221% 631% 295% 142% 237% 271% 193% 240% 203% 184%5 1967 1935 1944 1954 2000 1987 1882 1939 1951 1954 1954 1930 1960 2000 1891
219% 209% 168% 212% 304% 217% 605% 282% 141% 232% 259% 185% 215% 200% 181%Extreme high autumn/winter-mean flows (year labels apply to the period Jan.-April so 2001 is October 2000 to April 2001)
1 1877 1877 2001 2001 2001 1994 1930 2001 2001 2001 1877 2001 2001 1995 1913177% 185% 146% 184% 303% 215% 431% 349% 181% 164% 194% 159% 186% 166% 152%
2 1979 1995 1981 1966 1883 1873 1961 1961 1961 1961 2001 1904 1930 1903 1939149% 166% 144% 170% 245% 199% 365% 208% 176% 160% 191% 143% 164% 165% 151%
3 1904 2001 1995 1877 1877 2001 2001 1937 1936 1994 1930 1877 1994 1990 1925141% 158% 142% 156% 233% 191% 359% 202% 158% 150% 189% 142% 154% 164% 147%
4 2001 1939 1869 1883 1961 1988 1883 1995 1866 1995 1873 1873 1995 1939 1995140% 158% 138% 149% 228% 179% 312% 187% 151% 149% 176% 141% 148% 163% 146%
5 1939 1873 1867 1995 1994 1883 1936 1912 1904 1930 1883 1995 1999 1925 1903140% 145% 134% 146% 225% 163% 300% 187% 148% 148% 161% 140% 142% 161% 145%

Science Report Reconstructed river flow series from 1860s to present 24
Table 5.2 The occurrence of extreme low flows within the reconstructed flow record (1865-2002), for each catchment. The five mostextreme annual and summer (JJA) lowest mean-flows are ranked and expressed in percentage terms with respect to their meanvalues during the period 1961-90
Tyne Tees Wharfe Derwent Ely Ouse Wensum Thames Medway Itchen Exe Wye Teifi Dee Eden1 Eden2
Extreme low annual-mean flows (Jan.-Dec.)1 1870 1989 1887 1887 1921 1949 1871 1898 1921 1921 1964 1887 1933 1955 1973
66% 63% 62% 52% 33% 54% 35% 45% 75% 52% 55% 65% 59% 60% 59%2 1955 1905 1902 1921 1934 1948 1874 1921 1934 1870 1921 1921 1887 1973 1955
66% 65% 66% 59% 35% 56% 37% 45% 75% 55% 57% 69% 60% 60% 65%3 1989 1887 1933 1934 1976 1921 1893 1973 1976 1887 1973 1964 1893 1887 1964
66% 66% 66% 63% 44% 57% 38% 49% 76% 61% 62% 69% 62% 67% 67%4 1904 1964 1955 1976 1902 1973 1921 1901 1944 1896 1887 1892 1896 1941 1971
67% 66% 67% 65% 48% 58% 38% 53% 77% 66% 63% 70% 65% 67% 70%5 1973 1902 1964 1893 1944 1874 1934 1884 1989 1905 1890 1933 1902 1971 1996
68% 68% 69% 66% 49% 62% 38% 56% 77% 66% 67% 70% 68% 67% 71%
Extreme low summer-mean (JJA) flows1 1868 1995 1995 1868 1976 1921 1976 1976 1976 1870 1976 1976 1976 1984 1984
21% 16% 22% 48% 8% 58% 20% 45% 65% 26% 34% 31% 28% 28% 28%2 1995 1976 1887 1976 1921 1944 1870 1921 1921 1887 1870 1995 1870 1995 1995
26% 22% 23% 50% 20% 59% 22% 52% 74% 27% 40% 36% 33% 28% 36%3 1984 1989 1976 1887 1934 1874 1874 1949 1944 1976 1995 1984 1995 1887 1887
28% 22% 29% 51% 23% 61% 24% 52% 74% 29% 42% 38% 35% 30% 39%4 1887 1984 1869 1921 1868 1949 1896 1995 1938 1921 1896 1975 1868 2001 1976
29% 23% 37% 52% 33% 61% 28% 52% 76% 31% 43% 40% 39% 32% 43%5 1949 1869 1870 1959 1870 1976 1893 1893 1929 1876 1984 1869 1869 1868 1869
29% 25% 37% 54% 35% 61% 31% 53% 78% 32% 43% 42% 43% 33% 45%

Science Report Reconstructed river flow series from 1860s to present 25
6. CONCLUSIONS
There is no doubt that flows, in many of the UK’s catchments, are becoming less natural asresource use practices change. Although most the 15 catchments are still suitable for flowreconstruction, changes on the Wensum and Ely Ouse since the mid-1980s make them lessuseful for this sort of work. The need for long homogeneous flow series is thus moreimportant to assess, and, at the same time, predict some of the effects of the changes takingplace. Added to this are the potential effects of climate change and how such changes mayaffect catchment rainfall-runoff behaviour.
Naturalised flow series can only extend to the length of observed flow series and requireconsiderable information regarding historic water use/management practices. Thenaturalisation of flow series is a very complex exercise, particularly where resource use isextensive and complex (see e.g. EA Naturalisation Guidance V2.0, 2001). The exploitation ofgroundwater, and thus the effect on flows via groundwater dynamics, adds further tiers ofcomplexity and thus uncertainty to naturalisation processes. This makes naturalisation a veryinvolved and costly process.
The flow reconstruction model has performed as well as during previous reconstruction work.The model validation period now includes both extreme dry and wet periods. This increasesthe confidence in reconstructed flows, which, for many purposes, are a more viablealternative to the production of naturalised flows.
The long-run reconstructed flow series are now available to assist with the planning of long-term water resource and water quality management strategies. The series can also be used forneighbouring catchments with similar hydrologic and geologic conditions. The principal costto develop long series for new catchments is in the development of long monthly rainfallseries for a number of sites within or near to a new catchment.

Science Report Reconstructed river flow series from 1860s to present 26
7. LOGISTICAL PROBLEMS AND RECOMMENDATIONS
The main recommendations from the current flow reconstruction exercise are in response tothe logistical problems that emerged whilst undertaking the work. The logistical problems(listed below) have been emphasized due to their general worsening since previous flowreconstruction work was completed in the early to mid-1990s. The problems are centred uponthe need to acquire appropriate data for the input to and assessment of the flow reconstructionmodel. The main problems encountered were:
1. It is clear that the operation of many raingauge stations has ceased on almost all the 15catchments studied. This has serious implications for the maintenance of homogeneousprecipitation series.
2. Flow data series were not as readily available from the EA as was originally hoped.Considerable effort was required (following a centralized request to regional personnel) toextract the required data for some catchments. Data formats (received) variedconsiderably.
3. The existence and length of naturalised flow series was disappointing. These are vital tothe calibration and validation of a variety of catchment models. Whilst acknowledgingthe difficulties with the naturalisation process for the more complex catchments, it issurprising that more effort has not gone into this process. The discontinuation of previousnaturalised flow series caused problems with validation exercises, given the use of earliercalibrated model parameters for flow reconstructions (using the now discontinued series).We recognise, however, that naturalisation techniques should always take advantage ofnew methods and additional information. Reassessment of stage/discharge relationshipshas also occurred on a couple of the catchments.
4. The apparent lack of easily available metadata relating to the recording of flows, atspecific locations, caused as many problems as the difficulties encountered with theacquisition of the flow data series. Homogeneous observed flow series, particularlyduring model calibrations and validations, are essential to the optimization of modelperformance. Any information, which allows an assessment of observed flow series withregard to homogeneity, is vital. Local knowledge of gauge performance is also important,particularly at different levels of flow.
7.1 Recommendations
We suggest that the following measures would benefit those, both inside or outside of the EA,who have the need for reliable riverflow and related precipitation data. These are very muchappropriate to any future updating (or extension) of the reconstructed flow series.
1. Pressure should be exerted by Met Office and the EA, aimed at themaintenance/restoration of vital raingauge stations/networks. The availability of long-term homogeneous rainfall records is essential for many reasons – including catchment-modelling purposes. The updating/future updating of the reconstructed flow serieswould not have been possible without the use of the gridded 5km x 5km griddedresource from MetO. However, the usefulness (homogeneity) of this resource isthreatened, if long-run rainfall records are allowed to be discontinued at the rate seen inrecent years.

Science Report Reconstructed river flow series from 1860s to present 27
2. In consultation with the Met Office, the real-time updating of the riverflowreconstructions could be easily made, if the MetO gridded data are routinely updated.
3. The collation and quality control processes which precede the distribution ofprecipitation data should not be unduly delayed. Met Office quality assessments of dailyprecipitation data can take several months.
4. More effort (including the better co-ordination of the different parties involved) shouldgo into the provision of a regularly maintained national database for riverflows. Ofparticular importance here is the need for a comprehensive metadata listing.
5. The EA should address the needs for greater effort towards flow naturalisation exercises.

Science Report Reconstructed river flow series from 1860s to present 28
ACKNOWLEDGEMENTS
Thanks go to the EA personnel (both centralized and regional) who helped with the provisionof rainfall, flow and associated data.
We also thank Terry Marsh and others at CEH who made a big contribution through theircollaboration, which made further provision of catchment rainfall and riverflow series.
Thanks also go to MetO for producing the 5km x 5km gridded rainfall resource, which cameto us via Dr John Caesar (Hadley Centre). Thanks also to Bob Riddaway (Group Head,Development Resourcing and Technology) for allowing its use for this project.
Finally, we thank Rob Wilby, Terry Marsh and X Y for comments on an earlier draft of thisreport.

Science Report Reconstructed river flow series from 1860s to present 29
REFERENCES
Burt T P and Shahgedanova M, 1998 An historical record of evaporation losses since1815 calculated using long-term observations from the Radcliffe MeteorologicalStation, Oxford, England. Journal of Hydrology 205, 101-111.
Environment Agency 2001 Good practice in flow naturalisation by decomposition,National Hydrology Group, Environment Agency, Version 2.0, 100pp.
Jones P D, 1983 Riverflow reconstructions and their use, Pt. I and II. Water Services87, 485-486, 528-531.
Jones P D, 1984 Riverflow reconstruction from precipitation data. Journal ofClimatology 4, 171-185.
Jones P D and Lister D H, 1995 Extended flow records at key locations in England andWales. Phase 1, Project Report for 512/2/N&Y, National Rivers Authority, Bristol,82pp.
Jones P D and Lister D H, 1997 Extended flow records at key locations in England andWales. Phase 2, R&D Technical Report W25, Environment Agency, Bristol, 106pp.
Jones P D and Lister D H, 1998 Riverflow reconstructions and their analysis on 15catchments over England and Wales. International Journal of Climatology 18, 999-1013.
Jones P D and Lister D H, 2004 The development of monthly temperature series forScotland and Northern Ireland. International Journal of Climatology 24, 569-590.
Jones, P D Ogilvie A E J and Wigley T M L, 1984 Riverflow Data for the UnitedKingdom: Reconstructed data back to 1844 and historical data back to 1556. ClimaticResearch Unit Research Publication, CRURP 8, 166 pp.
Jones P D Jónsson T. and Wheeler D, 1997 Extension to the North Atlantic Oscillationusing early instrumental pressure observations from Gibraltar and SW Iceland.International Journal of Climatology 17, 1433-1450.
Marsh T J, 2001 Climate change and hydrological stability: a look at long-term trendsin southeastern Britain, Weather 56, 319-328.
Marsh T J and Dale M, 2002 The UK floods of 2000/01 – a hydrometoerologicalappraisal. CIWEM Journal 16, 180-188.
Manley R E, 1978 The use of a hydrological model in water resource planning. Proc.Institute. Civil Eng., Part 2, 63, 223-235.
Penman H L, 1948 Natural evaporation from open water, bare soil and grass. Proc.Roy. Soc., Ser. A, 193, 120-145.

Science Report Reconstructed river flow series from 1860s to present 30
Porter J W and McMahon T A, 1971 A model for the simulation of streamflow fromclimatic records. Journal of Hydrology 13, 297-324.
Roderick M L and Farquhar G D, 2002 The cause of decreased pan evaporation overthe past 50 years. Science 298, 1410-1411.
Thom A S and Ledger D C, 1976 Rainfall, runoff and climate change. Proc. Institute.Civil Eng., Part 2, 61, 633-652 and 63, 721-731
Wilby R L O’Hare G and Barnsley N, 1997 The North Atlantic Oscillation and BritishIsles climate variability, 1865-1995. Weather 52, 266-276.
Wright C E, 1978 Synthesis of riverflows from weather data. Technical Note No. 26,Central Water Planning Unit, Reading, U.K.

Science Report Reconstructed river flow series from 1860s to present 31
ANNEX 1 A DETAILED DISCUSSION OF RECONSTRUCTION-MODEL PERFORMANCE WITH THE FOCUS ONVALIDATION
A1.1 Introduction
This section looks at model performance, both recent and that from earlier work, on acatchment-by-catchment basis. This is done by reference to different ways (both statisticaland graphical) of comparing observed and reconstructed flows. The current flowreconstruction exercise has updated the reconstructed flow series and, effectively, extendedthe model validation period on all catchments. Since the quality of observed flow series is ofparamount importance to the validation exercise, matters relating to their quality figurelargely in the following sub-sections.
Observed flow data are required to both calibrate the statistically-based catchment model(undertaken in earlier papers and reports, see Jones and Lister, 1995, 1997 and 1998) and toassess the accuracy of the reconstructed flows. Divergence between reconstructed andobserved flows does not necessarily mean that there is something wrong with the statisticalmodel or the catchment rainfall input series. It could just as easily be that a catchment beginsto exhibit changed flow behaviour that could be due to a change in the contribution ofartificial influences on the flow regime, or some inhomogeneity occurs within the observedflow record.
For any statistical based (multiple regression) runoff model to function properly – in the sameway as previously, calibration should use naturalised flow series or be based on an observedflow series relating to a period when (unnatural) external influences on the flow regime wereminimal and at a relatively constant level. If these assumptions are satisfied, together withthe maintenance of homogeneous areal rainfall series, divergence between observed andreconstructed flows is an indicator of either changes in the characteristics of the catchment(perhaps due to changing land use) or in the observed flows themselves.
At the beginning of the current work to update the flow reconstructions for 15 catchments inEngland and Wales, it was hoped that the Environment Agency could provide observed flowseries for all catchments. It was also hoped that the EA could provide naturalised series forthose catchments that have significant flow modification due to abstractions and discharges orother aspects of flow management. A request was made through the Technical Advisor,Hydrometry Monitoring and Assessment Process, for observed and observed/naturalised flowseries (wherever available). In addition, any information was requested which is relevant tothe quality of observed flow series.
It soon became apparent that the necessary flow data and associated information were notreadily available. For this reason, a parallel request was made to the National RiverflowArchive (run by CEH, Wallingford). We therefore received observed flow series form twodifferent sources. In addition, we have the observed flow series (NRA/EA) that were used forthe earlier flow reconstruction studies. The CEH web-based resources were used heavilywithin following sub-sections for general catchment descriptions and metadata relating toflow gauging activities (see http://www.nwl.ac.uk/ih/www/products/iproducts.html).

Science Report Reconstructed river flow series from 1860s to present 32
It was necessary to collate and compare all of the flow data and associated information. Inaddition to deciding which of the flow series was best (in terms of appropriate period,accuracy, missing values etc.) for comparison with the reconstructed flows, it was necessaryto make comparisons with the original flow series used in the earlier work. The latterexercise was undertaken by reference to overlap periods. This was vital to the maintenance ofcontinuity (homogeneity) of the observed flow series.
A1.2 Dee to Manley Hall/Erbistock
A1.2.1 Catchment basics and flows
The upper reaches of this catchment drain land which has elevations approaching 900 m. Acombination of high elevations and a westerly location means high rainfall, with annual totalsexceeding 2000 mm, for parts of the upper catchment (see Table 1.1 and Jones and Lister,1997).
The flow regime for the Dee, to the gauging point, has been subject to a high degree ofmanagement since the latter half of the 19th Century. For this reason, the flow reconstruction-model calibration exercise used naturalised flows (Jones and Lister, 1997). The availableflow series ended in 1989. For the current updating operation, the EA have supplied anaturalised series from 1986 to 2002. This series agrees perfectly with that used in theoriginal calibration work – for the overlap period 1986-89. CEH have also supplied the samenaturalised flow series. We have been able to update observed (naturalised) flows to the endof 2002.
A1.2.2 Model performance
The flow reconstruction model calibration and validation work (Jones and Lister, 1997) washampered by the rather short (1970-89) naturalised flow series that was available at the time.The whole of the observed flow series was used for calibration. Validation had to rely onsomewhat indirect methods with use of a less reliable flow series (1938-55) for Erbistock anda series from Lake Vyrnwy. Model performance was assessed as being good. There was atendency to both over- and under-estimate winter high flows, which was thought to be due tothe build up and loss of snowpacks (see general discussion in Sections 2 and 5).
The comparison of reconstructed and observed flows, during the current work, shows thatmean annual flows (Table 3.1.) are well reconstructed during the period 1986-2002. TheDurbin-Watson D statistic, at 1.95, shows that there is little autocorrelation in the residual(reconstructed – observed) flows for this catchment. The flow duration curves (Figure A2.12)shows very close agreement between observed and reconstructed flows.
There is, however, a significant discrepancy during the years 1999 and 2000 (see FigureA2.6), when the reconstructed flow value is c.a. 20% higher than the observed. These twoyears were exceedingly wet in this region (also see discussion in Section 5. concerning modelcalibrations and extremes). Indeed, the total annual precipitation, for both years, was higherthan any year since at least 1958 (Figure A2.1). The flow gauge at Manley Hall “drowns” atflows in excess of 200 m3s-1. In addition to the extreme flooding in the autumn of 2000 (seeSection 5), there was some severe flooding on this catchment during December 1999. It ispossible that the peak flows during the periods of maximum flows were underestimated.

Science Report Reconstructed river flow series from 1860s to present 33
A1.3 Derwent to Derby St. Marys/Longbridge Weir
A1.3.1 Catchment basics and flows
This largely upland catchment receives high rainfall amounts in its upper reaches. The sub-catchment above Yorkshire Bridge gauging station has an annual average rainfall in excess of1300 mm. As with the Dee (above), the Derwent catchment has a long history of flowmanagement, for the purposes of public supply (see also Table 1.1 and Jones and Lister,1997).
The naturalised flow series used in the original model calibration covered the period 1977-93(Jones and Lister, 1997). The EA has supplied a naturalised series that extend to 1997; butthis series appears to have been discontinued. There is perfect agreement between the old andnew naturalised series, for their period of overlap 1977-93. However, due to the lack ofnaturalised data since 1997, we can only update the observed (naturalised) series by fouryears for the purposes of comparing reconstructed and “observed” flows.
A1.3.2 Model performance
The flow reconstruction model calibration and validation work (Jones and Lister, 1997) wasslightly hampered by the rather short (1977-93) naturalised flow series that was available atthe time. The whole of the observed flow series was used for calibration. Validation reliedupon comparisons of reconstructed flows with a partially naturalised flow series forLongbridge Weir, which covered the period 1936-74. Model performance was goodthroughout the calibration and validation periods.
The comparison of reconstructed and observed flows, during the current work, shows thatmean annual flows (Figure A2.6 and Table 3.1.) are still being accurately reconstructed, atboth annual and seasonal scales. The Durbin-Watson D statistic (1.96) shows noautocorrelation in flow residuals. It is unfortunate that there are no naturalised flowsavailable beyond 1997 (see above). However, there are no problems apparent with thereconstruction model for this catchment.
A1.4 Eden to Temple Sowerby
A1.4.1 Catchment basics and flows
This upland catchment on the western slopes of the Northern Pennines receives high rainfall,with a 1961-90 catchment average of 1146mm (see Table 1.1). It is not highly developedwith regard to water resources. The flow record has not been regarded as needingnaturalisation; but the following observations should be noted when using the observed flowrecord at this site.
Flow gauging at Temple Sowerby utilizes an open channel site which has had numerousrating changes due to relatively slight changes in the downstream bed and channel. Extremefloods used to bypass and flood the building (holding the stage recorder) before the extensionof floodbanks and the raising of the building in 1995. It seems that re-calculations willrequire new flood ratings and these will extend prior to the 1995 changes. In addition, a lowbed control weir was built in 2002 and a new rating is required from then (Susan Taylor, pers.comm.). High flows at this location are, therefore, suspect. Any inaccuracy with high flows

Science Report Reconstructed river flow series from 1860s to present 34
would affect the accuracy of annual mean flows. Recent improvements should improve thefuture quality of gauged flows.
A1.4.2 Model performance
During the earlier flow reconstruction work on this catchment (Jones and Lister, 1995), modelperformance was seen as good. In the current flow reconstruction work, there are nosystematic problems apparent when observed and reconstructed flows are compared, onannual and seasonal scales (Figures A2.6. and A2.7.). Mean annual and seasonal statistics(Table 3.1.) reveal no significant problem. The Durbin-Watson D statistic shows noautocorrelation in the flow residuals for Temple Sowerby. It is difficult to focus on anyisolated discrepancies in the light of the problems with flow gauging on this catchment. It islikely that the reconstructed flows, for this catchment, are a useful guide to the errors withinthe observed flow records.
A1.5 Eden to Warwick Bridge/Great Corby
A1.5.1 Catchment basics and flows
Warwick Bridge/Great Corby is downstream of Temple Sowerby. However, the flow regimeis still that of an upland catchment that receives high rainfall. There is some artificialinfluence on the flows in this catchment, through abstraction for public supply. However,there have been no receipts of naturalised flows from either CEH or EA and it seems safe toassume that flows are essentially natural. The 1961-90 catchment average is 1272 mm (seeTable 1.1).
From the perspective of flow measurement, Warwick Bridge is another open channel site thathas always been affected by weed growth. Regular rating changes over the period of recordto 1988 have probably kept pace with the changed flow characteristics. Thus the quality oflow to medium flows (to 1988) is assessed as reasonable. The use of a single rating equationafter 1988 means that low to medium flow measurement could be poor after that date. Inaddition, the assessment of the quality of high flows, throughout the period of record, is saidto be poor and high flow values should be treated with extreme caution. (Susan Taylor,Hydrometry Officer, EA, North West Region pers. comm.).
Warwick Bridge gauging station was closed in 1998. A new gauging station (believed to be apurpose built structure) at Great Corby, was opened in 1998. This site is about 3km upstreamof Warwick Bridge. The quality of flows at this site is said to be good. Unfortunately, wehave not received any parallel flow series (overlapping data from Warwick Bridge and GreatCorby), which would have allowed a comparison of the two series and thus information thatwould have guided any attempt at merging the Great Corby flow series with that fromWarwick Bridge. However, given the uncertainty over the accuracy of gauged flows atWarwick Bridge since 1988, the close proximity of the two gauging locations and the lack ofany significant abstractions/discharges or tributary confluence points between them, thecombination of the two flow series seems reasonable.

Science Report Reconstructed river flow series from 1860s to present 35
A1.5.2 Model performance
During the earlier flow reconstruction work on this catchment (Jones and Lister, 1995), modelperformance was seen as good. In the current flow reconstruction work, there are nosystematic problems apparent when observed and reconstructed flows are compared, onannual and seasonal scales (Figures A2.6. and A2.7.). Mean annual and seasonal statistics(Table 3.1.) reveal no significant problem. The Durbin-Watson D statistic shows someautocorrelation in the flow residuals with the reconstructions for the Eden to WarwickBridge/Great Corby. It is difficult to focus on any isolated discrepancies (see Figures A2.6and A2.7) in the light of the problems with flow gauging on this catchment. It is likely thatthe reconstructed flows, for these catchments, are a useful guide to the errors within theobserved flow records.
A1.6 Exe to Thorverton
A1.6.1 Catchment basics and flows
The upper reaches of the Exe drain Exmoor, in the south west of England. Annual rainfall ishigh at 1248 mm (Table 1.1). Flows from this catchment appear to be subject to a significantamount of interference - in the form of abstractions and discharges. In addition, flowregulation is listed as an artificial influence on flows. Low flows are affected significantly byflow management practices. However, neither CEH nor EA were able to supply a naturalisedseries. We have assumed that the degree of flow modification has not been consideredsufficiently large to warrant flow naturalisation exercises. Comparison of observed flowseries showed no material differences between the CEH and EA series. In addition, theobserved series used previously agreed with the EA and CEH series.
A1.6.2 Model performance
Despite the potentially flow modifying activities (above), during the previous flowreconstruction work (Jones and Lister, 1995), the reconstruction model performance wasclassed as good, for both high and low flows. The generally close agreement, in the currentwork, between reconstructed and observed flows (Figure A2.6.), suggests that the flowmodifying activities may have been relatively constant since the model was originallycalibrated (Jones, 1984). The annual and seasonal statistics (Table 3.1.) add to the generalimpression of good model performance. The Durbin-Watson D statistic (1.77) shows lowlevels of autocorrelation in the flow residuals. There is a period between 1979 and 1988(Figure A2.6.), when observed flows are predominantly higher than reconstructed. There isno obvious reason why this phenomenon should be apparent.
A1.7 Itchen to High Bridge/Allbrook
A1.7.1 Catchment basics and flows
The Itchen catchment is situated in the south of England and receives an annual rainfall(1961-90) of 833 mm (Table 1.1). It is very permeable and the flow regime is heavilydominated by the groundwater component (see Jones and Lister, 1997). The degree of flowmanagement, through abstractions and discharges, is relatively constant through the year dueto the dominance of groundwater exploitation, for public supply purposes. When the originalreconstructed flow model was calibrated (Jones and Lister, 1997), a naturalised flow series
Science Report Reconstructed river flow series from 1860s to present 36
was provided which covered the period 1959-88. This series was provided by the HampshireArea Office, National Rivers Authority. The naturalisation process used was notsophisticated in that groundwater components were not processed through a groundwatermodel (Joe Pearce, pers. comm.). The loss to flows, from comparing the observed andnaturalised series during their period of overlap (1959-88), was 1.03 m3s-1. However, thisnaturalised series has not been updated.
Observed (non-naturalised) flows have been provided by EA and CEH. EA have alsoproduced a naturalised series (covering the period 1970-2000), which uses a modellingapproach (the Itchen Groundwater Model has a 250 m grid and twice monthly time-steps).The model was developed for EA by Entec (Alison Rennie, pers. comm.). This is different tothe naturalisation methods used for the 1959-88 series (above). Some simple comparison(Table A1.1) has been undertaken between the NRA and newly acquired naturalised seriesduring their overlap period, 1970-88:
Table A1.1 Comparing the NRA and EA naturalised flow series for the Itchen
1970-88 NRA EAMean 6.317 6.171Min 3.295 3.294Max 10.996 11.654Q1 4.926 5.036Q3 7.655 7.205Stdev 1.682 1.565
The EA-modelled and NRA naturalised series are in close agreement during the 1970-88period (correlation = 0.94). It therefore seems reasonable to use the EA naturalised series forthe purposes of updating when comparing reconstructed and “observed” flows.
A1.7.2 Model performance
During the current flow reconstruction exercise, the comparison of observed andreconstructed flows is not as good as it was in the earlier work. (see Figures A2.6, A2.7 andTable 3.1). The naturalised flow series in current use has a different and more sophisticatedmeans of derivation (see above). This is not the same series used for model calibration andvalidation and this could be the reason for the apparently lower model performance in thecurrent work. The Durbin–Watson statistic has a value (1.35, see Table 3.1.) which indicatesless autocorrelation than in the earlier reconstruction work. This may be due to the use of amore sophisticated naturalisation model. Some further consideration should be given to thequestion of a model re-calibration exercise for this catchment.
A1.8 Medway to Teston
A1.8.1 Catchment basics and flows
This catchment is situated in the drier south east of England. Annual rainfall (1961-90) is 744mm (Table 1.1). Water resource use in this catchment, whilst not heavy, is complex andsufficiently large to merit flow naturalisation. Flow modification can arise from abstractions,discharges and flow augmentation measures. When the flow reconstruction model wascalibrated for this catchment (Jones and Lister, 1997), a naturalised flow series was used.

Science Report Reconstructed river flow series from 1860s to present 37
This series was provided by personnel from the Worthing Office via the East Malling Office(Kent Area) of the NRA. The series covered the period 1957-94.
Recent enquiries with the EA suggest that there has been no continuation of this naturalisedseries. Instead, a new series has been produced which is based on the “Catchmod” (EA in-house catchment rainfall-runoff model). This model is relatively sophisticated (withsimulation of ground store dynamics) and should not necessarily be expected to follow thenaturalised flow series that was used for the earlier model calibration work. The currentobserved (naturalised) series is rather different to that used in model calibration. Thecomparison of annual mean flows (reconstructed and naturalised, see Figure A2.6), showsthat the reconstruction model is producing flows that are lower than those “observed”.
A detailed comparison of the NRA and EA naturalised series (Figure A1.1, below), and theCEH observed series, over their common period (1957-94), shows that the EA modellingoperation is producing higher flows in winter months. This suggests that there is either aproblem with the modelling process or the earlier naturalised series was in error, for winterhigh-flow months. If the latter explanation is the correct one, the original calibration exercisewas biased.
Figure A1.1 Comparing observed with the NRA and EA naturalised flows, Medway toTeston, 1957-94
Comparing the naturalized (old and new) with observed flow series at Teston, 1957-94
0
10
20
30
40
50
60
70
80
1957
1959
1961
1963
1965
1967
1969
1971
1973
1975
1977
1979
1981
1983
1985
1987
1989
1991
1993Fl
ow (c
umec
s)
EA_nat_new NRA_nat_old CEH_obs

Science Report Reconstructed river flow series from 1860s to present 38
A1.8.2 Model performance
In the earlier flow reconstruction model calibration and validation work (Jones and Lister,1997), a naturalised series was obtained for the Medway, which covered the period 1957-94(see above). This divided into calibration and validation periods (1970-93 and 1957-69,respectively); during which the performance of the flow reconstruction model was better forthe calibration period (Jones and Lister, 1997). Mean flows were 10.42 m3s1 (obs.) and 10.08m3s-1 (rec.) during calibration. For the validation period, mean flows were 12.25 m3s-1 (obs.)and 10.88 m3s-1 (rec.). With the Durbin-Watson statistics > 1.5, there was littleautocorrelation in flow residuals.
As with the Itchen, the naturalisation methodology has changed. This means that the currentflow reconstructions are based (via model calibration) on a different flow series to thatcurrently available for comparison. Examination of the time series of annual-meanreconstructed and observed flows (Figure A2.6), shows that, during the period 1963-88,observed flows are consistently higher than the reconstructed ones. This is not inconsistentwith the earlier work where the original calibration/validation modelled output had a problemwith under prediction of flows, particularly during the validation period. Added to this is theeffect that the new naturalised (observed) series, during the period 1970-93 has a mean flow,which is 0.5 m3s-1 higher than that of the original naturalised (observed) series. This“additional flow” is primarily appearing in the wet winter months (see Figures A2.6. andA2.7.).
It seems likely that the earlier naturalised series, used for calibration and (earlier) validation,had problems and these problems have adversely affected the calibration parameters; suchthat a new calibration exercise (using the current naturalised series) is required. However,observed and reconstructed flows are close towards the end of the comparison shown inFigure A2.6. In addition, the current naturalised series is based on a modelling exercise thatwas calibrated by reference to a (non-modelled) naturalised series that covered the period1990-96 (Tim Norton, pers. comm.). It is difficult to ascertain whether or not the use of theoriginal calibration parameters is still justified. A more in-depth comparison of the twonaturalised flow series is necessary before the existing calibration parameters are rejected.
A1.9 Ely Ouse to Denver Complex
A1.9.1 Catchment basics and flows
This large lowland catchment is utilized extensively for water resources and effluentdischarge purposes. The mean annual rainfall (1961-90) is low at 587 mm (Table 1.1).However, the flood threat, due to its large area (3430 km2 ) and the associated potential todeliver large flows to its low-lying, lower reaches during prolonged wet periods, hasimplications for flow measurement activities in the downstream channel. The low elevation ofthe valuable agricultural land, in much of the lower reaches poses problems of prolongedwater logging of soils. With a long history of complex engineering works to improvedrainage and prevent flood damage in the lower flood plain, the flow measurementconsiderations are equally complex – with a great deal of artificial influence and potential forerror.
Flows from the Ely Ouse can be diverted through a flood relief channel at times of high flow.In addition, there are other possible (managed) routes of flow, for resource use purposes. The

Science Report Reconstructed river flow series from 1860s to present 39
measurement of flows, coming from the Ely Ouse, is thus a complex process at this point.Hence, the availability of flow series is rather restricted. However, a naturalised flow serieshas been received from EA for Denver Complex which covers the period 1980-2002.
A previous flow reconstruction exercise (Jones and Lister, 1995) obtained an observed flowrecord for the Ely Ouse at Denver Complex which was not naturalised. A comparison of thisseries with that from the EA (above), shows a net loss of c.a. ten percent. That is, resourceuse within the catchment to Denver reduces flows by about ten percent. This is a significantreduction.
A1.9.2 Model performance
During earlier flow reconstruction work for this catchment (Jones and Lister, 1995), themodel performance was satisfactory, with most deficiencies probably due to the complexityof both the catchment and its water-use strategies. This includes the potential for measuredflows to be greatly affected by, for example, land drainage/flood control measures. Inaddition, a long lag (up to 18 months) between rainfall events and their manifestation asriverflow, (via groundwater movements) is built into the reconstruction model for thiscatchment. The Durbin-Watson D statistic, at c.a. 1, indicated a fair degree of autocorrelationin flow residuals. Reconstructed flows tended to be higher than observed though this wasprobably, in part, due to the non-availability of a naturalised flow series at the time. Indeed, itwas difficult to get an observed flow series that reflected the net “arrivals” at DenverComplex, due to the complexity of flow management at this point.
The current flow reconstruction work for this catchment is suffering from the lack of alengthy homogeneous naturalised flow series – from the perspective of comparingreconstructed and observed flows. The series recently obtained from the EA covers theperiod 1980-2002. The comparison between reconstructed and observed annual-mean flows(Figure A2.6.), shows reasonably good agreement between 1980 and 1991. However, there isa notable discrepancy during the period 1992-1995 and even larger discrepancies around2000/2001, when the reconstructed flows are significantly higher than the naturalised values.Autocorrelation is less than it was during the previous flow reconstruction exercise with aDurbin-Watson D statistic of 1.2.
The large discrepancies between reconstructed and observed flows for this catchment, inrecent years, cast serious doubt on the current validity of the original (parameter) calibrations.However, it is also possible that the observed flow series, for the Ely Ouse to Denver, containlarge-scale inhomogeneities. Given the quantity and extent of channel and othermodifications (for drainage and flood control) in this catchment, the likelihood that observedflows do not always accurately reflect the flows that are generated within the catchment,appears to be high – especially under flood-flow conditions. Despite extensive enquiries toEA regional offices, it has not been possible to determine the exact nature of the problemswith the Ely Ouse flows (reconstructed or observed). Unless more information can beobtained, which will allow judgement on the use of the original calibration parameters for thiscatchment, flow reconstructions by the current technique should be discontinued.

Science Report Reconstructed river flow series from 1860s to present 40
A1.10 Teifi to Glan Teifi
A1.10.1 Catchment basics and flows
This catchment has many high flow events due to high elevation in the upper reaches and itslocation in the west of the UK. Mean flow is 29 m3s-1 and average rainfall (1961-90) is 1382mm (see Table 1.1 and Jones and Lister, 1997). It has a relatively low level of developmentwith regard to water resources. For this reason, flows are regarded as being almost natural.Thus, only standard observed flow series are available.
Updated flow series have been received and there are few discrepancies when compared withthose used in the original reconstruction modelling exercise for the overlap period, 1959-95(Jones and Lister, 1997). However, a notable exception was apparent when the EA observedflow series was used to compare observed and reconstructed flows, on a seasonal basis.Summer (JJA) average flows showed large disagreement during the years 1966, 1970 and1972. Part of this problem was explained when it was realized that there was an error in theEA flow data for 1972. This does not explain the remaining summer discrepancies during thelate 1960s-early 70s. We conclude that there may have been a problem with the flow gaugingat Glan Teifi during this period.
A1.10.2 Model performance
In the original calibration/validation exercise, there was good agreement between observedand reconstructed flows. The Durbin–Watson D statistics > 1.5 for the calibration andvalidation periods suggests low autocorrelation in the flow residuals. During the currentwork, there is very good agreement between observed and reconstructed flows (see Table3.1). There are a few occasions in the mid-1960s/late 1970s-early 80s, when some divergenceis evident, from the time-series of observed and reconstructed annual mean flows (see FiguresA2.6, A2.7 and above).
A1.11 Thames to Eynsham
A1.11.1 Catchment basics and flows
The catchment to Eynsham is primarily rural with development being mainly confined to thevalley bottom. Annual rainfall (1961-90) is 730 mm and the mean flow is c.a.14 m3s-1 - seeTable 1.1. There are occasions when the complex system of flow gauging can be bypassed byextreme high flows. There is some development of water resource use, which affects flows.The effect on flows has increased considerably from a low level in the 1950s. The EA havemaintained their naturalised flow series, which was used in the updating of flowreconstructions (Jones and Lister, 1995). Comparison of the flow series used then and thatreceived recently (for their overlap period, 1970-93), shows excellent agreement.
A1.11.2 Model performance
In the earlier work (Jones and Lister, 1995), there was a tendency for the reconstructions tooverestimate peak flows in winter. However, it was noted that some peak flows may beunder-measured by the flow gauging facility (see above). In the current work, the flowreconstruction model has generally worked well in the estimation of flows. The Durbin-Watson statistic D (1.6) shows a degree of autocorrelation in flow residuals. There is still a

Science Report Reconstructed river flow series from 1860s to present 41
tendency to overestimate, as the comparisons of observed and reconstructed flows show (seeFigure A2.6 and Table 3.1). Given the occasions of very high flows during the late 1990sand, particularly, the autumn of 2000 (see Section 5), it is quite likely that measured flowseries are in error for some months.
A1.12 Tees to Broken Scar
A1.12.1 Catchment basics and flows
This mainly upland catchment is located on the eastern slopes on the northern Pennines.Rainfall (1961-90) and average flows are quite high at 1141 mm and c.a 17 m3s-1 (see Table1.1). Due to its proximity to the conurbation of Teesside - with its industrial development -the Tees has a long history of exploitation for resource use. There is significant export ofwater to direct supply reservoirs and some upstream abstraction. In addition, flows can beaugmented in drought years.
Despite the potential for significant flow modification, the EA have not been able to supply anaturalised flow record. Comparison between the flow series received from the EA and thatused for the flow reconstruction updating exercise (Jones and Lister, 1995), showsconsiderable differences during the overlap period, 1982-93 (the new EA observed seriesbegins in 1982).
CEH have provided a naturalised series for Broken Scar. This series spans the period 1956-93. However there are two significant missing periods: mid 1971-mid-1974, and mid-1978-end of 1985. Comparing all three flow series for their common period 1986-94, there aresome significant differences:
Table A1.2 Comparing EA, CEH (naturalised) and NRA observed flows
1986-94 EA observed CEH naturalised NRAMean 17.11 22.64 19.13Min 3.20 1.69 3.41Max 57.00 70.25 64.77Q1 6.77 8.85 7.79Q3 24.85 33.74 28.14Stdev 12.58 15.77 13.72
When the original model calibration for this catchment took place (see Jones and Lister, 1995,– Section 4.2), the flow series used was naturalised. The lack of a complete and lengthynaturalised series shows in the flow comparison plots (reconstructed versus observed) – seeFigure A2.6. Reconstructed flows are consistently higher than observed. This is apparentfrom the mid-1960s to the present day. (Since the original reconstructions ran to the late1970s, there is a suggestion that the observed flow series was reduced due to abstractions bythe mid-1960s). A complete reassessment of all of the flow records for this location wouldseem to be warranted.
Science Report Reconstructed river flow series from 1860s to present 42
A1.12.2 Model performance
During the original flow reconstruction work for this catchment (see Jones and Lister, 1995),a naturalised flow series was used for calibration purposes. The effects of resource use have asignificant impact on flows (see above). In the absence of a recent naturalised flow series forthis catchment, we must conclude that the discrepancies between observed and reconstructedflows (see Figure A2.6) are due to the flow lost to abstractions. Annual differences in meanflows (observed versus reconstructed) are greater than 3 m3s-1, during the period 1980-2002.Looking at winter flows, the differences are greater at c.a. 7 m3s-1. It is likely that surfacereservoirs are being replenished during the winter high flow periods. The differencesbetween the observed and reconstructed series are in reasonable agreement with thedifferences between the NRA/EA observed and naturalised flows (from CEH) as discussedabove.
It appears that the reconstructed flow series for this catchment is a good proxy for anaturalised series.
A1.13 Tyne to Bywell
A1.13.1 Catchment basics and flows
This mainly upland catchment lies between the northern Pennines and the Cheviot Hills.Rainfall (1961-90) and flows are quite high at 1016 mm and c.a. 34 m3s-1 (see Table 1.1).The needs of the industrial conurbations of Tyneside and Wearside have a bearing onresource use in this catchment. This produces some flow modification. The presence of thelarge reservoir Kielder Water (designed as a river-regulating resource which was completedin 1982), in the north Tyne valley, gives the potential for significant flow modification. Thisreservoir supports flows in the Derwent, Wear and Tees as well as the Tyne itself. However,the Kielder scheme has not been used to the extent that was envisaged prior to constructionand export/loss of flow has not occurred to the degree that had been proposed.
The EA was not able to supply any naturalised flow series for this catchment. CEH havesupplied a naturalised series that covers the period 1956-93. However, there is a lengthyperiod with no data, which runs from late-1971 to the end of 1984. The NRA-observedseries, which covers the period 1970-93 (see Jones and Lister, 1996), agrees very well withthe recently supplied observed series from the EA.
The overlap periods between the CEH naturalised series and EA observed series occur beforeand after the presence/operation of Kielder Water. This allows an assessment of the effect onflows (at Bywell), that the operation of Kielder has had. Looking at the period 1957-69 (pre-Kielder), the naturalised and observed series are very close. Naturalised monthly flows, withone exception, are greater than those observed by an average value of two percent. Duringthe period 1985-93 (post-Kielder), naturalised monthly flows are both greater and less thanthe observed values and the degree of flow modification is much larger than it was pre-Kielder. The maximum loss of flow was 19% and the maximum addition to flow was 133%.The mean effect on flows is, however, less than one percent (augmentation). These values arein-line with the concept of abstraction to maintain levels in Kielder with flow compensationfor down-stream abstractions and flow augmentation in drought periods.

Science Report Reconstructed river flow series from 1860s to present 43
Looking at the comparison of observed and reconstructed annual-mean flows for thiscatchment (see Figure A2.6), the agreement is good. This corroborates the evidence thatsuggests a minimal net effect of Kielder Water on catchment flows.
A1.13.2 Model performance
There is considerable scope in this catchment for resource use (including flow augmentationpractices) to significantly affected flows. However, whilst flows are considerably affected ona seasonal basis, the net annual effect is small (see above).
During the earlier flow reconstruction work (see Jones and Lister, 1995), the flowreconstruction model performance was good. Reconstructed flows, at 42.7 m3s-1, were justthree percent below the observed (for the period 1970-93) value. The Durbin-Watson Dstatistic was > 1.7 and thus showed little autocorrelation in flow residuals.
In the current flow reconstruction work (for the period 1980-2002), the model is still under-predicting flows by about three percent. The Durbin-Watson D statistic, at 2.1 (see Table 3.1)shows virtually no autocorrelation in flow residuals. The reconstruction model appears to beworking very well on an annual basis. Any divergence on a seasonal basis, which can besignificant (see Figure A2.7.) is probably due to flow management activities.
A1.14 Wensum to Costessey Mill
A1.14.1 Catchment basics and flows
The Wensum is a small, lowland and mainly rural catchment. Situated in the drier east ofEngland, rainfall (1961-90) and flows are low at 672 mm and c.a. 4 m3s-1 (Table 1.1).Baseflow is an important component of runoff. Throughout the period of flow measurement(since 1960), flows to Costessey Mill have been affected by a moderate level of surface andgroundwater abstractions.
A significant surface abstraction facility has operated at Costessey Pits since 1988. Water istaken at this point to contribute towards the public water supply for the City of Norwich. Atthe time of updating the reconstructed flow series for Costessey Mill in 1994 (Jones andLister, 1995), a naturalised flow series was obtained which compensated for the flow loss atCostessey Pits. During the period 1988-93, the average loss of flow was around 0.5 m3s-1.Whilst this loss is not large when compared to larger catchments, it is significant for theWensum at this point where the mean flow is about 4 m3s-1.
Neither the EA nor CEH have been able to supply an updated naturalised flow series.However the EA predict that one will be available in late spring, 2004. Examination of themean-annual time-series of reconstructed and observed flows clearly shows the effect of thepost-1987 abstractions (see Section A2.6) upstream of the flow gauge.
A1.14.2 Model performance
In the earlier flow reconstruction work (see Jones and Lister, 1995), model performance wasgood. A slight tendency for modelled flows to be greater than observed (4.3 versus 4.1 m3s-1)was seen as signs of greater losses due to increased groundwater abstractions. A Durbin-Watson D statistic of 1.3 indicates some autocorrelation in flow residuals. Comparisons in

Science Report Reconstructed river flow series from 1860s to present 44
this work, used a flow series that was not fully naturalised but adjusted for a new abstractionintake (PWS), which has operated just upstream of the flow gauge since 1988.
In the current flow reconstruction work, we were unable to obtain any naturalised series. Thecomparison plot of observed and reconstructed flows (Figure A2.6.), shows a distinct andconsistent difference between the two series from c.a. 1989 onwards. This is in accord withthe known increase in surface abstractions close to the gauging station. The flowreconstruction model is effectively producing a naturalised series for this catchment.However, the recent catchment (gridded MetO) rainfall series shows a slight increase inrecent times (when compared to the original – see Figure A2.5). The flow “discrepancy” dueto the post-1988 abstractions may be underestimated.
A1.15 Wharfe to Addingham
A1.15.1 Catchment basics and flows
Flows in this predominantly upland and rural catchment originate over the eastern slopes ofthe Pennines. With high elevations and high rainfall (1961-90 average is 1383 mm), thisrelatively small catchment is high yielding. Mean flow is c.a. 14 m3s-1 (Table 1.1). Gaugedflows are affected by the operation of reservoirs. Both abstractions and regulation dischargesare made upstream of the gauging point.
Both the EA and CEH have supplied observed series for this gauge. The two series are invery good agreement. When the latter observed series are compared with the earlier seriesused during the last flow reconstruction updates (Jones and Lister, 1995), there are somedifferences which tend to occur in the wetter months. The earlier series has higher valuesthan the current observed versions (during the overlap period, 1970-93). The differencesoccur before 1982. It appears that a new rating has been applied to pre-1982 flows, which hasreduced high flows. This is in accordance with information given by CEH, which implies theneed for a new rating. However, the CEH text states that the “revised rating is still to beapplied”; thus suggesting the latter comment is out-of-date.
The EA have been able to supply a short run of naturalised flows for the period, 1995-2000.The average loss to flow at Addingham is 0.6 m3s-1during this period. This amounts to aboutfour percent of the average flow at this point.
A1.15.2 Model performance
The earlier model performance was very good, with observed and reconstructed mean flowsof 14 and 14.1 m3s-1, respectively. The Durbin-Watson statistic D was 2.1 and thus indicatednegligible autocorrelation in flow residuals. In the current work, observed and reconstructedflows (see Table 3.1) are still very close at 14.2 and 14.9 m3s-1, respectively. The Durbin-Watson D statistic, at 1.66 is showing a weak autocorrelation. The time-series plots (seeFigure 2.6.), show good agreement between observed and reconstructed flows, at the level ofannual mean-flow. The slight increase in the difference between observed and reconstructedflows (0.6 m3s-1), is in exact agreement with the current estimated loss to flows, due toresource use (see above).
Science Report Reconstructed river flow series from 1860s to present 45
A1.16 Wye to Redbrook
A1.16.1 Catchment basics and flows
This catchment is the largest of the 15 catchments involved in the current flow reconstructionexercise. Having a significant upland area and being situated in the west of the UK, the(1961-90) average rainfall is quite high at 1011mm (Table 1.1). Mean flows are large (c.a. 74m3s-1), when compared with others in our sample. The flow regime is moderately affected byexports and regulations.
Observed flows have been supplied by EA and CEH. Agreement is very good between thetwo series. When compared with the NRA series, used in the earlier flow reconstructionexercise in 1994 (see Jones and Lister, 1995), differences are very small. Thus, with nosignificant disagreement between flow series, it can be assumed that observed flows arereasonably homogeneous and suitable for comparison with the reconstructed series. The EAdo not expect to have a fully naturalised flow record for a few years. When it is available, itwill only cover the period from 1989 (Kellie Hayes, pers. comm.).
A1.16.2 Model performance
In the previous flow reconstruction work for this catchment (Jones and Lister, 1995), thereconstruction model performed well. Observed and reconstructed flows were very close at73.7 and 71.2 m3s-1, respectively. The Durbin-Watson D statistic was 2.2 and thus indicatedlittle autocorrelation in flow residuals. In the current work, the comparison of observed andreconstructed (annual) time-series (Figure A2.6) shows good agreement, particularly, in themore recent period. There is a tendency for observed flows to be greater than reconstructed(83.1 versus 79.1 m3s1), for the period 1980-2002 (see Table 3.1). However, most of the“excess” observed flow occurred during the mid/late-1980s. This period of largerdiscrepancies was noted in the previous reconstruction work (Jones and Lister, 1995). Thereis no readily available explanation of this phenomenon. There is a potential for severesummer weed problems at the gauging station and a possibility that the most extreme flowscan circumnavigate the gauging installation. Looking at the comparison of observed andreconstructed summer flows (Figure A2.7), does show where the weed problem may haveinduced some false high flow readings in the 1980s, but the discrepancies here are not asconsistent as those in the annual mean-flow series. If any high flows had by-passed thegauging process, reconstructed flows would have been higher than those observed.

Science Report Reconstructed river flow series from 1860s to present 46
ANNEX 2 GRAPHICAL ANALYSES FOR THE AREAL RAINFALLDETERMINATION AND FLOW RECONSTRUCTION
This section holds all of the graphical analyses for the work relating to the production ofcatchment areal rainfall series and for the flow reconstruction exercise.

Science Report Reconstructed river flow series from 1860s to present 47
Figure A2.1 Total annual rainfall (mm) for the original NRA/EA (blue line), CEH(red line) and MetO (green line) series
1958 1962 1966 1970 1974 1978 1982 1986 1990 1994 1998 2002600
800
1000
1200
1400
1600
1800
2000
Time
Tot
al A
nnua
l Pre
cip.
Wye to Redbrook
NRA / EACEHMetO
1958 1962 1966 1970 1974 1978 1982 1986 1990 1994 1998 2002800
1000
1200
1400
1600
1800
2000
2200
Time
Tot
al A
nnua
l Pre
cip.
Exe to Thorverton
NRA / EACEHMetO
1958 1962 1966 1970 1974 1978 1982 1986 1990 1994 1998 2002800
1000
1200
1400
1600
1800
2000
2200
Time
Tot
al A
nnua
l Pre
cip.
Eden to Temple Sowerby
NRA / EACEHMetO
1958 1962 1966 1970 1974 1978 1982 1986 1990 1994 1998 2002800
1000
1200
1400
1600
1800
2000
2200
Time
Tot
al A
nnua
l Pre
cip.
Eden to Warwick Bridge
NRA / EACEHMetO
1958 1962 1966 1970 1974 1978 1982 1986 1990 1994 1998 2002600
800
1000
1200
1400
1600
1800
Time
Tot
al A
nnua
l Pre
cip.
Tyne to Bywell
NRA / EACEHMetO
1958 1962 1966 1970 1974 1978 1982 1986 1990 1994 1998 2002800
1000
1200
1400
1600
1800
2000
Time
Tot
al A
nnua
l Pre
cip.
Tees to Broken Scar
NRA / EACEHMetO
1958 1962 1966 1970 1974 1978 1982 1986 1990 1994 1998 20021000
1200
1400
1600
1800
2000
2200
Time
Tot
al A
nnua
l Pre
cip.
Wharfe to Addingham
NRA / EACEHMetO
1958 1962 1966 1970 1974 1978 1982 1986 1990 1994 1998 2002400
600
800
1000
1200
Time
Tot
al A
nnua
l Pre
cip.
Wensum to Costessey Mill
NRA / EACEHMetO

Science Report Reconstructed river flow series from 1860s to present 48
Figure A2.1 (cont.) Total annual rainfall (mm) for the original NRA/EA (blue line),CEH (red line) and MetO (green line) series
1958 1962 1966 1970 1974 1978 1982 1986 1990 1994 1998 2002400
600
800
1000
1200
1400
Time
Tot
al A
nnua
l Pre
cip.
Thames to Eynsham
NRA / EACEHMetO
1958 1962 1966 1970 1974 1978 1982 1986 1990 1994 1998 2002400
600
800
1000
Time
Tot
al A
nnua
l Pre
cip.
Ely Ouse to Denver Complex
NRA / EACEHMetO
1958 1962 1966 1970 1974 1978 1982 1986 1990 1994 1998 2002500
700
900
1100
1300
1500
Time
Tot
al A
nnua
l Pre
cip.
Medway to Teston
NRA / EACEHMetO
1958 1962 1966 1970 1974 1978 1982 1986 1990 1994 1998 2002500
700
900
1100
1300
1500
Time
Tot
al A
nnua
l Pre
cip.
Itchen to Highbridge/Allbrook
NRA / EACEHMetO
1958 1962 1966 1970 1974 1978 1982 1986 1990 1994 1998 20021000
1200
1400
1600
1800
2000
2200
2400
Time
Tot
al A
nnua
l Pre
cip.
Teifi to Glan Teifi
NRA / EACEHMetO
1958 1962 1966 1970 1974 1978 1982 1986 1990 1994 1998 20021000
1200
1400
1600
1800
2000
2200
2400
Time
Tot
al A
nnua
l Pre
cip.
Dee to Manley Hall/Erbistock
NRA / EACEHMetO
1958 1962 1966 1970 1974 1978 1982 1986 1990 1994 1998 2002600
800
1000
1200
1400
1600
1800
Time
Tot
al A
nnua
l Pre
cip.
Derwent to Derby/longbridge
NRA / EACEHMetO

Science Report Reconstructed river flow series from 1860s to present 49
Figure A2.2 As in Figure A2.1 except for winter (Dec.-Feb.) total (mm)
1958 1962 1966 1970 1974 1978 1982 1986 1990 1994 1998 200260
180
300
420
540
660
780
Time
Win
ter
Pre
cip.
Tot
al
Wye to Redbrook
NRA / EACEHMetO
1958 1962 1966 1970 1974 1978 1982 1986 1990 1994 1998 200290
240
390
540
690
840
Time
Win
ter
Pre
cip.
Tot
al
Exe to Thorverton
NRA / EACEHMetO
1958 1962 1966 1970 1974 1978 1982 1986 1990 1994 1998 200290
240
390
540
690
Time
Win
ter
Pre
cip.
Tot
al
Eden to Temple Sowerby
NRA / EACEHMetO
1958 1962 1966 1970 1974 1978 1982 1986 1990 1994 1998 2002120
240
360
480
600
720
Time
Win
ter
Pre
cip.
Tot
al
Eden to Warwick Bridge
NRA / EACEHMetO
1958 1962 1966 1970 1974 1978 1982 1986 1990 1994 1998 200260
180
300
420
540
Time
Win
ter
Pre
cip.
Tot
al
Tyne to Bywell
NRA / EACEHMetO
1958 1962 1966 1970 1974 1978 1982 1986 1990 1994 1998 2002120
240
360
480
600
720
Time
Win
ter
Pre
cip.
Tot
al
Tees to Broken Scar
NRA / EACEHMetO
1958 1962 1966 1970 1974 1978 1982 1986 1990 1994 1998 2002120
240
360
480
600
720
840
Time
Win
ter
Pre
cip.
Tot
al
Wharfe to Addingham
NRA / EACEHMetO
1958 1962 1966 1970 1974 1978 1982 1986 1990 1994 1998 20020
120
240
360
Time
Win
ter
Pre
cip.
Tot
al
Wensum to Costessey Mill
NRA / EACEHMetO

Science Report Reconstructed river flow series from 1860s to present 50
Figure A2.2 (cont.) As in Figure A2.1 except for winter (Dec.-Feb.) total (mm)
1958 1962 1966 1970 1974 1978 1982 1986 1990 1994 1998 20020
150
300
450
Time
Win
ter
Pre
cip.
Tot
al
Thames to Eynsham
NRA / EACEHMetO
1958 1962 1966 1970 1974 1978 1982 1986 1990 1994 1998 200230
90
150
210
270
330
Time
Win
ter
Pre
cip.
Tot
al
Ely Ouse to Denver Complex
NRA / EACEHMetO
1958 1962 1966 1970 1974 1978 1982 1986 1990 1994 1998 20020
150
300
450
Time
Win
ter
Pre
cip.
Tot
al
Medway to Teston
NRA / EACEHMetO
1958 1962 1966 1970 1974 1978 1982 1986 1990 1994 1998 20020
150
300
450
600
Time
Win
ter
Pre
cip.
Tot
al
Itchen to Highbridge/Allbrook
NRA / EACEHMetO
1958 1962 1966 1970 1974 1978 1982 1986 1990 1994 1998 20020
150
300
450
600
750
900
1050
Time
Win
ter
Pre
cip.
Tot
al
Teifi to Glan Teifi
NRA / EACEHMetO
1958 1962 1966 1970 1974 1978 1982 1986 1990 1994 1998 20020
150
300
450
600
750
900
1050
Time
Win
ter
Pre
cip.
Tot
al
Dee to Manley Hall/Erbistock
NRA / EACEHMetO
1958 1962 1966 1970 1974 1978 1982 1986 1990 1994 1998 20020
150
300
450
600
750
Time
Win
ter
Pre
cip.
Tot
al
Derwent to Derby/longbridge
NRA / EACEHMetO

Science Report Reconstructed river flow series from 1860s to present 51
Figure A2.3 As in Figure A2.1 except for summer (Jun.-Aug.) total (mm)
1958 1962 1966 1970 1974 1978 1982 1986 1990 1994 1998 200260
180
300
420
540
Time
Sum
mer
Pre
cip.
Tot
al
Tyne to Bywell
NRA / EACEHMetO
1958 1962 1966 1970 1974 1978 1982 1986 1990 1994 1998 200260
180
300
420
540
Time
Sum
mer
Pre
cip.
Tot
al
Tees to Broken Scar
NRA / EACEHMetO
1958 1962 1966 1970 1974 1978 1982 1986 1990 1994 1998 200260
180
300
420
540
Time
Sum
mer
Pre
cip.
Tot
al
Wharfe to Addingham
NRA / EACEHMetO
1958 1962 1966 1970 1974 1978 1982 1986 1990 1994 1998 200260
180
300
420
Time
Sum
mer
Pre
cip.
Tot
al
Wensum to Costessey Mill
NRA / EACEHMetO
1958 1962 1966 1970 1974 1978 1982 1986 1990 1994 1998 200260
120
180
240
300
360
420
Time
Sum
mer
Pre
cip.
Tot
al
Wye to Redbrook
NRA / EACEHMetO
1958 1962 1966 1970 1974 1978 1982 1986 1990 1994 1998 200260
180
300
420
540
Time
Sum
mer
Pre
cip.
Tot
al
Exe to Thorverton
NRA / EACEHMetO
1958 1962 1966 1970 1974 1978 1982 1986 1990 1994 1998 200260
120
180
240
300
360
420
480
Time
Sum
mer
Pre
cip.
Tot
al
Eden to Temple Sowerby
NRA / EACEHMetO
1958 1962 1966 1970 1974 1978 1982 1986 1990 1994 1998 200260
180
300
420
540
Time
Sum
mer
Pre
cip.
Tot
al
Eden to Warwick Bridge
NRA / EACEHMetO

Science Report Reconstructed river flow series from 1860s to present 52
Figure A2.3 (cont.) As in Figure A2.1 except for summer (Jun.-Aug.) total (mm)
1958 1962 1966 1970 1974 1978 1982 1986 1990 1994 1998 20020
150
300
450
Time
Sum
mer
Pre
cip.
Tot
al
Thames to Eynsham
NRA / EACEHMetO
1958 1962 1966 1970 1974 1978 1982 1986 1990 1994 1998 200260
120
180
240
300
360
420
Time
Sum
mer
Pre
cip.
Tot
al
Ely Ouse to Denver Complex
NRA / EACEHMetO
1958 1962 1966 1970 1974 1978 1982 1986 1990 1994 1998 200260
120
180
240
300
360
420
Time
Sum
mer
Pre
cip.
Tot
al
Medway to Teston
NRA / EACEHMetO
1958 1962 1966 1970 1974 1978 1982 1986 1990 1994 1998 200230
90
150
210
270
330
390
Time
Sum
mer
Pre
cip.
Tot
al
Itchen to Highbridge/Allbrook
NRA / EACEHMetO
1958 1962 1966 1970 1974 1978 1982 1986 1990 1994 1998 20020
150
300
450
600
Time
Sum
mer
Pre
cip.
Tot
al
Teifi to Glan Teifi
NRA / EACEHMetO
1958 1962 1966 1970 1974 1978 1982 1986 1990 1994 1998 20020
150
300
450
600
Time
Sum
mer
Pre
cip.
Tot
al
Dee to Manley Hall/Erbistock
NRA / EACEHMetO
1958 1962 1966 1970 1974 1978 1982 1986 1990 1994 1998 20020
150
300
450
600
Time
Sum
mer
Pre
cip.
Tot
al
Derwent to Derby/longbridge
NRA / EACEHMetO

Science Report Reconstructed river flow series from 1860s to present 53
Figure A2.4 Ratios of NRA-EA/MetO rainfall data
1961 1965 1969 1973 1977 1981 1985 1989 19930.90
0.95
1.00
1.05
1.10
Ratio NRA−EA / MetO(Wye to Redbrook)
mean = 0.99
1961 1965 1969 1973 1977 1981 1985 1989 19930.90
0.95
1.00
1.05
1.10
Ratio NRA−EA / MetO(Exe to Thorverton)
mean = 1.00
1961 1965 1969 1973 1977 1981 1985 1989 19930.90
0.95
1.00
1.05
1.10
Ratio NRA−EA / MetO(Eden to Temple Sowerby)
mean = 0.97
1961 1965 1969 1973 1977 1981 1985 1989 19930.90
0.95
1.00
1.05
1.10
Ratio NRA−EA / MetO(Eden to Warwick Bridge)
mean = 0.97
1961 1965 1969 1973 1977 1981 1985 1989 19930.90
0.95
1.00
1.05
1.10
Ratio NRA−EA / MetO(Tyne to Bywell)
mean = 1.00
1961 1965 1969 1973 1977 1981 1985 1989 19930.90
0.95
1.00
1.05
1.10
Ratio NRA−EA / MetO(Tees to Broken Scar)
mean = 1.03
1961 1965 1969 1973 1977 1981 1985 1989 19930.90
0.95
1.00
1.05
1.10
Ratio NRA−EA / MetO(Wharfe to Addingham)
mean = 1.02
1961 1965 1969 1973 1977 1981 1985 1989 19930.90
0.95
1.00
1.05
1.10
Ratio NRA−EA / MetO(Wensum to Costessey Mill)
mean = 1.00

Science Report Reconstructed river flow series from 1860s to present 54
Figure A2.4 (cont.) Ratios of NRA-EA/MetO rainfall data
1961 1965 1969 1973 1977 1981 1985 1989 19930.90
0.95
1.00
1.05
1.10
Ratio NRA−EA / MetO(Thames to Eynsham)
mean = 0.99
1961 1965 1969 1973 1977 1981 1985 1989 19930.90
0.95
1.00
1.05
1.10
Ratio NRA−EA / MetO(Ely Ouse to Denver Complex)
mean = 1.00
1961 1965 1969 1973 1977 1981 1985 1989 19930.90
0.95
1.00
1.05
1.10
Ratio NRA−EA / MetO(Medway to Teston)
mean = 1.00
1961 1965 1969 1973 1977 1981 1985 1989 19930.90
0.95
1.00
1.05
1.10
Ratio NRA−EA / MetO(Itchen to Highbridge/Allbrook)
mean = 0.99
1961 1965 1969 1973 1977 1981 1985 1989 19930.90
0.95
1.00
1.05
1.10
Ratio NRA−EA / MetO(Teifi to Glan Teifi)
mean = 0.98
1961 1965 1969 1973 1977 1981 1985 1989 19930.90
0.95
1.00
1.05
1.10
Ratio NRA−EA / MetO(Dee to Manley Hall/Erbistock)
mean = 1.02
1961 1965 1969 1973 1977 1981 1985 1989 19930.90
0.95
1.00
1.05
1.10
Ratio NRA−EA / MetO(Derwent to Derby/longbridge)
mean = 1.00

Science Report Reconstructed river flow series from 1860s to present 55
Figure A2.5 As in Figure A2.4 but with the adjusted ratios (plots with ‘mean’ in redcolour are the same as in Figure A2.4. For the adjusted ratios, ‘mean’ isin magenta)
1961 1965 1969 1973 1977 1981 1985 1989 19930.90
0.95
1.00
1.05
1.10
Ratio NRA−EA / MetO(Wye to Redbrook)
mean = 0.99
1961 1965 1969 1973 1977 1981 1985 1989 19930.90
0.95
1.00
1.05
1.10
Ratio NRA−EA / MetO(Exe to Thorverton)
mean = 1.00
1961 1965 1969 1973 1977 1981 1985 1989 19930.90
0.95
1.00
1.05
1.10
Ratio NRA−EA / MetO (adjusted)(Eden to Temple Sowerby)
mean = 1.00
1961 1965 1969 1973 1977 1981 1985 1989 19930.90
0.95
1.00
1.05
1.10
Ratio NRA−EA / MetO (adjusted)(Eden to Warwick Bridge)
mean = 1.00
1961 1965 1969 1973 1977 1981 1985 1989 19930.90
0.95
1.00
1.05
1.10
Ratio NRA−EA / MetO(Tyne to Bywell)
mean = 1.00
1961 1965 1969 1973 1977 1981 1985 1989 19930.90
0.95
1.00
1.05
1.10
Ratio NRA−EA / MetO (adjusted)(Tees to Broken Scar)
mean = 1.00
1961 1965 1969 1973 1977 1981 1985 1989 19930.90
0.95
1.00
1.05
1.10
Ratio NRA−EA / MetO (adjusted)(Wharfe to Addingham)
mean = 1.00
1961 1965 1969 1973 1977 1981 1985 1989 19930.90
0.95
1.00
1.05
1.10
Ratio NRA−EA / MetO(Wensum to Costessey Mill)
mean = 1.00

Science Report Reconstructed river flow series from 1860s to present 56
Figure A2.5 (cont.) As in Figure A2.4 but with the adjusted ratios (plots with ‘mean’ inred colour are the same as in Figure A2.4. For the adjusted ratios,‘mean’ is in magenta)
1961 1965 1969 1973 1977 1981 1985 1989 19930.90
0.95
1.00
1.05
1.10
Ratio NRA−EA / MetO(Thames to Eynsham)
mean = 0.99
1961 1965 1969 1973 1977 1981 1985 1989 19930.90
0.95
1.00
1.05
1.10
Ratio NRA−EA / MetO(Ely Ouse to Denver Complex)
mean = 1.00
1961 1965 1969 1973 1977 1981 1985 1989 19930.90
0.95
1.00
1.05
1.10
Ratio NRA−EA / MetO(Medway to Teston)
mean = 1.00
1961 1965 1969 1973 1977 1981 1985 1989 19930.90
0.95
1.00
1.05
1.10
Ratio NRA−EA / MetO(Itchen to Highbridge/Allbrook)
mean = 0.99
1961 1965 1969 1973 1977 1981 1985 1989 19930.90
0.95
1.00
1.05
1.10
Ratio NRA−EA / MetO (adjusted)(Teifi to Glan Teifi)
mean = 1.00
1961 1965 1969 1973 1977 1981 1985 1989 19930.90
0.95
1.00
1.05
1.10
Ratio NRA−EA / MetO (adjusted)(Dee to Manley Hall/Erbistock)
mean = 1.00
1961 1965 1969 1973 1977 1981 1985 1989 19930.90
0.95
1.00
1.05
1.10
Ratio NRA−EA / MetO(Derwent to Derby/longbridge)
mean = 1.00

Science Report Reconstructed river flow series from 1860s to present 57
Figure A2.6 Annual average of observed (black line) and reconstructed (red line) flows
1962 1966 1970 1974 1978 1982 1986 1990 1994 1998 200220
30
40
50
60
70
80
Flo
w (
Cum
ecs)
Annual average flows(Tyne to Bywell)
Observed flows (1961−2002)Reconstructed flows (1961−2002)
1962 1966 1970 1974 1978 1982 1986 1990 1994 1998 200210
15
20
25
30
35
Flo
w (
Cum
ecs)
Annual average flows(Tees to Broken Scar)
Observed flows (1961−2002)Reconstructed flows (1961−2002)
1962 1966 1970 1974 1978 1982 1986 1990 1994 1998 20025
10
15
20
25
Flo
w (
Cum
ecs)
Annual average flows(Wharfe to Addingham)
Observed flows (1974−2002)Reconstructed flows (1961−2002)
1962 1966 1970 1974 1978 1982 1986 1990 1994 1998 20020
5
10
Flo
w (
Cum
ecs)
Annual average flows(Wensum to Costessey Mill)
Observed flows (1961−2002)Reconstructed flows (1961−2002)
1962 1966 1970 1974 1978 1982 1986 1990 1994 1998 200230
50
70
90
110
130
Flo
w (
Cum
ecs)
Annual average flows(Wye to Redbrook)
Observed flows (1961−2002)Reconstructed flows (1961−2002)
1962 1966 1970 1974 1978 1982 1986 1990 1994 1998 20025
10
15
20
25
Flo
w (
Cum
ecs)
Annual average flows(Exe to Thorverton)
Observed flows (1961−2002)Reconstructed flows (1961−2002)
1962 1966 1970 1974 1978 1982 1986 1990 1994 1998 20020
5
10
15
20
25
30
Flo
w (
Cum
ecs)
Annual average flows(Eden to Temple Sowerby)
Observed flows (1965−2002)Reconstructed flows (1961−2002)
1962 1966 1970 1974 1978 1982 1986 1990 1994 1998 200220
30
40
50
60
Flo
w (
Cum
ecs)
Annual average flows(Eden to Warwick Bridge)
Observed flows (1961−2002)Reconstructed flows (1961−2002)

Science Report Reconstructed river flow series from 1860s to present 58
Figure A2.6 (cont.) Annual average of observed (black line) and reconstructed (red line)flows
1962 1966 1970 1974 1978 1982 1986 1990 1994 1998 20020
10
20
30
40
50
Flo
w (
Cum
ecs)
Annual average flows(Thames to Eynsham)
Observed flows (1961−2002)Reconstructed flows (1961−2002)
1962 1966 1970 1974 1978 1982 1986 1990 1994 1998 20020
10
20
30
40
50
Flo
w (
Cum
ecs)
Annual average flows(Ely Ouse to Denver Complex)
Observed flows (1980−2002)Reconstructed flows (1961−2002)
1962 1966 1970 1974 1978 1982 1986 1990 1994 1998 20020
5
10
15
20
25
Flo
w (
Cum
ecs)
Annual average flows(Medway to Teston)
Observed flows (1961−1996)Reconstructed flows (1961−2002)
1962 1966 1970 1974 1978 1982 1986 1990 1994 1998 20024
6
8
10
Flo
w (
Cum
ecs)
Annual average flows(Itchen to Highbridge/Allbrook)
Observed flows (1970−2000)Reconstructed flows (1961−2002)
1962 1966 1970 1974 1978 1982 1986 1990 1994 1998 200210
20
30
40
50
Flo
w (
Cum
ecs)
Annual average flows(Teifi to Glan Teifi)
Observed flows (1961−2002)Reconstructed flows (1961−2002)
1962 1966 1970 1974 1978 1982 1986 1990 1994 1998 200215
25
35
45
55
Flo
w (
Cum
ecs)
Annual average flows(Dee to Manley Hall/Erbistock)
Observed flows (1969−2002)Reconstructed flows (1961−2002)
1962 1966 1970 1974 1978 1982 1986 1990 1994 1998 20025
10
15
20
25
30
35
40
Flo
w (
Cum
ecs)
Annual average flows(Derwent to Derby/longbridge)
Observed flows (CEH 1961−2002)Reconstructed flows (1961−2002)
1962 1966 1970 1974 1978 1982 1986 1990 1994 1998 20025
10
15
20
25
30
35
40
Flo
w (
Cum
ecs)
Annual average flows(Derwent to Derby/longbridge)
Naturalised flows (EA 1977−1997)Reconstructed flows (1961−2002)

Science Report Reconstructed river flow series from 1860s to present 59
Figure A2.7 As in Figure A2.6 except for summer (June-Aug.) average flows
1962 1966 1970 1974 1978 1982 1986 1990 1994 1998 20025
15
25
35
45
Flo
w (
Cum
ecs)
Summer average flows(Tyne to Bywell)
Observed flows (1961−2002)Reconstructed flows (1961−2002)
1962 1966 1970 1974 1978 1982 1986 1990 1994 1998 20020
5
10
15
20
Flo
w (
Cum
ecs)
Summer average flows(Tees to Broken Scar)
Observed flows (1961−2002)Reconstructed flows (1961−2002)
1962 1966 1970 1974 1978 1982 1986 1990 1994 1998 20020
5
10
15
Flo
w (
Cum
ecs)
Summer average flows(Wharfe to Addingham)
Observed flows (1974−2002)Reconstructed flows (1961−2002)
1962 1966 1970 1974 1978 1982 1986 1990 1994 1998 20020
1
2
3
4
5
Flo
w (
Cum
ecs)
Summer average flows(Wensum to Costessey Mill)
Observed flows (1961−2002)Reconstructed flows (1961−2002)
1962 1966 1970 1974 1978 1982 1986 1990 1994 1998 20020
10
20
30
40
50
60
70
Flo
w (
Cum
ecs)
Summer average flows(Wye to Redbrook)
Observed flows (1961−2002)Reconstructed flows (1961−2002)
1962 1966 1970 1974 1978 1982 1986 1990 1994 1998 20020
5
10
15
Flo
w (
Cum
ecs)
Summer average flows(Exe to Thorverton)
Observed flows (1961−2002)Reconstructed flows (1961−2002)
1962 1966 1970 1974 1978 1982 1986 1990 1994 1998 20020
5
10
15
Flo
w (
Cum
ecs)
Summer average flows(Eden to Temple Sowerby)
Observed flows (1965−2002)Reconstructed flows (1961−2002)
1962 1966 1970 1974 1978 1982 1986 1990 1994 1998 20020
10
20
30
40
Flo
w (
Cum
ecs)
Summer average flows(Eden to Warwick Bridge)
Observed flows (1961−2002)Reconstructed flows (1961−2002)

Science Report Reconstructed river flow series from 1860s to present 60
Figure A2.7 (cont.) As in Figure A2.6 except for summer (June-Aug.) average flows
1962 1966 1970 1974 1978 1982 1986 1990 1994 1998 20020
5
10
15
Flo
w (
Cum
ecs)
Summer average flows(Thames to Eynsham)
Observed flows (1961−2002)Reconstructed flows (1961−2002)
1962 1966 1970 1974 1978 1982 1986 1990 1994 1998 20020
5
10
15
20
Flo
w (
Cum
ecs)
Summer average flows(Ely Ouse to Denver Complex)
Observed flows (1980−2002)Reconstructed flows (1961−2002)
1962 1966 1970 1974 1978 1982 1986 1990 1994 1998 20020
2
4
6
8
10
Flo
w (
Cum
ecs)
Summer average flows(Medway to Teston)
Observed flows (1961−1996)Reconstructed flows (1961−2002)
1962 1966 1970 1974 1978 1982 1986 1990 1994 1998 20020
2
4
6
8
10
Flo
w (
Cum
ecs)
Summer average flows(Itchen to Highbridge/Allbrook)
Observed flows (1970−2000)Reconstructed flows (1961−2002)
1962 1966 1970 1974 1978 1982 1986 1990 1994 1998 20020
10
20
30
40
Flo
w (
Cum
ecs)
Summer average flows(Teifi to Glan Teifi)
Observed flows (1961−2002)Reconstructed flows (1961−2002)
1962 1966 1970 1974 1978 1982 1986 1990 1994 1998 20020
5
10
15
20
25
30
Flo
w (
Cum
ecs)
Summer average flows(Dee to Manley Hall/Erbistock)
Observed flows (1969−2002)Reconstructed flows (1961−2002)
1962 1966 1970 1974 1978 1982 1986 1990 1994 1998 20020
5
10
15
20
Flo
w (
Cum
ecs)
Summer average flows(Derwent to Derby/longbridge)
Observed flows (CEH 1961−2002)Reconstructed flows (1961−2002)
1962 1966 1970 1974 1978 1982 1986 1990 1994 1998 20020
5
10
15
20
Flo
w (
Cum
ecs)
Summer average flows(Derwent to Derby/longbridge)
Naturalised flows (EA 1977−1997)Reconstructed flows (1961−2002)

Science Report Reconstructed river flow series from 1860s to present 61
Figure A2.8 Monthly differences reconstructed – observed river flows (blue line). The redline shows the same values filtered with a 13 pt binomial filter.
1962 1966 1970 1974 1978 1982 1986 1990 1994 1998 2002−70
−20
30
80
130
180
Flo
w (
Cum
ecs)
Monthly differences "Rec−Obs"(Tyne to Bywell, 1961−2002)
Rec−Obssmoothed Rec−Obs
1962 1966 1970 1974 1978 1982 1986 1990 1994 1998 2002−30
−20
−10
0
10
20
30
40
Flo
w (
Cum
ecs)
Monthly differences "Rec−Obs"(Tees to Broken Scar, 1961−2002)
Rec−Obssmoothed Rec−Obs
1962 1966 1970 1974 1978 1982 1986 1990 1994 1998 2002−20
−10
0
10
20
Flo
w (
Cum
ecs)
Monthly differences "Rec−Obs"(Wharfe to Addingham, 1974−2002)
Rec−Obssmoothed Rec−Obs
1962 1966 1970 1974 1978 1982 1986 1990 1994 1998 2002−10
−5
0
5
10
Flo
w (
Cum
ecs)
Monthly differences "Rec−Obs"(Wensum to Costessey Mill, 1961−2002)
Rec−Obssmoothed Rec−Obs
1962 1966 1970 1974 1978 1982 1986 1990 1994 1998 2002
−90
−60
−30
0
30
60
90
Flo
w (
Cum
ecs)
Monthly differences "Rec−Obs"(Wye to Redbrook, 1961−2002)
Rec−Obssmoothed Rec−Obs
1962 1966 1970 1974 1978 1982 1986 1990 1994 1998 2002−20
−10
0
10
20
Flo
w (
Cum
ecs)
Monthly differences "Rec−Obs"(Exe to Thorverton, 1961−2002)
Rec−Obssmoothed Rec−Obs
1962 1966 1970 1974 1978 1982 1986 1990 1994 1998 2002−20
−10
0
10
20
Flo
w (
Cum
ecs)
Monthly differences "Rec−Obs"(Eden to Temple Sowerby, 1965−2002)
Rec−Obssmoothed Rec−Obs
1962 1966 1970 1974 1978 1982 1986 1990 1994 1998 2002−45
−35
−25
−15
−5
5
15
25
35
45
Flo
w (
Cum
ecs)
Monthly differences "Rec−Obs"(Eden to Warwick Bridge, 1961−2002)
Rec−Obssmoothed Rec−Obs

Science Report Reconstructed river flow series from 1860s to present 62
Figure A2.8 (cont.) Monthly differences reconstructed – observed river flows (blue line).The red line shows the same values filtered with a 13 pt binomial filter.
1962 1966 1970 1974 1978 1982 1986 1990 1994 1998 2002−30
−10
10
30
50
70
Flo
w (
Cum
ecs)
Monthly differences "Rec−Obs"(Thames to Eynsham, 1961−2002)
Rec−Obssmoothed Rec−Obs
1962 1966 1970 1974 1978 1982 1986 1990 1994 1998 2002−20
0
20
40
60
Flo
w (
Cum
ecs)
Monthly differences "Rec−Obs"(Ely Ouse to Denver Complex, 1980−2002)
Rec−Obssmoothed Rec−Obs
1962 1966 1970 1974 1978 1982 1986 1990 1994 1998 2002−30
−20
−10
0
10
20
30
Flo
w (
Cum
ecs)
Monthly differences "Rec−Obs"(Medway to Teston, 1961−1996)
Rec−Obssmoothed Rec−Obs
1962 1966 1970 1974 1978 1982 1986 1990 1994 1998 2002−4
−2
0
2
4
Flo
w (
Cum
ecs)
Monthly differences "Rec−Obs"(Itchen to Highbridge/Allbrook, 1970−2000)
Rec−Obssmoothed Rec−Obs
1962 1966 1970 1974 1978 1982 1986 1990 1994 1998 2002−70
−50
−30
−10
10
30
50
70
Flo
w (
Cum
ecs)
Monthly differences "Rec−Obs"(Teifi to Glan Teifi, 1961−2002)
Rec−Obssmoothed Rec−Obs
1962 1966 1970 1974 1978 1982 1986 1990 1994 1998 2002−20
0
20
40
60
80
100
Flo
w (
Cum
ecs)
Monthly differences "Rec−Obs"(Dee to Manley Hall/Erbistock, 1969−2002)
Rec−Obssmoothed Rec−Obs
1962 1966 1970 1974 1978 1982 1986 1990 1994 1998 2002−15
−5
5
15
25
Flo
w (
Cum
ecs)
Monthly differences "Rec−Obs"(Derwent to Derby/longbridge CEH, 1961−2002)
Rec−Obssmoothed Rec−Obs
1962 1966 1970 1974 1978 1982 1986 1990 1994 1998 2002
−20
−10
0
10
20
Flo
w (
Cum
ecs)
Monthly differences "Rec−Obs"(Derwent to Derby/longbridge EA, 1977−1997)
Rec−Obssmoothed Rec−Obs

Science Report Reconstructed river flow series from 1860s to present 63
Figure A2.9 Annual average reconstructed river flows
1865 1885 1905 1925 1945 1965 1985 200530
50
70
90
110
130
150
Flo
w (
Cum
ecs)
Annual average reconstructed riverflow(Wye to Redbrook, 1865−2002)
1865 1885 1905 1925 1945 1965 1985 20055
10
15
20
25
Flo
w (
Cum
ecs)
Annual average reconstructed riverflow(Exe to Thorverton, 1865−2002)
1865 1885 1905 1925 1945 1965 1985 20055
10
15
20
25
30
Flo
w (
Cum
ecs)
Annual average reconstructed riverflow(Eden to Temple Sowerby, 1865−2002)
1865 1885 1905 1925 1945 1965 1985 200520
30
40
50
60
Flo
w (
Cum
ecs)
Annual average reconstructed riverflow(Eden to Warwick Bridge, 1865−2002)
1865 1885 1905 1925 1945 1965 1985 200520
30
40
50
60
70
Flo
w (
cum
ecs)
Annual average reconstructed riverflow(Tyne to Bywell, 1865−2002)
1865 1885 1905 1925 1945 1965 1985 200510
15
20
25
30
35
Flo
w (
cum
ecs)
Annual average reconstructed riverflow(Tees to Broken Scar, 1865−2002)
1865 1885 1905 1925 1945 1965 1985 20055
10
15
20
25
Flo
w (
cum
ecs)
Annual average reconstructed riverflow(Wharfe to Addingham, 1865−2002)
1865 1885 1905 1925 1945 1965 1985 20050
5
10
Flo
w (
cum
ecs)
Annual average reconstructed riverflow(Wensum to Costessey Mill, 1865−2002)

Science Report Reconstructed river flow series from 1860s to present 64
Figure A2.9 (cont.) Annual average reconstructed river flows
1845 1865 1885 1905 1925 1945 1965 1985 200510
20
30
40
50
Flo
w (
cum
ecs)
Annual average reconstructed riverflow(Teifi to Glan Teifi, 1856−2002)
1845 1865 1885 1905 1925 1945 1965 1985 200515
25
35
45
55
Flo
w (
cum
ecs)
Annual average reconstructed riverflow(Dee to Manley Hall/Erbistock, 1859−2002)
1845 1865 1885 1905 1925 1945 1965 1985 200510
15
20
25
30
35
Flo
w (
cum
ecs)
Annual average reconstructed riverflow(Derwent to Derby/longbridge, 1851−2002)
1865 1885 1905 1925 1945 1965 1985 20050
10
20
30
40
50
Flo
w (
cum
ecs)
Annual average reconstructed riverflow(Thames to Eynsham, 1865−2002)
1865 1885 1905 1925 1945 1965 1985 20050
10
20
30
40
50
Flo
w (
cum
ecs)
Annual average reconstructed riverflow(Ely Ouse to Denver Complex, 1865−2002)
1845 1865 1885 1905 1925 1945 1965 1985 20050
5
10
15
20
25
Flo
w (
cum
ecs)
Annual average reconstructed riverflow(Medway to Teston, 1851−2002)
1845 1865 1885 1905 1925 1945 1965 1985 20054
6
8
10
Flo
w (
cum
ecs)
Annual average reconstructed riverflow(Itchen to Highbridge/Allbrook, 1852−2002)

Science Report Reconstructed river flow series from 1860s to present 65
Figure A2.10 As in Figure A2.9 except for winter (Dec.-Feb.) average
1865 1885 1905 1925 1945 1965 1985 200530
80
130
180
230
280
330
Flo
w (
Cum
ecs)
Winter average reconstructed riverflow(Wye to Redbrook, 1865−2002)
1865 1885 1905 1925 1945 1965 1985 20050
10
20
30
40
50
60
Flo
w (
Cum
ecs)
Winter average reconstructed riverflow(Exe to Thorverton, 1865−2002)
1865 1885 1905 1925 1945 1965 1985 20050
10
20
30
40
50
60
70
Flo
w (
Cum
ecs)
Winter average reconstructed riverflow(Eden to Temple Sowerby, 1865−2002)
1865 1885 1905 1925 1945 1965 1985 200520
40
60
80
100
120
Flo
w (
Cum
ecs)
Winter average reconstructed riverflow(Eden to Warwick Bridge, 1865−2002)
1865 1885 1905 1925 1945 1965 1985 200520
40
60
80
100
120
140
160
Flo
w (
Cum
ecs)
Winter average reconstructed riverflow(Tyne to Bywell, 1865−2002)
1865 1885 1905 1925 1945 1965 1985 200510
20
30
40
50
60
70
80
Flo
w (
Cum
ecs)
Winter average reconstructed riverflow(Tees to Broken Scar, 1865−2002)
1865 1885 1905 1925 1945 1965 1985 20055
10
15
20
25
30
35
40
Flo
w (
Cum
ecs)
Winter average reconstructed riverflow(Wharfe to Addingham, 1865−2002)
1865 1885 1905 1925 1945 1965 1985 20050
5
10
15
Flo
w (
Cum
ecs)
Winter average reconstructed riverflow(Wensum to Costessey Mill, 1865−2002)

Science Report Reconstructed river flow series from 1860s to present 66
Figure A2.10 (cont.) As in Figure A2.9 except for winter (Dec.-Feb.) average
1865 1885 1905 1925 1945 1965 1985 20050
20
40
60
80
100
Flo
w (
Cum
ecs)
Winter average reconstructed riverflow(Teifi to Glan Teifi, 1865−2002)
1865 1885 1905 1925 1945 1965 1985 200510
30
50
70
90
110
Flo
w (
Cum
ecs)
Winter average reconstructed riverflow(Dee to Manley Hall/Erbistock, 1865−2002)
1865 1885 1905 1925 1945 1965 1985 200510
20
30
40
50
60
70
80
Flo
w (
Cum
ecs)
Winter average reconstructed riverflow(Derwent to Derby/longbridge, 1865−2002)
1865 1885 1905 1925 1945 1965 1985 20050
50
100
150
200
Flo
w (
Cum
ecs)
Winter average reconstructed riverflow(Thames to Eynsham, 1865−2002)
1865 1885 1905 1925 1945 1965 1985 20050
20
40
60
80
100
Flo
w (
Cum
ecs)
Winter average reconstructed riverflow(Ely Ouse to Denver Complex, 1865−2002)
1865 1885 1905 1925 1945 1965 1985 20050
10
20
30
40
50
60
Flo
w (
Cum
ecs)
Winter average reconstructed riverflow(Medway to Teston, 1865−2002)
1865 1885 1905 1925 1945 1965 1985 20050
5
10
15
20
Flo
w (
Cum
ecs)
Winter average reconstructed riverflow(Itchen to Highbridge/Allbrook, 1865−2002)

Science Report Reconstructed river flow series from 1860s to present 67
Figure A2.11 As in Figure A2.9 except for summer (Jun.-Aug.) average
1865 1885 1905 1925 1945 1965 1985 20050
20
40
60
80
100
120
Flo
w (
Cum
ecs)
Summer average reconstructed riverflow(Wye to Redbrook, 1865−2002)
1865 1885 1905 1925 1945 1965 1985 20050
5
10
15
20
Flo
w (
Cum
ecs)
Summer average reconstructed riverflow(Exe to Thorverton, 1865−2002)
1865 1885 1905 1925 1945 1965 1985 20050
5
10
15
20
Flo
w (
Cum
ecs)
Summer average reconstructed riverflow(Eden to Temple Sowerby, 1865−2002)
1865 1885 1905 1925 1945 1965 1985 20050
10
20
30
40
50
Flo
w (
Cum
ecs)
Summer average reconstructed riverflow(Eden to Warwick Bridge, 1865−2002)
1865 1885 1905 1925 1945 1965 1985 20050
10
20
30
40
50
60
70
Flo
w (
Cum
ecs)
Summer average reconstructed riverflow(Tyne to Bywell, 1865−2002)
1865 1885 1905 1925 1945 1965 1985 20050
5
10
15
20
25
30
Flo
w (
Cum
ecs)
Summer average reconstructed riverflow(Tees to Broken Scar, 1865−2002)
1865 1885 1905 1925 1945 1965 1985 20050
5
10
15
20
Flo
w (
Cum
ecs)
Summer average reconstructed riverflow(Wharfe to Addingham, 1865−2002)
1865 1885 1905 1925 1945 1965 1985 20050
2
4
6
8
10
Flo
w (
Cum
ecs)
Summer average reconstructed riverflow(Wensum to Costessey Mill, 1865−2002)

Science Report Reconstructed river flow series from 1860s to present 68
Figure A2.11 (cont.) As in Figure A2.9 except for summer (Jun.-Aug.) average
1865 1885 1905 1925 1945 1965 1985 20050
5
10
15
20
25
30
35
40
Flo
w (
Cum
ecs)
Summer average reconstructed riverflow(Teifi to Glan Teifi, 1865−2002)
1865 1885 1905 1925 1945 1965 1985 20050
10
20
30
40
50
Flo
w (
Cum
ecs)
Summer average reconstructed riverflow(Dee to Manley Hall/Erbistock, 1865−2002)
1865 1885 1905 1925 1945 1965 1985 20050
5
10
15
20
25
30
Flo
w (
Cum
ecs)
Summer average reconstructed riverflow(Derwent to Derby/longbridge, 1865−2002)
1865 1885 1905 1925 1945 1965 1985 20050
5
10
15
20
25
30
Flo
w (
Cum
ecs)
Summer average reconstructed riverflow(Thames to Eynsham, 1865−2002)
1865 1885 1905 1925 1945 1965 1985 20050
5
10
15
20
25
30
Flo
w (
Cum
ecs)
Summer average reconstructed riverflow(Ely Ouse to Denver Complex, 1865−2002)
1865 1885 1905 1925 1945 1965 1985 20050
5
10
15
Flo
w (
Cum
ecs)
Summer average reconstructed riverflow(Medway to Teston, 1865−2002)
1865 1885 1905 1925 1945 1965 1985 20050
2
4
6
8
10
Flo
w (
Cum
ecs)
Summer average reconstructed riverflow(Itchen to Highbridge/Allbrook, 1865−2002)

Science Report Reconstructed river flow series from 1860s to present 69
Figure A2.12 Flow duration curves of the reconstructed flows for the longer availableperiod (blue line), the last 42 years (1961-2002, red line) and the observedflows (green line)
0% 10% 20% 30% 40% 50% 60% 70% 80% 90% 100%1
10
100
1000
Percentage of time flow exceeded
Flo
w (
cum
ecs)
Wye to Redbrook
Reconstructed flows (1865−2002)Reconstructed flows (1961−2002)Observed flows (1961−2002)
0% 10% 20% 30% 40% 50% 60% 70% 80% 90% 100%1
10
100
Percentage of time flow exceeded
Flo
w (
cum
ecs)
Exe to Thorverton
Reconstructed flows (1865−2002)Reconstructed flows (1961−2002)Observed flows (1961−2002)
0% 10% 20% 30% 40% 50% 60% 70% 80% 90% 100%1
10
100
Percentage of time flow exceeded
Flo
w (
cum
ecs)
Eden to Temple Sowerby
Reconstructed flows (1865−2002)Reconstructed flows (1965−2002)Observed flows (1965−2002)

Science Report Reconstructed river flow series from 1860s to present 70
Figure A2.12 (cont.) Flow duration curves of the reconstructed flows for the longeravailable period (blue line), the last 42 years (1961-2002, red line) andthe observed flows (green line)
0% 10% 20% 30% 40% 50% 60% 70% 80% 90% 100%1
10
100
1000
Percentage of time flow exceeded
Flo
w (
cum
ecs)
Eden to Warwick Bridge
Reconstructed flows (1865−2002)Reconstructed flows (1961−2002)Observed flows (1961−2002)
0% 10% 20% 30% 40% 50% 60% 70% 80% 90% 100%1
10
100
1000
Percentage of time flow exceeded
Flo
w (
cum
ecs)
Tyne to Bywell
Reconstructed flows (1865−2002)Reconstructed flows (1961−2002)Observed flows (1961−2002)
0% 10% 20% 30% 40% 50% 60% 70% 80% 90% 100%1
10
100
Percentage of time flow exceeded
Flo
w (
cum
ecs)
Tees to Broken Scar
Reconstructed flows (1865−2002)Reconstructed flows (1961−2002)Observed flows (1961−2002)

Science Report Reconstructed river flow series from 1860s to present 71
Figure A2.12 (cont.) Flow duration curves of the reconstructed flows for the longeravailable period (blue line), the last 42 years (1961-2002, red line) andthe observed flows (green line)
0% 10% 20% 30% 40% 50% 60% 70% 80% 90% 100%0.1
1
10
100
Percentage of time flow exceeded
Flo
w (
cum
ecs)
Wensum to Costessey Mill
Reconstructed flows (1865−2002)Reconstructed flows (1961−2002)Observed flows (1961−2002)
0% 10% 20% 30% 40% 50% 60% 70% 80% 90% 100%1
10
100
Percentage of time flow exceeded
Flo
w (
cum
ecs)
Thames to Eynsham
Reconstructed flows (1865−2002)Reconstructed flows (1961−2002)Observed flows (1961−2002)
0% 10% 20% 30% 40% 50% 60% 70% 80% 90% 100%1
10
100
Percentage of time flow exceeded
Flo
w (
cum
ecs)
Wharfe to Addingham
Reconstructed flows (1865−2002)Reconstructed flows (1974−2002)Observed flows (1974−2002)

Science Report Reconstructed river flow series from 1860s to present 72
Figure A2.12 (cont.) Flow duration curves of the reconstructed flows for the longeravailable period (blue line), the last 42 years (1961-2002, red line) andthe observed flows (green line)
0% 10% 20% 30% 40% 50% 60% 70% 80% 90% 100%0.1
1
10
100
Percentage of time flow exceeded
Flo
w (
cum
ecs)
Ely Ouse to Denver Complex
Reconstructed flows (1865−2002)Reconstructed flows (1980−2002)Observed flows (1980−2002)
0% 10% 20% 30% 40% 50% 60% 70% 80% 90% 100%0.1
1
10
100
Percentage of time flow exceeded
Flo
w (
cum
ecs)
Medway to Teston
Reconstructed flows (1865−2002)Reconstructed flows (1961−1996)Observed flows (1961−1996)
0% 10% 20% 30% 40% 50% 60% 70% 80% 90% 100%1
10
100
Percentage of time flow exceeded
Flo
w (
cum
ecs)
Itchen to Highbridge/Allbrook
Reconstructed flows (1865−2002)Reconstructed flows (1970−2000)Observed flows (1970−2000)

Science Report Reconstructed river flow series from 1860s to present 73
Figure A2.12 (cont.) Flow duration curves of the reconstructed flows for the longeravailable period (blue line), the last 42 years (1961-2002, red line) andthe observed flows (green line)
0% 10% 20% 30% 40% 50% 60% 70% 80% 90% 100%1
10
100
Percentage of time flow exceeded
Flo
w (
cum
ecs)
Teifi to Glan Teifi
Reconstructed flows (1865−2002)Reconstructed flows (1961−2002)Observed flows (1961−2002)
0% 10% 20% 30% 40% 50% 60% 70% 80% 90% 100%1
10
100
1000
Percentage of time flow exceeded
Flo
w (
cum
ecs)
Dee to Manley Hall/Erbistock
Reconstructed flows (1865−2002)Reconstructed flows (1969−2002)Observed flows (1969−2002)
0% 10% 20% 30% 40% 50% 60% 70% 80% 90% 100%1
10
100
Percentage of time flow exceeded
Flo
w (
cum
ecs)
Derwent to Derby/longbridge
Reconstructed flows (1865−2002)Reconstructed flows (1977−1997)Observed flows (1977−1997)

We welcome views from our users, stakeholders and the public, including commentsabout the content and presentation of this report. If you are happy with our service,please tell us about it. It helps us to identify good practice and rewards our staff. If youare unhappy with our service, please let us know how we can improve it.