Embed Size (px)
Citation preview

Recommended Procedures for Development of Emissions Factors and Use of the WebFIRE Database

EPA-453/D-13-001 August 2013
Recommended Procedures for
Development of Emissions Factors and
Use of the WebFIRE Database
By: Eastern Research Group, Inc.
1600 Perimeter Park Drive, Suite 200 Morrisville, North Carolina 27560
Prepared for: Mr. Michael Ciolek
OAQPS, Sector Policies and Programs Division
U.S. Environmental Protection Agency Office of Air Quality Planning and Standards
Sectors Policies & Programs Division Measurement Policy Group
Research Triangle Park, North Carolina 27711

i
Disclaimer
This report has been has been approved for publication by the Office of Air Quality Planning and Standards (OAQPS), U.S. Environmental Protection Agency. Mention of trade names or commercial products in this document does not constitute endorsement by the agency.

ii
TABLE OF CONTENTS
Section Page No. Section 1.0 What is the Purpose of This Document?.............................................................. 1-1 Section 2.0 What is an Emissions Factor? .............................................................................. 2-1
2.1 Emissions Data..................................................................................................... 2-2
2.2 Activity Data ........................................................................................................ 2-3
Section 3.0 How Have We Historically Developed Emissions Factors?................................ 3-1 Section 4.0 How are Emissions Factors Used? ....................................................................... 4-1 Section 5.0 What are EPA’s Revised Procedures for Developing Emissions Factors?.......... 5-1
5.1 Data Collection .................................................................................................... 5-1
5.2 Test Data Evaluation ............................................................................................ 5-3
5.3 Detection Limit Procedures ................................................................................. 5-4
5.4 Identification of Outlier Data ............................................................................... 5-5
5.5 Emissions Factor Derivation and Quality Assessment ........................................ 5-5
Section 6.0 EPA’s Interactive Database for the Emissions Factors Program – What is WebFIRE? ........................................................................................................... 6-1
6.1 What is WebFIRE? .............................................................................................. 6-1
6.2 How is WebFIRE Used? ...................................................................................... 6-1
6.3 Who Uses WebFIRE? .......................................................................................... 6-4
6.4 How Does WebFIRE Improve Emissions Factor Identification and
Development? ..................................................................................................... 6-4
Section 7.0 How Do I Find an Emissions Factor? .................................................................. 7-1 7.1 How Do I Identify and Retrieve an Emissions Factor from WebFIRE? ............. 7-1
7.2 How Do I Obtain Background Information for My Selected Emissions Factor? 7-5
7.3 How Do I Identify the Data Used to Derive an EPA Emissions Factor? ............ 7-6
Section 8.0 What Parameters Should I Consider When Using or Deriving an Emissions Factor? ................................................................................................................. 8-1
8.1 Source Category and Process Considerations ...................................................... 8-1
8.2 Control Device Considerations ............................................................................ 8-3
8.3 Pollutant Test Method Considerations ................................................................. 8-3
Section 9.0 How Do I Develop a User-Defined Emissions Factor? ....................................... 9-1 9.1 How Do I Use WebFIRE to Create a User-Defined Emissions Factor? .............. 9-1
9.2 What are the Potential Impacts Associated with Applying a User-defined
Emissions Factor? ............................................................................................... 9-3

iii
Section 10.0 How Do I Submit Data to WebFIRE? ............................................................... 10-1 10.1 What is the ERT and How is it Used to Document Emissions Tests? ............... 10-2
10.2 What are the CDX and CEDRI and What are their Roles in Submitting Data to
WebFIRE? ......................................................................................................... 10-5
Section 11.0 What is the Data Review and Public Participation Process for Emissions Factor Development? ................................................................................................... 11-1
Appendix A – Procedures for Determining Individual Test Report Quality Ratings Appendix B – Procedures for Handling Test Data That are Below the Method Detection Limits Appendix C – Procedures For Determining Statistical Outliers Appendix D – Emissions Factor Development and Data Quality Characterization Procedures Appendix E – Statistical Procedures for Determining Valid Data Combinations Appendix F – Source Classification Codes For Source Categories Containing 15 or Fewer Sources

iv
LIST OF FIGURES Figures Page No. Figure 5-1. EPA’s Revised Procedures for Developing Emissions Factors ................................ 5-2 Figure 6-1. WebFIRE Overview .................................................................................................. 6-2 Figure 7-1. Procedures for Retrieving Emissions Factors from WebFIRE ................................. 7-2 Figure 9-1. Emissions Factor Derivation in WebFIRE ................................................................ 9-2 Figure 10-1. Typical Work Flow When Using the ERT ............................................................ 10-4 Figure 11-1. Overview of the WebFIRE Public Participation and Emissions Factor Development Process ....................................................................................................................................... 11-2 Figure C-1. Procedures to Identify Data Outliers in a Candidate Data Set .................................... 2 Figure D-1. Emissions Factor Representativeness Areas for Source Categories Containing More Than 15 Sources .............................................................................................................................. 3 Figure D-2. Emissions Factor Representativeness Areas for Source Categories Containing 15 or Fewer Sources ................................................................................................................................. 4 Figure D-3. Plot of CTR and N Data from Table D-3 .................................................................... 9 Figure D-4. Plot of Selected Data from Table D-6 ....................................................................... 11

v
LIST OF TABLES
Tables Page No. Table 7-1. Data Fields Reported by WebFIRE Emissions Factor Search ................................... 7-3 Table A-1. Test Report Quality Rating Tool .............................................................................. A-5 Table B-1. Summary of WebFIRE Procedures for Handling BDL Test Data ............................ B-3 Table B-2. Example Data Set A .................................................................................................. B-3 Table B-3. Example Data Set B .................................................................................................. B-4 Table B-4. Calculations for Example Data Set B ....................................................................... B-4 Table D-1. FQI and Boundary Line Equations ........................................................................... D-2 Table D-2. SCCs Expected to Contain 15 or Fewer Sources ..................................................... D-6 Table D-3. Individual Test Data and Various Characteristics .................................................... D-7 Table D-4. Individual Test Data Values Selected for Developing an Emissions Factor for a Source Category Containing 15 or Fewer Sources ..................................................................... D-9 Table D-5. Individual Test Data and Various Characteristics for a Source Category with 15 or Fewer Sources ........................................................................................................................... D-10 Table E-1. Emissions Factor Characteristics for Group A and B ................................................ E-2 Table E-2. Emissions Factor Characteristics for Group C and D ................................................ E-3 Table F-1. Source Classification Codes for Source Categories Containing 15 or Fewer Sources ......................................................................................................................................... F-1

vi
LIST OF ACRONYMS
Acronym Term AFS Air Facility System AFSEF AIRS Facility Subsystem Emission Factor AIRS Aerometric Information Repository System AP 42 Compilation of Air Pollutant Emission Factors, Volume I: Stationary Point and
Area Sources ASCII American Standard Code for Information Interchange ASTM American Society for Testing and Materials BDL Below Minimum Detection Limit CAA Clean Air Act CARB California Air Resources Board CAS Chemical Abstracts Service CBI Confidential Business Information CDX Central Data Exchange CEDRI Compliance and Emissions Data Reporting Interface CEMS Continuous Emissions Monitoring System CO Carbon Monoxide CO2 Carbon Dioxide CROMERR Cross-Media Electronic Reporting Regulation CSV Comma Separated Values CTR Composite Test Rating DGM Dry Gas Meter EIS Emission Inventory System EMC Emission Measurement Center EPA Environmental Protection Agency ERT Electronic Reporting Tool ESA Electronic Signature Agreement ESP Electrostatic Precipitator EST Eastern Standard Time FAQs Frequently Asked Questions FIRE Factor Information Retrieval FQI Factor Quality Index HAP Hazardous Air Pollutants HTML Hypertext Markup Language ITR L&E
Individual Test Rating Locating and Estimating
MACT Maximum Achievable Control Technology MDL Minimum Detection Limit MLE Maximum Likelihood Estimator NEI National Emissions Inventory NELAP National Environmental Laboratory Accreditation Program NESHAP National Emission Standard for Hazardous Air Pollutants

vii
LIST OF ACRONYMS (Continued)
Acronym Term NOx Oxides of Nitrogen NSPS New Source Performance Standard OAQPS Office of Air Quality Planning and Standards PDF Portable Document Format PDS Project Data Set PM Particulate Matter PM10 Particulate Matter with an aerodynamic diameter of 10 microns or less QA Quality Assurance QA/QC Quality Assurance/Quality Control QI Qualified Individual RATA Relative Accuracy Test Audit SCC Source Classification Code SES Source Evaluation Society SO2 Sulfur Dioxide STAC Stack Testing Accreditation Council THC Total Hydrocarbons TRI Toxic Release Inventory XATEF Crosswalk/Air Toxics Emission Factor System XML Extensible Markup Language

1-1
Section 1.0 WHAT IS THE PURPOSE OF THIS DOCUMENT?
This guidance document describes the procedures, data evaluation criteria and associated
tools and data management systems that the U.S. Environmental Protection Agency (EPA)
recommends for developing air pollutant emissions factors for stationary emissions units or
processes. This document supersedes the previous EPA guidance document for emissions factor
development (Procedures for Preparing Emission Factor Documents (EPA-454/R-95-015,
November 1997)).
This document presents an introduction to emissions factors and provides the historical
background for how and why the EPA has developed emissions factors for stationary emissions
units or processes. This document also describes the approach and procedures recommended by
the EPA for developing new or revising existing emissions factors.
This document provides an overview of the EPA’s WebFIRE – an online data storage and
emissions factor retrieval and development tool. Also discussed is the EPA’s Electronic
Reporting Tool (ERT) which is a Microsoft Access® application that facilitates the development
and documentation of emissions test reports. In addition, the procedures that must be followed by
individuals and entities submitting emissions data and related process data to WebFIRE are also
presented in this document. Finally, this document provides an overview of the data review and
public participation process that the EPA follows when developing new or revised emissions
factors.
This document is organized as follows:
This section . . . Contains or describes . . .
2.0 An overview of the characteristics that define an emissions factor.
3.0 A brief summary of the EPA’s historical procedures used to develop emissions factors and the various support programs prepared by the agency.
4.0 A discussion of the various uses and limitations of emissions factors.
5.0 An overview of the agency’s revised approach for developing EPA emissions factors.

Section 1.0 What is the Purpose of This Document?
1-2
This section . . . Contains or describes . . .
6.0 An overview of WebFIRE, the EPA’s online application for storage, retrieval and development of emissions factors.
7.0 The steps users must follow to identify and retrieve emissions factors from WebFIRE.
8.0 Considerations that should be evaluated when using or deriving emissions factors.
9.0 The procedures users must follow to develop a user-defined emissions factor from a collection of related data contained in WebFIRE.
10.0 The steps to follow to submit emissions and related process data to WebFIRE.
11.0 The process by which the public can participate in the periodic development of EPA’s emissions factors.
This document also contains the following appendices:
This appendix . . . Contains or describes . . . A Procedures for determining individual test report quality ratings
B Procedures for handling test data that are below the method detection limits
C Procedures for determining statistical outliers
D Emissions factor development and data quality characterization procedures
E Statistical procedures for determining valid data combinations
F Source classification codes for source categories containing 15 or fewer sources

2-1
Section 2.0 WHAT IS AN EMISSIONS FACTOR?
An emissions factor is used to estimate air pollutant emissions from a normally-operating
process or activity (e.g., fuel combustion, chemical production). An emissions factor relates the
quantity of pollutants released to the atmosphere from a process to a specific activity associated
with generating those emissions. For most application purposes, users typically assume that an
emissions factor represents the average emissions for all emitting processes of similar design and
characteristics (i.e., the emissions factor represents a population average).
The simplest form of an emissions factor is a ratio of the mass of pollutant emitted per
unit of activity generating the emissions (e.g., pounds of particulate matter (PM) emitted per ton
of coal burned). Typically, emissions factors are used to estimate process emissions as follows:
E = A x EF x [1 - (ER/100)] Where:
E = emissions estimate, A = activity rate, EF = emissions factor, and ER = overall emissions reduction achieved by controls (%).
Emissions factors for more complex processes or activities (e.g., paved and unpaved roads,
organic liquid storage tanks) are typically expressed using empirical equations. The empirical
equation relates independent variables to the source emissions and typically provides for
improved predictive accuracy when compared to a simple emissions factor. For example, the
following emissions factor for vehicles traveling on unpaved surfaces at industrial sites was
taken from the EPA’s Compilation of Air Pollutant Emission Factors, Volume I: Stationary
Point and Area Sources (AP 42) (Fifth Edition, Section 13.2.2):
E = k (s/12)a (W/3)b

Section 2.0 What is an Emissions Factor?
2-2
Where:
E = particle size-specific emissions factor (pound/vehicle miles traveled), k = particle size multiplier (pound/vehicle miles traveled), s = surface material silt content (%), a, b = particle size-specific empirical constants, and W = mean vehicle weight (tons).
2.1 EMISSIONS DATA
Typically, emissions data are obtained through direct measurement of releases from a
process or activity (i.e., a sample of the process emissions is collected and analyzed). The
emissions rate for the source, expressed in terms of mass of pollutant emitted per time unit (e.g.,
pounds of PM per hour), is calculated as the arithmetic average of the available, quality-assured
test data. Depending on the sampling location and configuration of the process and associated
control devices (if any), emissions data can reflect controlled or uncontrolled emissions.
Direct measurements of facility or process emissions are conducted for a variety of
reasons such as:
• Characterize process emissions and/or control device performance, • Assess changes in process or control device operation on emissions, and • Demonstrate compliance with federal, state, local or tribal air regulations.
Emissions testing may also be conducted for purposes such as conducting relative accuracy test
audits (RATAs), linearity checks (i.e., measures an instrument’s ability to provide consistent
sensitivity throughout the weighing range) and routine calibrations of continuous emissions
monitoring system (CEMS) equipment.
The emissions rate for a specific process can also be determined by using a mass balance
approach. In general, mass balances are appropriate for use in situations where the mass of all the
materials entering and exiting a process can be quantified. Using this mass balance approach,
pollutant emissions are calculated as the difference in process inputs and outputs. For certain
processes, a mass balance provides an easier and less expensive estimate of emissions than
would be obtained by direct measurement. For example, carbon dioxide (CO2) emitted from a

Section 2.0 What is an Emissions Factor?
2-3
fuel combustion process can be estimated from the stoichiometric relationship of the chemical
reactants (i.e., carbon contained in the fuel and oxygen in the combustion air), the amount of
each reactant that is consumed in the combustion process and the amount of carbon remaining in
any residual material (e.g., ash). Although a mass balance approach may be suitable for certain
processes, this approach may not be appropriate to estimate emissions from a process or activity
in which the accuracy or uncertainty of the quantities of input and output materials is a concern.
2.2 ACTIVITY DATA
The composition and magnitude of emissions generated by a process unit are affected by
a variety of process parameters such as raw materials and fuels used; process operating
conditions; equipment configuration and age; and the skill and experience of process operators.
Activity data for use in developing emissions factors are the parameter(s) that directly influence
the quality and quantity of emissions from a process unit. Generally, activity data are collected
during an emissions test to verify that the process is operating at the desired production level
(e.g., to satisfy an operating permit emissions limit). Activity data are typically expressed either
in terms of a process input or output per time unit (e.g., gallons of oil burned per hour, tons of
cement produced per day). For example, the activity data for a PM emissions factor for plywood
manufacturing processes could be expressed in terms of the square feet of plywood produced per
day. For an emissions rate determined using a material balance approach, the activity data would
typically include one or more process parameters used in the material balance.

3-1
Section 3.0 HOW HAVE WE HISTORICALLY DEVELOPED EMISSIONS FACTORS?
The Clean Air Act of 1970 (CAA) defined the EPA’s responsibilities with regards to
protecting and improving the nation’s air quality. In response to the CAA, the EPA needed a
method with which to characterize and quantify air pollutant emissions from processes and
activities on a nationwide basis. Because there were a large number of diverse emissions sources,
developing national estimates based upon site-by-site emissions testing was not feasible.
Consequently, we developed criteria and non-criteria pollutant emissions factors for certain
industrial processes or source categories for use in preparing emissions inventories. These
emissions factors were based upon emissions test data, material balance calculations, modeling
and engineering judgment.
In 1972, the EPA’s Office of Air Quality Planning and Standards (OAQPS) published the
first document containing the EPA’s emissions factors and supporting documentation
(Compilation of Air Pollutant Emission Factors, Volume I: Stationary Point and Area Sources
(AP 42)). As an aid to end users, OAQPS developed relative quality ratings for the AP 42
emissions factors, based upon the EPA’s analysis of the quality of the underlying test data values
and how representative the emissions factor was for the particular source category for which it
was developed. The letter-grade ratings (e.g., A for excellent, E for poor) were based primarily
on engineering judgment and did not incorporate statistical error bounds or confidence intervals.
Since its initial publication, we have periodically revised and updated AP 42 to
incorporate new data and emissions-estimating methodologies. The last hard-copy version of
AP 42 (fifth edition) was published in 1995; although, we have released six supplements
(Supplement A through Supplement F) through 2000. After 2000, updates to AP 42 were
provided only electronically. Currently, the fifth edition of AP 42, the supplements and related
information are available at: http://www.epa.gov/ttn/chief/ap42/.
In addition to AP 42, we developed several other compilations of available emissions
factors. To provide the user community with additional emissions factor information for air toxic

Section 3.0 How Have We Historically Developed Emissions Factors?
3-2
pollutants beyond what was available in AP 42 at the time, we initiated the Locating &
Estimating (L&E) document series in 1984. Unlike AP 42, which is organized by source
category, the majority of the L&E documents focused on a specific pollutant (e.g., arsenic,
benzene) or related group of pollutants (e.g., polycyclic organic matter). The L&E documents
made use of AP 42 emissions factors, where available; however, in some cases, the AP 42
emissions factors were revised or supplemented to present the most complete assessment of the
emissions for the specific air pollutant. A total of 36 individual L&E documents were produced
through 1998.
We also compiled the Aerometric Information Retrieval System (AIRS) Facility
Subsystem Emission Factors (AFSEF) and the Crosswalk/Air Toxics Emission Factors (XATEF)
databases in 1990. The AFSEF database documented all emissions factors for criteria pollutants
that existed in the AIRS mainframe look-up tables as of March 1990. The XATEF database
contained emissions factors for toxic air pollutants that were developed based upon data
available to the EPA through October 1990. Ultimately, the EPA retired the AFSEF and XATEF
databases and created the Factor Information Retrieval (FIRE) Data System. The FIRE database
contains emissions factors from all AP 42 sections posted by September 1, 2004, the L&E
document series and the retired AFSEF and XATEF databases.
Other specialized studies have produced documents containing average emissions rates
for various processes which have been posted on the CHIEF web page and which may still
represent the most currently-available estimation tools for those processes.
In 1997, we provided guidance materials (Procedures for Preparing Emission Factor
Documents, EPA-454/R-95-015, November 1997) that described the procedures, technical
criteria and standards and specifications for developing and reporting air pollutant emissions
factors for publication in either AP 42 or the L&E document series. This 1997 guidance
document covered the compilation, review and analyses of new data and information and
preparation of supporting documentation for emissions factor development.

Section 3.0 How Have We Historically Developed Emissions Factors?
3-3
Although OAQPS has focused significant effort and resources on developing emissions
factors, the procedures and guidance we have historically followed (documented in the EPA’s
Procedures for Preparing Emission Factor Documents, November 1997) have not kept pace with
the increased volume of available emissions data or advances in information technology. For
example, although AP 42 is available online, the format is analogous to a hard-copy document
which is not conducive to incorporating new data, making corrections to data or conducting data
analyses. Also, because of their complex and somewhat subjective nature, the past emissions
factor development procedures were slow to incorporate new emissions test data and did not
encourage active public participation. To address these shortcomings, we have revised our
approach for developing emissions factors to be more responsive and transparent. Section 5.0
discusses our revised approach to developing and documenting emissions factors.

4-1
Section 4.0 HOW ARE EMISSIONS FACTORS USED?
Emissions factors are used to develop emissions estimates for processes and activities in
cases where direct measurements are unavailable. Emissions factors are typically developed to
represent long-term (e.g., annual) average emissions and, accordingly, data used for developing
the emissions factors is usually based on emissions testing collected during normal process
operating conditions. Short-term emissions from a particular process will vary significantly over
time (i.e., within-process variability) because of fluctuations in normal process operating
conditions, control device operating conditions, raw materials, ambient conditions and other
factors. Because of the relatively short duration of emissions tests and the limited range of
conditions they represent, the available emissions and process data used to develop an emissions
factor are not sufficient to account for these short-term emissions fluctuations.
Historically, emissions factors developed by the EPA were intended for use in preparing
regional and national emissions inventories when valid site-specific information (including
material balances or other engineering calculations) were not available. These inventories are
typically the first part of the development of a regional or national control strategy to reduce
area-wide emissions. These inventories are essential tools in air quality management because
they are used to estimate ambient pollutant concentrations; to model pollutant dispersion and
transport in the atmosphere; and to develop and assess control strategies. Despite their original
purpose, we are aware that emissions factors have been applied by other entities (e.g., federal,
state, tribal and local agencies; consultants; industries) for purposes beyond the intended use of
supporting national and regional emissions inventory programs.
We remain concerned that emissions factors have been applied to these non-emissions
inventory uses without consideration of the limitations inherent in the use of emissions factors
(e.g., factors are not particularly suitable to developing short-term or site-specific emissions
estimates). Users of emissions factors should consider the impact of the reliability of emissions
factors on their non-inventory programs (e.g., apply statistical procedures to account for

Section 4.0 How are Emissions Factors Used?
4-2
variability). Such creators and users of emissions factors may wish to conduct periodic retesting
to confirm or revise as necessary, the emissions factor.

5-1
Section 5.0 WHAT ARE EPA’S REVISED PROCEDURES FOR DEVELOPING EMISSIONS FACTORS?
Beginning in 2003, OAQPS, the National Academy of Sciences and the EPA’s Office of
Inspector General conducted a review of the agency’s emissions factors program. Based upon the
feedback received from stakeholders (e.g., industry, state/local/tribal entities, the EPA’s program
offices, environmental action groups), we revised our historical approach to developing
emissions factors to reduce the level of subjectivity involved in the emissions factor development
process. Our revised approach is also intended to improve the transparency and responsiveness
of the process and to encourage meaningful public participation. Figure 5-1 provides an
overview of our revised approach to developing new or to revising existing emissions factors.
The key revisions that we have implemented in our approach regarding the collection of
emissions data and supporting documentation, the evaluation of data and the development and
assessment of emissions factors are described in the following sections.
5.1 DATA COLLECTION
Based upon the review of our emissions factor program, we found that most emissions
testing information and associated data are currently generated electronically. To take advantage
of advances in information technology and the more widespread availability of electronic data
production, our revised approach focuses on collecting new emissions data available in an
electronic format.
To aid facilities in planning and reporting the results of emissions tests, we developed the
Electronic Reporting Tool (ERT) (see Section 10.1). The ERT replaces time-intensive manual
methods for test planning, test data compilation and reporting and data quality assurance
evaluations. Because of the prevalence of electronic data, we believe that our transition from the
use of predominantly hard-copy resources (e.g., test reports, technical publications) for emissions
factor development to the use of data in an electronic format will be relatively easy. The use of
an electronic format will facilitate the ongoing collection, incorporation and analysis of new test
data and supporting documentation. Also, use of the ERT will enable us to streamline the

Section 5.0 What are EPA’s Revised Procedures for Developing Emissions Factors?
5-2
emissions factor development process through more rapid data handling and quality assurance
checks.
FIGURE 5-1. EPA’S REVISED PROCEDURES FOR DEVELOPING EMISSIONS FACTORS
Emissions test data are collected and entered in the ERT
The ERT calculates a quality rating for the test data and supporting documentation
The ERT files are submitted to WebFIRE via the CDX
The EPA updates existing or creates new emissions factors using the data and development tools contained in WebFIRE
The proposed updated/new emissions factors are made available for public review and comment
EPA revises the proposed emissions factors to reflect public comments, where appropriate
EPA posts the final emissions factor in WebFIRE

Section 5.0 What are EPA’s Revised Procedures for Developing Emissions Factors?
5-3
5.2 TEST DATA EVALUATION
Historically, the EPA’s quality ratings of emissions test data and test reports were largely
subjective because each test program presented different issues (i.e., no two facilities, their
operation or the tests conducted at those facilities are exactly alike). Typically, the EPA
developed letter-grade quality ratings (A through D) for test reports based upon the agency’s
review of the following criteria areas:
• Process operation, • Test method and sampling procedures, • Process information, and • Analysis and calculations.
To reduce the subjectivity of our qualitative assessment of the emissions, process and control
device data collected during an emissions test, we have developed a more objective rating system
for test reports (see Appendix A). The rating system is intended to produce unbiased and
consistent assessments of the information included in test reports which, in turn, will help us to
better characterize the process and the quality of emissions values.
The rating system consists of a set of objective review questions developed for the EPA’s
manual and instrumental test methods that assess the quality of the process, control device and
measurement data collected during an emissions test in the following criteria areas:
• General information, • Process and control device information, • Sampling locations, • Test methods and reporting requirements, • Sampling equipment calibrations, • Sample recovery; laboratory analysis, and • Documentation.
A numeric score (the Individual Test Rating (ITR)) is determined for each test report as the
prorated sum of the individual scores assigned to each review question based upon the answers
provided (see Appendix A).

Section 5.0 What are EPA’s Revised Procedures for Developing Emissions Factors?
5-4
Our rating system is designed to allow for potential increases in the ITR value through
independent review by a regulatory agency. In cases where a regulatory reviewer affirms the
original responses provided to the review questions, additional points are awarded to the ITR
value originally assigned by ERT when the measurement data were initially recorded by the
testing contractor. If the regulatory reviewer determines that the initial review points were
incorrectly assigned, the points originally assigned to a particular review question are deducted
from the ITR.
5.3 DETECTION LIMIT PROCEDURES
After the candidate data set has been established, we must determine if any of the new
data are based upon test results that were below the minimum detection limit (MDL) of the test
method used to collect the emissions measurements. The MDL is defined by the EPA as “the
minimum concentration of a substance that can be measured and reported with 99 percent
confidence that the analyte concentration is greater than zero and is determined from an analysis
of a sample in a given matrix containing the analyte.” Essentially, the MDL is the smallest
amount of a substance that an analytical method can reliably distinguish from zero, at a specified
confidence level, from the instrument signal produced by a blank sample.
We have developed specific data handling procedures for cases where some or all of the
emissions data collected during a test are below the MDL (BDL) and where the average data
from the BDL tests are to be included in the candidate data set for use in developing an
emissions factor. Appendix B contains a more detailed discussion of the procedures that we
follow for handling BDL data.

Section 5.0 What are EPA’s Revised Procedures for Developing Emissions Factors?
5-5
5.4 IDENTIFICATION OF OUTLIER DATA
After the BDL data have been properly addressed, we subject the candidate data set (i.e.,
the new data consisting of test results that have been subjected to the BDL procedures and the
existing AP 42 data) to statistical outlier tests to determine if any values should be eliminated
from emissions factor calculations. A statistical outlier refers to one or more values that do not
conform to the statistical pattern established by other values under consideration for the same
process. These outlier values can be caused by an unusual process condition or circumstance that
produced an unexpected and unrepresentative variation in the process emissions.
For the purposes of identifying outliers, our revised approach for developing emissions
factors uses the Dixon Q test or the Rosner test, depending on the number of test result values in
the data set. If there are fewer than three values in the subject data set, an outlier analysis is not
conducted. Appendix C contains a detailed discussion of the procedures we use to determine
outliers. If values are determined to be outliers, our procedure is to flag these values as outliers
and omit them when developing the EPA emissions factor while retaining them in the WebFIRE
database.
5.5 EMISSIONS FACTOR DERIVATION AND QUALITY ASSESSMENT
After evaluating the candidate data set for BDL data and outlier values, we recommend a
step-wise procedure to: (1) calculate an emissions factor value using the individual test data
values that result in the highest quality rating and most representative factor for the source
category of interest, and (2) assign the quality rating of the resulting emissions factor. The
procedures for calculating the emissions factor value and assessing factor quality are based upon
an evaluation of the number of individual sources in the source category for which the emissions
factor is being developed, the quality rating of individual test data (ITR) and the number of
individual test data values used to calculate the emissions factor. Appendix D contains a detailed
description of the emissions factor development and data quality characterization procedures.

6-1
Section 6.0 EPA’S INTERACTIVE DATABASE FOR THE EMISSIONS FACTORS PROGRAM – WHAT IS
WEBFIRE?
6.1 WHAT IS WEBFIRE?
WebFIRE is the EPA’s online emissions factors repository, retrieval and development
tool. The WebFIRE database contains the EPA’s emissions factors for criteria and hazardous air
pollutants (HAP) for industrial and non-industrial processes. In addition, WebFIRE contains the
individual test data values, where available, and supporting documentation used to develop the
factors and other data submitted to the EPA by federal, state, tribal and local agencies;
consultants; and industries. For each emissions factor and individual test data value, WebFIRE
contains descriptive information such as industry and source category type, control device
information, the pollutants emitted and supporting documentation. The home page for WebFIRE
and links to Frequently Asked Questions (FAQs) and background information on data contained
in the WebFIRE system can be found at: http://cfpub.epa.gov/webfire/.
At this time, WebFIRE does not contain CEMS data. Although the WebFIRE system
could accept and store CEMS data as emissions records, WebFIRE does not yet incorporate the
corresponding process data and calculation algorithms necessary to develop activity-based
emissions factors using CEMS data. We intend to provide this expanded capability in future
releases of WebFIRE because we recognize the importance and potential value of CEMS data to
emissions factor development.
6.2 HOW IS WEBFIRE USED?
WebFIRE’s two primary functions related to emissions factors are to provide: (1) storage
and retrieval of emissions factors and individual test data values, and (2) tools for calculating and
assessing the representativeness of a user-defined emissions factor derived from a set of
individual test data values. Figure 6-1 provides an overview of WebFIRE and its basic
functionality.

Section 6.0 EPA’s Interactive Database for the Emissions Factors Program-What is WebFIRE?
6-2
FIGURE 6-1. WEBFIRE OVERVIEW
Emissions Factor Search & Retrieval Capability
WebFIRE Online Database Application Capabilities
Emissions Factor Development Capability
Simple Keyword Search
Detailed Search Using Multiple Criteria
EPA Emissions Factor
Retrieve All System Data Matching Search Criteria
User Defines Data to Apply for Emissions Factor Development
Develop User–Defined Emissions Factor
Assign Quality Rating to User–Defined Emissions Factor

Section 6.0 EPA’s Interactive Database for the Emissions Factors Program-What is WebFIRE?
6-3
To retrieve an EPA emissions factor, WebFIRE provides for either a simple or detailed
search. The simple search (denoted on the WebFIRE page as “Simple Keyword Search”) allows
the user to search for emissions factor information in cases where the user has limited knowledge
of the emissions process of interest (e.g., the emissions process is a wood-fired boiler). The
simple search can be used as a starting point in WebFIRE; however, refining the search to
determine the most useful and applicable emissions factor requires an iterative progression
through the database that can be time-intensive. The detailed search (denoted on the WebFIRE
page as “Detailed Emission Factor Search”) allows users to search and retrieve emissions factors
in cases where they have detailed knowledge of emissions process of interest (e.g., the process is
a wood-fired boiler that is controlled by a scrubber and electrostatic precipitator in series).
Although one needs more informational inputs to initiate the detailed search, there are fewer
iterative steps required (i.e., WebFIRE returns a useful emissions factor in less time).
Both the simple and detailed searches also provide a link that returns the data values used
to derive the selected emissions factor, where available, and all other test data values contained
in WebFIRE that meet the search criteria. Section 7.0 provides a more detailed discussion of the
WebFIRE emissions factors search and retrieval tools.
WebFIRE also provides tools that allow a user to calculate an emissions factor from a set
of individual test data values contained in WebFIRE. These WebFIRE tools incorporate our
revised approach for developing emissions factors (see Section 5.0). In general, the user selects
the individual test data values to be used in developing an emissions factor. After the user selects
the preliminary candidate data set, WebFIRE evaluates the data set to identify and address BDL
data and outlier values. Following the BDL and outlier value analyses, WebFIRE calculates an
emissions factor value from the data set that best represents the process of interest. WebFIRE
also assigns a relative quality rating to the user-defined emissions factor. Section 9.0 discusses
WebFIRE’s emissions factor development tools in more detail. Appendices B through D contain
the BDL and outlier analyses and the calculations and procedures for deriving a user-defined
emissions factor.

Section 6.0 EPA’s Interactive Database for the Emissions Factors Program-What is WebFIRE?
6-4
6.3 WHO USES WEBFIRE?
The data storage, retrieval and emissions factor development capabilities of WebFIRE are
available online to all public and private entities. Examples of WebFIRE users include, but are
not limited to:
• Federal, state, local or tribal air pollution control and regulatory agency personnel (example uses include: emissions inventory development, preparation of emissions estimates for dispersion modeling, comparison of a site-specific emissions factor to an EPA emissions factor for a given process).
• Environmental staff at industrial facilities (example uses include: emissions and process data submittal; comparison of process emissions to an EPA emissions factor or other related data).
• Environmental action groups (example uses include: for air emissions and air permit oversight).
• Engineering consultants, university researchers and international air agencies.
Periodically, the EPA will use the test data and development tools contained in WebFIRE to
revise existing and derive new emissions factors as discussed in Section 11.0. The EPA also
plans to use the test data submitted to WebFIRE to inform our air rule development efforts under
the Clean Air Act.
6.4 HOW DOES WEBFIRE IMPROVE EMISSIONS FACTOR IDENTIFICATION AND DEVELOPMENT?
The emissions factor repository, retrieval and development tools in WebFIRE allow the
EPA to progress towards our goal of developing an interactive emissions factors program that
will incorporate new data as they become available and produce high-quality emissions factors in
a timely manner. We also believe that the benefits of online data access and electronic data
submittal provided by WebFIRE will allow for easier, more effective involvement by the public
interested in developing and improving emissions factors.
WebFIRE will also allow the EPA to shift the role of OAQPS from that of sole developer
of emissions factors to that of a facilitator. This shift will allow us to focus more resources on
overseeing the emissions factor program, ensuring that more high-quality emissions factors are

Section 6.0 EPA’s Interactive Database for the Emissions Factors Program-What is WebFIRE?
6-5
developed and developing policies for the appropriate use of emissions factors in non-inventory
applications where policies are not currently available, or where existing policies are inadequate.

7-1
Section 7.0 HOW DO I FIND AN EMISSIONS FACTOR?
7.1 HOW DO I IDENTIFY AND RETRIEVE AN EMISSIONS FACTOR FROM WEBFIRE?
You have two options in WebFIRE to search for and retrieve the EPA’s emissions
factors: a Simple Keyword Search, and a Detailed Emissions Factor Search. WebFIRE also
allows you to expand your simple or detailed search to include emissions factors that have been
revoked by EPA. Figure 7-1 provides an overview of the factor retrieval process. Table 7-1 lists
the data fields that are provided for each emissions factor record.
Using the Simple Keyword Search (Step 1 in Figure 7-1), you can retrieve emissions
factor records by entering one or more simple terms such as: source category name (e.g., dry
cleaning, wood combustion, boilers), process description (e.g., spreader stoker, catalytic
cracking), Source Classification Code1 (SCC) or any other viable search term likely to be found
in an emissions factor record. For example, if you enter in the phrase “spreader stoker,” the
simple search results page will display every EPA emissions factor that includes the complete
phrase “spreader stoker” anywhere in the entire record. To make your search more specific, you
can use the “AND” operator. For example, “spreader stoker AND PM10” which will limit the
results to PM with aerodynamic diameters less than 10 micrometers. The “AND” operator must
be capitalized. Do not use punctuation in the search window. When searching WebFIRE using an
SCC, do not use dashes, spaces or other punctuation when entering the codes into the search
window.
1 The SCCs are used by the EPA to organize data for anthropogenic air pollutant sources that have similar production and emissions characteristics (e.g., gasoline storage tanks, polymer manufacturing facilities) into related groups or source categories. An overview of the SCC system is provided in this Section 8.1.

Section 7.0 How Do I Find An Emissions Factor?
7-2
FIGURE 7-1. PROCEDURES FOR RETRIEVING EMISSIONS FACTORS FROM WEBFIRE
Simple Search
Keyword Entered
Detailed Search
Any Combination of Search Fields Other Than SCC, Pollutant,
Controls
Detailed Search
SCC, Pollutant and Control
Device Fields Entered
Multiple Records
Returned from Search
(if available)
Single Record Returned from
Search
Generate ReportsQuery Results in CSV, HTML, XML,
ASCII Formats
Initial Query Results Page
Detailed Emissions
Factor Record
Obtain Background, Files, References,
and ERT Files
(Step 1)
(Step 2)
(Step 2)
(Step 3)
(Step 4)
(Step 6)
(Step 5)
(Step 7)
(Step 8)

Section 7.0 How Do I Find An Emissions Factor?
7-3
Table 7-1. Data Fields Reported by WebFIRE Emissions Factor Search
Emissions Factor Record Data Elements Description
Emissions factor Numerical value and units of the emissions factor. SCC Source Classification Code
SCC levels SCCs are comprised of four levels (starting with the most
general source classification to the most specific). The definition of each level for the SCC is provided.
Pollutant name Chemical name of pollutant factor.
CAS number Chemical Abstract Service (CAS) number assigned to the pollutant.
Pollutant code Identification number assigned to the pollutant in the National Emissions Inventory (NEI).
Quality score ITR for process test data or Composite Test Rating (CTR) for EPA factors.
Emissions factor representativeness
Qualitative characterization of how well an emissions factor statistically represents the population of similar facilities in a
source category. Primary control device The first control device applied to the process. Second control device The second control device applied to the process. Third control device The third control device applied to the process. Fourth control device The fourth control device applied to the process. Fifth control device The fifth control device applied to the process. Sixth control device The sixth control device applied to the process.
Status Identifies emissions factors as individual test data value, EPA factor or proposed emissions factor undergoing review.
Data source type Refers to the original document(s) from which factors were obtained.
Restriction type Refers to caveats or special considerations prior to use of the emissions factor.
References Test report or citation where the factor was derived.
AP 42 section Identifies the specific AP 42 section where the process data can be found.
Formula Empirical equation used to express an emissions factor. Date Represents the date the emissions factor was developed/revised.
Notes Additional information to assist the user in understanding and applying an emissions factor.
To minimize the potentially large number of emissions factor records retrieved when
using a simple search, you can use the Detailed Emissions Factor Search (Figure 7-1, Step 2).
The detailed search allows you to focus the factor retrieval process by entering multiple terms for
the search criteria including:

7-4
• SCC (complete code or individual SCC level descriptions), • Control device type, • Pollutant or pollutant group type, and • Specific AP 42 section.
Whether you enter a complete SCC (8- or 10-digit), or the four individual descriptions for
each SCC level, WebFIRE will return the same search results, provided the descriptions are
correctly selected to match a valid SCC. For example, using SCC 10200203 will produce the
same search result as using the following SCC level descriptions:
Level 1: External Combustion Boilers,
Level 2: Industrial,
Level 3: Bituminous/Subbituminous Coal, and
Level 4: Cyclone Furnace.
For the detailed search criteria, you are provided a drop-down menu of choices from which to
select. After a search is conducted, you have the option to refine your search, as necessary.
For either the simple or detailed search (Figure 7-1, Step 5), the results page for the
emissions factor provides the following information:
• SCC, • Level 1, 2, 3 and 4 SCC descriptions, • Pollutant name, • NEI pollutant code, • Pollutant CAS number, • Control device(s), • Emissions factor value, • Emissions factor quality rating, • Emissions factor representativeness, • Data source type, • Restriction type, • Date of factor development, • Factor status, • Emissions factor reference(s), • Applicable AP 42 section,

7-5
• Formula, and • Notes.
At this stage of the search, you have the option of: (1) creating a summary report of the
information shown on the results page (Figure 7-1, Step 6), or (2) obtaining additional
background information for the emissions factor that you selected (see Section 7.2). To
accommodate various end uses of the retrieved data (e.g., emissions calculations, incorporation
into a text file), WebFIRE provides you with the following reporting formats:
• Comma Separated Values (CSV) format (for importation into a spreadsheet or
database), • Extensible Markup Language (XML) format (for importation into XML parsing
applications), • American Standard Code for Information Interchange (ASCII) format (for
importation into other applications), and • Hypertext Markup Language (HTML) format (for printing).
7.2 HOW DO I OBTAIN BACKGROUND INFORMATION FOR MY SELECTED EMISSIONS FACTOR?
At the search results page, WebFIRE provides you the option of retrieving additional
detailed information for the emissions factor that you selected (Figure 7-1, Step 7). Clicking on
the “Details” button located at the right-hand side of the search results page provides you with
information such as the citation for the data; the applicable AP 42 section; formulas and
equations that are applicable to the factor; and information on process configurations, operating
conditions, control device configurations and test conditions relevant to the emissions factor that
you selected. This information is intended to give you a better understanding of your specific
factor so you can make better decisions regarding its applicability.
From the “Emissions Factor Details” page, you can also retrieve additional supporting
documentation for an emissions factor (Figure 7-1, Step 8). Links to web-based files are
provided that allow you to obtain items such as factor background information documents,
individual emissions test reports and data and any other available documentation materials that
may help you to better understand a factor’s derivation.

7-6
7.3 HOW DO I IDENTIFY THE DATA USED TO DERIVE AN EPA EMISSIONS FACTOR?
In addition to the emissions factor data retrieval tools described in Sections 7.1 and 7.2,
WebFIRE allows you to identify the specific emissions test data, where available, that were used
to calculate the EPA emissions factors, as well as any other data contained in WebFIRE that met
your search criteria (e.g., SCC, pollutant, control device) used to retrieve the emissions factor.
When you click on the “Factor Derivation Data” link on the “Emissions Factor Details” page,
WebFIRE will return: (1) a list of the individual test data values used to calculate the selected
EPA emissions factor, and (2) a list of all the other individual test data values contained in
WebFIRE that match the original search criteria. For the individual test data values retrieved,
you are provided with the numeric value, the quality rating of the test report upon which the
individual test data value is based (see Appendix A), the date that the test was conducted and a
link (labeled “Details”) that allows you to obtain additional background and documentation for a
particular individual test data value. For example, if the emissions factor you selected was
originally obtained from AP 42, clicking on the “Factor Derivation Data” option provides you
with a list of all the individual test data values, where available, used to derive that AP 42 factor
and any other test data in the WebFIRE system that meets those same search criteria.

8-1
Section 8.0 WHAT PARAMETERS SHOULD I CONSIDER WHEN USING OR DERIVING AN EMISSIONS
FACTOR?
When you are selecting or deriving an emissions factor for use in developing an
emissions estimate for a particular process or activity, the primary considerations are:
• How well the emissions factor represents the process for which the emissions
estimate is being developed, • The effect on emissions due to the presence (or absence) of a control device or
technique, and • The underlying test method used to measure the pollutant(s) represented by the
emissions factor.
8.1 SOURCE CATEGORY AND PROCESS CONSIDERATIONS
EPA uses SCCs to classify different types of anthropogenic emissions activities. Each
SCC represents a unique, source category-specific process or function that emits an air pollutant.
The SCCs are used as a primary identifying data element in EPA’s WebFIRE, the NEI and other
EPA databases. The SCCs are also used by many regional, state, local and tribal agency
emissions data systems.
There are two types of SCCs: 8-digit and 10-digit. The 8-digit SCCs follow the pattern
1-22-333-44 and the 10-digit SCCs follow the pattern 11-22-333-444. The codes use a
hierarchical system in which the definition of the emissions process becomes increasingly more
specific as you move from left to right. The first level of description provides the most general
information on the category of emissions. The fourth category is the most detailed and describes
the specific emitting process. Point source SCCs have historically had only 8 digits; however,
numerous 10-digit SCCs that can characterize point source processes such as aircraft emissions
and ground support equipment emissions at airport facilities. Ten-digit SCCs primarily represent
nonpoint and mobile source emissions.
The current list of SCCs and their descriptions can be downloaded from the EPA’s
Emission Inventory System (EIS) website: (http://www.epa.gov/ttn/chief/eiinformation.html).

Section 8.0 What Parameters Should I Consider When Deriving a User-Defined Emissions Factor?
8-2
Once on this website, clicking on the link for “EIS Code Tables (including SCCs)” under
“Emissions Inventory Tools” will take you to a Microsoft Access® database that lists various
tables. Scroll down through the list of tables until you reach an entry titled “Source Classification
Code.” Clicking on that table will reveal the current SCC listing.
The EPA is updating and improving the SCCs. As technologies have changed over the
years, the EPA has recognized the need to remove out-dated SCCs and add SCCs for new
emissions processes. A review of existing SCCs has shown several instances of duplicate SCCs
for the same process. Duplicate SCCs are being retired to ensure that each emissions process has
a unique SCC. In addition, the EPA is working to assign SCCs to emissions sources which are
currently regulated but do not have SCCs. Other changes are being made to ensure that the
assignment of an SCC is consistent with the descriptions associated with the hierarchy of digits
that comprise each SCC.
The SCC revisions are intended to improve the overall organization of the SCC list by
reducing the likelihood of a user choosing an incorrect SCC for their particular process. The
SCCs are designed to categorize processes that create emissions. Therefore, another objective of
revising the SCCs is to remove the description of control devices from the current SCC list.
Another objective of the SCC revision process is to reduce the use of miscellaneous
SCCs, such as those including “99” codes. Often these are labeled in the SCC list as “other not
classified,” “specify in comments field” or “miscellaneous.” These types of labels are not
sufficient to classify emissions processes. Therefore, the EPA intends to remove these SCCs
from WebFIRE. The EPA’s new approach will allow entities submitting test data to WebFIRE to
propose new SCC(s) for their emissions processes in an effective and logical way. Upon receipt
of a request to establish a new SCC, the EPA will perform an analysis to determine if the
proposed SCC is unique or if an existing SCC should be used. The analysis will be based upon
the uniqueness of the emissions profile of the process and other relevant considerations.
It is important to note that the revisions that are currently being made to the SCC process
do not change the fundamental role that SCCs play in the emissions factor program or the way

Section 8.0 What Parameters Should I Consider When Deriving a User-Defined Emissions Factor?
8-3
that users will be able to search for specific emissions factors. These changes will improve the
overall data quality of the emissions factors by ensuring that the data upon which the emissions
factors are based are grouped in the appropriate SCC. In addition, a cross-walk will be provided
so that revised SCCs can be identified by their old SCC number.
8.2 CONTROL DEVICE CONSIDERATIONS
In addition to assessing the production process or activity for which you are selecting or
developing an emissions factor, you should have a clear understanding of the operation and
performance characteristics of any control techniques or technologies that are used to reduce
emissions from the process. When you are selecting or developing a controlled emissions factor,
you must determine if the control device reflected in the emissions factor record is comparable to
the type and configuration of any control device that is applied to the process for which you are
developing the emissions estimate. You may also need to assess whether the pollutant of interest
is reduced or eliminated by a particular type of control device, or determine whether a piece of
equipment functions as an integral part of the process (e.g., a cyclone that separates product from
a pneumatic conveying system, cooling cools in a vapor degreaser that reduce solvent loss) or
whether it is a control device (e.g., a cyclone that reduces PM emissions from a wood sawmill, a
thermal oxidizer that reduces organic emissions from a process vent). You may also find that a
clear understanding of control device operation is useful when assessing the performance of
control devices that are operated in series (WebFIRE accommodates up to six control devices for
a single emissions factor record).
8.3 POLLUTANT TEST METHOD CONSIDERATIONS
The selection of a test method and how the method is applied to measure emissions from
the process can affect the representativeness of the emissions data and the resulting emissions
factor developed from the data. The majority of the emissions factors contained in WebFIRE are
based upon direct emissions measurements. In most cases, these measurements were obtained
using the EPA’s reference test methods that were created to support development,
implementation and compliance with federal standards (e.g., New Source Performance Standards

Section 8.0 What Parameters Should I Consider When Deriving a User-Defined Emissions Factor?
8-4
(NSPS), National Emission Standards for Hazardous Air Pollutants (NESHAP)). In addition,
some emissions factors are based upon data collected using non-EPA test methods (e.g., methods
developed by the California Air Resources Board (CARB)).
The EPA’s reference test methods provide direct measurement of specific chemical
species (e.g., carbon monoxide (CO), sulfur dioxide (SO2)), emissions from a process or control
device. The EPA’s reference test methods for measuring PM or total hydrocarbons (THC)
measure the emissions of a group or class of pollutants rather than an individual compound or
chemical species. In these cases, for example, the term “filterable PM” is considered to apply to
the material that is captured upstream and on the sampling train filter maintained at a specific
temperature. Consequently, the temperature at which the sampling train is operated affects the
amount of “filterable” material collected (e.g., operating the sampling train at a lower
temperature would tend to capture more compounds that have high vapor pressures).
When you are considering an emissions factor developed from PM or THC data, you
should be aware of the underlying test method and conditions under which the test was
conducted to determine if the emissions factor is appropriate for the pollutant for which you are
preparing the emissions estimate. Often, an understanding of how the method is conducted can
overcome confusion related to applying the data and to comparing emissions from different
facilities.

9-1
Section 9.0 HOW DO I DEVELOP A USER-DEFINED EMISSIONS FACTOR?
9.1 HOW DO I USE WEBFIRE TO CREATE A USER-DEFINED EMISSIONS FACTOR?
WebFIRE allows you to develop a user-defined emissions factor using the same
procedures that the EPA follows to develop new or to revise existing emissions factors (see
Section 5.0). Figure 9-1 shows the steps that you must follow to develop a user-defined
emissions factor. First, you must obtain all of the individual test data values contained in
WebFIRE that are related to the emissions process of interest to you. This can be done in one of
two ways. You can specify the search criteria for the process of interest directly at the emissions
factor development page in WebFIRE. Alternatively, in cases where you have searched for and
selected an EPA emissions factor, you can obtain the individual data values used to derive the
emissions factor and any other test data values contained in WebFIRE (that met your search
criteria but may not have been used in deriving the EPA emissions factor) by clicking on the
“Factor Derivation Data” link provided at the “Emissions Factor Details” page (see Section 7.3).
Next, you must select the data values that you want to use to develop the user defined
emissions factor. After you have obtained the list of individual test data values, highlight the
check box next to each data record of interest to select your candidate data set. WebFIRE
calculates the emissions factor value from this candidate data set using the outlier, BDL, factor
derivation and quality assessment tools discussed in Section 5.0. At this time, these development
tools are not applicable to the emissions factors that are expressed as empirical equations because
they contain more than one variable.
After the user-defined emissions factor has been calculated by WebFIRE, you can
generate a report to provide documentation of the emissions factor development (Figure 8-1,
Step 6). The report provides a summary of the user-defined emissions factor, the number of test
data values used to derive the factor, the corresponding SCC for the emissions factor, applicable
control devices, the CTR for the factor (see Appendix D) and how well the emissions factor
represents air emissions from the process associated with the SCC. The report also shows the

Section 9.0 How Do I Develop a User-Defined Emissions Factor?
9-2
FIGURE 9-1. EMISSIONS FACTOR DERIVATION IN WEBFIRE
Step 1 – Obtain All Data Matching Search Criteria: Includes Factor Inputs & All WebFIRE Records Matching Search Criteria
Step 3 – Evaluate any BDL data using EPA rules and revise candidate data set as appropriate
Step 4 – Conduct Outlier Analysis and revise candidate data set as appropriate
Step 5 – Use WebFIRE tools to determine EF value and EF quality characterization
Product of Analysis:
• New/revised EF or a user-defined EF
• EF Representativeness Rating
• Composite Test Rating (CTR) for new/revised EF
• Documentation of the EF and component data
(This step defines the preliminary candidate data set for factor derivation.)
(The product of this step is the data set to be used for EF derivation.)
Step 2 – Define candidate data set for factor derivation from analysis of data in Step 1

Section 9.0 How Do I Develop a User-Defined Emissions Factor?
9-3
values and supporting information for the individual test data values that were used to derive the
emissions factor. Because user-defined emissions factors are not retained in the WebFIRE
database after they are created, we recommend a report be prepared for any user-defined
emissions factor that you develop.
9.2 WHAT ARE THE POTENTIAL IMPACTS ASSOCIATED WITH APPLYING A USER-DEFINED EMISSIONS FACTOR?
WebFIRE provides tools that allow users to develop emissions factors based upon
individual test data values selected by the user. Applying a user-defined emissions factor may
affect whether or not your source is subject to certain regulations. For example, applying a user-
defined emissions factor to a site-specific emissions estimate could show that a facility is not
subject to a particular emissions standard where the previous use of an emissions factor indicated
that the emissions standard was applicable. For this reason, we encourage you to be judicious
and responsible in your application of a user-defined emissions factor. We also encourage you to
create and maintain the WebFIRE report (see Section 9.1) that documents the development of the
user-defined emissions factor. WebFIRE does not retain user-defined emissions factors in the
database after they have been created.

10-1
Section 10.0 HOW DO I SUBMIT DATA TO WEBFIRE?
To ensure consistency of data submittals from many different facilities and entities, we
require that you submit data to WebFIRE using the EPA’s Electronic Reporting Tool (ERT):
http://www.epa.gov/ttn/chief/ert/index.html. The ERT (see Section 10.1) is an electronic
alternative to submitting paper test reports and supporting documentation. After you have
completely filled out the ERT, you must submit the information to WebFIRE through the EPA’s
Central Data Exchange (CDX) using the Compliance and Emissions Data Reporting Interface
(CEDRI) data upload application. The CDX (see Section 10.2) is part of the Environmental
Information Exchange Network and provides industry easy and secure reporting service. The
CEDRI application allows CDX users to upload emissions data.
If you have an existing CDX account (e.g., you submit reports for the EPA’s Toxic
Release Inventory (TRI) Program), you can use your current user name and password to log in to
CDX by navigating to the https://cdx.epa.gov/ link and clicking the “Log in to CDX” button in
the header of the page. After you log in, you will need to select the “Edit Current Account
Profiles” link followed by the “Add New Program” link in order to add the CEDRI data upload
program to the list of CDX applications that you routinely use and then follow the instructions
provided on the subsequent pages to complete the identity verification process to obtain approval
from EPA to access CEDRI.
If you do not have an existing account with the CDX, you must complete the online
registration process by navigating to the CDX home page (https://cdx.epa.gov/) and clicking the
“Register with CDX” button in the header of the page. After completion of the user registration
component, you will need to follow the instructions provided on the subsequent pages to
complete the identity verification process in order to obtain approval to access the CEDRI data
upload program.
During the registration process, you have the option of registering as a “preparer” or as a
“certifier.” If you are preparing reports for signature and subsequent submission by an authorized

Section 10.0 How Do I Submit Data to WebFIRE?
10-2
representative of the facility, you should register as a preparer. The certifier is the duly
authorized representative of the source or more commonly referred to as the “owner or operator”
of the facility. The certifier is authorized to modify the package a preparer has assembled, sign
and submit the package to the CDX. Contractors are prohibited from registering as a certifier.
Contractors are permitted to register as a preparer and may assemble submission packages, such
as the ERT, for the certifier’s approval and signature.
If you are the signature authority for the facility (i.e., certifier), you must use either the
LexisNexis electronic identity validation service or the paper-based Electronic Signature
Agreement (ESA) validation process to register as a certifier. We strongly encourage certifiers to
use the electronic identity validation process as the paper-based approval of the ESA typically
takes 5 to 10 business days. If you choose to use the paper-based validation process, you will be
required to mail your signed ESA to the CDX Reporting Center. The CDX Reporting Center will
request the phone number of the signature authority’s employer/authorizing official to verify
employment.
For any questions regarding the CDX, the CDX Help Desk
(http://www.epa.gov/cdx/contact.htm) is available for data submission technical support between
the hours of 8:00 am and 6:00 pm (Eastern Standard Time (EST)) at 1-888-890-1995 or
[email protected]. The CDX Help Desk can also be reached at 970-494-5500.
10.1 WHAT IS THE ERT AND HOW IS IT USED TO DOCUMENT EMISSIONS TESTS?
The EPA’s ERT is a Microsoft Access® application developed by the agency to aid
facilities in planning and reporting the results of emissions tests. The ERT replaces time-
intensive manual test planning, test data compilation and reporting, and data quality assurance
evaluations. When properly applied, the ERT also facilitates coordination among the facility, the
testing contractor and the regulatory agency (e.g., for compliance demonstrations) in planning
and preparing for the emissions test. The current version of the ERT, a list of the EPA test
methods that are currently supported by the ERT and guidance on the use of the ERT can be
found at: http://www.epa.gov/ttn/chief/ert/index.html. Information regarding the EPA’s test

Section 10.0 How Do I Submit Data to WebFIRE?
10-3
methods can be found at EPA’s Emission Measurement Center (EMC):
http://www.epa.gov/ttn/emc/.
The ERT documents the following key information; some of which are required by the
EPA reference test methods for stationary sources:
• Four-level SCC specification, • Process data from existing air permits (e.g., process throughput rates), • Process rate levels during actual testing, • Descriptions of the source, unit process and control devices associated with the test, • Process upsets or malfunctions during testing, • Process flow diagram, • Sampling locations, • Test methods used, • Deviations made to any test method, and • Output flow rates and pollutant concentrations.
Figure 10-1 shows the typical steps followed when using the ERT. The ERT consists of: (1) a
database application, (2) the project data set (PDS) and (3) a data upload spreadsheet. The
application is a Microsoft Access® database that contains all of the data input screens, reports,
calculations and other items necessary to create and distribute a test report. The application also
incorporates our evaluation system (see Section 5.2 and Appendix A) so that each test is assigned
a numeric score (the ITR) that assesses the quality of the measurement data and associated
information collected during an emissions test. A standalone version of the application is
available that includes a setup routine that installs the ERT application database and the
Microsoft Access® runtime program. The PDS is also a Microsoft Access® database that contains
the measurement data for a single test report. This file is exchanged between the source test
contractor, the client and the regulatory agency, if necessary (e.g., for a compliance test). To
provide flexibility to ERT users, the Microsoft Excel® spreadsheet can be used to upload the
sampling hardware and field measurement data recorded during a test into the PDS rather than
entering the data directly into the PDS through the application.

Section 10.0 How Do I Submit Data to WebFIRE?
10-4
FIGURE 10-1. TYPICAL WORK FLOW WHEN USING THE ERT
Upon completion, the ERT contains all of the emissions data and supporting information
(e.g., equipment calibration documentation) prepared and collected for the test. In addition, an
electronic copy (portable document format (PDF)) of the entire report documenting the
emissions test and other supporting information is attached to the ERT and submitted as a zip
file.
The ERT automatically creates an XML export file for the WebFIRE emissions factor
database. The format of this ERT output file is specifically designed to provide inputs for the
data fields contained in WebFIRE (e.g., emissions value and units, SCC, ITR). To facilitate
incorporation of the data into WebFIRE, the output file is configured to accept emissions values
expressed in terms of mass of pollutant emitted per unit of activity. The output file also accepts
emissions test results that are expressed as a concentration or an emissions rate (i.e., mass
emitted per time unit) which may be able to be expressed in units that are suitable for use in
emissions factor development.

Section 10.0 How Do I Submit Data to WebFIRE?
10-5
Use of the ERT will provide for consistent criteria to quantitatively assess the quality of
the data collected during the emissions test and to standardize the test report contents. The use of
the ERT also improves the availability of the supporting documentation necessary to conduct
such an evaluation. Additionally, the ERT lays the groundwork for future capabilities to
electronically exchange information contained in the test reports with facility, state, local or
federal data systems.
10.2 WHAT ARE THE CDX AND CEDRI AND WHAT ARE THEIR ROLES IN SUBMITTING DATA TO WEBFIRE?
Electronic environmental data submissions to EPA, including submission of emissions
data for use in WebFIRE, must be made through the CDX using the CEDRI data upload
application.
The CDX is part of the Environmental Information Exchange Network that was
developed by the EPA and the states to facilitate online sharing of electronic environmental
information among EPA, states, tribes, localities and other entities. The CDX is a broad-based
tool that offers industry, states, tribes and other stakeholders a fast, easy and secure reporting
service. As part of EPA's e-government initiative, the CDX helps to ensure that both the public
and regulatory agencies can access the information needed to document environmental
performance, understand environmental conditions and make sound decisions to protect the
environment.
The benefits of the CDX to the EPA and related program offices include:
• Elimination of redundant infrastructure and its associated costs, • Facilitation of faster, lower-cost implementation of new or modified data flows, • Integration of data to agency data repositories, • Establishment of consistent procedures for electronic signatures, • Reduction in the time needed to make information publicly accessible, • Reduction in the record management costs by elimination of redundant
recordkeeping, and • Compliance with the Cross-Media Electronic Reporting Regulation (CROMERR).

Section 10.0 How Do I Submit Data to WebFIRE?
10-6
The benefits to the industry, states, local agencies and tribes associated with the CDX
include:
• Reduction of overall reporting burden, • Improvement in data accessibility, • Electronic confirmation that information was received and that the electronic form
was filled out correctly, • Reduction in the time and costs associated with environmental data submission
requirements, • Simplification of reporting to a single point in the EPA instead of many separate
programs, • Faster securing of submission through built-in edit and data quality checks, • Improvement of security and transmission of confidential business information (CBI)
through registration and authentication, • Reduction of burden of complying with new or changing requirements, and • Streamlining of reporting through the Exchange Network and Web Services.
The EPA expects facilities to produce and submit an increased amount of new emissions
test data in response to regulations that require the electronic submission of emissions tests to
demonstrate compliance with federal air regulations.
In the future, we anticipate that the EPA will use the capabilities of the CDX to provide
for electronic exchange of information in test reports with facility, state and federal data systems.
For example, the ERT allows sources to document facility-specific information that may also be
required under other regulatory data systems, such as the Air Facility System (AFS). Such
systems contain compliance, enforcement and permit data for stationary sources of air pollution
regulated by the EPA and state/local/tribal agencies. Transfers to other data systems such as the
NEI, TRI and Title V reporting may also be desirable.
The CDX/CEDRI user’s guide can be found at:
http://www.epa.gov/ttnchie1/ert/cedriguide.pdf. Files submitted through the CDX/CEDRI are
stored in the CDX CROMERR archive and a copy of the files is retained in the WebFIRE
database.

Section 10.0 How Do I Submit Data to WebFIRE?
10-7
To submit files through the CEDRI application, you must accept the certification
conditions that the documents and attachments were prepared under your direction or supervision
and that, to the best of your knowledge, the information is true, accurate and complete. After
accepting the certification conditions, you will be prompted to re-validate your user name and
password, answer the validation question and officially sign the submission. Shortly after
submission, you will receive email notification stating whether the files were successfully or
unsuccessfully submitted. Submissions can fail for a variety of reasons, including presence of an
invalid file (e.g., improper file extension), an incomplete file, or system errors. If any system
errors occur after you upload and sign the submission file, you will be prompted to re-submit the
files or contact the CDX Help Desk.

11-1
Section 11.0 WHAT IS THE DATA REVIEW AND PUBLIC PARTICIPATION PROCESS FOR EMISSIONS FACTOR
DEVELOPMENT?
An overview of the public participation and data review process used by the EPA when
implementing section 130 for source test and/or emissions factor data is shown in Figure 11-1.
The CAA contains provisions that encourage the EPA to obtain public participation and review
the development of emissions factors.
Periodically, the EPA will review, compile and analyze the data contained in WebFIRE
for the purposes of revising existing and developing new emissions factors, as appropriate. We
do not have an established schedule upon which the development of new and/or revised
emissions factors will take place. Rather, we will consider the following criteria to determine if
emissions factor development is warranted:
• The amount of new source test/emissions factor data that have been received;
• The degree of variability with existing emissions factors in WebFIRE; and
• EPA’s programmatic needs related to new rules, policies and other EPA tools.
If we receive a substantial amount of new information for a given process type and that
process is a significant emitter of one or more pollutants, new factor review and development
activities could be prompted. If we receive only a few new data values for a process type, it is
less likely that the new data alone would initiate the extensive factor review and development
process. Another point that we consider is the difference and variability between the existing
emissions factors in WebFIRE and the newer data. If the newer data do not significantly change
the existing factor(s), the need to revise the factor would be less urgent. Lastly, decisions to
initiate factor review and development may be tied to programmatic issues and schedules
occurring within the EPA. For example, new data or the need for improved emissions factors
may be driven by new regulations that are under development or that were recently promulgated.
Also, emissions inventory requirements may be in place that will demand new emissions factors.

Section 11.0 What is the Data Review and Public Participation Process for Emissions Factor Development?
11-2
FIGURE 11-1. OVERVIEW OF THE WEBFIRE PUBLIC PARTICIPATION AND EMISSIONS FACTOR DEVELOPMENT PROCESS
EPA compiles and analyzes data to calculate new/updated emissions factors
EPA publishes notice of availability for proposed emissions factors and requests public review
EPA evaluates public comments and finalizes emissions factors
EPA releases new/updated emissions factors in WebFIRE

Section 11.0 What is the Data Review and Public Participation Process for Emissions Factor Development?
11-3
When one or more of these considerations occur, the EPA will initiate the emissions
factor review and development activities. As a result of this process, the EPA will propose new
and/or revised emissions factors for specific processes (i.e., SCCs). The draft or proposed
emissions factors will be flagged within WebFIRE as “proposed” to identify their status. The
EPA will publicly announce the availability of these proposed emissions factors and invite public
review and comment. The public announcement may take the form of an EPA Listserv email
notification (e.g., NEI Listserv, InfoCHIEF Listserv) or, in the event of a large and/or very
important release, a formal Federal Register notice. These notifications would describe the
nature of the new emissions factors that have been developed and their associated source
categories. Typically, the public will have a 60-day review and comment period for the proposed
factors. Examples of some topics to consider include, but are not limited to:
• The validity and accuracy of the test methods applied to obtain sample measurements,
• The validity and accuracy of the analytical procedures used to quantify measurements,
• The completeness, thoroughness and transparency of the source test documentation,
• The correlations made between process parameters and test data conditions,
• The accuracy of the assigned SCC and control device codes, and
• The adequacy and accuracy of the process description for the source category and the associated documentation.
The process for submitting comments (e.g., format and method of submittal, due dates,
submittal address) will be described in the data availability announcements. Commenters should
review all information pertinent to the correct calculation of emissions factors from the
underlying test data. The review should address how well the mass or concentration
measurement data were combined with process operating data (e.g., fuel use, material
throughput, item production, power output) to yield an emissions factor. If controls are in place,
control device operating conditions should be correctly associated with process conditions and
factored into the emissions factor development. It is particularly important that reviewers
confirm the process and source category associations made for the data. New or revised process
flow diagrams and/or schematics should be submitted if an industry has undergone significant

Section 11.0 What is the Data Review and Public Participation Process for Emissions Factor Development?
11-4
changes since the last revision. These process associations should be made using SCCs,
recognizing that, in some cases, new SCCs may be required.
At the conclusion of the 60-day review period, the EPA evaluates the comments received
and makes any appropriate modifications to the data in WebFIRE. If commenters provide new
emissions test data for use in emissions factor development, we will consider combining the
newer data with the existing data for a given source type or category. When determining valid
combinations of existing and new data, we use statistical analyses that are based upon the
Student’s t–test (see Appendix E). If the comments identify issues or raise questions that the
EPA cannot address, the original submitter will be contacted for reconciliation. After all
comments are appropriately addressed and the EPA is satisfied with the quality of the emissions
factor data, the “proposed” emissions factor status flag in WebFIRE is removed and the previous
emissions factor, if any, is flagged as “revoked.” The new and/or revised emissions factors are
then made available to the public in WebFIRE (http://cfpub.epa.gov/webfire/).

APPENDIX A
PROCEDURES FOR DETERMINING INDIVIDUAL TEST REPORT QUALITY RATINGS

Appendix A Procedures for Determining Individual Test Report Quality Ratings
A-1
1.0 Introduction
Historically, the EPA’s quality reviews of emissions test data and test reports were largely subjective because each test program presented different issues (i.e., no two facilities, or the tests conducted at those facilities, are exactly alike). Typically, the EPA developed quality ratings (letter grades of A through D) for test reports based upon the agency’s review of the following criteria areas:
• Source operation, • Test method and sampling procedures, • Process information, and • Analysis and calculations.
To reduce the subjectivity of quality reviews, the individual test rating (ITR) assigned by
the Electronic Reporting Tool (ERT) is based upon process, control device and emissions testing documentation provided by the source and responses to questions that assess the quality of the process, control device and emissions data collected during a source test. The methodology used by the ERT for assessing the quality of emissions test data follows the same basic principles as the EPA’s historic methodology. However, the ERT procedure provides a consistent objective framework for test contractors to follow when compiling test reports, and for regulatory agency reviewers to follow when assessing data quality.
The test report quality rating methodology consists of three components: (1) the assignment of points by the ERT based upon the source’s entry of information into specific data areas and attachments, (2) an adjustment of the points assigned by the ERT based upon a regulatory agency review and (3) the normalization of the points for a maximum ITR of 100 such that the ERT assigned score is 75 percent of the total and the remainder is based upon the regulatory agency review.
Table A-1 shows the types of information and documentation used by the ERT to assign points and the questions that are used to evaluate the quality of data submitted to the ERT. The information requested in the table is indicative of a complete and well-documented test report. The awarding of points by the ERT assumes that the information and documentation provided by the source is true, accurate and complete. The adjustment to the points awarded by the ERT may result in a modest increase in the points when the regulatory agency review verifies that the information contained in the documentation provides an acceptable level of quality. The adjustment to the points awarded by the ERT may result in a decrease when the regulatory agency review reveals incorrect measurement procedures, unrepresentative process operation or other inaccurate information.
Supplementary points are awarded by the ERT when documentation is provided showing
certification or accreditation of those individuals or organizations involved with the testing program. It is important to note that well-performed and documented test reports will receive a sufficiently high rating to justify their use in developing emissions factors without any supplementary points. Neither a state review nor participation by accredited organizations or

Appendix A Procedures for Determining Individual Test Report Quality Ratings
A-2
certified individuals is required. However, these added components can improve the quality rating of the test report.
It is important to note that while a significant level of subjectivity has been removed from the quality assessment of source tests for emissions factors development, the points awarded are not a direct indicator of the precision, accuracy and usability of the data for other purposes. For simplicity, the point assignment employs a “Yes/No” criteria rather than a graded assessment.
Some of the components may not directly affect the precision, accuracy or usefulness of
the final result but would bolster the confidence in the result. For example, reagent blanks and calibrations conducted prior to a test verify that the reagents and equipment comply with method requirements for the first test and increase the probability that the blanks and calibrations conducted after the test will comply with the method requirements. Also, some components do not result in completely unusable results at a given value. For example, a test with results below the method detection level may be adequate for demonstrating compliance when emissions calculated at the detection limit are significantly below the applicable limit. The judgment of an experienced and knowledgeable individual can estimate the range of potential change that a minor variation in an established test methodology has on the final result. While the use of a specific emissions test may not be used for emissions factor development, this data may be usable for other purposes when the bounds for that use are defined and assessed within the required purpose. 2.0 ERT Assessment
The initial scoring of the source test report is based upon the information and attachments provided by the source. The score is calculated by the ERT based upon the completeness of the report in the areas of process data, control device information, test method performance and quality assurance. The information listed under “Supporting Documentation Provided” in Table A-1 identifies information the source or source test contractor provides and the criteria the ERT uses in awarding points to calculate the quality indicator. Different supporting documentation components have been assigned different relative weightings due to the perceived importance associated with their potential to affect the overall precision, accuracy, representativeness and reliability of the final results.
Only those items related to the information collected during the test are used in calculating the initial score. Rather than use values between whole numbers and force the question scores to total 75 points, we prorate the score so that the ITR score is limited to 75 points when only the ERT assessment is performed.
Table A-1 also identifies criteria that, if satisfied, can provide supplementary points above the maximum of 75 awarded by the ERT. Supplementary points are awarded by the ERT whenever:
1. The source test company meets the competency requirements as an Air Emission Testing Body (AETB) as defined by the American Society for Testing and Materials (ASTM)

Appendix A Procedures for Determining Individual Test Report Quality Ratings
A-3
standard D7036-12 or the field test leader is a current Qualified Individual (QI) as defined by ASTM standard D7036-12,
2. The analysis laboratory is certified or accredited to perform the analysis.
An extra two points are awarded by the ERT for each of the above accreditations or
certifications that are demonstrated in the test report. As a result, a maximum of 79 points could be awarded by ERT if a QI was crew leader or the test company was an AETB and the laboratory was accredited by a national independent or state accreditation program. 3.0 Regulatory Agency Review
The quality of an emissions factor is only as good as the source data upon which it is based. In the majority of cases, the test report, which is typically prepared by the testing contractor, is the only documentation available for assessing the potential reliability (e.g., precision, accuracy, representativeness) of the emissions data for emission factor development as described in Appendix D. In all cases, the quality of the underlying source data can be more thoroughly assessed when the test report is independently reviewed by a regulatory agency.
The maximum quality rating for a test report that is not reviewed by a regulatory agency is 79 points (75 points awarded for the base ERT review and 4 additional points awarded if testing or analyses were conducted by certified or accredited individuals and organizations). The regulatory agency review can raise the initial ITR score to a maximum of 100 points. However, a negative evaluation by a regulatory reviewer can result in reducing the value of the initial scoring significantly.
Under the ERT quality rating procedure, the regulatory agency reviewer evaluates the
responses to certain questions (shown in Table A-1) contained in the Quality Assessment (QA) Review section of the ERT. If the reviewer makes the assessment requested by the question and concludes that the documentation is complete, correct and provides support of the proper performance of this item, additional points are added to the score given by the ERT. The points that are added with a positive response are shown in the fifth column of Table A-1. If the reviewer determines that points were incorrectly assigned (i.e., the information contained in the ERT file is incomplete, erroneous or not consistent with the test method), points are deducted from the value determined by the initial scoring. The points deducted from the initial score for each component are shown in the sixth column of Table A-1. In addition, the possibility exists that the ERT did not award points for an item, or part of an item, because that item was not documented in the correct location of the test report. If a positive validation of a misplaced item is provided by the regulatory reviewer, the ERT adds the prorated points (shown in the fourth column of Table A-1) that would have been awarded for the appropriate placement of the item in the test report.
Some of the information requested in Table A-1 is specific to certain test methods. For
example, the isokinetic sampling requirements (listed under “Raw sampling data and test sheets”) is only applicable when the test method collects pollutants which are in a particulate

Appendix A Procedures for Determining Individual Test Report Quality Ratings
A-4
form. In cases like this, the points associated with these items would not be included in either the points awarded or the maximum potential points used to normalize the ITR score. As a result, the test report will not be given a lower rating if the test method used does not require isokinetic sampling. Instead, quality ratings depend upon the testing requirements. For example, if an instrumental test method is used, only those questions that pertain to the method will be used to evaluate the quality of the test. Because the overall score is normalized based upon the maximum score that can be assigned for any given method, the fact that some questions that do not apply to the particular test method are not scored does not reduce the overall maximum score possible for one test method relative to another method
Regulatory agency reviewers may submit their review to EPA at any time, but we
anticipate the majority of the reviews will be associated with agency assessments of test reports prepared by facilities to demonstrate compliance with applicable regulations. We recognize that the public comment and review process that is associated with revising or establishing an emissions factor (see Section 11) may result in additional reviews. These reviews will be evaluated by EPA staff and any corrections may be incorporated into the existing quality assessment of the test data, as appropriate. The results of the regulatory agency review and accepted public reviews may be used in calculating a new or revised emissions factor.

Appendix A Procedures for Determining Individual Test Report Quality Ratings
A-5
Table A-1. Test Report Quality Rating Tool
Supporting Documentation Provided
Points Awarded if Documentation is
Present Regulatory Agency Review
Prorated Documentation
Points
Points Added with Affirmative
Response
Points Subtracted with Negative
Responsea
As described in ASTM D7036-12 Standard Practice for Competence of Air Emission Testing Bodies, does the testing firm meet the criteria as an AETB or is the person in charge of the field team a QI for the type of testing conducted? A certificate from an independent organization (e.g., Stack Testing Accreditation Council (STAC), California Air Resources Board (CARB), National Environmental Laboratory Accreditation Program (NELAP)) or self declaration provides documentation of competence as an AETB.
2
As described in ASTM D7036-12 Standard Practice for Competence of Air Emission Testing Bodies, does the testing firm meet the criteria as an AETB or is the person in charge of the field team a QI for the type of testing conducted? A certificate from an independent organization (e.g., STAC, CARB, NELAP) or self declaration provides documentation of competence as an AETB.
2 0 2
Was a representative of the regulatory agency on site during the test? 0 1 0
Is a description and drawing of test location provided? 3 Is a description and drawing of test
location provided? 3 1 3
Has a description of deviations from published test methods been provided, or is there a statement that deviations were not required to obtain data representative of typical facility operation?
6
Is there documentation that the source or the test company sought and obtained approval for deviations from the published test method prior to conducting the test or that the tester’s assertion that deviations were not required to obtain data representative of operations that are typical for the facility?
6 2 6
Were all test method deviations acceptable? 0 0b 6b
a This column shows the points subtracted with a negative response if points were awarded for this item by the initial scoring. b These points are added for an affirmative response or subtracted for a negative response if this item is applicable to the test method used. If this item is not applicable, points
are neither added nor subtracted.

Appendix A Procedures for Determining Individual Test Report Quality Ratings
A-6
Table A-1. Test Report Quality Rating Tool (Cont.)
Supporting Documentation Provided
Points Awarded if Documentation is
Present Regulatory Agency Review
Prorated Documentation
Points
Points Added with Affirmative
Response
Points Subtracted with Negative
Responsea
Is a full description of the process and the unit being tested (including installed controls) provided?
3 Is a full description of the process and the unit being tested (including installed controls) provided?
3 1 3
Has a detailed discussion of source operating conditions, air pollution control device operations and the representativeness of measurements made during the test been provided?
6
Has a detailed discussion of source operating conditions, air pollution control device operations and the representativeness of measurements made during the test been provided?
6 2 6
Were the operating parameters for the tested process unit and associated controls described and reported?
60
Is there documentation that the required process monitors have been calibrated and that the calibration is acceptable?
12 4 12
Was the process capacity documented? 12 4 12
Was the process operating within an appropriate range for the test program objectives?
12 4 12
Were process data collected concurrent with testing? 12 4 12
Were data included in the report for all parameters for which limits will be set?
12 4 12
a This column shows the points subtracted with a negative response if points were awarded for this item by the initial scoring. b These points are added for an affirmative response or subtracted for a negative response if this item is applicable to the test method used. If this item is not applicable, points
are neither added nor subtracted.

Appendix A Procedures for Determining Individual Test Report Quality Ratings
A-7
Table A-1. Test Report Quality Rating Tool (Cont.)
Supporting Documentation Provided
Points Awarded if Documentation is
Present Regulatory Agency Review
Prorated Documentation
Points
Points Added with Affirmative
Response
Points Subtracted with Negative
Responsea
Is there an assessment of the validity, representativeness, achievement of data quality objectives (DQO) and usability of the data?
9
Did the report include descriptions of the representativeness of the facility operations, control device operation, and the measurements of the target pollutants, and were any changes from published test methods or process and control device monitoring protocols identified?
9 3 9
Have field notes addressing issues that may influence data quality been provided?
0 Were all sampling issues handled such that data quality was not adversely affected?
0 0 111
Manual Test Method Questions Have the following been included in the report: dry gas meter (DGM) calibrations, pitot tube and nozzle inspections?
54 Was the DGM pre-test calibration within the criteria specified by the test method?
9 3 9
Was the DGM post-test calibration within the criteria specified by the test method?
9 3 9
Were thermocouple calibrations within method criteria? 9 3 9
Was the pitot tube inspection acceptable? 9 3 9
Were nozzle inspections acceptable? 9 3 9
Were flow meter calibrations acceptable? 9 3 9
a This column shows the points subtracted with a negative response if points were awarded for this item by the initial scoring. b These points are added for an affirmative response or subtracted for a negative response if this item is applicable to the test method used. If this item is not applicable, points
are neither added nor subtracted.

Appendix A Procedures for Determining Individual Test Report Quality Ratings
A-8
Table A-1. Test Report Quality Rating Tool (Cont.)
Supporting Documentation Provided
Points Awarded if Documentation is
Present Regulatory Agency Review
Prorated Documentation
Points
Points Added with Affirmative
Response
Points Subtracted with Negative
Responsea
Was the Method 1 sample point evaluation included in the report? 12 Were the appropriate number and
location of sampling points used? 12 4 12
Were the cyclonic flow checks included in the report? 12
Did the cyclonic flow evaluation show the presence of an acceptable average gas flow angle?
12 4 12
Were the raw sampling data and test sheets included in the report? 126 Were all data required by the method
recorded? 12 4 24
Were the required leak checks performed and did they meet method requirements?
30 10 180
Was the required minimum sample volume collected? 18 6 18
Did probe, filter and impinger exit temperatures meet method criteria (as applicable)?
24 8 24
Did isokinetic sampling rates meet method criteria? 24 8b 120b
Was the sampling time at each point greater than 2 minutes and the same for each point?
18 6 18
Did the report include a description and flow diagram of the recovery procedures?
30 Was the recovery process consistent with the method? 6 2 6
Were all required blanks collected in the field? 6 2b 6b
a This column shows the points subtracted with a negative response if points were awarded for this item by the initial scoring. b These points are added for an affirmative response or subtracted for a negative response if this item is applicable to the test method used. If this item is not applicable, points
are neither added nor subtracted.

Appendix A Procedures for Determining Individual Test Report Quality Ratings
A-9
Table A-1. Test Report Quality Rating Tool (Cont.)
Supporting Documentation Provided
Points Awarded if Documentation is
Present Regulatory Agency Review
Prorated Documentation
Points
Points Added with Affirmative
Response
Points Subtracted with Negative
Responsea
Where performed, were blank corrections handled per method requirements?
9 3b 9b
Were sample volumes clearly marked on the jar or measured and recorded? 9 3 9
Was the laboratory certified/accredited to perform these analyses?
2 Was the laboratory certified/accredited to perform these analyses?
2 0 2 (only if points were awarded in the initial
ERT scoring)
Did the report include a complete laboratory report and flow diagram of sample analysis?
132 Did the laboratory note the sample volume upon receipt? 9 3 9
If sample loss occurred, was the compensation method used documented and approved for the method?
9 0 120
Were the physical characteristics of the samples (e.g., color, volume, integrity, pH, temperature) recorded and consistent with the method?
9 3 9
Were sample hold times within method requirements? 9 3b 9b
Does the laboratory report document the analytical procedures and techniques?
6 2 6
Were all laboratory QA requirements documented? 15 5 15
a This column shows the points subtracted with a negative response if points were awarded for this item by the initial scoring. b These points are added for an affirmative response or subtracted for a negative response if this item is applicable to the test method used. If this item is not applicable, points
are neither added nor subtracted.
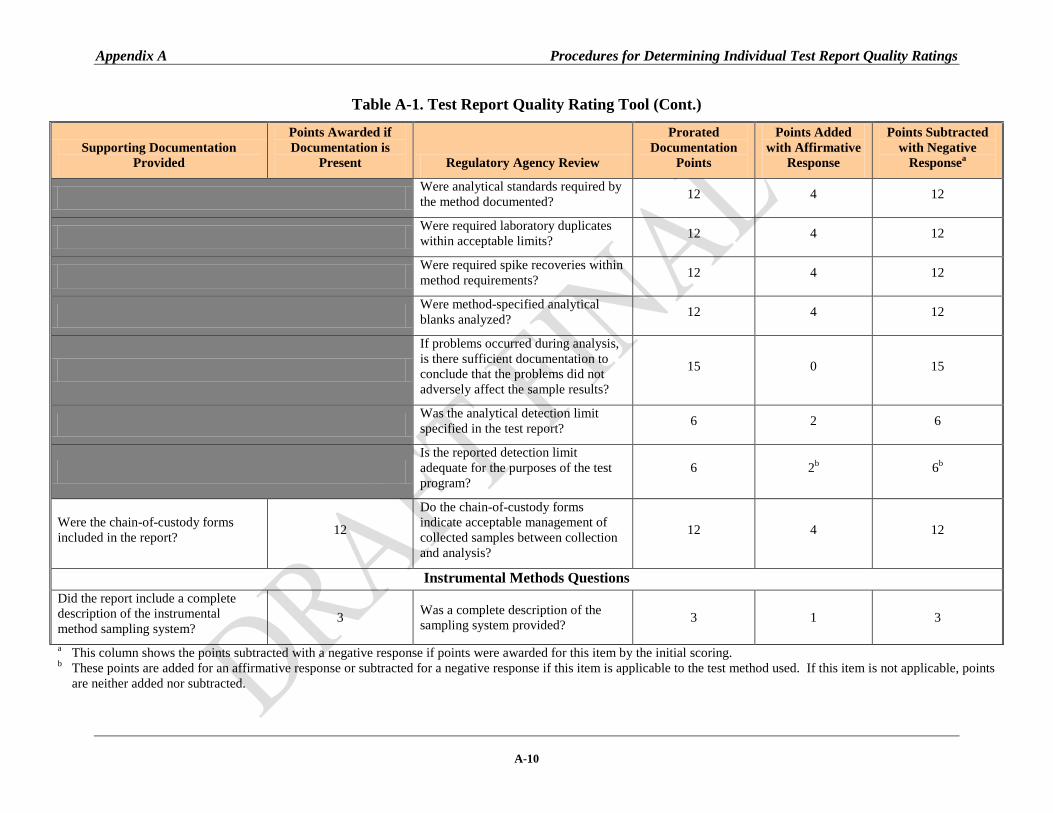
Appendix A Procedures for Determining Individual Test Report Quality Ratings
A-10
Table A-1. Test Report Quality Rating Tool (Cont.)
Supporting Documentation Provided
Points Awarded if Documentation is
Present Regulatory Agency Review
Prorated Documentation
Points
Points Added with Affirmative
Response
Points Subtracted with Negative
Responsea
Were analytical standards required by the method documented? 12 4 12
Were required laboratory duplicates within acceptable limits? 12 4 12
Were required spike recoveries within method requirements? 12 4 12
Were method-specified analytical blanks analyzed? 12 4 12
If problems occurred during analysis, is there sufficient documentation to conclude that the problems did not adversely affect the sample results?
15 0 15
Was the analytical detection limit specified in the test report? 6 2 6
Is the reported detection limit adequate for the purposes of the test program?
6 2b 6b
Were the chain-of-custody forms included in the report? 12
Do the chain-of-custody forms indicate acceptable management of collected samples between collection and analysis?
12 4 12
Instrumental Methods Questions Did the report include a complete description of the instrumental method sampling system?
3 Was a complete description of the sampling system provided? 3 1 3
a This column shows the points subtracted with a negative response if points were awarded for this item by the initial scoring. b These points are added for an affirmative response or subtracted for a negative response if this item is applicable to the test method used. If this item is not applicable, points
are neither added nor subtracted.

Appendix A Procedures for Determining Individual Test Report Quality Ratings
A-11
Table A-1. Test Report Quality Rating Tool (Cont.)
Supporting Documentation Provided
Points Awarded if Documentation is
Present Regulatory Agency Review
Prorated Documentation
Points
Points Added with Affirmative
Response
Points Subtracted with Negative
Responsea
Did the report include calibration gas certifications? 27 Were calibration standards used prior
to the end of the expiration date? 12 4 12
Did calibration standards meet method criteria? 15 5 15
Did the report include interference tests? 9 Did interference checks meet method
requirements? 9 3b 9b
Were the response time tests included in the report? 12 Was a response time test performed? 12 4 12
Were the calibration error tests included in the report? 12 Did calibration error tests meet
method requirements? 12 4 12
Did the report include drift tests? 9 Were drift tests performed after each run and did they meet method requirements?
9 3 9
Did the report include system bias tests? 24 Did system bias check results meet
method requirements? 24 8 120
Were the converter efficiency tests included in the report? 12 Was the NOX converter test
acceptable? 12 4b 12b
Did the report include stratification checks? 15 Was a stratification assessment
performed? 15 5 15
Did the report include the raw data for the instrumental method? 54 Was the duration of each sample run
within method criteria? 9 3 9
Was an appropriate traverse performed during sample collection, or was the probe placed at an appropriate center point (if allowed by the method)?
12 4 12
a This column shows the points subtracted with a negative response if points were awarded for this item by the initial scoring. b These points are added for an affirmative response or subtracted for a negative response if this item is applicable to the test method used. If this item is not applicable, points
are neither added nor subtracted.

Appendix A Procedures for Determining Individual Test Report Quality Ratings
A-12
Table A-1. Test Report Quality Rating Tool (Cont.)
Supporting Documentation Provided
Points Awarded if Documentation is
Present Regulatory Agency Review
Prorated Documentation
Points
Points Added with Affirmative
Response
Points Subtracted with Negative
Responsea
Were sample times at each point uniform and did they meet the method requirements?
9 3 9
Were sample lines heated sufficiently to prevent potential adverse data quality issues?
12 4 12
Were all data required by the method recorded? 12 4 12
a This column shows the points subtracted with a negative response if points were awarded for this item by the initial scoring. b These points are added for an affirmative response or subtracted for a negative response if this item is applicable to the test method used. If this item is not applicable, points
are neither added nor subtracted.

Appendix A Procedures for Determining Individual Test Report Quality Ratings
A-13
4.0 Rationale for Evaluation Criteria
The rationale for including the specific information considered in calculating the ITR are provided below. 1. Completeness Review – The documentation requirements specified in the “Supporting
Documentation Provided” are used to assess certain aspects of the test program impacting the quality (e.g., accuracy, precision, reliability, representativeness, consistency with published methods, etc.) of the test data. A complete test report should include: information on the location and contacts for the facility, information on the contacts for the test team, information describing the tested process including process and control device operations relevant for characterizing emissions, information describing the characteristics of the test location(s), a schematic or drawing of the test location(s), description of the published test method(s) used, descriptions of the changes that were necessary to conduct the test, identification of any relevant applicable requirements for which the test will be used, and the identification of any audit and data quality indicators used for verifying the reliability of the test method(s) performed. Documentation of the conduct of the test methods, deviations from required test methods and laboratory reports describing the analysis of the test samples are valuable as indicators of the precision and accuracy of emissions data. The conditions during the time of sampling and the operating parameters for the process and any air pollution controls are indicative of the reliability and representativeness of the emissions measured during the test period. If the various pieces of information listed here are not provided, conformance to the test method cannot be determined and the precision and accuracy of the data cannot be verified.
2. Calibration Reports – Calibration reports provide documentation that equipment has been
inspected, properly maintained and is operating correctly during testing. If calibration data are not present, or if the calibration data have expired, the results of testing cannot be considered accurate. Calibration errors will lead to inaccurate measurements and therefore inaccurate emissions rates.
• Manual Test Methods – Equipment used to measure flow rate and temperature must be
properly inspected and calibrated to ensure accurate results. Flow rate and temperature are important factors in source testing and have a direct impact on the calculation of emissions rates. Faulty or mis-calibrated equipment can lead to inaccurate readings and inaccurate results.
• Instrumental Test Methods – Similar to the manual methods, this information is used to determine if analyzers are operating correctly for each test. This data includes pre-test calibration checks, bias determinations for each test run, and equipment operational checks. If the information in this section is missing, the data contained in the test report cannot be considered accurate.
3. Raw Data Reports
• Manual Test Methods – The documentation in this section of the raw data report verifies the information reported in the test program and confirms that field QA activities have

Appendix A Procedures for Determining Individual Test Report Quality Ratings
A-14
been performed. This section provides documentation of stack characteristics, exhaust gas conditions and sample point evaluation, all of which are important for properly characterizing emissions. A complete laboratory report, including recovery procedures and chain-of-custody forms, provides a good indication of how well the samples were recovered, handled and analyzed.
• Instrumental Test Methods – With the exception of raw data, this information is required by the reference methods and is used to verify that operating limits for instrumentation are within acceptable ranges. Stratification checks are now required by the EPA reference methods in some instances and this documentation verifies that sampling procedures were appropriate for the exhaust conditions at the time of the test.
• Process and Facility Operation – Process and operating data are key components in demonstrating that the facility is operating within normal conditions and that the data collected are representative of normal operation. This information also allows for the calculation of production-based emissions factors. Documentation of control devices and their monitoring parameters verifies that devices are working properly, provides information that can later be used as indicators of continued performance and assures that testing was conducted under typical control conditions.
4. QA Review – The evaluation criteria listed below are based upon the QA requirements of the
EPA’s reference methods, New Source Performance Standards (NSPS) and National Emission Standards for Hazardous Air Pollutants (NESHAP).
• Manual Test Method QA – Calibration criteria evaluated in this review are specified in
the reference methods and address field measurement equipment calibrations and inspections. These criteria establish the minimum operating limits for measurement equipment that provide confidence in the accuracy and precision of the test results. This information addresses the critical elements of the test equipment that have a direct impact on measurement and subsequent calculation of sample volumes, effluent flow rates and pollutant concentrations.
• Laboratory QA – Laboratory information evaluated in this review is directly related to the accuracy of the laboratory analysis of pollutant samples collected in the field. Listed items have a direct impact on the analysis of the samples and the reliability of the test data. For example, sample integrity during transport is assessed by comparing sample volumes to the values recorded prior to shipping, which may indicate potential loss of sample media. Another example is analytical detection limits, which must be sensitive enough to measure the pollutant of interest at concentrations appropriate for the test plan.
• Instrumental Test Method QA – The QA checks for instrumental test methods are specified in the reference methods. These checks are designed to demonstrate that the sampling system and analyzers are:
i. Capable of meeting minimum acceptance criteria for acquiring a representative
effluent sample, and ii. Operating in a stable environment.
This information verifies that the analytical accuracy and precision of the measurement results are acceptable for regulatory programs.

Appendix A Procedures for Determining Individual Test Report Quality Ratings
A-15
• Process Data QA – The evaluation criteria listed in this review are based upon the instrumental test method evaluations for data accuracy and representativeness. Process disruptions may have a negative impact on the accuracy of the data. Calibration information establishes the reliability and accuracy of the values used to calculate emissions rates.
• Other QA Indicators – Among other factors that will increase the assurance of high-quality data from a source emissions test is the participation of qualified individuals during the field testing. A QI (e.g., someone recognized by the Source Evaluation Society (SES) or meeting the criteria outlined in ASTM standard D7036-12) is someone who has demonstrated a high level of knowledge and ability consistent with an experienced field test team leader responsible for emissions test planning, preparation, conduct and reporting. Another factor is the presence of a qualified observer during the field emissions testing. Such an observer may be an independent technical expert or a representative of the state, local or federal agency familiar with source emissions testing and who was on site to monitor progress during the test.

APPENDIX B
PROCEDURES FOR HANDLING TEST DATA THAT ARE BELOW THE METHOD DETECTION LIMITS

Appendix B Procedures for Handling Test Data That are Below the Method Detection Limits
B-1
1.0 Introduction
In some cases, the result of a process emissions test is not an emissions rate, but a determination that the target pollutant was not present at or above the minimum detection limit of the test method (MDL). The EPA defines MDL as the minimum concentration of a substance that can be measured and reported with a given level of confidence that the analyte concentration is greater than zero. The MDL is determined from an analysis of a sample in a given matrix containing the analyte. For purposes of emissions factor development, that level of confidence is 99 percent. Stated another way, the MDL is the smallest amount of a substance that an analytical method can reliably distinguish from zero, at a specified confidence level, from the signal produced by a blank sample.
It is important to understand that the MDL is a statistical parameter and not a chemical one. For EPA test methods (e.g., Method 5 – Particulate Matter) where a single analytical technique is specified, the MDL will be the same for all source tests. However, the MDL can vary from substance to substance and from measurement process to measurement process in cases where the test method (e.g., Method 29 – Metals Emissions from Stationary Sources) allows for alternative analytical techniques. In these cases, variability is introduced into MDLs by the analysts conducting the measurements, the equipment and chemicals used in the measurements and the Quality Assurance/Quality Control (QA/QC) procedures used. A separate MDL should be generated for each test program. After MDLs have been developed, the results of the testing can be compared. Results that are less than the MDL are referred to as below the MDL (BDL). 2.0 Description of Procedures
We have developed specific procedures that are to be applied when some or all of the data included in the candidate data set selected for use in developing emissions factors are BDL. Note that the procedures in this appendix are to be applied prior to conducting the data outlier tests described in Appendix C so that appropriate values can be assigned for BDL data when they are used in outlier analyses.
It is not unusual for environmental data to contain some values that are below the detection limits that can be achieved by current analytical techniques. Because such values are expected, data users have developed calculation techniques to account for these BDL values that exist but are difficult to quantify with the accuracy typically associated with values found above MDLs. Generally, these calculation techniques recognize that small and large sample sizes do not warrant rigorous mathematical approaches to provide a numerical value that replaces a value found to be BDL. On the other hand, medium sample sizes warrant mathematical approaches that provide numerical values associated with a maximum likelihood estimator (MLE), a value found via calculation to be between ½ the MDL and the MDL.
These approaches work well for programs managed by other agency offices tasked with establishing regulatory emissions limits and determining compliance for specific individual facilities in narrowly-defined source categories. However, such rigor is overly complicated for the WebFIRE emissions factor development program because emissions factors are, by design,

Appendix B Procedures for Handling Test Data That are Below the Method Detection Limits
B-2
representative of generic facilities in broadly-defined source categories. As a result, the procedures adopted for handling BDL data in the derivation of emissions factors are more straightforward and are based upon two general principles. First, as emissions test values generally represent the average of three test runs, a data set containing more than 10 test values is based upon more than 30 individual test runs. According to the central limit theorem, such a data set is important because as one obtains 30 or more individual samples (i.e., test runs), the distribution of those samples approaches that of a normal distribution whose statistical characteristics are obtained readily. Second, the use of data that were measured above the MDL is preferred over the use of BDL data in cases where an adequate amount of data above the MDL are available. This generally reduces the uncertainty associated with emissions factors derived, in part, from data that are BDL.
In understanding the recommended BDL data procedures, note that a run refers to the net period of time during which an emissions sample is collected, as well as to the amount of pollutant emitted during that time period. Likewise, a test refers to the net period of time over which separate runs, typically three, are conducted, as well as to the average amount of pollutant emitted over the test period. When a test produces BDL values for all runs, the average emissions test value calculated from those run data will be flagged in the ERT as being BDL.
In most cases, the emissions test data contained in the ERT are used by sources to
demonstrate compliance with regulatory limits. Although we acknowledge that varying approaches are used by analytical laboratories and state regulatory agencies in addressing BDL data for compliance assessments, the EPA’s preferred approach is to report the BDL data as “real” values and to flag the data appropriately in the ERT. In cases where the MDL value is not reported by the source in the ERT, WebFIRE will establish a value for the MDL by using the BDL value as the MDL value.
For purposes of emissions factors development in WebFIRE, BDL values flagged in ERT
will be handled as follows:
1. When the candidate data set contains only BDL test values, WebFIRE will return the code “BDL” and identify the range of MDL values from low to high that are associated with the test method used to determine each BDL value.
2. When the candidate data set contains a mix of values that are above and below the MDL, WebFIRE will replace the test values identified as BDL with values equivalent to ½ their MDL. If a replacement value exceeds the highest data value that was measured above the MDL, WebFIRE will not include that replacement value in calculating an average emissions factor.
The basic guidance for handling BDL test data in the ERT or evaluating BDL data in
WebFIRE for use in emissions factor development is summarized below in Table B-1.

Appendix B Procedures for Handling Test Data That are Below the Method Detection Limits
B-3
Table B-1. Summary of WebFIRE Procedures for Handling BDL Test Data
Types of Dataa Basis for Emissions Factors
All candidate data are BDL
An emissions factor is not determined; the emissions factor is reported as “BDL” and the range of MDL values from low to high will be provided in a comment field.
Candidate data contains BDL and data that are above the MDL
The emissions factor average is calculated using the test values and ½ the MDL for all BDL data, provided that ½ the MDL is equal to or less than the data set’s highest test value. When ½ the MDL is greater than the highest test value, that BDL value is excluded from the emissions factor calculation.
a In cases where the MDL value is not reported by the source in the ERT, WebFIRE will establish a value for the MDL by using the BDL value as the MDL value.
The following examples illustrate WebFIRE’s procedures for handling data that are BDL when calculating emissions factors. Example 1
Table B-2 shows a candidate data set selected by a WebFIRE user in which all test values are BDL. If, as shown in Table B-2, the candidate data for use in calculating an emissions factor contains all BDL values, WebFIRE will not determine an average emissions factor value or a factor quality rating (see Appendix D). Rather, WebFIRE will return the following information: “BDL” and “the MDL values range from 10 to 88 mg/kg.”
Table B-2. Example Data Set A
Test No. Test Value Test MDL 1 BDL 10 mg/kg 2 BDL 12 mg/kg 3 BDL 70 mg/kg 4 BDL 20 mg/kg 5 BDL 88 mg/kg 6 BDL 38 mg/kg
Example 2
Table B-3 shows a candidate data set that consists of a mix of data that are above the MDL and data that are BDL.

Appendix B Procedures for Handling Test Data That are Below the Method Detection Limits
B-4
Table B-3. Example Data Set B
Test No. Test Value Test MDL 1 19 mg/kg -- 2 16 mg/kg -- 3 BDL 70 mg/kg 4 11 mg/kg -- 5 18 mg/kg -- 6 26 mg/kg -- 7 22 mg/kg -- 8 BDL 20 mg/kg 9 BDL 88 mg/kg
10 BDL 38 mg/kg
Table B-4 shows the calculations applied to the data in Table B-3 to calculate replacement values for the BDL data. For Test No. 9, the replacement value (i.e., ½ the MDL) is 44 mg/kg. Because this value is greater than the highest individual test value in the data set (26 mg/kg from Test No. 6) the replacement value for Test No. 9 would not be included in the subsequent outlier analysis and emissions factor calculations. The same holds true for Test No. 3 where ½ the MDL equals 35 mg/kg, which is greater than 26 mg/kg. Test Nos. 8 and 10 would be retained in the candidate data set since ½ the MDL values of 10 mg/kg and 19 mg/kg are less than the highest individual test value in the data set (26 mg/kg).
In this example, those BDL data whose replacement values are greater than or equal to the highest test value that is above the detection limit are removed. As a result, WebFIRE assigns values to the remaining BDL runs equivalent to ½ their MDL and then calculates the emissions factor for this data set (17.6 mg/kg) by averaging 19, 16, 11, 18, 26, 22, 10 and 19 mg/kg.
Table B-4. Calculations for Example Data Set B
Test No. Test Value Test MDL ½ MDL for BDL Data
½ MDL > Highest Test
Value?
Value for Averaging Analysis
1 19 mg/kg -- -- -- 19 mg/kg 2 16 mg/kg -- -- -- 16 mg/kg 3 BDL 70 mg/kg 35 mg/kg Yes Data Not Used 4 11 mg/kg -- -- -- 11 mg/kg 5 18 mg/kg -- -- -- 18 mg/kg 6 26 mg/kg -- -- -- 26 mg/kg 7 22 mg/kg -- -- -- 22 mg/kg 8 BDL 20 mg/kg 10 mg/kg No 10 mg/kg 9 BDL 88 mg/kg 44 mg/kg Yes Data Not Used
10 BDL 38 mg/kg 19 mg/kg No 19 mg/kg Average 17.6 mg/kg

APPENDIX C
PROCEDURES FOR DETERMINING STATISTICAL OUTLIERS

Appendix C Procedures for Determining Statistical Outliers
C-1
1.0 Introduction
After a candidate data set containing more than three test values has been selected for emissions factor development and the BDL analysis has been performed (see Appendix B), WebFIRE will conduct a set of tests (i.e., the Dixon Q Test or the Rosner Test) to identify values in the candidate data set that are statistical outliers (i.e., a value that does not conform to the statistical pattern established by other values under consideration). These tests are incorporated into the EPA’s WebFIRE (see Section 6.2) and are based on algorithms in ProUCL, an EPA-developed statistical package available to the public free of charge.2 We neither endorse ProUCL or any other statistical package, nor limit our ability to use ProUCL or any other statistical package, as other statistical packages are capable of performing the requisite outlier analysis. Emissions data are usually log-normally distributed; therefore, for the purposes of evaluating outliers for emissions factor development, we assume that all emissions test data values in the candidate data set follow log normal distributions. Thus, we log-transform every test value in the candidate data set prior to conducting outlier tests. 2.0 Description of Procedures
In WebFIRE, the outlier test is applied to the log-transformed values in the candidate data set in an iterative process. Each run of the outlier test identifies whether a low or high value is an outlier, and the test is applied until all outliers have been identified and removed from the candidate data set. However, the data values removed from the candidate data set are not removed from the WebFIRE database because the outlier designation is relative to the population of values selected for the candidate data set (i.e., an outlier in one data set may be an acceptable value in a different data set, especially when differing data sets are being compared using a t-test).
The general approach to use for determining outliers is shown in Figure C-1. If the candidate data set contains less than three test values, a statistical outlier test is not performed by WebFIRE because statistical analyses cannot determine outliers from such a small sample size. Moreover, with just two values it is impossible to tell which one might be the outlier. If there are three to 24 test values in the candidate data set, WebFIRE applies the Dixon test to determine outliers. If there are 25 or more test values for analysis, the Rosner test is used to identify outliers. Consistent with ProUCL, all outlier tests in WebFIRE are performed using the 95% confidence level using a 1-tailed statistical test, meaning that we are willing to accept a 5 percent risk of rejecting a valid observation.
2 ProUCL is described and can be downloaded from the following Internet address: http://www.epa.gov/osp/hstl/tsc/software.htm.

Appendix C Procedures for Determining Statistical Outliers
C-2
FIGURE C-1. PROCEDURES TO IDENTIFY DATA OUTLIERS IN A CANDIDATE DATA SET

Appendix C Procedures for Determining Statistical Outliers
C-3
If an outlier is detected by WebFIRE, it is flagged in the data set and the number of valid test data values remaining in the candidate data set is determined. The Rosner test or the Dixon test, as determined by the number of test data values, is performed again. Outliers are removed from the candidate data set and the appropriate outlier test is performed again until the candidate data set does not contain outliers. When the data set does not contain outliers, WebFIRE calculates the average of the remaining test values (not the log-transformed values) and uses that average as the emissions factor value.

APPENDIX D
EMISSIONS FACTOR DEVELOPMENT AND DATA QUALITY CHARACTERIZATION PROCEDURES

Appendix D Emissions Factor Development and Data Quality Characterization Procedures
D-1
1.0 Introduction
The procedures used in WebFIRE to determine which individual test data values (i.e., average values derived from multiple test runs) to use in deriving an emissions factor are based upon two premises: (1) higher-quality data are preferred over lower-quality data, and (2) more test data values are preferred over fewer test data values. These concepts are combined with simple statistical procedures to derive the approach used by WebFIRE in assigning a quality rating to the derived emissions factor. This quality rating indicates how well the derived factor represents the average of the emissions from a particular source category. These procedures are described in detail in the following sections. 2.0 Terms and Definitions
As a prelude to presenting these procedures, it is important to explain and define the parameters used for the emissions factor calculations and data quality characterizations:
1. Individual Test Rating (ITR) – The ITR value is the quality indicator assigned to individual source test reports by the ERT. This value is based upon the level of documentation available in the test report, the use and conformance with established the EPA reference test method (or other test methods with comparable precision and accuracy) and the operation of the source and associated emissions controls at known and representative conditions. The ITR ranges from a high of 100 to a low of 0. The ERT procedures for calculating the ITR are presented in Appendix A.
2. Composite Test Rating (CTR) – The CTR is a weighted-average quality indicator for
groups of test reports. An inverse square weighting of the ITR values for the test reports is used in calculating the CTR. As with the ITR, the CTR ranges from a high of 100 to a low of 0.
3. Factor Quality Index (FQI) – The FQI is a numerical indicator representing the derived
emissions factors ability to estimate emissions for the entire national population. The FQI is dependent upon both the CTR and the number of test values used to develop the emissions factor. The FQI is analogous to the standard error of the mean (σM) in statistical calculations. In statistical calculations, σM provides an indication of the confidence associated with an estimate of the mean of a population when a given number of samples are obtained from the population. The σM is calculated from the standard deviation of the samples (or other estimate of the populations variability) divided by the square root of the number of samples. In the FQI, the parameter 100/CTR simulates the function of the standard deviation in that measurements with great variability (due to variations between sources in the population, variations with individual sources, precision and accuracy of the methods used for measurement, and other factors affecting variations in the measured values) are larger in value than measurements with less variability. In the FQI, the minimum value is associated with emissions tests that are judged to have the greatest precision and accuracy of sources operating at representative conditions. This is the appropriate data set selection for use in emissions factor derivation as increases in the σM and increases in the number of samples used to estimate the mean of the population

Appendix D Emissions Factor Development and Data Quality Characterization Procedures
D-2
serve to reduce the value of the FQI in proportion to the estimated reliability of the estimate of the mean. In addition, like σM, equal values of FQI provide comparable reliability in the estimate of the population mean irrespective of differences in the CTR and the number of samples used (i.e., test values) for estimating the population mean.
4. Emissions factor quality indicator – There are three quality indicators used to characterize
the calculated emissions factor:
• Highly representative is assigned to emissions factors having the lowest FQI rating.
• Moderately representative is assigned to emissions factors having an intermediate FQI rating.
• Poorly representative is assigned to emissions factors having the highest FQI rating.
5. Boundary criteria – Boundary criteria refers to the specific conditions that determine
which quality rating (i.e., poorly representative, moderately representative or highly representative) is assigned to an emissions factor. Based upon our experience with developing emissions factors, we determined that, for source categories containing more than 15 sources, an emissions factor derived from three tests with a CTR of 100 (FQI = 0.5774) qualifies for a moderately-representative rating. Likewise, an emissions factor derived from more than 11 tests with a CTR of 100 (FQI = 0.3015) qualifies for a highly-representative rating. These criteria are designed to allow for the development of highly-representative emissions factors without the burden of conducting an inordinate amount of emissions tests. For source categories containing 15 or fewer sources, it is appropriate to allow fewer tests to attain a specific quality rating. An emissions factor developed from more than one test with a CTR of 100 (FQI = 1.000) qualifies for a moderately-representative rating and more than three tests with a CTR of 100 (FQI = 0.5774) qualifies the emissions factor for a highly-representative rating. For both source category population sizes, degradation of the CTR requires an increase in the number of tests to compensate for the decrease in the average test quality to achieve the same FQI. Table D-1 provides the boundary line equations for the two population sizes and Figures D-1 and D-2 provide the graphical relationship between the CTRs and the number of tests required for the boundary conditions, respectively.
Table D-1. FQI and Boundary Line Equations
If the source category
contains . . .
Then use these boundary line equations . . . Poorly to moderately
representative Moderately to highly
representative More than 15 sources
FQI = 0.5774 N = 30,000 * CTR-2
FQI = 0.3015 N = 110,000 * CTR-2
15 or fewer sources
FQI = 1 N = 10,000 * CTR-2
FQI = 0.5774 N = 30,000 * CTR-2

Appendix D Emissions Factor Development and Data Quality Characterization Procedures
D-3
FIGURE D-1. EMISSIONS FACTOR REPRESENTATIVENESS AREAS FOR SOURCE CATEGORIES CONTAINING MORE THAN 15 SOURCES

Appendix D Emissions Factor Development and Data Quality Characterization Procedures
D-4
FIGURE D-2. EMISSIONS FACTOR REPRESENTATIVENESS AREAS FOR SOURCE CATEGORIES CONTAINING 15 OR FEWER SOURCES
3.0 Procedures
The following steps summarize the specific calculation and data quality characterization procedures used in WebFIRE to calculate a new or revise an existing emissions factor from a candidate data set that has been subjected to the WebFIRE BDL and outlier analyses (See Appendices B and C, respectively). The steps described in this section are performed when deriving a user-defined emissions factor.
• Step 1 – WebFIRE arranges the individual test data values being considered in descending order by: (1) the ITR and (2) the test data value.
• Step 2 – Beginning with the second individual test data value and continuing sequentially in order, WebFIRE calculates the CTR using the following equation:

Appendix D Emissions Factor Development and Data Quality Characterization Procedures
D-5
5.0
1
12 −
∑=
=
N
n
i ITR
nCTRi
Where:
CTR = Composite Test Rating,
ITR = Individual Test Rating (assigned by ERT), and
N = Number of tests with ITRs equal to or greater in value as those included in the candidate data set.
It should be noted that a CTR is calculated for each combination of individual test values in the data set potentially used to derive an emissions factor. For example, using a data set consisting of 10 test values, WebFIRE would calculate 9 CTRs, beginning with the first two data points, then the first three data points, and so forth until a CTR is calculated for all 10 data values. • Step 3 – For each calculated CTR, WebFIRE calculates the FQI using the following
equation:
5.0
100NCTR
FQI×
=
Where:
FQI = Factor Quality Index, CTR = Composite Test Rating associated with the data set selected for deriving
the emissions factor, and N = Number of tests with ITRs equal to or greater in value as those included
in the candidate data set.
• Step 4 – WebFIRE compares the calculated FQI with the FQI for the previous ITR grouping. If the FQI associated with the larger grouping (i.e., more data values) is less than the FQI with fewer data values, then WebFIRE proceeds back to Step 2 to perform the next sequence in the calculations. If the FQI associated with the larger grouping is greater than the preceding FQI, then WebFIRE does not include the test data value responsible for the increase in the FQI in calculating the emissions factor and excludes the remaining data (with lower ITRs) from consideration.
• Step 5 – WebFIRE calculates the emissions factor using all test data values that were included in calculating the lowest FQI. This includes all test data values with higher ITRs than the ITR value that resulted in an increased FQI value.

Appendix D Emissions Factor Development and Data Quality Characterization Procedures
D-6
• Step 6 – WebFIRE determines if the SCC corresponding to the candidate data set selected by the user contains 15 or fewer sources. Table D-2 lists the SCCs that we expect to contain 15 or fewer sources. Appendix F contains the descriptions for the SCCs shown in Table D-2.
• Step 7 – WebFIRE compares the FQI for the test values used to calculate the
emissions factor with the corresponding boundary criteria for assigning one of the three emissions factor quality ratings. Different boundary criteria are used for source categories containing 15 or fewer sources and for source categories containing greater than 15 sources.
Table D-2. SCCs Expected to Contain 15 or Fewer Sources
SCCs That Contain 15 or Fewer Sourcesa 101011 301157 304009 316160 101019 301158 304010 360001 102003 301167 304040 390003 102011 301169 304049 401004 102016 301176 304051 402028 102017 301181 305004 501002 201003 301190 305013 625400 201013 301195 305022 631110 201900 301210 305024 631250 203009 301211 305026 631310 204002 301252 305029 631340 2810040 301253 305032 641300 301017 301254 305033 641301 301019 301301 305034 641302 301025 301302 305035 641310 301028 301303 305036 641320 301029 301304 305038 644200 301036 301305 305042 644500 301038 301401 305044 645200 301039 301402 305045 645210 301041 301403 305046 646100 301051 302003 305089 646150 301091 302012 305090 646200 301100 302022 305092 646300 301111 302028 314010 646320 301112 302039 315010 646330 301113 302042 315027 648200

Appendix D Emissions Factor Development and Data Quality Characterization Procedures
D-7
Table D-2. SCCs Expected to Contain 15 or Fewer Sources (Cont.)
SCCs That Contain 15 or Fewer Sourcesa 301114 303004 315031 648210 301121 303005 315040 648220 301124 303006 316030 649200 301126 303007 316040 651100 301133 303011 316050 651300 301137 303012 316060 651350 301140 303030 316120 651400 301152 303031 316130
685100 301153 303040 316140 301156 304002 316150
a These 6-digit (point) or 7-digit (nonpoint) SCCs represent the source categories expected to have fewer than 15 sources. All SCCs starting with these code sequences are included. Example 1
Table D-3 below contains an example set of 35 individual test data values selected to develop an emissions factor for SCC 303010. The table shows the test data values, their corresponding ITR and N values, and the calculated CTR and FQI values. The table also indicates whether or not the test data value should be used to calculate an emissions factor and the representativeness of the resulting emissions factor (not shown in the table).
Table D-3. Individual Test Data and Various Characteristics
Individual
Test Value ITR CTR N FQI
Use for EF
Average? EF
Representativeness 0.0108 98 98.00 1 1.0204 Yes Poorly 0.1100 98 98.00 2 0.7215 Yes Poorly 0.0917 92 95.87 3 0.6022 Yes Poorly 0.0212 92 94.86 4 0.5271 Yes Moderately 0.0339 91 94.05 5 0.4755 Yes Moderately 0.0027 91 93.52 6 0.4365 Yes Moderately 0.0563 89 92.83 7 0.4072 Yes Moderately 0.0165 89 92.32 8 0.3829 Yes Moderately 0.0158 88 91.81 9 0.3631 Yes Moderately 0.0044 88 91.41 10 0.3460 Yes Moderately 0.0675 88 91.08 11 0.3310 Yes Moderately 0.0043 88 90.81 12 0.3179 Yes Moderately 0.0449 74 89.10 13 0.3113 Yes Moderately 0.0203 73 87.58 14 0.3052 Yes Moderately

Appendix D Emissions Factor Development and Data Quality Characterization Procedures
D-8
Table D-3. Individual Test Data and Various Characteristics (Cont.)
Individual Test
Value ITR CTR N FQI
Use for EF
Average? EF
Representativeness 0.0603 70 85.97 15 0.3003 Yes Highly 0.0425 70 84.64 16 0.2954 Yes Highly 0.0130 70 83.51 17 0.2904 Yes Highly 0.1440 69 82.45 18 0.2859 Yes Highly 0.0177 68 81.45 19 0.2817 Yes Highly 0.0317 68 80.58 20 0.2775 Yes Highly 0.0052 68 79.82 21 0.2734 Yes Highly 0.1350 68 79.14 22 0.2694 Yes Highly 0.0006 60 77.90 23 0.2677 Yes Highly 0.0023 45 74.85 24 0.2727 No Not applicable 0.0724 45 72.33 25 0.2765 No Not applicable 0.0960 44 70.08 26 0.2799 No Not applicable 0.0538 40 67.54 27 0.2850 No Not applicable 0.0170 38 65.07 28 0.2904 No Not applicable 0.0132 35 62.48 29 0.2972 No Not applicable 0.0124 34 60.14 30 0.3036 No Not applicable 0.0029 30 57.41 31 0.3128 No Not applicable 0.0018 30 55.16 32 0.3205 No Not applicable 0.0083 30 53.28 33 0.3268 No Not applicable 0.0009 30 51.66 34 0.3319 No Not applicable 0.0034 30 50.27 35 0.3362 No Not applicable
Figure D-3 shows a plot of the CTR and N data in Table D-3 and the boundaries created
by the line equations. In developing the emissions factor for the example data set, the first 23 values in Table D-3 are included in the emissions factor calculation because the FQI increases for the first time between the 23rd and 24th pair. Using the first 23 values yields an emissions factor of 0.0413 with a quality rating of “highly representative.”

Appendix D Emissions Factor Development and Data Quality Characterization Procedures
D-9
FIGURE D-3. PLOT OF CTR AND N DATA FROM TABLE D-3
Example 2
Table D-4 contains another example set of individual test data values selected for use in developing an emissions factor for SCC 303011, which is expected to contain 15 or fewer sources per Table D-1.
Table D-4. Individual Test Data Values Selected for Developing an Emissions
Factor for a Source Category Containing 15 or Fewer Sources
Individual Test Data Value ITR 0.0015 45 0.0004 60 0.0055 30 0.0019 30 0.0012 30 0.0640 30 0.0113 30

Appendix D Emissions Factor Development and Data Quality Characterization Procedures
D-10
Table D-4. Individual Test Data Values Selected for Developing an Emissions
Factor for a Source Category Containing 15 or Fewer Sources (Cont.)
Individual Test Data Value ITR 0.0088 30 0.0029 88 0.0611 92 0.0402 70 0.0299 74 0.0375 89 0.0118 68 0.0072 99
Table D-5 shows the same data after the data have been sorted and the N, CTR and FQI
values have been calculated. The table also indicates whether or not the test data value should be used to calculate an emissions factor and the representativeness of the resulting emissions factor.
Table D-5. Individual Test Data and Various Characteristics for a Source Category with 15 or Fewer Sources
Individual
Test Value ITR CTR N FQI
Use for EF
Average? EF
Representativeness 0.0072 99 99.00 1 1.0101 Yes Poorly 0.0611 92 95.31 2 0.7419 Yes Moderately 0.0375 89 93.06 3 0.6204 Yes Moderately 0.0029 88 91.71 4 0.5452 Yes Highly 0.0299 74 87.16 5 0.5131 Yes Highly 0.0402 70 83.42 6 0.4894 Yes Highly 0.0118 68 80.56 7 0.4692 Yes Highly 0.0004 60 76.80 8 0.4603 Yes Highly 0.0015 45 69.75 9 0.4779 No Not applicable 0.0012 30 58.11 10 0.5442 No Not applicable 0.0019 30 51.97 11 0.5801 No Not applicable 0.0088 30 48.12 12 0.6000 No Not applicable 0.0113 30 45.45 13 0.6103 No Not applicable 0.0640 30 43.48 14 0.6147 No Not applicable 0.0055 30 41.97 15 0.6152 No Not applicable

Appendix D Emissions Factor Development and Data Quality Characterization Procedures
D-11
Figure D-4 shows a plot of the CTR and N values shown in Table D-5 and the boundaries created by the line equations. In developing the emissions factor for the example data set, the first 8 values in Table D-5 are included in the emissions factor calculation because the FQI increases for the first time between the 8th and 9th pair. Using the first 8 values yields an emissions factor of 0.0239 with a quality rating of “highly representative.”
FIGURE D-4. PLOT OF SELECTED DATA FROM TABLE D-6
For test data submitted to WebFIRE using ERT, a numerical ITR value will be assigned to the data by ERT prior to incorporation in WebFIRE. For data that were incorporated into WebFIRE prior to the development of ERT (e.g., the underlying data used to develop AP 42 emissions factors), the current subjective, letter-grade quality ratings have been converted to numerical values as follows:
Test Data Letter Grade Equivalent ITR Score
A 80 B 60 C 45 D 30

Appendix D Emissions Factor Development and Data Quality Characterization Procedures
D-12
For example, a previous test rated as a “B” that is part of the candidate data set for emissions factor development would have an ITR value of 60 for use in calculating the CTR. We used this approach because it would be time intensive and prohibitively costly to reevaluate every previous test report and assign it an ITR based on the rating system contained in the ERT.

APPENDIX E
STATISTICAL PROCEDURES FOR DETERMINING VALID DATA COMBINATIONS

Appendix E Statistical Procedures for Determining Valid Data Combinations
E-1
1.0 Introduction As new emissions data are incorporated into WebFIRE, we expect that, periodically, we will need to determine whether a new data set should be combined with an existing data set for a given source type or category. When determining whether data sets should be combined, we will follow the procedures specified in this appendix. These procedures use algorithms in ProUCL, an EPA-developed statistical package that is available to the public free of charge3. In the unlikely event that all of the test values in the new data set are the same value, we will use Microsoft’s Excel® program for our calculations, since ProUCL calculations cannot be performed on data sets consisting of the same value (calculations involving such data yield a zero in the denominator and cause ProUCL to cease running). We neither endorse ProUCL, or Excel®, or any other statistical package, nor limit our ability to use ProUCL, or Excel®, or any other statistical package as other statistical packages are capable of performing the requisite outlier and t-test analysis.
We anticipate these procedures will be applied on a case-by-case basis, most likely on
data that are expected to be from the same type of emissions units, with similar types of emissions controls and under the same type of operational process. For example, a statistical analysis would be performed on source test data for the following processes at a Portland cement plant: a dry-process kiln, a wet-process kiln, a preheater kiln and a preheater/precalciner kiln). Each of the processes employs either an electrostatic precipitator (ESP) or a fabric filter. Emissions from the processes and control type combinations (e.g., a dry-process kiln controlled by an ESP and a wet-process kiln controlled by a fabric filter) would be compared to determine if the data sets should be combined. These procedures would not be applied to source test data from processes or controls that are clearly separate and distinct (e.g., coke oven emissions and electric arc furnace emissions) nor would they be applied to source test data that are clearly representative of the same source type, same fuel or same controls. In cases where it is acceptable to combine the new and existing data, the BDL and outlier calculation procedures found in Appendix B and Appendix C, respectively, are used in the emissions factor development process.
Simple statistical characteristics such as the number of values, the mean and the variance can be used to represent a data set for computational purposes. Comparison of similar characteristics between data sets can determine whether the data sets are from the same population of values. If the data sets are determined to be from the same population of values, the data sets can be combined into a single, combined data set, often referred to as a pool. Pooled values are preferred over individual values because pooled values provide the best estimate of a population’s variance.
2.0 Description of Procedures
The data combination assessment procedures that we will use to determine whether a new data set should be combined with an existing data set are based upon use of the Student’s t-test. 3 ProUCL is described and can be downloaded from the following Internet address: http://www.epa.gov/osp/hstl/tsc/software.htm.

Appendix E Statistical Procedures for Determining Valid Data Combinations
E-2
For this analysis, a two-tailed test is used rather than a one-tailed test. The following steps are used to determine if it is appropriate to combine new data with existing data:
1. Obtain all emissions test data (i.e., the number of values and the numerical values of the data set) used to calculate the existing emissions factor. Include those data values that were previously identified in the emissions factor development for the source type or category as potential outliers. The data should represent emissions test values, not test run values.
2. Prepare a null hypothesis that the data sets are from the same distribution (the
means of the two sets are equal) and an alternative hypotheses that the data sets are not from the same distribution (the means of the two sets are unequal).
3. Conduct a Student’s t-test on the data sets assuming unequal variances. By
assuming an unequal variance, the variance of the data set and the characteristics of equivalency do not need to be determined. Calculate the absolute value of the Student’s t-test statistic.
4. Find tcritical values at the 0.05 significance level for the appropriate number of
degrees of freedom. If the absolute value of the Student’s t-test statistic is greater than the tcritical value, the means are assumed to be unequal (i.e., the data sets should not be combined). If the absolute value of the Student’s t-test yields a value that is less than or equal to the tcritical value, the means are assumed to be equal (i.e., the data sets can be combined).
Two examples illustrating the use of the data combination assessment procedures are shown below. In the first example, ProUCL is used because the test values in the new data set differ, while in the second example, Excel® is used because the test data values in the new data set do not differ.
Example 1
Table E-1presents two data sets: Group A, which is used to calculate the current
emissions factor of 0.0118 pounds of pollutant per ton of fuel combusted, and Group B, which is from a similar source category with similar controls and operated under a similar process.
Table E-1. Emissions Factor Characteristics for Group A and B
Group A
Source Test Data
Group B Source Test
Data 0.0015 0.0029 0.0004 0.0611 0.0055 0.0402

Appendix E Statistical Procedures for Determining Valid Data Combinations
E-3
Table E-1. Emissions Factor Characteristics for Group A and B (Cont.)
Group A Source Test
Data
Group B Source Test
Data 0.0019 0.0299 0.0012 0.0375 0.064 0.0118 0.0113
0.0072 0.0088 Using an alpha of 0.05, these values yield a t-test statistic whose absolute value is 1.401 and a tcritical value of 2.160. Since the absolute value of the t-test statistic is less than the tcritical value, the analysis shows that the means of Group A and Group B are equal. Therefore, the null hypothesis is accepted, meaning that the data sets are from the same distribution; thus their means are the same. Given that the means of Groups A and B are equal, the individual test data sets can be combined and a revised emissions factor could be calculated using the procedures specified in Appendices B through D. If the means had been unequal, the Group A and B individual test data sets would not be combined.
Example 2
Table E-2 presents two data sets: Group C, which is used to calculate the current emissions factor of 0.0015 pounds of pollutant per ton of fuel combusted, and Group D, which is from a similar source category with similar controls and operated under a similar process.
Table E-2. Emissions Factor Characteristics for Group C and D
Group C Source Test
Data
Group D Source Test
Data 0.0005 0.0029 0.0015 0.0029 0.0025 0.0029
As explained earlier in this section, since Group D values do not differ, Microsoft’s Excel® program must be used to calculate t statistics. Using an alpha of 0.05, these values yield a t-test statistic whose absolute value is 2.425 and a tcritical value of 4.303. Since the absolute value of the t-test statistic is less than the tcritical value, the analysis shows that the means of Group A and Group B are equal. Therefore, the null hypothesis is accepted, meaning that the data sets are from the same distribution; thus their means are the same. Given that the means of Groups A and B are equal, the individual test data sets can be combined and a revised emissions factor could be calculated using the procedures specified in Appendices B through D. If the means had been unequal, the Group A and B individual test data sets would not be combined.

APPENDIX F
SOURCE CLASSIFICATION CODES FOR SOURCE CATEGORIES CONTAINING 15 OR FEWER SOURCES

Appendix F Source Classification Codes for Source Categories Containing 15 or Fewer Sources
F-1
Table F-1. Source Classification Codes for Source Categories Containing 15 or Fewer Sources
Data Category SCC L3 SCC L1 Description SCC L2 Description SCC L3 Description
POINT 101011 External Combustion Boilers Electric Generation Bagasse POINT 101019 External Combustion Boilers Electric Generation Coal-based Synfuel POINT 102003 External Combustion Boilers Industrial Lignite POINT 102011 External Combustion Boilers Industrial Bagasse POINT 102016 External Combustion Boilers Industrial Methanol POINT 102017 External Combustion Boilers Industrial Gasoline POINT 201003 Internal Combustion Engines Electric Generation Gasified Coal POINT 201013 Internal Combustion Engines Electric Generation Liquid Waste POINT 201900 Internal Combustion Engines Electric Generation Flares POINT 203009 Internal Combustion Engines Commercial/Institutional Kerosene/Naphtha (Jet Fuel) POINT 204002 Internal Combustion Engines Engine Testing Rocket Engine Testing NONPOINT 2810040 Miscellaneous Area Sources Other Combustion Aircraft/Rocket Engine Firing and Testing POINT 301017 Industrial Processes Chemical Manufacturing Phosphoric Acid: Thermal Process POINT 301019 Industrial Processes Chemical Manufacturing Phthalic Anhydride POINT 301025 Industrial Processes Chemical Manufacturing Cellulosic Fiber Production POINT 301028 Industrial Processes Chemical Manufacturing Normal Superphosphates POINT 301029 Industrial Processes Chemical Manufacturing Triple Superphosphate POINT 301036 Industrial Processes Chemical Manufacturing Chromic Acid Manufacturing POINT 301038 Industrial Processes Chemical Manufacturing Sodium Bicarbonate POINT 301039 Industrial Processes Chemical Manufacturing Hydrogen Cyanide POINT 301041 Industrial Processes Chemical Manufacturing Nitrocellulose POINT 301051 Industrial Processes Chemical Manufacturing Animal Adhesives POINT 301091 Industrial Processes Chemical Manufacturing Acetone/Ketone Production POINT 301100 Industrial Processes Chemical Manufacturing Maleic Anhydride POINT 301111 Industrial Processes Chemical Manufacturing Asbestos Chemical POINT 301112 Industrial Processes Chemical Manufacturing Elemental Phosphorous POINT 301113 Industrial Processes Chemical Manufacturing Boric Acid POINT 301114 Industrial Processes Chemical Manufacturing Potassium Chloride POINT 301121 Industrial Processes Chemical Manufacturing Organic Dyes/Pigments POINT 301124 Industrial Processes Chemical Manufacturing Chloroprene POINT 301126 Industrial Processes Chemical Manufacturing Brominated Organics

Appendix F Source Classification Codes for Source Categories Containing 15 or Fewer Sources
F-2
Table F-1. Source Classification Codes for Source Categories Containing 15 or Fewer Sources (Cont.)
Data Category SCC L3 SCC L1 Description SCC L2 Description SCC L3 Description
POINT 301133 Industrial Processes Chemical Manufacturing Acetic Anhydride POINT 301137 Industrial Processes Chemical Manufacturing Esters Production POINT 301140 Industrial Processes Chemical Manufacturing Acetylene Production POINT 301152 Industrial Processes Chemical Manufacturing Bisphenol A POINT 301153 Industrial Processes Chemical Manufacturing Butadiene POINT 301156 Industrial Processes Chemical Manufacturing Cumene POINT 301157 Industrial Processes Chemical Manufacturing Cyclohexane POINT 301158 Industrial Processes Chemical Manufacturing Cyclohexanone/Cyclohexanol POINT 301167 Industrial Processes Chemical Manufacturing Vinyl Acetate POINT 301169 Industrial Processes Chemical Manufacturing Ethyl Benzene POINT 301176 Industrial Processes Chemical Manufacturing Glycerin (Glycerol) POINT 301181 Industrial Processes Chemical Manufacturing Toluene Diisocyanate POINT 301190 Industrial Processes Chemical Manufacturing Methyl Methacrylate POINT 301195 Industrial Processes Chemical Manufacturing Nitrobenzene POINT 301210 Industrial Processes Chemical Manufacturing Caprolactum (Use 3-01-130 for Ammonium Sulfate By-product Production) POINT 301211 Industrial Processes Chemical Manufacturing Linear Alkylbenzene POINT 301252 Industrial Processes Chemical Manufacturing Etherene Production POINT 301253 Industrial Processes Chemical Manufacturing Glycol Ethers POINT 301254 Industrial Processes Chemical Manufacturing Nitriles, Acrylonitrile, Adiponitrile Production POINT 301301 Industrial Processes Chemical Manufacturing Chlorobenzene POINT 301302 Industrial Processes Chemical Manufacturing Carbon Tetrachloride POINT 301303 Industrial Processes Chemical Manufacturing Allyl Chloride POINT 301304 Industrial Processes Chemical Manufacturing Allyl Alcohol POINT 301305 Industrial Processes Chemical Manufacturing Epichlorohydrin POINT 301401 Industrial Processes Chemical Manufacturing Nitroglycerin Production POINT 301402 Industrial Processes Chemical Manufacturing Explosives Manufacture – Pentaerythritol Tetranitrate (PETN) POINT 301403 Industrial Processes Chemical Manufacturing Explosives Manufacture – RDX/HMX Production POINT 302003 Industrial Processes Food and Agriculture Instant Coffee Products POINT 302012 Industrial Processes Food and Agriculture Fish Processing POINT 302022 Industrial Processes Food and Agriculture Cotton Seed Delinting

Appendix F Source Classification Codes for Source Categories Containing 15 or Fewer Sources
F-3
Table F-1. Source Classification Codes for Source Categories Containing 15 or Fewer Sources (Cont.)
Data Category SCC L3 SCC L1 Description SCC L2 Description SCC L3 Description
POINT 302028 Industrial Processes Food and Agriculture Mushroom Growing POINT 302039 Industrial Processes Food and Agriculture Carob Kibble POINT 302042 Industrial Processes Food and Agriculture Vinegar Manufacturing POINT 303004 Industrial Processes Primary Metal Production Coke Manufacture: Beehive Process POINT 303005 Industrial Processes Primary Metal Production Primary Copper Smelting POINT 303006 Industrial Processes Primary Metal Production Ferroalloy, Open Furnace POINT 303007 Industrial Processes Primary Metal Production Ferroalloy, Semi-covered Furnace POINT 303011 Industrial Processes Primary Metal Production Molybdenum POINT 303012 Industrial Processes Primary Metal Production Titanium POINT 303030 Industrial Processes Primary Metal Production Zinc Production POINT 303031 Industrial Processes Primary Metal Production Leadbearing Ore Crushing and Grinding POINT 303040 Industrial Processes Primary Metal Production Alumina Processing - Bayer Process POINT 304002 Industrial Processes Secondary Metal Production Copper POINT 304009 Industrial Processes Secondary Metal Production Malleable Iron POINT 304010 Industrial Processes Secondary Metal Production Nickel POINT 304040 Industrial Processes Secondary Metal Production Lead Cable Coating POINT 304049 Industrial Processes Secondary Metal Production Miscellaneous Casting and Fabricating POINT 304051 Industrial Processes Secondary Metal Production Metallic Lead Products POINT 305004 Industrial Processes Mineral Products Calcium Carbide POINT 305013 Industrial Processes Mineral Products Frit Manufacture POINT 305022 Industrial Processes Mineral Products Potash Production POINT 305024 Industrial Processes Mineral Products Magnesium Carbonate POINT 305026 Industrial Processes Mineral Products Diatomaceous Earth POINT 305029 Industrial Processes Mineral Products Lightweight Aggregate Manufacture POINT 305032 Industrial Processes Mineral Products Asbestos Milling POINT 305033 Industrial Processes Mineral Products Vermiculite POINT 305034 Industrial Processes Mineral Products Feldspar POINT 305035 Industrial Processes Mineral Products Abrasive Grain Processing POINT 305036 Industrial Processes Mineral Products Bonded Abrasives Manufacturing POINT 305038 Industrial Processes Mineral Products Pulverized Mineral Processing POINT 305042 Industrial Processes Mineral Products Clay processing: Ball clay

Appendix F Source Classification Codes for Source Categories Containing 15 or Fewer Sources
F-4
Table F-1. Source Classification Codes for Source Categories Containing 15 or Fewer Sources (Cont.)
Data Category SCC L3 SCC L1 Description SCC L2 Description SCC L3 Description
POINT 305044 Industrial Processes Mineral Products Clay processing: Bentonite POINT 305045 Industrial Processes Mineral Products Clay processing: Fuller's earth POINT 305046 Industrial Processes Mineral Products Clay processing: Common clay and shale, NEC POINT 305089 Industrial Processes Mineral Products Talc Processing POINT 305090 Industrial Processes Mineral Products Mica POINT 305092 Industrial Processes Mineral Products Catalyst Manufacturing POINT 314010 Industrial Processes Transportation Equipment Brake Shoe Debonding
POINT 315010 Industrial Processes Photo Equip/Health Care/Labs/Air Condit/SwimPools Photocopying Equipment Manufacturing
POINT 315027 Industrial Processes Photo Equip/Health Care/Labs/Air Condit/SwimPools Thermometer Manufacture
POINT 315031 Industrial Processes Photo Equip/Health Care/Labs/Air Condit/SwimPools X-rays
POINT 315040 Industrial Processes Photo Equip/Health Care/Labs/Air Condit/SwimPools Commercial Swimming Pools - Chlorination-Chloroform
POINT 316030 Industrial Processes Photographic Film Manufacturing Product Manufacturing - Substrate Preparation POINT 316040 Industrial Processes Photographic Film Manufacturing Product Manufacturing - Chemical Preparation POINT 316050 Industrial Processes Photographic Film Manufacturing Product Manufacturing - Surface Treatments POINT 316060 Industrial Processes Photographic Film Manufacturing Product Manufacturing - Finishing Operations POINT 316120 Industrial Processes Photographic Film Manufacturing Support Activities - Cleaning Operations POINT 316130 Industrial Processes Photographic Film Manufacturing Support Activities - Storage Operations POINT 316140 Industrial Processes Photographic Film Manufacturing Support Activities - Material Transfer Operations POINT 316150 Industrial Processes Photographic Film Manufacturing Support Activities - Separation Processes POINT 316160 Industrial Processes Photographic Film Manufacturing Support Activities - Other Operations POINT 360001 Industrial Processes Printing and Publishing Typesetting (Lead Remelting) POINT 390003 Industrial Processes In-process Fuel Use Lignite POINT 401004 Petroleum and Solvent Evaporation Organic Solvent Evaporation Knit Fabric Scouring with Chlorinated Solvent POINT 402028 Petroleum and Solvent Evaporation Surface Coating Operations Glass Optical Fibers POINT 501002 Waste Disposal Solid Waste Disposal - Government Open Burning Dump
POINT 625400 Maximum Achievable Control Technology (MACT) Source Categories
Food and Agricultural Processes Cellulose Food Casing Manufacture

Appendix F Source Classification Codes for Source Categories Containing 15 or Fewer Sources
F-5
Table F-1. Source Classification Codes for Source Categories Containing 15 or Fewer Sources (Cont.)
Data Category SCC L3 SCC L1 Description SCC L2 Description SCC L3 Description
POINT 631110 MACT Source Categories Agricultural Chemicals Production 2,4-D Salts and Esters Production POINT 631250 MACT Source Categories Agricultural Chemicals Production Captan Production POINT 631310 MACT Source Categories Agricultural Chemicals Production Chlorothalonil Production POINT 631340 MACT Source Categories Agricultural Chemicals Production Dacthal Production POINT 641300 MACT Source Categories Styrene or Methacrylate Based Resins Polymethyl Methacrylate Prod - Bulk Polymerization, Batch-cell Method
POINT 641301 MACT Source Categories Styrene or Methacrylate Based Resins Polymethyl Methacrylate Prod - Bulk Polymerization, Continuous Casting
POINT 641302 MACT Source Categories Styrene or Methacrylate Based Resins Polymethyl Methacrylate Prod-Bulk Polymeriz'n, Centrifugal Polymeriz'n
POINT 641310 MACT Source Categories Styrene or Methacrylate Based Resins Polymethyl Methacrylate Prod - Solution Polymerization POINT 641320 MACT Source Categories Styrene or Methacrylate Based Resins Polymethyl Methacrylate Prod - Emulsion Polymerization POINT 644200 MACT Source Categories Cellulose-based Resins Carboxymethylcellulose Production POINT 644500 MACT Source Categories Cellulose-based Resins Cellulose Ethers Production POINT 645200 MACT Source Categories Miscellaneous Resins Alkyd Resin Production, Solvent Process POINT 645210 MACT Source Categories Miscellaneous Resins Alkyd Resin Production, Fusion Process POINT 646100 MACT Source Categories Vinyl-based Resins Polymerized Vinylidene Chloride Production - Emulsion, Latex Prod. POINT 646150 MACT Source Categories Vinyl-based Resins Polyvinyl Acetate Emulsions, Batch Emulsion Process POINT 646200 MACT Source Categories Vinyl-based Resins Polyvinyl Alcohol Production, Solution Polymerization POINT 646300 MACT Source Categories Vinyl-based Resins Polyvinyl Chloride and Copolymers Production - Suspension Process POINT 646320 MACT Source Categories Vinyl-based Resins Polyvinyl Chloride and Copolymers Production - Solvent Process POINT 646330 MACT Source Categories Vinyl-based Resins Polyvinyl Chloride and Copolymers Production - Bulk Process POINT 648200 MACT Source Categories Miscellaneous Polymers Maleic Anhydride Copolymers Production - Bulk Polymerization POINT 648210 MACT Source Categories Miscellaneous Polymers Maleic Anhydride Copolymers Production - Solution Polymerization POINT 648220 MACT Source Categories Miscellaneous Polymers Maleic Anhydride Copolymers Production - Emulsion Polymerization POINT 649200 MACT Source Categories Fibers Production Processes Rayon Fiber Production POINT 651100 MACT Source Categories Inorganic Chemicals Manufacturing Antimony Oxides Manufacturing POINT 651300 MACT Source Categories Inorganic Chemicals Manufacturing Fumed Silica Manufacturing POINT 651350 MACT Source Categories Inorganic Chemicals Manufacturing Quaternary Ammonium Compounds Manufacturing POINT 651400 MACT Source Categories Inorganic Chemicals Manufacturing Sodium Cyanide Manufacturing POINT 685100 MACT Source Categories Miscellaneous Processes (Chemicals) Phthalate Plasticizers Production

United States Environmental Protection Agency
Office of Air Quality Planning and Standards Sector Policies and Programs Division
Research Triangle Park, NC
Publication No. EPA-453/D-13-001 August 2013