Embed Size (px)
Citation preview

Recession and Recovery: A New England Perspective
Yolanda KodrzyckiVice President and Director, NEPPC
Federal Reserve Bank of Boston
Presented atRegional and Community Bankers Conference
October 21, 2010
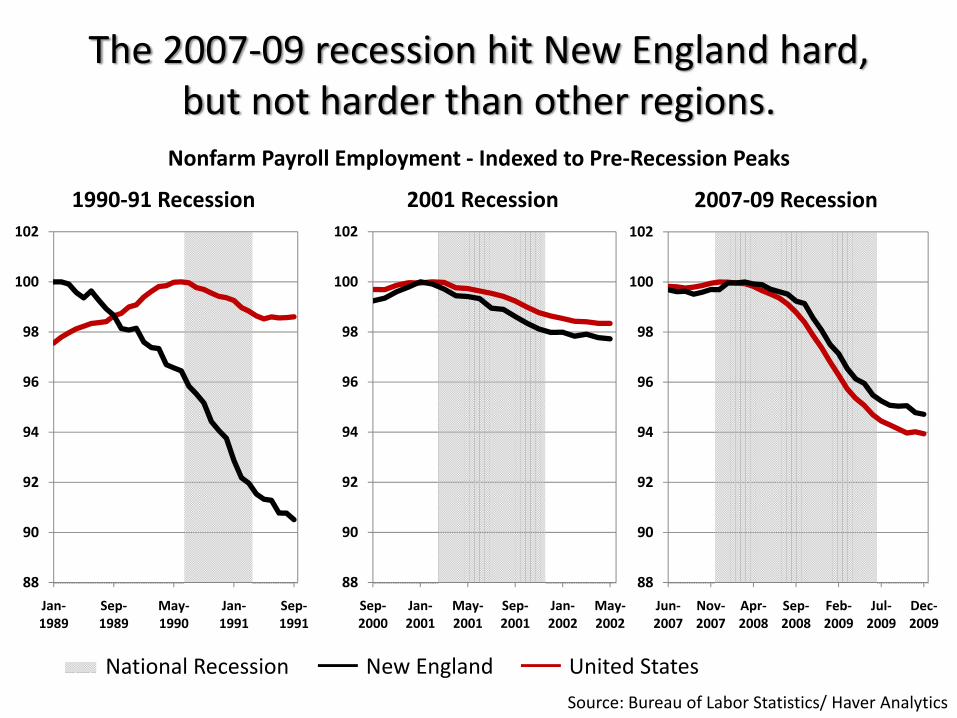
The 2007‐09 recession hit New England hard, but not harder than other regions.
Nonfarm Payroll Employment ‐ Indexed to Pre‐Recession Peaks
National Recession United States
Source: Bureau of Labor Statistics/ Haver Analytics
88
90
92
94
96
98
100
102
Jan‐1989
Sep‐1989
May‐1990
Jan‐1991
Sep‐1991
1990‐91 Recession
88
90
92
94
96
98
100
102
Sep‐2000
Jan‐2001
May‐2001
Sep‐2001
Jan‐2002
May‐2002
2001 Recession
88
90
92
94
96
98
100
102
Jun‐2007
Nov‐2007
Apr‐2008
Sep‐2008
Feb‐2009
Jul‐2009
Dec‐2009
2007‐09 Recession
New England
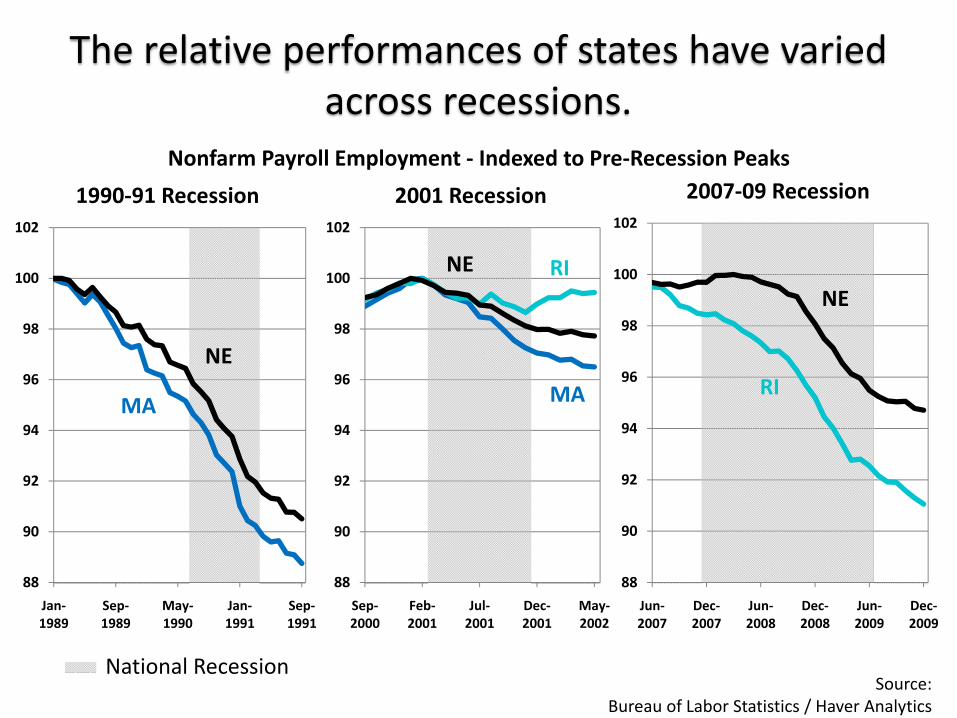
The relative performances of states have variedacross recessions.
Nonfarm Payroll Employment ‐ Indexed to Pre‐Recession Peaks
Source: Bureau of Labor Statistics / Haver Analytics
88
90
92
94
96
98
100
102
Jan‐1989
Sep‐1989
May‐1990
Jan‐1991
Sep‐1991
1990‐91 Recession
88
90
92
94
96
98
100
102
Sep‐2000
Feb‐2001
Jul‐2001
Dec‐2001
May‐2002
2001 Recession
RI
88
90
92
94
96
98
100
102
Jun‐2007
Dec‐2007
Jun‐2008
Dec‐2008
Jun‐2009
Dec‐2009
2007‐09 Recession
MA MA RI
National Recession
NE
NE
NE

Among the New England states, MA and NH had the smallest job losses in the 2007‐09 recession …
‐12%
‐10%
‐8%
‐6%
‐4%
‐2%
0%
RI CT VT ME NE MA NH
Change in Nonfarm Employment from Peak to Trough
Source: Calculations Based on Bureau of Labor Statistics Data

… and the strongest job gains in the expansion to date
0%
2%
4%
6%
8%
10%
12%
ME VT CT RI NE NH MA
Change in Nonfarm Employment from Trough to August 2010
Source: Calculations Based on Bureau of Labor Statistics Data

By sector, construction and manufacturinghad the steepest job losses in 2007‐09.
New England United States
Source: Calculations Based on Bureau of Labor Statistics Data
Construction
Manufacturing
Professional and Business Services
Trade, Transportation, and Utilities
Financial Activities
Leisure and Hospitality
Government
Educational and Health Services
Percentage Change from Peak to Trough

Government and financial servicesare still shedding jobs.
New England United States
Source: Calculations Based on Bureau of Labor Statistics Data
Construction
Manufacturing
Professional and Business Services
Trade, Transportation, and Utilities
Financial Activities
Leisure and Hospitality
Government
Educational and Health Services
Percentage Change From Trough to Present

Four New England sectors have shed50,000 or more jobs since 2007.
Source: Calculations Based on Bureau of Labor Statistics Data
Construction
Manufacturing
Professional and Business Services
Trade, Transportation, and Utilities
Financial Activities
Leisure and Hospitality
Government
Educational and Health Services
Thousands
Change in NE Employment from Peak to August 2010
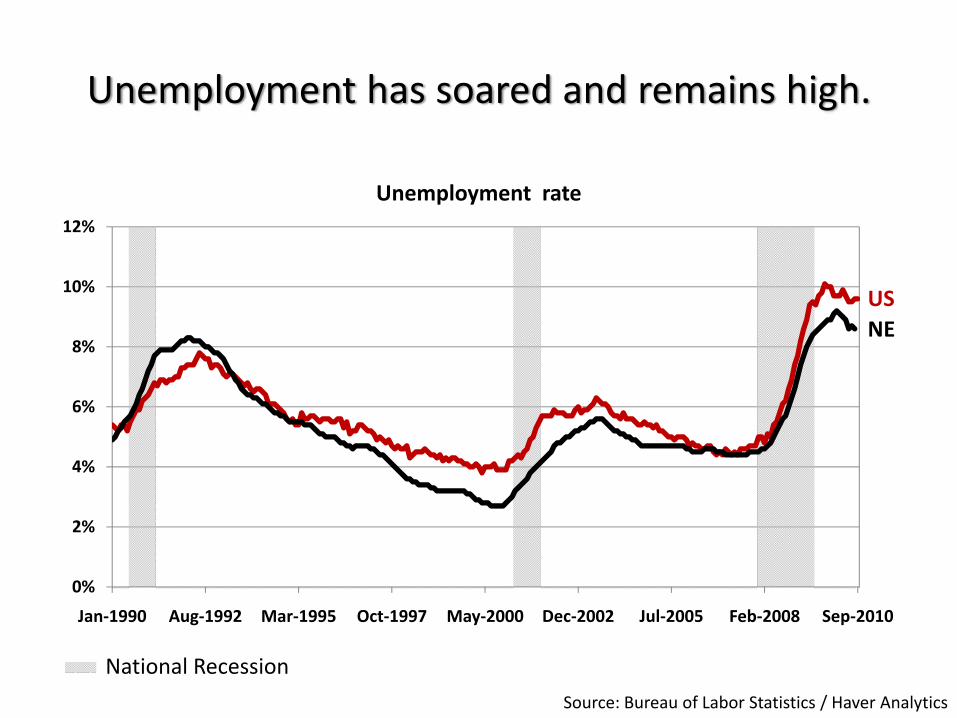
Unemployment has soared and remains high.
Source: Bureau of Labor Statistics / Haver Analytics
0%
2%
4%
6%
8%
10%
12%
Jan‐1990 Aug‐1992 Mar‐1995 Oct‐1997 May‐2000 Dec‐2002 Jul‐2005 Feb‐2008 Sep‐2010
Unemployment rate
USNE
National Recession
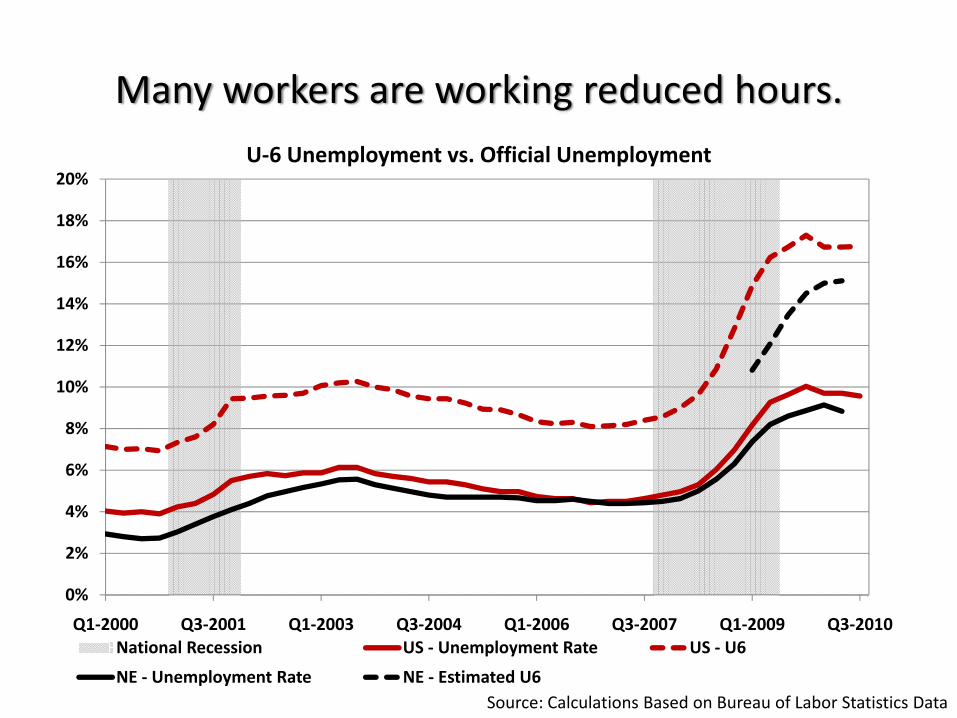
Many workers are working reduced hours.
Source: Calculations Based on Bureau of Labor Statistics Data
0%
2%
4%
6%
8%
10%
12%
14%
16%
18%
20%
Q1‐2000 Q3‐2001 Q1‐2003 Q3‐2004 Q1‐2006 Q3‐2007 Q1‐2009 Q3‐2010
U‐6 Unemployment vs. Official Unemployment
National Recession US ‐ Unemployment Rate US ‐ U6
NE ‐ Unemployment Rate NE ‐ Estimated U6
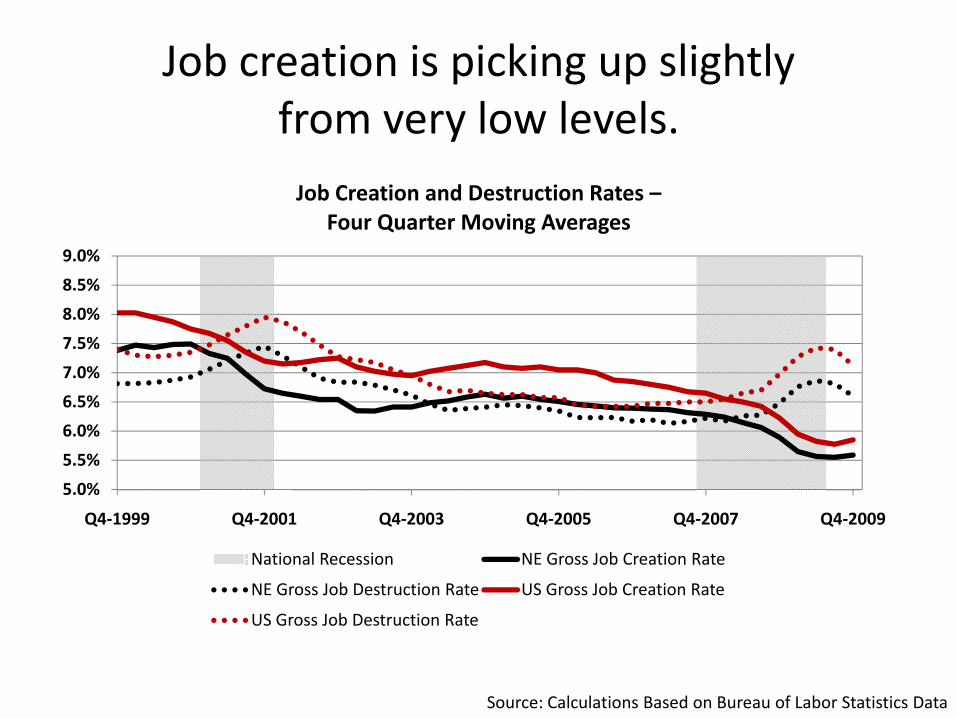
Job creation is picking up slightly from very low levels.
Source: Calculations Based on Bureau of Labor Statistics Data
5.0%
5.5%
6.0%
6.5%
7.0%
7.5%
8.0%
8.5%
9.0%
Q4‐1999 Q4‐2001 Q4‐2003 Q4‐2005 Q4‐2007 Q4‐2009
Job Creation and Destruction Rates –Four Quarter Moving Averages
National Recession NE Gross Job Creation Rate
NE Gross Job Destruction Rate US Gross Job Creation Rate
US Gross Job Destruction Rate

House prices have fallen 19 percent in RI, more than in neighboring states.
Source: Federal Housing Finance Authority/Haver Analytics
0
100
200
300
400
500
600
700
800
Q2‐1990 Q2‐1994 Q2‐1998 Q2‐2002 Q2‐2006 Q2‐2010
Southern New England FHFA House Price Index (1980 = 100)
Percent Change From Peak to PresentCT MA RI US
‐12.7% ‐12.9% ‐19% ‐11.2%MA
US
RICT
National Recession

House prices in Vermont have been remarkably stable throughout the downturn.
Source: Federal Housing Finance Authority/Haver Analytics
0
100
200
300
400
500
600
700
800
Q2‐1990 Q2‐1994 Q2‐1998 Q2‐2002 Q2‐2006 Q2‐2010
Northern New England FHFA House Price Index (1980 = 100)
Percent Change From Peak to PresentME NH VT US‐9.2% ‐14.1% ‐3.4% ‐11.2%
MEVTNHUS
National Recession

Foreclosure starts in RI have fallen,and are now in line with neighboring states.
Source: Mortgage Bankers Association/Haver Analytics
0.0%
0.2%
0.4%
0.6%
0.8%
1.0%
1.2%
1.4%
1.6%
Q2‐1990 Q2‐1994 Q2‐1998 Q2‐2002 Q2‐2006 Q2‐2010
Southern New England Foreclosure Starts ‐Percentage of All Home Loans
MA
USRICT
National Recession
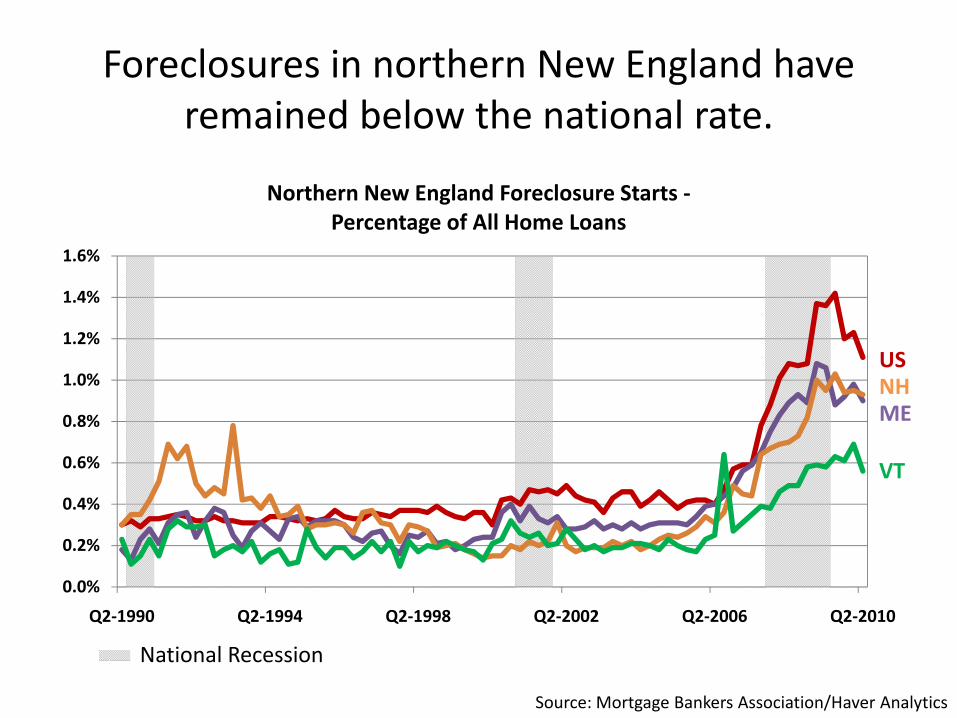
Foreclosures in northern New England have remained below the national rate.
Source: Mortgage Bankers Association/Haver Analytics
0.0%
0.2%
0.4%
0.6%
0.8%
1.0%
1.2%
1.4%
1.6%
Q2‐1990 Q2‐1994 Q2‐1998 Q2‐2002 Q2‐2006 Q2‐2010
Northern New England Foreclosure Starts ‐Percentage of All Home Loans
ME
US
VT
NH
National Recession

Homeowner vacancy rates in New England have remained well below the national average.
Source: Bureau of the Census/Haver Analytics
MA
US
RI
CT
National Recession
0.0%
0.5%
1.0%
1.5%
2.0%
2.5%
3.0%
3.5%
Q2‐1999 Q1‐2002 Q4‐2004 Q3‐2007 Q2‐2010
Southern New England Homeowner Vacancy RateFour Quarter Moving Average

Homeowner vacancy rates have been higher in Maine than in other northern New England states.
Source: Bureau of the Census/Haver Analytics
NH
US
VT
ME
National Recession
0.0%
0.5%
1.0%
1.5%
2.0%
2.5%
3.0%
3.5%
Q2‐1999 Q1‐2002 Q4‐2004 Q3‐2007 Q2‐2010
Northern New England Homeowner Vacancy RateFour Quarter Moving Average
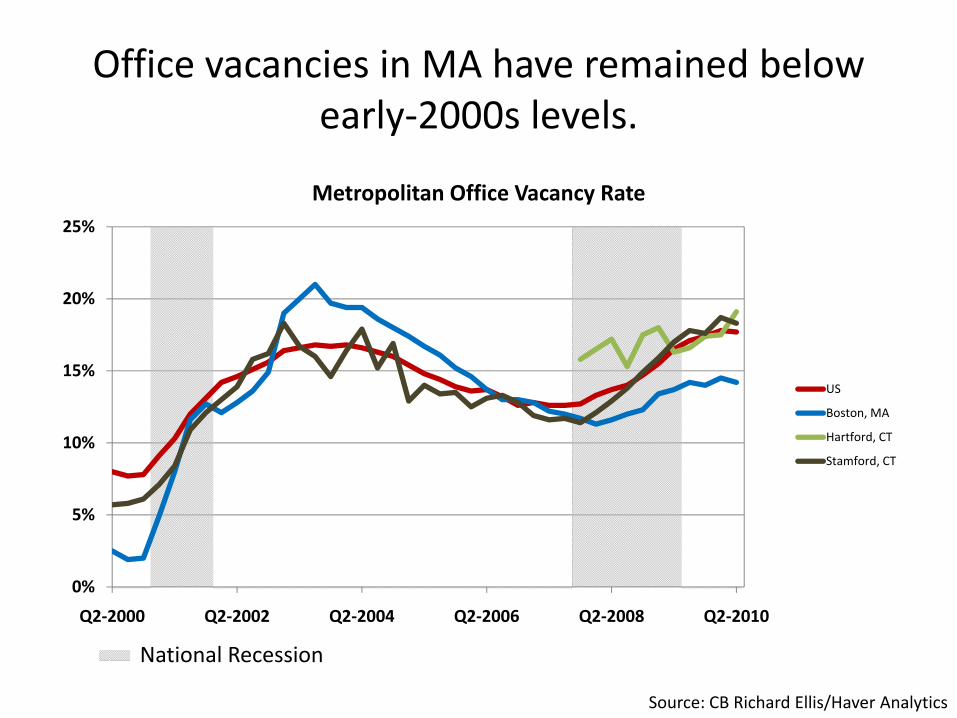
Office vacancies in MA have remained below early‐2000s levels.
Source: CB Richard Ellis/Haver Analytics
0%
5%
10%
15%
20%
25%
Q2‐2000 Q2‐2002 Q2‐2004 Q2‐2006 Q2‐2008 Q2‐2010
Metropolitan Office Vacancy Rate
US
Boston, MA
Hartford, CT
Stamford, CT
National Recession

Small businesses are reporting few job openings and little interest in expanding headcount.
0%10%20%30%40%
Jan‐1989 May‐1993 Sep‐1997 Jan‐2002 May‐2006 Sep‐2010
Percent of Small Businesses with One or More Jobs Open(Four Quarter Moving Average)
‐10%0%10%20%30%
Jan‐1989 May‐1993 Sep‐1997 Jan‐2002 May‐2006 Sep‐2010
Net Percent of Small Businesses Planning to Increase Employment(Four Quarter Moving Average)
National Recession
Source: National Federation of Independent Business
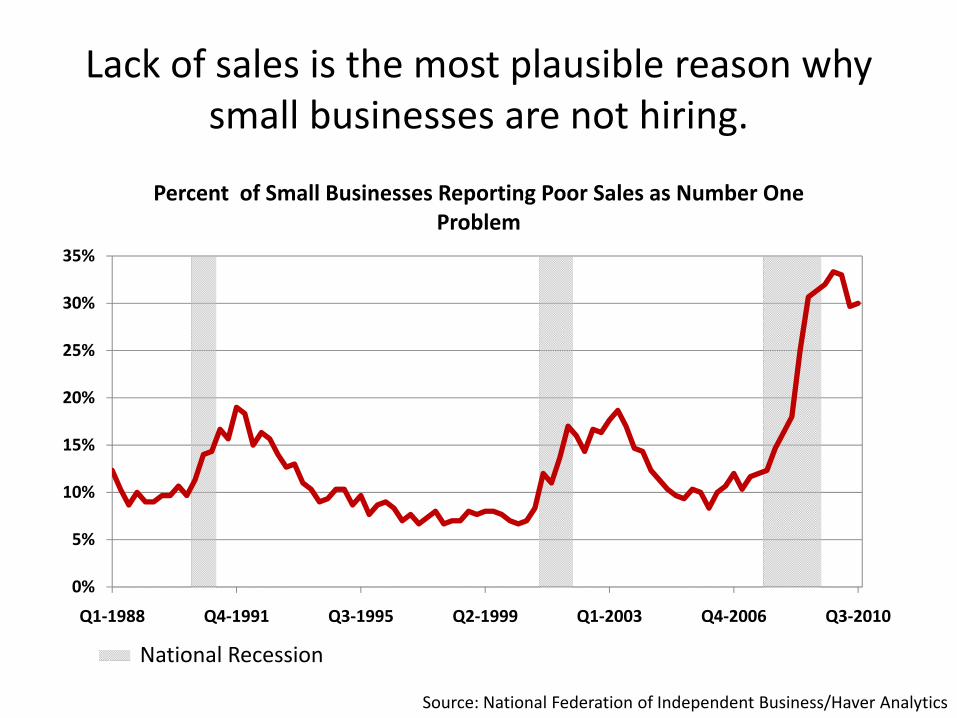
Lack of sales is the most plausible reason why small businesses are not hiring.
Source: National Federation of Independent Business/Haver Analytics
0%
5%
10%
15%
20%
25%
30%
35%
Q1‐1988 Q4‐1991 Q3‐1995 Q2‐1999 Q1‐2003 Q4‐2006 Q3‐2010
Percent of Small Businesses Reporting Poor Sales as Number One Problem
National Recession

Poor sales have replaced taxes as the biggest concern to small businesses.
1st 2nd 3rd 4th 5th
1990‐91 Recession
TaxesGovernment Requirements
Poor Sales OtherCompetition from Large Corporations
23.1% 16.9% 13.2% 11.8% 9.0%
2001 Recession
Taxes Quality of Labor Poor SalesGovernment Requirements
Insurance Cost or Availability
22.5% 16.7% 13.4% 11.3% 11.0%
2007‐09 Recession
Poor Sales TaxesInsurance
Cost/AvailabilityInflation
Government Requirements
21.2% 19.0% 11.1% 10.0% 9.6%
Source: National Federation of Independent Business/Haver Analytics
Top Average Responses During Past Three Recessions
New England businesses cite uncertainties, inability to plan.
• Federal , state, and local government fiscal strains: how will they be resolved?
• Forthcoming tax incentives for employment or investment?
• Health care reform: impact on costs?• Access to credit: still some mention, but less than a few months ago.
Source: Boston Fed New England Advisory Council meeting, September 2010
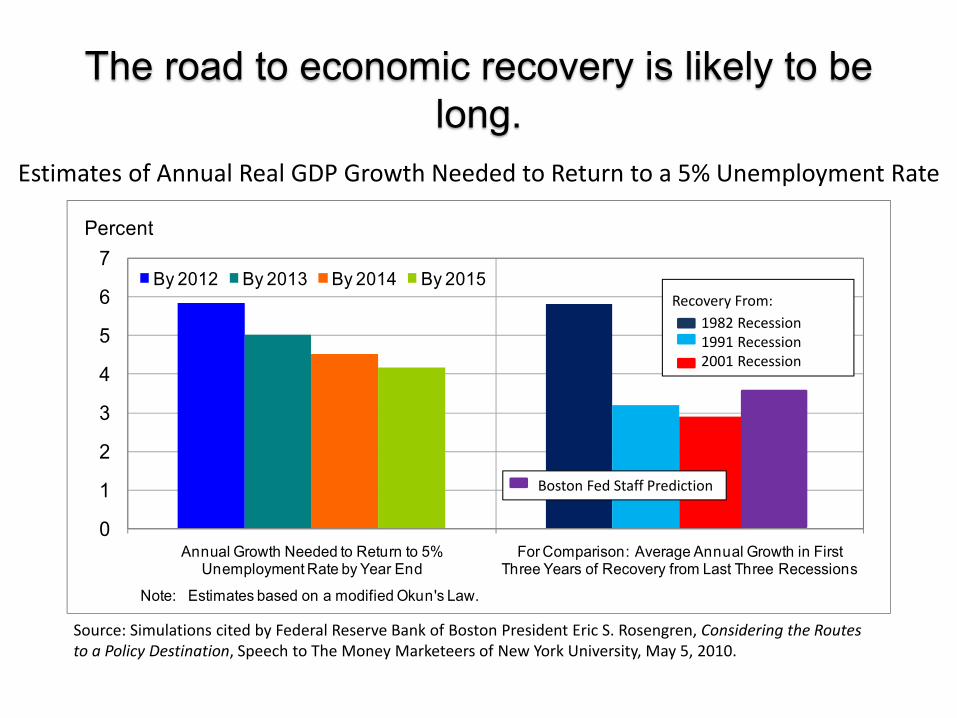
The road to economic recovery is likely to be long.
0
1
2
3
4
5
6
7
Annual Growth Needed to Return to 5% Unemployment Rate by Year End
For Comparison: Average Annual Growth in First Three Years of Recovery from Last Three Recessions
By 2012 By 2013 By 2014 By 2015
Percent
1982 Recession
1991 Recession
2001 Recession
Recovery from:
Note: Estimates based on a modified Okun's Law.
Recovery From:1982 Recession1991 Recession2001 Recession
Estimates of Annual Real GDP Growth Needed to Return to a 5% Unemployment Rate
Boston Fed Staff Prediction
Source: Simulations cited by Federal Reserve Bank of Boston President Eric S. Rosengren, Considering the Routes to a Policy Destination, Speech to The Money Marketeers of New York University, May 5, 2010.

Economic recovery won’t feel like fiscal recovery for the states.
• ARRA money goes away.• Rainy day funds have been drawn down.• Employment and wages are lagging GDP recovery.• Enrollments in Medicaid / SCHIP rise when economy is weak.
• Pension and other retirement‐related contributions continue to rise.
• Local governments seek more state aid as property tax revenues weaken.
Summary
• New England economy hit hard, but not quite as hard as U.S. economy.
• Slow recovery taking hold.
• Many opinions on what can and should be done to accelerate the improvement.
• Fiscal problems of state and local government will exert a drag on the recovery unless federal aid comes to the rescue.