Embed Size (px)
Citation preview
Recent developments
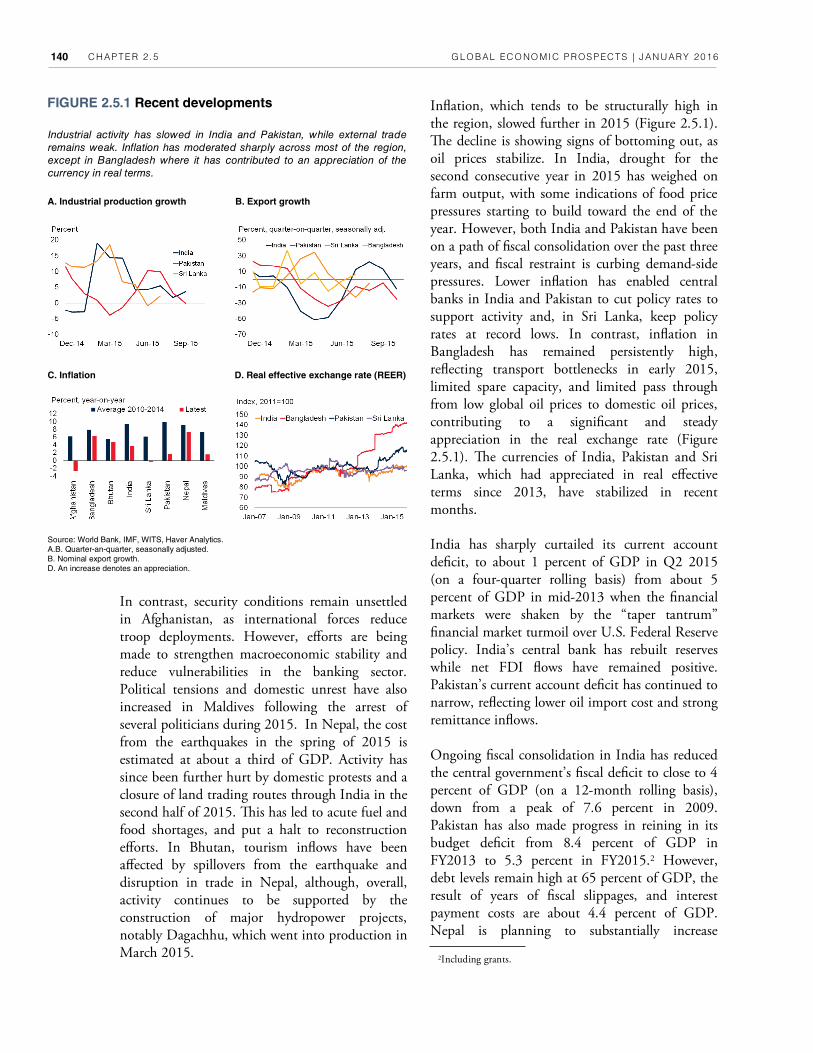
Regional growth remained robust at an estimated 7.0 percent in 2015, helped by strengthening activity in the region’s largest economies (Table 2.5.1). In India, brisk growth continued, at an estimated 7.2 percent year-on-year in the Irst half of the 2015/16 Iscal year compared with 7.3 percent in FY2014/15 as a whole. Monetary and Iscal restraint, the fall in global crude oil prices and a moderation in food price inOation have contributed to a steep drop in inOation and a narrowing of current account and Iscal deIcits. Momentum in industrial output has slowed and both the services and manufacturing Purchasing Managers’ Indices (PMIs) have softened (Figure 2.5.1). However, the investment cycle is gradually picking up, led by a government ePorts to boost investment in infrastructure, particularly roads, railways and urban infrastructure. India’s currency and stock markets were largely resilient over the past year, even during bouts of volatility in global Inancial markets.
Elsewhere in the region, macroeconomic adjustment in Pakistan under an International Monetary Fund program is progressing, while
ePorts to crack down on violent crime in Karachi, the country’s industrial and commercial hub, are supporting investor conIdence. Me China Pakistan Economic Corridor (CPEC) agreement, signed in 2015, has further bolstered investor optimism, and, if implemented, has the potential to lift long-term growth. Pakistan once again tapped the international capital markets and launched a US$500 million Eurobond in September 2015, with the same maturity and coupon as its issue a year earlier.
Sri Lanka has completed a major political transition, with a national unity and reform-oriented government formed after the August 2015 parliamentary election. Growth in 2013 and 2014 was revised downward from 7.2 and 7.4 percent to 3.4 and 4.5 percent, respectively, as a result of a rebasing of the national accounts.1 Incoming data show growth picking up mid-year, led by robust service sector growth, and supported by rising tourism inOows and strong remittances. In Bangladesh, as political tensions have abated, exports have rebounded strongly, supporting activity.
Note: Me author of this section is Tehmina Khan. Research assistance was provided by Xiaodan Ding.
GDP growth in South Asia rose from 6.8 percent in 2014 to 7.0 percent in 2015, the fastest rate among developing regions, as recovery took hold in India, and as the region beneAted from lower oil prices and improved resilience to external shocks. A moderate further acceleration in economic activity is projected, with regional growth rising to 7.5 percent in 2018, buoyed by strengthening investment and a broadly supportive policy environment. Risks are mainly domestic. ?ey include reform setbacks in the reform momentum in India, political tensions or con@icts in smaller economies, and, over the longer term, the commitment of governments to the necessary Ascal adjustment. South Asia may also face external headwinds from an increase in interest rates in the United States, although vulnerabilities are greatly reduced since the “taper tantrum” of 2013. Key policy challenges include the substantial non-performing bank loans in several countries, and the need for further reforms—in particular, to improve the ability of Arms to do business within and outside the region, and to fully harness the ongoing demographic dividend.
1Me GDP series was rebased from 2002 to 2010. Me new GDP series also captures new activities such as professional services, and better measures value added in other sectors, notably in services. In level terms, both nominal GDP and per capita GDP have increased.
CHAPTER 2 .5 GLOBAL ECONOMIC PROSPECTS | JANUARY 2016 140
InOation, which tends to be structurally high in the region, slowed further in 2015 (Figure 2.5.1). Me decline is showing signs of bottoming out, as oil prices stabilize. In India, drought for the second consecutive year in 2015 has weighed on farm output, with some indications of food price pressures starting to build toward the end of the year. However, both India and Pakistan have been on a path of Iscal consolidation over the past three years, and Iscal restraint is curbing demand-side pressures. Lower inOation has enabled central banks in India and Pakistan to cut policy rates to support activity and, in Sri Lanka, keep policy rates at record lows. In contrast, inOation in Bangladesh has remained persistently high, reOecting transport bottlenecks in early 2015, limited spare capacity, and limited pass through from low global oil prices to domestic oil prices, contributing to a signiIcant and steady appreciation in the real exchange rate (Figure 2.5.1). Me currencies of India, Pakistan and Sri Lanka, which had appreciated in real ePective terms since 2013, have stabilized in recent months.
India has sharply curtailed its current account deIcit, to about 1 percent of GDP in Q2 2015 (on a four-quarter rolling basis) from about 5 percent of GDP in mid-2013 when the Inancial markets were shaken by the “taper tantrum” Inancial market turmoil over U.S. Federal Reserve policy. India’s central bank has rebuilt reserves while net FDI Oows have remained positive. Pakistan’s current account deIcit has continued to narrow, reOecting lower oil import cost and strong remittance inOows.
Ongoing Iscal consolidation in India has reduced the central government’s Iscal deIcit to close to 4 percent of GDP (on a 12-month rolling basis), down from a peak of 7.6 percent in 2009. Pakistan has also made progress in reining in its budget deIcit from 8.4 percent of GDP in FY2013 to 5.3 percent in FY2015.2 However, debt levels remain high at 65 percent of GDP, the result of years of Iscal slippages, and interest payment costs are about 4.4 percent of GDP. Nepal is planning to substantially increase
Source: World Bank, IMF, WITS, Haver Analytics.
A.B. Quarter-an-quarter, seasonally adjusted.
B. Nominal export growth.
D. An increase denotes an appreciation.
In contrast, security conditions remain unsettled in Afghanistan, as international forces reduce troop deployments. However, ePorts are being made to strengthen macroeconomic stability and reduce vulnerabilities in the banking sector. Political tensions and domestic unrest have also increased in Maldives following the arrest of several politicians during 2015. In Nepal, the cost from the earthquakes in the spring of 2015 is estimated at about a third of GDP. Activity has since been further hurt by domestic protests and a closure of land trading routes through India in the second half of 2015. Mis has led to acute fuel and food shortages, and put a halt to reconstruction ePorts. In Bhutan, tourism inOows have been aPected by spillovers from the earthquake and disruption in trade in Nepal, although, overall, activity continues to be supported by the construction of major hydropower projects, notably Dagachhu, which went into production in March 2015.
FIGURE 2.5.1 Recent developments
A. Industrial production growth
Industrial activity has slowed in India and Pakistan, while external trade
remains weak. Inflation has moderated sharply across most of the region,
except in Bangladesh where it has contributed to an appreciation of the
currency in real terms.
B. Export growth
C. Inflation D. Real effective exchange rate (REER)
2Including grants.
SOUTH AS IA GLOBAL ECONOMIC PROSPECTS | JANUARY 2016 141
spending for reconstruction. Mis is expected to push the Iscal balance into a modest deIcit. Fiscal discipline has weakened in Bangladesh and Sri Lanka. Me deIcit in Bangladesh is set to widen to 5 percent of GDP, the largest since 2008, in line with the doubling of public sector wages. In Sri Lanka, the Iscal deIcit is estimated to have widened to 5.7 percent of GDP, and public debt has reached over 70 percent of GDP. Most countries in the region struggle to raise taxes, particularly from goods and services taxes (GST) or value-added taxes which are typically a lynchpin for sustainable public Inances in developing countries. Persistent deIcits in previous years have saddled the country with a public debt ratio amounting to 75 percent of GDP in 2014. Incomplete Iscal consolidation in 2015 and a large increase in foreign-Inanced capital expenditure projects budgeted for 2016 risks increasing the level of external public debt further.
Two key critical legislative reforms (GST and land acquisition) are still pending in India. Nevertheless, the government has made progress in key areas, such as energy, and in November announced major reforms to liberalize FDI in several sectors. Me central bank, meanwhile, has liberalized the medium-term framework for foreign portfolio investment, in an ePort to increase its role in market development and for attracting long-term investors. In Pakistan, the authority to grant tax exemptions has been transferred from the Revenue Board to parliament while ePorts continue to implement an ambitious tax reform agenda. Me central bank, with IMF assistance, is gradually strengthening monitoring of Inancial stability risks, and is in the process of instituting a modern deposit insurance scheme in line with international best practices. Me new Sri Lankan government has announced governance reforms that should strengthen democratic institutions.
Outlook
Growth in the region is expected to edge up, reaching 7.5 percent by 2017, driven mainly by domestic demand. Investment growth is expected to continue strengthening in India due to
government ePorts to accelerate infrastructure development and boost Public Private Partnerships (PPPs), and in Pakistan due to CPEC implementation. In Bangladesh and Sri Lanka, public sector wage increases and an easing of political tensions or uncertainty should bolster private consumption.
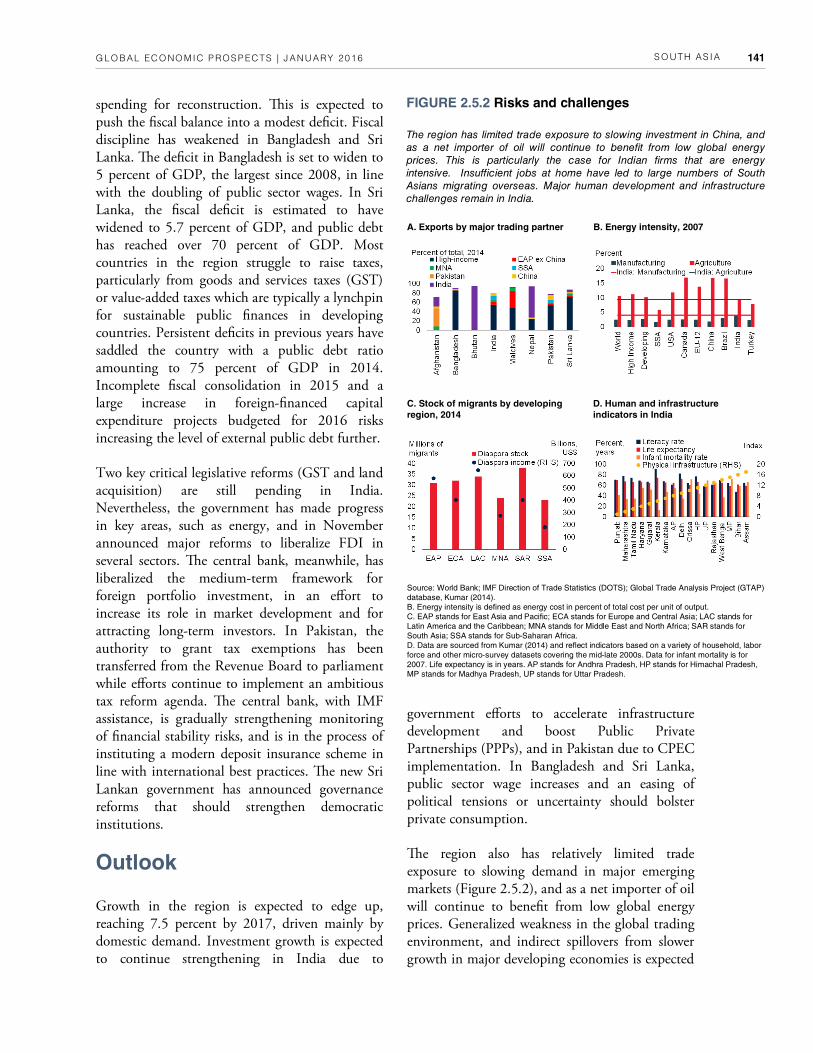
Me region also has relatively limited trade exposure to slowing demand in major emerging markets (Figure 2.5.2), and as a net importer of oil will continue to beneIt from low global energy prices. Generalized weakness in the global trading environment, and indirect spillovers from slower growth in major developing economies is expected
Source: World Bank; IMF Direction of Trade Statistics (DOTS); Global Trade Analysis Project (GTAP)
database, Kumar (2014).
B. Energy intensity is defined as energy cost in percent of total cost per unit of output.
C. EAP stands for East Asia and Pacific; ECA stands for Europe and Central Asia; LAC stands for
Latin America and the Caribbean; MNA stands for Middle East and North Africa; SAR stands for
South Asia; SSA stands for Sub-Saharan Africa.
D. Data are sourced from Kumar (2014) and reflect indicators based on a variety of household, labor
force and other micro-survey datasets covering the mid-late 2000s. Data for infant mortality is for
2007. Life expectancy is in years. AP stands for Andhra Pradesh, HP stands for Himachal Pradesh,
MP stands for Madhya Pradesh, UP stands for Uttar Pradesh.
A. Exports by major trading partner B. Energy intensity, 2007
C. Stock of migrants by developing region, 2014
D. Human and infrastructure indicators in India
FIGURE 2.5.2 Risks and challenges
The region has limited trade exposure to slowing investment in China, and
as a net importer of oil will continue to benefit from low global energy
prices. This is particularly the case for Indian firms that are energy
intensive. Insufficient jobs at home have led to large numbers of South
Asians migrating overseas. Major human development and infrastructure
challenges remain in India.
CHAPTER 2 .5 GLOBAL ECONOMIC PROSPECTS | JANUARY 2016 142
to partly oPset the positive impulse to exports from high-income country demand. With activity slowing in oil-rich GCC countries, growth in remittances is also expected to moderate.
Compared to most other major developing countries, India is well positioned to withstand near-term headwinds and volatility in global Inancial markets due to reduced external vulnerabilities, a strengthening domestic business cycle, and a supportive policy environment. Although the pace of reforms has slowed somewhat, growth is expected to strengthen to 7.9 percent in FY2017/18, from an expected 7.5 percent in FY2015/16. Progress on infrastructure improvements and government ePorts to boost investment are expected to oPset the impact of any tightening of borrowing conditions resulting from tighter U.S. monetary policy. Such investment will also lift potential growth over the medium term. Low international energy prices and domestic energy reforms will ease energy costs for Indian Irms that tend to be energy intensive (Figure 2.5.2). Although rural incomes have suPered as a result of two successively weak monsoon seasons, urban spending has been supported by the decline in inOation, and will also beneIt in the near term from public sector wage increases announced recently. India accounts for more than 90 percent of portfolio and FDI inOows to the region. Better growth prospects relative to other major developing countries should help Oows remain resilient during the transition to tighter global Inancing conditions (although there may be volatility in the near term).
Pakistan stands to beneIt from three tailwinds over the near- to medium- term, with average growth projected at 5.5 percent over the forecast period.3 Mese include rising investments from China under the CPEC agreement; the anticipated return of the Islamic Republic of Iran to the international economic community; and persistently low international oil prices. CPEC will connect Western China to the Arabian Sea via the
new port of Gwadar. Estimated at around US$45 billion of investment until 2030, the initiative will Inance a series of transport infrastructure projects (US$11 billion, mostly public investment) and energy projects (US$33 billion, mostly private).4
Increased infrastructure spending and public sector wage hikes in Bangladesh are expected to keep growth high at 6.8 percent over the medium term, but also to widen the Iscal deIcit. An amendment to labor laws in September that strengthened workers’ rights and workplace safety should assist export performance, particularly in light of the ongoing U.S. review of Bangladesh’s trade status under its Generalized System of Preferences (GSP).
In Nepal, the devastation caused by the earthquake and the disruption of trade in 2015 have hurt investment and activity hard. Growth for FY 2015/16 has been revised down to 1.7 percent (versus an estimate of 3.7 percent prior to the trade disruption). However, there remains considerable uncertainty around the point forecast, with growth likely to range anywhere between 1-2.3 percent. Activity should gradually recover as government reconstruction spending is ramped up in the later years of the forecast period. Plans to build major hydropower projects in partnership with China and India are likely to see considerable delays in the current environment. A mild recovery is projected in Afghanistan, conditional on improvements in security and domestic reforms.
In Bhutan, growth is expected to remain strong over the forecast period, as major hydropower projects are built. Mree major projects are expected to come online by 2017 that should help to boost exports and Iscal revenues. Tourism inOows are expected to support services in Bhutan and Sri Lanka. Robust service sector growth and policy ePorts to improve competitiveness in the manufacturing in Sri Lanka are expected to lead to a steady pickup in growth to 6 percent in 2017, from 5.3 percent in 2015.
3For cross-country comparability, this is projected growth in real GDP “at market prices”. Me Government of Pakistan usually refers to growth in real GDP “at factor cost” for policy purposes. Real GDP growth at factor cost is projected at 4.5 percent in FY2015/16.
4Me projects foreseen in the CPEC to receive funding from China's US$4 billion Silk Road Fund include partial Inancing for the US$1.65 billion Karot hydropower project.
SOUTH AS IA GLOBAL ECONOMIC PROSPECTS | JANUARY 2016 143
Risks
Risks are mostly of domestic origin and mainly on the downside. In India, progress in reforms is not assured as the upper house of parliament, which the ruling party does not control, has the power to block the government’s legislative agenda. Slow progress on land reforms could add to investment delays, and private investment growth may be unable to build further momentum. Me Inancing of public-private partnerships also remains a challenge. A failure to pass the goods and services tax could hamper the government’s ability to ramp up spending on infrastructure needs and preserve the status quo of fragmented domestic markets. In addition, although India has made good progress on reducing external vulnerabilities and strengthening the credibility of the macro policy framework, high levels of nonperforming loans in the banking sector, concentrated in construction, natural resource and infrastructure sectors, could impede a pickup in investment if left unaddressed (World Bank 2015a, IMF 2015k). Mere are also downside risks to growth in the near term from sub-par monsoon rainfall across most of India, and farm output growth may prove weaker than projected.
Stronger growth and investment in Pakistan is predicated on reforms to strengthen the business climate, an improvement in the security situation, implementation of the CPEC and an associated easing in energy constraints. Mese developments might not materialize as expected. A resumption of political tensions in Bangladesh and an escalation of existing tensions in Nepal and Afghanistan are key risks in these countries. Budget execution, particularly capital spending, has been a longstanding challenge in Nepal, and slow progress in post-earthquake reconstruction, coupled with political tensions, could dampen any post-earthquake rebound. Afghanistan, meanwhile, faces substantial Iscal risks and challenges, aPecting Inancing of civilian and security spending.
Fiscal risks are elevated across the region. In Pakistan, with national elections due in 2018, hard won Iscal consolidation gains may be lost if
spending ramps up in the pre-election period. In addition, sovereign guarantees associated with the CPEC could pose substantial Iscal risks over the medium term. Large Iscal deIcits in Bangladesh and Sri Lanka increase risks that rising government borrowing will crowd out private investment. In Sri Lanka, external debt has increased since 2014, due to both private and public (mainly non-concessional) borrowing, and government contingent liabilities have also risen fast. A growth slowdown increases the risk of deteriorating public debt ratios and rising external costs of borrowing.
Although less pressing than domestic risks, external risks remain. Me region will not be immune to trade and Inancial market headwinds if there is a slowdown in major developing countries. Other external risks include increased volatility in Inancial Oows as U.S. monetary policy is tightened. A substantial share of South Asian migrants are also located overseas, including in GCC countries (Box 2.5), where Iscal strains are emerging and construction activity is slowing amid the slump in oil prices. With remittances a major source of support for households in several South Asian countries, any decline in inflows in the event of further oil prices declines and a sharp slowdown or Iscal retrenchment in GCC countries could hurt private consumption.
Policy challenges
South Asian countries face substantial challenges on the Iscal front. Generally, Iscal deIcits and public debt levels remain high in the region including in India, Pakistan and Sri Lanka. Afghanistan has seen a sharp drop in the domestic revenue-to-GDP ratio, mainly because of the growth slowdown. Me country remains dependent on high levels of donor Inancing to fund critical security and social spending programs. Over the longer term, anchoring Iscal sustainability will require tax reforms, given generally low tax-to-GDP ratios in the region (World Bank 2015a).
Further, as discussed in Box 2.5.1. South Asia is one of the least globally integrated regions, and
CHAPTER 2 .5 GLOBAL ECONOMIC PROSPECTS | JANUARY 2016 144
regional integration is even more limited. A number of factors are at work: poor connectivity within South Asia and to global markets; poor trade facilitation policies reOected in high costs of trading across borders in general; and restrictions on doing business with countries within the region that are in some cases due to strained political relations and have contributed to substantial numbers of South Asians migrating overseas in search of better employment opportunities (Figure 2.5.2c; Ahmad and Ghani, 2007; De et al. 2013; Palit and Spittel, 2013; World Bank, 2013a).
Me size of private capital Oows to South Asia is also much lower than to every other developing
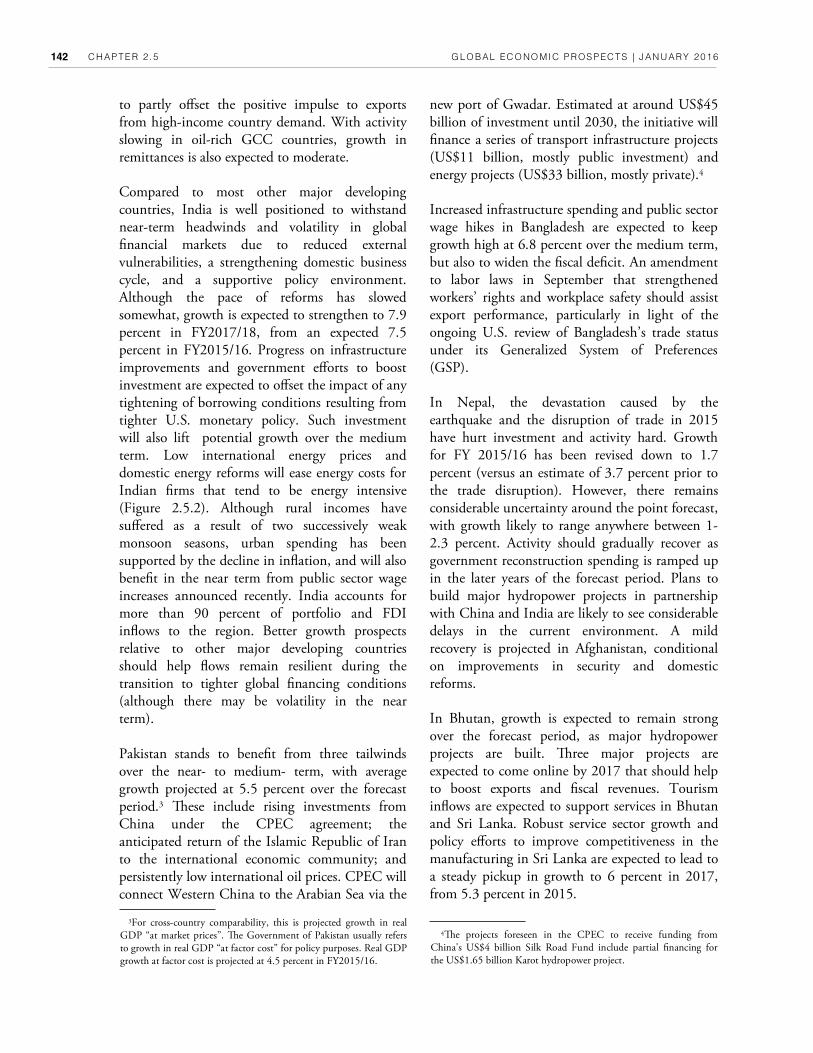
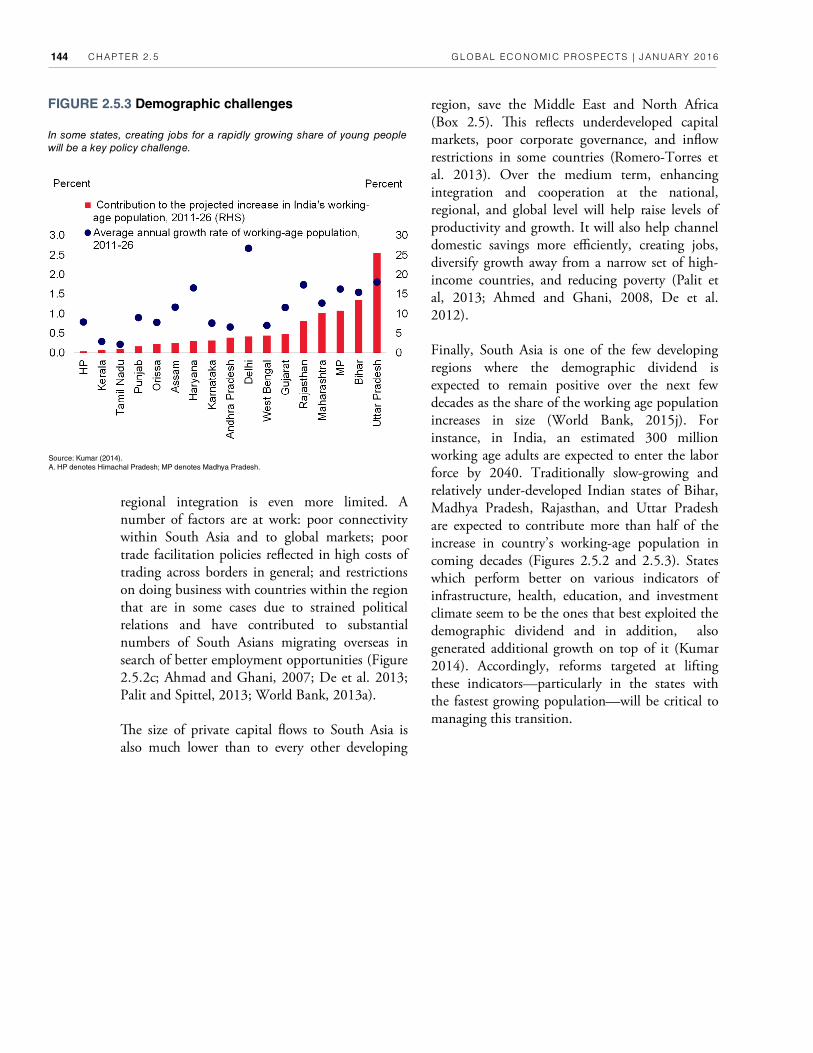
Source: Kumar (2014).
A. HP denotes Himachal Pradesh; MP denotes Madhya Pradesh.
In some states, creating jobs for a rapidly growing share of young people
will be a key policy challenge.
FIGURE 2.5.3 Demographic challenges region, save the Middle East and North Africa (Box 2.5). Mis reOects underdeveloped capital markets, poor corporate governance, and inOow restrictions in some countries (Romero-Torres et al. 2013). Over the medium term, enhancing integration and cooperation at the national, regional, and global level will help raise levels of productivity and growth. It will also help channel domestic savings more eVciently, creating jobs, diversify growth away from a narrow set of high-income countries, and reducing poverty (Palit et al, 2013; Ahmed and Ghani, 2008, De et al. 2012).
Finally, South Asia is one of the few developing regions where the demographic dividend is expected to remain positive over the next few decades as the share of the working age population increases in size (World Bank, 2015j). For instance, in India, an estimated 300 million working age adults are expected to enter the labor force by 2040. Traditionally slow-growing and relatively under-developed Indian states of Bihar, Madhya Pradesh, Rajasthan, and Uttar Pradesh are expected to contribute more than half of the increase in country’s working-age population in coming decades (Figures 2.5.2 and 2.5.3). States which perform better on various indicators of infrastructure, health, education, and investment climate seem to be the ones that best exploited the demographic dividend and in addition, also generated additional growth on top of it (Kumar 2014). Accordingly, reforms targeted at lifting these indicators—particularly in the states with the fastest growing population—will be critical to managing this transition.
SOUTH AS IA GLOBAL ECONOMIC PROSPECTS | JANUARY 2016 145
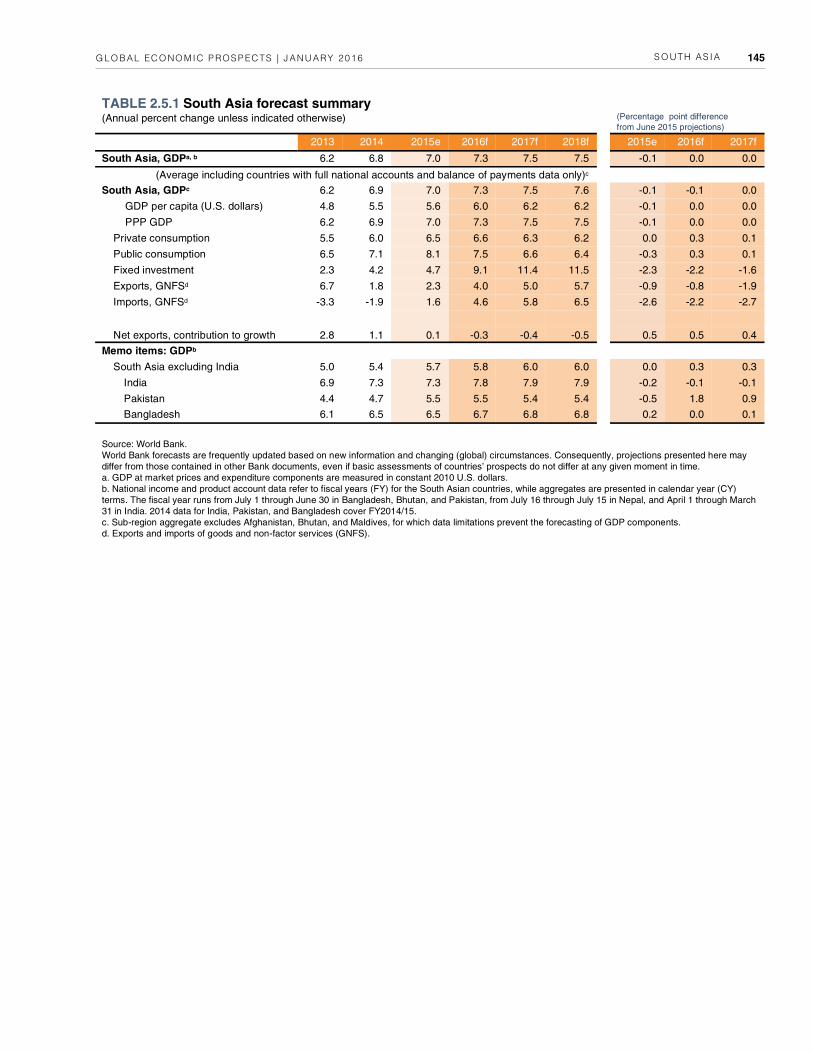
TABLE 2.5.1 South Asia forecast summary (Annual percent change unless indicated otherwise)
(Percentage point difference
from June 2015 projections) 2013 2014 2015e 2016f 2017f 2018f 2015e 2016f 2017f
South Asia, GDPa, b 6.2 6.8 7.0 7.3 7.5 7.5 -0.1 0.0 0.0
(Average including countries with full national accounts and balance of payments data only)c South Asia, GDPc 6.2 6.9 7.0 7.3 7.5 7.6 -0.1 -0.1 0.0 GDP per capita (U.S. dollars) 4.8 5.5 5.6 6.0 6.2 6.2 -0.1 0.0 0.0 PPP GDP 6.2 6.9 7.0 7.3 7.5 7.5 -0.1 0.0 0.0 Private consumption 5.5 6.0 6.5 6.6 6.3 6.2 0.0 0.3 0.1 Public consumption 6.5 7.1 8.1 7.5 6.6 6.4 -0.3 0.3 0.1 Fixed investment 2.3 4.2 4.7 9.1 11.4 11.5 -2.3 -2.2 -1.6 Exports, GNFSd 6.7 1.8 2.3 4.0 5.0 5.7 -0.9 -0.8 -1.9 Imports, GNFSd -3.3 -1.9 1.6 4.6 5.8 6.5 -2.6 -2.2 -2.7
Net exports, contribution to growth 2.8 1.1 0.1 -0.3 -0.4 -0.5 0.5 0.5 0.4 Memo items: GDPb South Asia excluding India 5.0 5.4 5.7 5.8 6.0 6.0 0.0 0.3 0.3 India 6.9 7.3 7.3 7.8 7.9 7.9 -0.2 -0.1 -0.1 Pakistan 4.4 4.7 5.5 5.5 5.4 5.4 -0.5 1.8 0.9 Bangladesh 6.1 6.5 6.5 6.7 6.8 6.8 0.2 0.0 0.1
Source: World Bank.
World Bank forecasts are frequently updated based on new information and changing (global) circumstances. Consequently, projections presented here may
differ from those contained in other Bank documents, even if basic assessments of countries’ prospects do not differ at any given moment in time.
a. GDP at market prices and expenditure components are measured in constant 2010 U.S. dollars.
b. National income and product account data refer to fiscal years (FY) for the South Asian countries, while aggregates are presented in calendar year (CY)
terms. The fiscal year runs from July 1 through June 30 in Bangladesh, Bhutan, and Pakistan, from July 16 through July 15 in Nepal, and April 1 through March
31 in India. 2014 data for India, Pakistan, and Bangladesh cover FY2014/15.
c. Sub-region aggregate excludes Afghanistan, Bhutan, and Maldives, for which data limitations prevent the forecasting of GDP components.
d. Exports and imports of goods and non-factor services (GNFS).
CHAPTER 2 .5 GLOBAL ECONOMIC PROSPECTS | JANUARY 2016 146
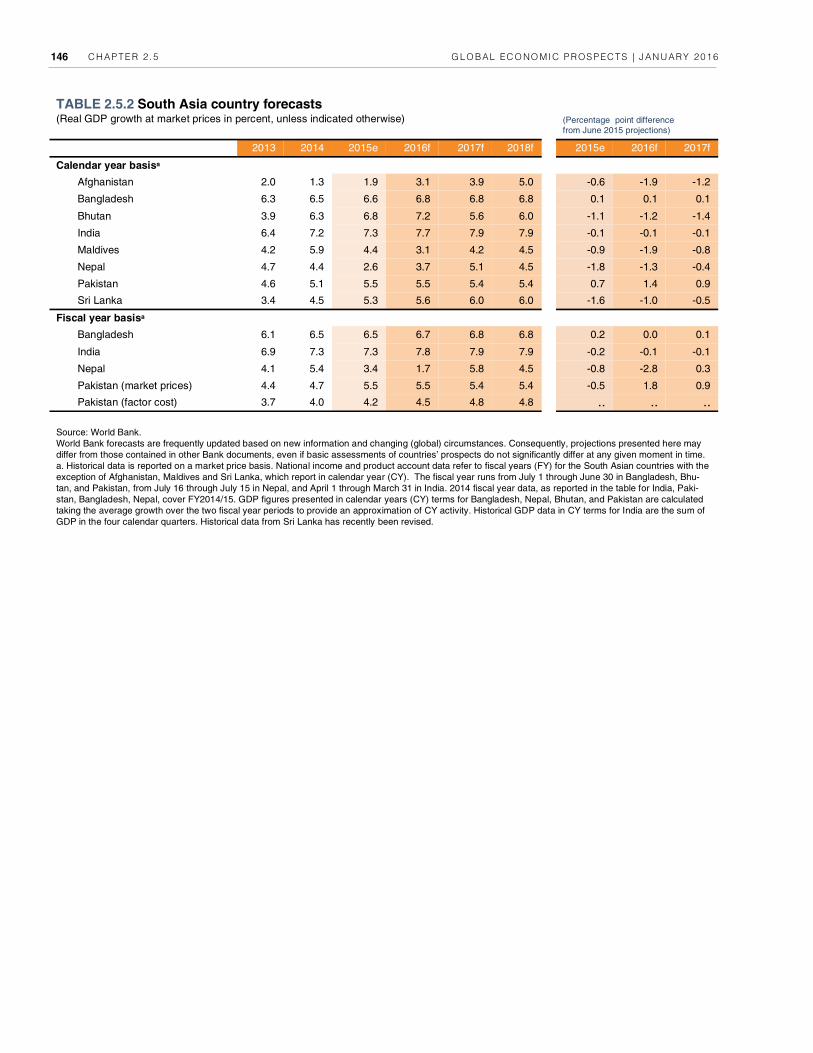
TABLE 2.5.2 South Asia country forecasts (Real GDP growth at market prices in percent, unless indicated otherwise)
(Percentage point difference from June 2015 projections)
2013 2014 2015e 2016f 2017f 2018f 2015e 2016f 2017f
Calendar year basisa
Afghanistan 2.0 1.3 1.9 3.1 3.9 5.0 -0.6 -1.9 -1.2
Bangladesh 6.3 6.5 6.6 6.8 6.8 6.8 0.1 0.1 0.1
Bhutan 3.9 6.3 6.8 7.2 5.6 6.0 -1.1 -1.2 -1.4
India 6.4 7.2 7.3 7.7 7.9 7.9 -0.1 -0.1 -0.1
Maldives 4.2 5.9 4.4 3.1 4.2 4.5 -0.9 -1.9 -0.8
Nepal 4.7 4.4 2.6 3.7 5.1 4.5 -1.8 -1.3 -0.4
Pakistan 4.6 5.1 5.5 5.5 5.4 5.4 0.7 1.4 0.9
Sri Lanka 3.4 4.5 5.3 5.6 6.0 6.0 -1.6 -1.0 -0.5
Fiscal year basisa Bangladesh 6.1 6.5 6.5 6.7 6.8 6.8 0.2 0.0 0.1
India 6.9 7.3 7.3 7.8 7.9 7.9 -0.2 -0.1 -0.1
Nepal 4.1 5.4 3.4 1.7 5.8 4.5 -0.8 -2.8 0.3
Pakistan (market prices) 4.4 4.7 5.5 5.5 5.4 5.4 -0.5 1.8 0.9
Pakistan (factor cost) 3.7 4.0 4.2 4.5 4.8 4.8 .. .. ..
Source: World Bank.
World Bank forecasts are frequently updated based on new information and changing (global) circumstances. Consequently, projections presented here may
differ from those contained in other Bank documents, even if basic assessments of countries’ prospects do not significantly differ at any given moment in time.
a. Historical data is reported on a market price basis. National income and product account data refer to fiscal years (FY) for the South Asian countries with the
exception of Afghanistan, Maldives and Sri Lanka, which report in calendar year (CY). The fiscal year runs from July 1 through June 30 in Bangladesh, Bhu-
tan, and Pakistan, from July 16 through July 15 in Nepal, and April 1 through March 31 in India. 2014 fiscal year data, as reported in the table for India, Paki-
stan, Bangladesh, Nepal, cover FY2014/15. GDP figures presented in calendar years (CY) terms for Bangladesh, Nepal, Bhutan, and Pakistan are calculated
taking the average growth over the two fiscal year periods to provide an approximation of CY activity. Historical GDP data in CY terms for India are the sum of
GDP in the four calendar quarters. Historical data from Sri Lanka has recently been revised.
SOUTH AS IA GLOBAL ECONOMIC PROSPECTS | JANUARY 2016 147
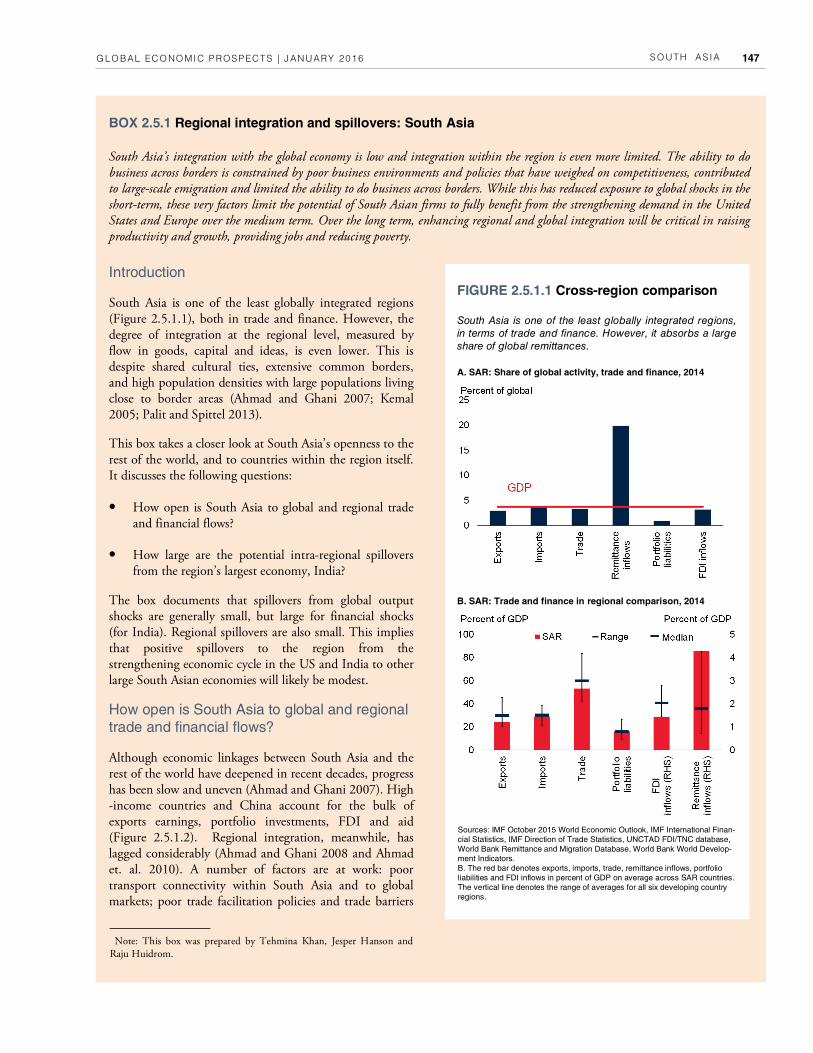
FIGURE 2.5.1.1 Cross-region comparison
BOX 2.5.1 Regional integration and spillovers: South Asia
South Asia’s integration with the global economy is low and integration within the region is even more limited. The ability to do business across borders is constrained by poor business environments and policies that have weighed on competitiveness, contributed to large-scale emigration and limited the ability to do business across borders. While this has reduced exposure to global shocks in the short-term, these very factors limit the potential of South Asian firms to fully benefit from the strengthening demand in the United States and Europe over the medium term. Over the long term, enhancing regional and global integration will be critical in raising productivity and growth, providing jobs and reducing poverty.
Sources: IMF October 2015 World Economic Outlook, IMF International Finan-
cial Statistics, IMF Direction of Trade Statistics, UNCTAD FDI/TNC database,
World Bank Remittance and Migration Database, World Bank World Develop-
ment Indicators.
B. The red bar denotes exports, imports, trade, remittance inflows, portfolio
liabilities and FDI inflows in percent of GDP on average across SAR countries.
The vertical line denotes the range of averages for all six developing country
regions.
A. SAR: Share of global activity, trade and finance, 2014
South Asia is one of the least globally integrated regions,
in terms of trade and finance. However, it absorbs a large
share of global remittances.
B. SAR: Trade and finance in regional comparison, 2014
Introduction
South Asia is one of the least globally integrated regions (Figure 2.5.1.1), both in trade and finance. However, the degree of integration at the regional level, measured by flow in goods, capital and ideas, is even lower. This is despite shared cultural ties, extensive common borders, and high population densities with large populations living close to border areas (Ahmad and Ghani 2007; Kemal 2005; Palit and Spittel 2013).
This box takes a closer look at South Asia’s openness to the rest of the world, and to countries within the region itself. It discusses the following questions:
• How open is South Asia to global and regional trade and financial flows?
• How large are the potential intra-regional spillovers from the region’s largest economy, India?
The box documents that spillovers from global output shocks are generally small, but large for financial shocks (for India). Regional spillovers are also small. This implies that positive spillovers to the region from the strengthening economic cycle in the US and India to other large South Asian economies will likely be modest.
How open is South Asia to global and regional trade and financial flows?
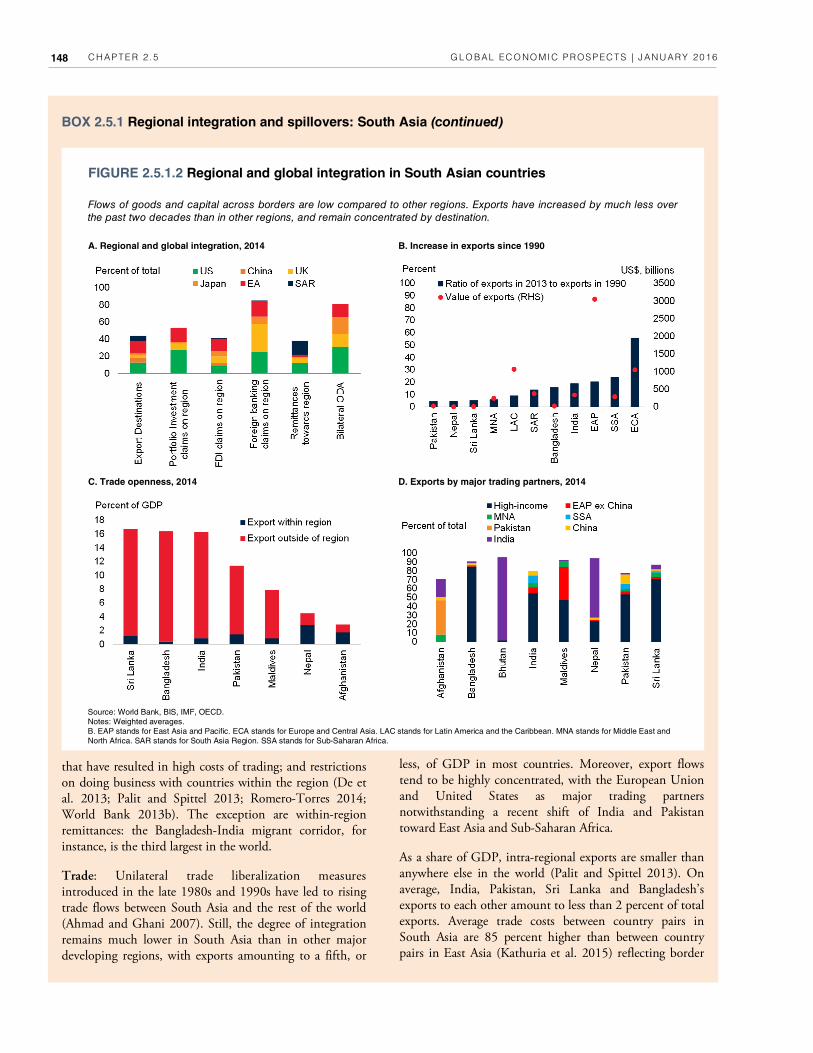
Although economic linkages between South Asia and the rest of the world have deepened in recent decades, progress has been slow and uneven (Ahmad and Ghani 2007). High-income countries and China account for the bulk of exports earnings, portfolio investments, FDI and aid (Figure 2.5.1.2). Regional integration, meanwhile, has lagged considerably (Ahmad and Ghani 2008 and Ahmad et. al. 2010). A number of factors are at work: poor transport connectivity within South Asia and to global markets; poor trade facilitation policies and trade barriers
Note: This box was prepared by Tehmina Khan, Jesper Hanson and Raju Huidrom.
CHAPTER 2 .5 GLOBAL ECONOMIC PROSPECTS | JANUARY 2016 148
that have resulted in high costs of trading; and restrictions on doing business with countries within the region (De et al. 2013; Palit and Spittel 2013; Romero-Torres 2014; World Bank 2013b). The exception are within-region remittances: the Bangladesh-India migrant corridor, for instance, is the third largest in the world.
Trade: Unilateral trade liberalization measures introduced in the late 1980s and 1990s have led to rising trade flows between South Asia and the rest of the world (Ahmad and Ghani 2007). Still, the degree of integration remains much lower in South Asia than in other major developing regions, with exports amounting to a fifth, or
less, of GDP in most countries. Moreover, export flows tend to be highly concentrated, with the European Union and United States as major trading partners notwithstanding a recent shift of India and Pakistan toward East Asia and Sub-Saharan Africa.
As a share of GDP, intra-regional exports are smaller than anywhere else in the world (Palit and Spittel 2013). On average, India, Pakistan, Sri Lanka and Bangladesh’s exports to each other amount to less than 2 percent of total exports. Average trade costs between country pairs in South Asia are 85 percent higher than between country pairs in East Asia (Kathuria et al. 2015) reflecting border
FIGURE 2.5.1.2 Regional and global integration in South Asian countries
Source: World Bank, BIS, IMF, OECD.
Notes: Weighted averages.
B. EAP stands for East Asia and Pacific. ECA stands for Europe and Central Asia. LAC stands for Latin America and the Caribbean. MNA stands for Middle East and
North Africa. SAR stands for South Asia Region. SSA stands for Sub-Saharan Africa.
A. Regional and global integration, 2014
Flows of goods and capital across borders are low compared to other regions. Exports have increased by much less over
the past two decades than in other regions, and remain concentrated by destination.
B. Increase in exports since 1990
C. Trade openness, 2014 D. Exports by major trading partners, 2014
BOX 2.5.1 Regional integration and spillovers: South Asia (continued)
SOUTH AS IA GLOBAL ECONOMIC PROSPECTS | JANUARY 2016 149
barriers, poor infrastructure and transport connectivity, and generally poor business environments. However, unofficial trade (in narcotics, but also illegal food trade in the Punjab) is reported to be significant (Fagan 2011). Estimates of the size of unofficial trade vary between countries (Taneja 2004), with recent studies placing the value of Indian exports to Pakistan at about $1.8 bn (or nearly 1 percent of GDP, Ahmed et. al. 2014). While the larger countries in the region predominantly trade outside the region, India is the dominant trading partner for the smallest countries in the region: Bhutan (mainly hydro-electricity), Nepal (textiles, agriculture, tourism) and Afghanistan (for which, Pakistan too is a major trading partner).1
Capital flows: Relative to GDP, capital flows to South Asia are lower than those to East Asia and the Pacific and Europe and Central Asia regions (Figure 2.5.1.3), reflecting underdeveloped capital markets as well as inflow restrictions in some countries (Romero-Torres et. al. 2013). They are dominated by banking sector flows, mainly from the United Kingdom. Financial integration is limited by restrictive domestic policies. For instance, in India, notwithstanding some gradual liberalization over the years, and in Sri Lanka non-resident holdings of government debt remain capped.
India receives over 90 percent of the region’s FDI and portfolio inflows, a substantial share of which originates from Mauritius and Singapore (low-tax countries with which India has double taxation treaties).2 In recent years FDI has tended to head into services rather than mining or industry (World Bank 2013a). China has made substantial investments into the region in recent years, in extractives in Afghanistan, renewable energy in Nepal, port construction in Sri Lanka, and manufacturing and infrastructure in Pakistan.
Within-region FDI accounts for only a small share of all FDI inflows. Bhutan, Nepal, Maldives and Sri Lanka do, however, receive non-negligible amounts of FDI from India. Cross-border investments from India have flowed into energy and public sector-linked investment in Nepal;
chemicals, food processing, banking and garments production in Bangladesh, and a similarly diverse range of sectors in Sri Lanka over the past decade (World Bank 2013a).
Remittances: South Asia’s diaspora stock is the largest among developing regions, and remittances exceed 6 percent of GDP in Pakistan, Sri Lanka, Nepal and Bangladesh. India is the largest recipient country in the world in terms of value of remittances (about $US 70 billion). By source, Gulf Cooperation Council (GCC) countries account for just over half of total remittances to the region, with the United States and United Kingdom also major source countries. Within-region migration flows are also substantial: the Bangladesh-India migrant corridor is the third largest in the world (after the Mexico-U.S. and Ukraine-Russia corridors), with more than 40 percent of Bangladeshi emigrants located in India. India also hosts large numbers of migrants from Bhutan, Nepal and Sri Lanka, and Pakistan from Afghanistan (World Bank 2015l).
Official development assistance: Although the bulk of aid flows to South Asia originate from OECD countries, among non-OECD countries both India and China are increasingly important sources of development finance (mixing grants, loans and project finance). The recently signed US$46 billion China Pakistan Economic Corridor (CPEC) agreement should see rising investment in energy, port and transport infrastructure in Pakistan over the next few years. India, meanwhile, allocates nearly two thirds of its foreign aid budget to Bhutan, and significant amounts to Nepal, Afghanistan, Sri Lanka and Bangladesh (Piccio 2015).
How large are the potential intra-regional spillovers from the region’s largest economy, India?
India’s sizeable remittances and FDI flows to neighboring countries may give rise to spillovers. To analyze spillovers within the region, a Bayesian structural vector autoregression model is estimated using quarterly data to 2015Q2 from 1998Q1 (Bangladesh) 2002Q2 (Sri Lanka) or 2001Q3 (Pakistan), the only countries in the region with sufficient data. The model focuses on the short- and medium term effects of negative growth shocks in India on other countries in the region. The estimation includes G7 country growth, the US federal funds rate, JP Morgan’s Emerging Market Bond Index, India’s growth, a trade-weighted commodity price index, and SAR country growth and real effective exchange rate. Data is available for Bangladesh, Pakistan, and Sri Lanka. For Bangladesh and
BOX 2.5.1 Regional integration and spillovers: South Asia (continued)
1Several countries run sizable merchandise trade deIcits with India, including Nepal, Bhutan, Bangladesh and Sri Lanka. Large imports from India mainly reOect capital goods (in Bhutan, related to hydropower investments), other production-side inputs and food in the smaller landlocked countries. In Bangladesh, for instance, these comprise mainly cotton for the garment sector, food and other consumer goods. 2FDI inOows from Mauritius and Singapore may also, indirectly, originate in India.

CHAPTER 2 .5 GLOBAL ECONOMIC PROSPECTS | JANUARY 2016 150
Pakistan, industrial production growth is used to proxy real GDP growth.
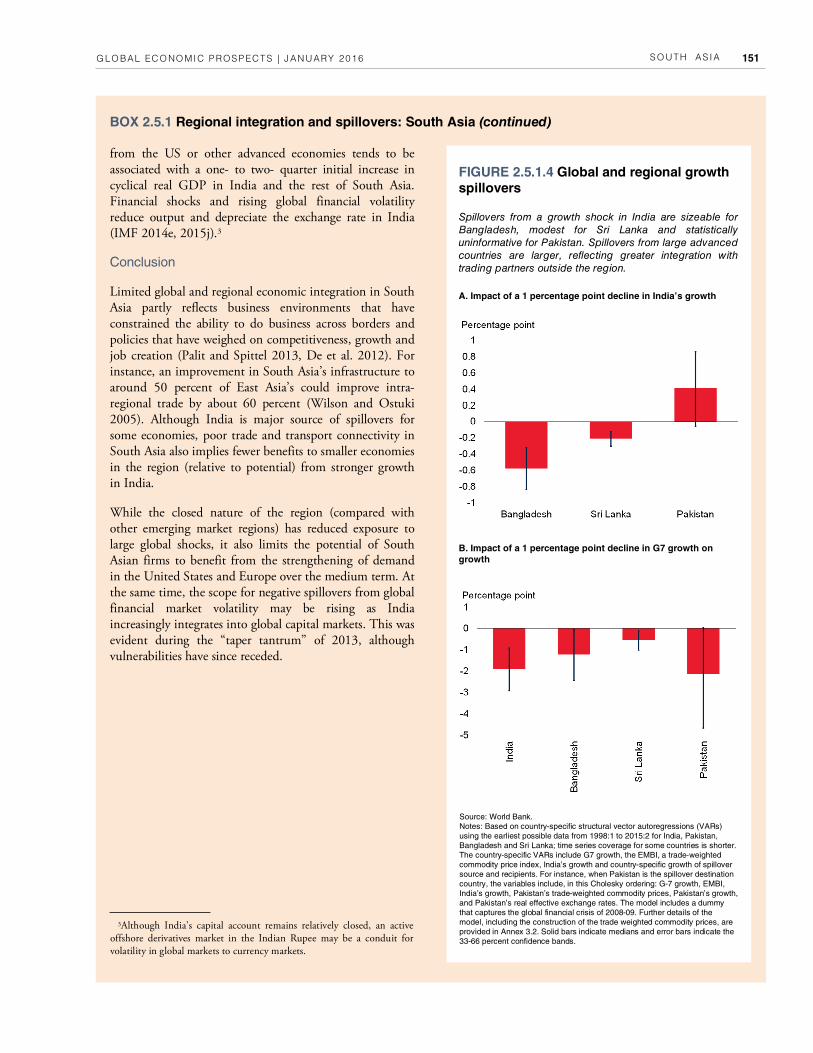
The estimates suggest that spillovers from a 1 percent negative growth shock in India result in a 0.6 percentage points decline in Bangladesh, and a 0.2 percentage points fall in Sri Lanka. There are no statistically significant spillovers for Pakistan (Figure 2.5.1.4). Other studies find positive, but modest, spillovers from India to Pakistan, Sri Lanka and Bangladesh (World Bank 2013b; IMF 2014e). Using a panel regression framework covering 1961-2009, Ding and Masha (2012) find that growth in India is useful in explaining overall growth in South Asia, but only after 1995, and that a 1 percentage point increase in India’s growth is associated with a 0.37 percentage point increase for South Asian countries.
Estimated within-region growth spillovers are smaller than those from the rest of the world to the region. A 1 percentage point decline in GDP growth in G-7 countries causes growth in India to fall by 1.7 percentage points. This is broadly in line with earlier findings that external spillovers to India are smaller than those in other more open economies in East Asia (Chapter 3, Box 3.5). They are, however, larger than other results in the literature that find that a 1 percentage point decline in U.S. GDP is associated with a 0.12 percent fall below baseline in India’s GDP (IMF 2014e). In Bangladesh and Sri Lanka, growth falls by 1.2 and 0.5 percentage points respectively in response to a 1 percent decline in global growth, and by 2 percentage points in Pakistan (although, as before, the last result is not statistically significant). This is consistent with World Bank (2013b) that finds that a positive impulse
FIGURE 2.5.1.3 Financial flows to SAR
Source: IMF, World Bank, BIS, UNCTAD.
Note: Weighted averages.
A.C.E. EA stands for Euro Area. EU stands for European Union. EAP stands for East Asia and Pacific. ECA stands for Europe and Central Asia. LAC stands for Latin Ameri-
ca and the Caribbean. MNA stands for Middle East and North Africa. SAR stands for South Asia Region. SSA stands for Sub-Saharan Africa.
F. Number above columns indicate total number of migrants in millions of people. GCC stands for Gulf Cooperation Council.
A. Capital flows to developing regions, 2014
Relative to GDP, capital flows to South Asia are smaller than to other major developing regions, excluding MNA. They are
dominated by banking sector flows, mainly from the United Kingdom. India receives over 90 percent of FDI inflows. South Asia’s
diaspora is the largest among developing regions, with a substantial number located in GCC countries.
B. Composition of capital flows to South Asia
C. BIS foreign claims on SAR by source
D. FDI flows by country, 2014 E. FDI inflows, 2003-11 F. South Asian migrants by destination, 2013
BOX 2.5.1 Regional integration and spillovers: South Asia (continued)
SOUTH AS IA GLOBAL ECONOMIC PROSPECTS | JANUARY 2016 151
from the US or other advanced economies tends to be associated with a one- to two- quarter initial increase in cyclical real GDP in India and the rest of South Asia. Financial shocks and rising global financial volatility reduce output and depreciate the exchange rate in India (IMF 2014e, 2015j).3
Conclusion
Limited global and regional economic integration in South Asia partly reflects business environments that have constrained the ability to do business across borders and policies that have weighed on competitiveness, growth and job creation (Palit and Spittel 2013, De et al. 2012). For instance, an improvement in South Asia’s infrastructure to around 50 percent of East Asia’s could improve intra-regional trade by about 60 percent (Wilson and Ostuki 2005). Although India is major source of spillovers for some economies, poor trade and transport connectivity in South Asia also implies fewer benefits to smaller economies in the region (relative to potential) from stronger growth in India.
While the closed nature of the region (compared with other emerging market regions) has reduced exposure to large global shocks, it also limits the potential of South Asian firms to benefit from the strengthening of demand in the United States and Europe over the medium term. At the same time, the scope for negative spillovers from global financial market volatility may be rising as India increasingly integrates into global capital markets. This was evident during the “taper tantrum” of 2013, although vulnerabilities have since receded.
BOX 2.5.1 Regional integration and spillovers: South Asia (continued)
3Although India’s capital account remains relatively closed, an active offshore derivatives market in the Indian Rupee may be a conduit for volatility in global markets to currency markets.
A. Impact of a 1 percentage point decline in India’s growth
Spillovers from a growth shock in India are sizeable for
Bangladesh, modest for Sri Lanka and statistically
uninformative for Pakistan. Spillovers from large advanced
countries are larger, reflecting greater integration with
trading partners outside the region.
FIGURE 2.5.1.4 Global and regional growth spillovers
B. Impact of a 1 percentage point decline in G7 growth on growth
Source: World Bank.
Notes: Based on country-specific structural vector autoregressions (VARs)
using the earliest possible data from 1998:1 to 2015:2 for India, Pakistan,
Bangladesh and Sri Lanka; time series coverage for some countries is shorter.
The country-specific VARs include G7 growth, the EMBI, a trade-weighted
commodity price index, India’s growth and country-specific growth of spillover
source and recipients. For instance, when Pakistan is the spillover destination
country, the variables include, in this Cholesky ordering: G-7 growth, EMBI,
India’s growth, Pakistan’s trade-weighted commodity prices, Pakistan’s growth,
and Pakistan’s real effective exchange rates. The model includes a dummy
that captures the global financial crisis of 2008-09. Further details of the
model, including the construction of the trade weighted commodity prices, are
provided in Annex 3.2. Solid bars indicate medians and error bars indicate the
33-66 percent confidence bands.
REFERENCES GLOBAL ECONOMIC PROSPECTS | JANUARY 2016 169
Arteta, C., M. A. Kose, F. Ohnsorge, and M. Stocker. 2015. “The Coming U.S. Interest Rate Tightening Cycle: Smooth Sailing or Stormy Waters?” Policy Research Note 15/02, World Bank, Washington, DC.
Asian Development Bank. 2015. Asian Development Outlook 2015 Update – Enabling Women, Energizing Asia. Manila, Philippines: Asian Development Bank.
Baffes, J., M. A. Kose, F. Ohnsorge, and M. Stocker. 2015. “The Great Plunge in Oil Prices: Causes, Consequences, and Policy Responses.” Policy Research Note 15/01, World Bank, Washington, DC.
Baier, S. L., and J. H. Bergstrand. 2009. “Estimating the Effects of Free Trade Agreements on International Trade Flows using Matching Econometrics.” Journal o f International Economics 77(1):63-76.
Basdevant, O., M. A. W. Jonelis, M. B. Mircheva, and M. S. T. Slavov. 2014. "The Mystery of Missing Real Spillovers in Southern Africa: Some Facts and Possible Explanations." African Department Working Paper 14/03, International Monetary Fund, Washington, DC.
Bayoumi, T., and F. Ohnsorge. 2013. “Do Inflows or Outflows Dominate? Global Implications of Capital Account Liberalization in China.” IMF Working Paper 13/189, International Monetary Fund, Washington. DC.
Balli, F., S. A. Basher, and R. J. Louis. 2013. “Risk Sharing in the Middle East and North Africa.” Economics o f Transition 21 (1): 135-55.
Balli, F., H. R. Hajhoj, S. A. Basher, and H. B. Ghassan. 2015. “An Analysis of Returns and Volatility Spillovers and their Determinants in Emerging Asian and Middle Eastern Countries.” International Review of Economics & Finance 39 (September): 311-25.
Behar, A., and J. Espinosa-Bowen. 2014. “Export Spillovers from Global Shocks for the Middle East and Central Asia.” IMF Working Paper 14/80, International Monetary Fund, Washington, DC.
References
Abdih Y., A. Barajas, R. Chami, and C. Ebeke. 2012. “Remittances Channel and Fiscal Impact in the Middle East, North Africa and Central Asia.” IMF Working Papers 12/104, International Monetary Fund, Washington, DC.
Acharya, V., S. Cecchetti, J. De Gregorio, S. Kalemli-Özcan, P. Lane, and U. Panizza. 2015. “Corporate Debt in Emerging Economies: A Threat to Financial Stability?” Brookings Institution, Washington, DC.
Adler, G., and S. Sosa. 2014. “Intraregional Spillovers in South America: Is Brazil Systemic After All?” The World Economy 37 (3): 456-80.
African Development Bank and Organization for Economic Cooperation and Development. 2010. “Public Resource Mobilization and Aid in Africa.” In African Economic Outlook. Paris: Organization for Economic Cooperation and Development; Tunis: African Development Bank.
Afrika, J-G., and G. Ajumbo. 2012. “Informal Cross Border Trade in Africa: Implications and Policy Recommendations.” Africa Economic Brief 3 (10), African Development Bank, Abidjan, Côte d'Ivoire.
Ahmed, S., and E. Ghani, eds. 2007. South Asia: Growth and Regional Integration. New Delhi: Macmillan.
______. 2008. “Making Regional Cooperation Work for South Asia's Poor.” Policy Research Working Paper 4736, World Bank, Washington, DC.
Ahmed, S., S. Kelegama, and E. Ghani. 2010. Promoting Economic Cooperation in South Asia: Beyond SAFTA. New Delhi: Sage Publications.
Ahuja, A., and M. Nabar. 2012. “Investment-Led Growth in China: Global Spillovers.” IMF Working Paper 12/267, International Monetary Fund, Washington, DC.
Aiolfi, M., L. A. V. Catão, and A. Timmermann. 2011. “Common Factors in Latin America’s Business Cycles.” Journal o f Development Economics 95 (2): 212-28.
CHAPTER 2 GLOBAL ECONOMIC PROSPECTS | JANUARY 2016 170
the World Economy and Business Cycles in Latin America.” Economía 12 (2): 1-75.
Chishti, M., and F. Hipsman. 2015. “In Historic Shift, New Migration Flows from Mexico Fall Below Those From China and India.” Migration Policy Institute Policy Beat. May 21, 2015.
Chete, N. L., and A. O. Adewuyi. 2012. “Dynamics of Trade between Nigeria and other ECOWAS Countries.” In Accelerating Growth Through Improved Intra-African Trade. Washington, DC: Brookings Institution.
China Outbound Tourism Research Institute. 2015. Chinese Outbound Tourism 2.0. Hamburg: China Outbound Tourism Research Institute.
Chinn, M. and H. Ito. 2006. “What Matters for Financial Development? Capital Controls, Institutions, and Interactions.” Journal o f Development Economics 81(1): 163–92.
Clinton, K., M. Johnson, J. Benes, D. Laxton, and T. Matheson. 2010. “Structural Models in Real Time.” IMF Working Papers 10/56, International Monetary Fund, Washington, DC.
Connolly, M. P., and J. Gunther. 1999. “Mercosur: Implications for Growth in Member Countries.” Current Issues in Economics and Finance 5(7).
Cuevas, A., M. Messmacher, and A. Werner. 2002. “Changes in the Patterns of External Financing in Mexico Since the Approval of NAFTA.” Working Paper, Central Bank of Mexico, Mexico City.
______. 2003 “Macroeconomic Synchronization Between Mexico and its NAFTA Partners.” Working Paper 2003-01, Banco de México, Mexico City.
Dabla-Norris, E., J. Brumby, A. Kyobe, Z. Mills, and C. Papageorgiou. 2011. “Investing in Public Investment: An Index of Public Investment Efficiency.” IMF Working Paper 11/37, International Monetary Fund, Washington, DC.
De la Torre, A., T. Dider, A. Ize, D. Lederman, and S. L. Schmukler. 2015. Latin America and the Rising South: Changing World, Changing Priorities. Washington, DC: World Bank.
Blanchard, O. 2014. “Where Danger Lurks.” Finance & Development 51 (3): 28-31.
Boschi M., and A. Girardi. 2011. “The Contribution of Domestic, Regional and International Factors to Latin America’s Business Cycle.” Economic Modelling 28: 1235–46.
Camacho, M. and G. Perez-Quiros. 2013. “Commodity Prices and the Business Cycle in Latin America: Living and Dying by Commodities?” Working Paper 1304, Bank of Spain, Madrid.
Calì, M., W. Harake, F. Hassan, and C. Struck. 2015. “The Impact of the Syrian Conflict on Lebanese Trade.” Working Paper 96087, World Bank, Washington, DC.
Canales Kriljenko, J., F. Gwenhamo, and S. Thomas. 2013. “Inward and Outward Spillovers in the SACU Area.” IMF Working Paper 13/31, International Monetary Fund, Washington, DC.
Canales Kriljenko, J., M. Hosseinkouchack, and A. M. Cirkel. 2014. “Global Financial Transmission into Sub-Saharan Africa—A Global Vector Autoregression.” IMF Working Paper 14/241, International Monetary Fund, Washington, DC.
Canova F., and P. Dallari. 2013. “How Important is Tourism for the International Transmission of Cyclical Fluctuations? Evidence from the Mediterranean.” European Central Bank Working Paper 1553, European Central Bank, Frankfurt.
Caporale, G. M., and A. Girardi. 2012. “Business Cycles, International Trade and Capital Flows: Evidence from Latin America.” Empirical Economics (February): 1-22.d
Cashin, P., K. Mohaddes, and M. Raissi. 2012. “The Global Impact of the Systemic Economies and MENA Business Cycles.” IMF Working Paper 12/255, International Monetary Fund, Washington, DC.
CBO (Congressional Budget Office). 2003. “The Effects of NAFTA on U.S.-Mexican Trade and GDP.” A CBO Paper, Congressional Budget Office, Washington, DC.
Cesa-Bianchi, A., M. H. Pesaran, A. Rebucci, T. Xu, and R. Chang. 2012. “China's Emergence in

REFERENCES GLOBAL ECONOMIC PROSPECTS | JANUARY 2016 171
Economic Commission for Latin America and the Caribbean.
Eichengreen, B., and A. Rose. 2003. “Does It Pay to Defend against a Speculative Attack?” In Managing Currency Crises in Emerging Markets, edited by M. Dooley and J. Frankel. Chicago, IL: University of Chicago Press.
EIU (Economist Intelligence Unit). 2015. “Americas Economy: A Looming El Niño Poses Severe Risks to Latin America.” October. London.
Estevadeordal, A. 2012. “Economic Integration in the Americas: An Unfinished Agenda.” In The Road to Hemispheric Cooperation: Beyond the Cartagena Summit of the Americas. Washington, DC: The Brookings Institution.
EBRD (European Bank for Reconstruction and Development). 2015a. Transition Report 2015-2016: Rebalancing Finance. London: European Bank for Reconstruction and Development.
______. 2015b. “Regional Economic Prospects in EBRD Countries of Operations: May 2015; In the Cross-currents of Diverging Monetary Policies and Russia's Recession.” European Bank for Reconstruction and Development, London.
European Commission (EC). 2015. “European Economic Forecast.” Institutional Paper 011, European Commission, Brussels.
Fagan, C. 2011. “Evidence of Illegal Cross-Border Flows of Funds, Goods and Services in South Asia and their Impact on Corruption.” U4 Anti-Corruption Resource Centre, CMI, Bergen, Norway.
Fajnzylber, P., and J. H. López. 2008. Remittances and Development: Lessons from Latin America. Washington, DC: World Bank.
Fiess, N. 2007. “Business Cycle Synchronization and Regional Integration: A Case Study for Central America.” World Bank Economic Review 21 (1): 49–72.
Fracasso, A. 2015. “Economic Rebalancing and Growth: The Japanese Experience and China’s Prospects.” Discussion Papers, Department of Economics and Management, University of Trento, Italy.
De la Torre, A., D. Lederman, and S. Pienknagura. 2015. “Doing it Right.” Finance and Development (September): 28-30.
De, P., S. Raihan, and E. Ghani. 2013. “What Does MFN Trade Mean for India and Pakistan? Can MFN be a Panacea?” Policy Research Working Paper 6483, World Bank, Washington, DC.
De, P., Raihan, S., and S. Kathuria. 2012. “Unlocking Bangladesh-India Trade: Emerging Potential and the Way Forward.” Policy Research Working Paper 6155, World Bank, Washington, DC.
Del Caprio, X. V., and M. Wagner. 2015. “The Impact of Syrian Refugees on the Turkish Labor Market.” Policy Research Working Paper 7402, World Bank, Washington, DC.
Ding, D. and I. Masha. 2012. “India's Growth Spillovers to South Asia.” IMF Working Paper No. 12/56, International Monetary Fund, Washington, DC.
Dobbs, R., S. Lund, J. Woetzel, and M. Mutafchieva. 2015. “Debt and (Not Much) Deleveraging.” McKinsey Global Institute.
Dollar, D., and A. Kraay. 2003. “Institutions, Trade, and Growth.” Journal o f Monetary Economics 50 (1): 133–62.
Drummond, P. F. N., and G. Ramirez. 2009. "Spillovers from the Rest of the World into Sub-Saharan African Countries." IMF Working Paper 09/155, International Monetary Fund, Washington, DC.
Duval, R. A., M. K. C. Cheng, K. H. Oh, R. Saraf, and M. D. Seneviratne. 2014. “Trade Integration and Business Cycle Synchronization: A Reappraisal with Focus on Asia.” IMF Working Paper 14/52, International Monetary Fund, Washington, DC.
Easterly, W., N. Fiess, and D. Lederman. 2003. “NAFTA and Convergence in North America: High Expectations, Big Events, Little Time.” Economia 4(1): 1-53.
ECLAC. 2014. Regional Integration: Towards an Inclusive Value Chain Strategy. Santiago, Chile:

CHAPTER 2 GLOBAL ECONOMIC PROSPECTS | JANUARY 2016 172
Economy.” In World Economic Outlook (Chapter 4). Washington, DC: International Monetary Fund.
_______. 2011a. “Japan: Spillover Report for the 2011 Article IV Consultation and Selected Issues.” International Monetary Fund, Washington, DC.
______. 2012a. Regional Economic Outlook: Western Hemisphere; Rebuilding Strength and Flexibility. Washington, DC: International Monetary Fund.
______. 2012b. “Nigeria and South Africa: Spillovers to the Rest of Sub-Saharan Africa.” In Regional Economic Outlook: Sub-Saharan Africa. Washington, DC: International Monetary Fund.
______. 2012c. “Saudi Arabia: Selected Issues.” IMF Country Report No 12/272, International Monetary Fund, Washington, DC.
______. 2013. “Output Synchronicity in the Middle East, North Africa, Afghanistan, and Pakistan and in the Caucasus and Central Asia.” In World Economic Outlook (Box 3.1). Washington, DC: International Monetary Fund.
______. 2014a. World Economic Outlook: Recovery Strengthens, Remains Uneven. Washington, DC: International Monetary Fund.
______. 2014b. “IMF Multilateral Policy Issues Report; Spillover Report.” IMF Policy Paper, International Monetary Fund, Washington, DC.
______. 2014c. Regional Economic Outlook Update: Middle East and Central Asia (May). International Monetary Fund, Washington, DC.
______. 2014d. “Potential Spillovers from Remittances from the Cooperation Council for the Arab States of the Gulf (GCC) and Russia.” In Spillover Report (Box 8). Washington, DC: International Monetary Fund.
______. 2014e. “India – Selected Issues.” IMF Country Report No 14/58. International Monetary Fund, Washington, DC.
______. 2014f. “Nigeria 2013 Article IV Consultation—Staff Report.” International Monetary Fund, Washington, DC.
______. 2015a. Regional Economic Outlook:
Freund, C., and M. Jaud. 2015. Champions Wanted: Promoting Exports in the Middle East and North Africa. Washington, DC: World Bank.
Gill, I. S., I. Izvorski, W. Van Eeghen, and D. De Rosa. 2014. Diversified Development: Making the Most of Natural Resources in Eurasia. Washington, DC: World Bank.
Gurara, D. Z., and M. Ncube. 2013. "Global Economic Spillovers to Africa: A GVAR Approach." Working Paper Series 183, African Development Bank, Tunis.
Husabø, E. 2014. “Spillovers to Europe from the Crisis in Russia and Ukraine.” Economic Commentaries Series 6, Norges Bank.
Hooley, J. 2013. “Bringing Down the Great Wall? Global Implications of Capital Account Liberalisation in China.” Quarterly Bulletin 2013, Q4. Bank of England, London.
Husain, A., R. Arezki, P. Breuer, V. Haksar, T. Helbling, P. Medas, and M. Sommer. 2015. “Global Implications of Lower Oil Prices.” IMF Staff Discussion Note 15/15, International Monetary Fund, Washington, DC.
Ianchovichina, E., S. Devarajan, and C. Lakatos. Forthcoming. “The Lifting of Sanctions on Iran: Global Effects and Strategic Responses.” Working Paper, World Bank, Washington, DC.
Ianchovichina, E., and M. Ivanic. 2014. “Economic Effects of the Syrian War and the Spread of the Islamic State on the Levant.” Policy Research Working Paper 7135, World Bank, Washington, DC.
Ilahi, N., F. M. Alturki, and J. Espinosa-Bowen. 2009. “How Russia Affects the Neighborhood: Trade, Financial, and Remittance Channels.” IMF Working Paper 09/277, International Monetary Fund, Washington, DC.
IDB (Inter-American Development Bank). 2015. The Labyrinth: How Can Latin America and the Caribbean Navigate the Global Economy. Washington, DC: Inter-American Development Bank.
International Monetary Fund. 2007. “Decoupling the Train? Spillovers and Cycles in the Global
REFERENCES GLOBAL ECONOMIC PROSPECTS | JANUARY 2016 173
Izquierdo, A., R. Romero, and E. Talvi. 2008. “Booms and Busts in Latin America: The Role of External Factors.” Working Paper 631, Inter-American Development Bank, Washington, DC.
Jelassi, T., A. B. Zeghal, and T. Malzy. 2015. “Fundamentally Changing the Way We Educate Students in the Middle East and North Africa (MENA) Region.” Working Paper, North Africa Policy Series, African Development Bank, Abidjan.
Kabundi, A., and E. Loots. 2007. “Co-movement Between South Africa and the Southern African Development Community: An Empirical Analysis.” Economic Modelling 24 (5): 737-48.
Kathuria, S., S. Sohaib, and M. J. Ferrantino. 2015. “How has Regional Integration Taken Place in Other Regions? Lessons for South Asia.” SARConnect Issue 2. World Bank, Washington, DC.
Keefer, P., and S. Knack. 2007. “Boondoggles, Rent-Seeking, and Political Checks and Balances: Public Investment under Unaccountable Governments.” Review of Economics and Statistics 89 (3): 566-72.
Kemal, A. R., 2005, “SAFTA and Economic Cooperation.” http://www.southasianmedia.net/conference/Regional_Conference/safta.htm
Khalifa, A., S. Hammoudeh, and E. Otranto. 2013. “Patterns of Volatility Transmission Within Regime Switching Across GCC and Global Markets.” International Review of Economics and Finance 29: 512-24.
Kim, M., Le Lesle, V., F. Ohnsorge, and S. Seshadri. 2014. “Why Complementarity Matters for Stability—Hong Kong SAR, China and Singapore as Asian Financial Centers.” IMF Working Paper 14/119, International Monetary Fund, Washington, DC.
Kinfack, C. E., and L. Bonga-Bonga. 2015. “Trade Linkages and Business Cycle Co-movement: An Empirical Analysis of Africa and its Main Trading Partners using Global VAR.” Economic Research Southern Africa (ESRA) Working Paper 512, Johannesburg.
Asia and Pacific. Washington, DC: International Monetary Fund.
______. 2015b. “2015 Spillover Report.” International Monetary Fund, Washington, DC.
______. 2015c. “People’s Republic of China: Staff Report for the 2015 Article IV Consultation.” International Monetary Fund, Washington, DC.
______. 2015d. “Malaysia 2015 Article IV Consultation—Staff Report.” International Monetary Fund, Washington, DC.
______. 2015e. “Thailand Article IV Consultations—Staff Report.” International Monetary Fund, Washington, DC.
______. 2015f. “Central, Eastern, and Southeastern Europe: Reconciling Fiscal Consolidation and Growth.” Regional Economic Issues series. November. International Monetary Fund, Washington, DC.
______. 2015g. Regional Economic Outlook: Middle East and Central Asia. (October). Washington, DC: International Monetary Fund.
______. 2015h. Regional Economic Outlook: Western Hemisphere; Northern Spring, Southern Chills. April. Washington, DC: International Monetary Fund.
______. 2015i. World Economic Outlook: Adjusting to Lower Commodity Prices Washington, DC: World IMF.
______. 2015j. Global Financial Stability Report: Vulnerabilities, Legacies, and Policy Challenges. Washington, DC: International Monetary Fund.
______. 2015k. “Spillovers from Surges in Global Financial Market Volatility: India.” IMF Country Report 15/62, International Monetary Fund, Washington, DC.
______. 2015l. Pan-African Banks: Opportunities and Challenges for Cross-Border Oversight. Washington, DC: International Monetary Fund.
Inoue, T., D. Kay, and H. Ohshige. 2015. “The Impact of China’s Slowdown on the Asia Pacific Region: An Application of the GVAR Model.” Policy Research Working Paper 7442, World Bank, Washington, DC.
CHAPTER 2 GLOBAL ECONOMIC PROSPECTS | JANUARY 2016 174
“Regional Integration: What in It for CARICOM?” BID-INTAL Working Paper 29.
Obiora, K. 2009. “Decoupling from the East Toward the West? Analyses of Spillovers to the Baltic Countries.” IMF Working Paper, 09/125, International Monetary Fund, Washington, DC.
OECD. 2009, “Participation in Global Value Chains (GVC).” http://www.oecd-ilibrary.org/trade/interconnected-economies/gvc-participation-index-2009_9789264189560-graph5-en.
______. 2015. “Participation in Global Value Chains (GVC).” https://data.oecd.org/trade/participation-in-global-value-chains-gvc.htm. Accessed on November 1, 2015.
Österholm, P., and J. Zettelmeyer. 2008. “The Effect of External Conditions on Growth in Latin America.” IMF Staff Papers 55 (4): 595-623.
Park, D., and K. Shin. 2015. “Financial Integration in Asset and Liability Holdings in East Asia.” ADB Economic Working Paper 444, Asian Development Bank, Manila, Philippines.
Palit, A., and G. Spittel, eds. 2013. South Asia in the New Decade: Challenges and Prospects. Singapore: World Scientific Singapore.
Piccio, L. 2015. “India's 2015-16 Foreign Aid Budget: Where the Money is Going?” DEVEX (blog). https://www.devex.com/news/india-s-2015-16-foreign-aid-budget-where-the-money-is-going-85666.
Rajaram, A., T. Minh Le, K. Kaiser, J-H. Kim, and J. Frank. 2014. The Power o f Public Investment Management: Transforming Resources into Assets for Growth. Washington, DC: World Bank.
Roache, S. K. 2008. “Central America’s Regional Trends and U.S. Cycles.” IMF Working Paper 08/50, International Monetary Fund, Washington, DC.
Romalis, J. 2007. “NAFTA’s and CUSFTA’s Impact on International Trade.” The Review of Economics and Statistics 89 (3): 416–35.
Romero-Torres, J., S. Wells, and S. Selwyn-Khan. 2013. Development of Capital Markets in Member Countries of the South Asian Association for Regional
Kose, M. A., C. Otrok, and C. H. Whiteman. 2003. “International Business Cycles: World, Region, and Country-Specific Factors.” American Economic Review 93(4): 1216–39.
Kose, M. A., A. Rebucci, and A. Schipke. 2005. “Macroeconomic Implications of CAFTA-DR”. In Central America: Global Integration and Regional Cooperation, edited by M. Rodlauer and A. Schipke.Washington, DC: International Monetary Fund.
Kose, M. A., G. M. Meredith, and C. M. Towe. 2005. “How Has NAFTA Affected the Mexican Economy? Review and Evidence.” In Monetary Policy and Macroeconomic Stabilization in Latin America. Berlin: Springer.
Kumar, U. 2014. “India's Demographic Transition: Boon or Bane?” Asia & the Pacific Policy Studies 1 (1): 186–203.
Lakatos, C., M. Maliszewska, and I. Osorio-Rodarte. 2015. “China’s Slowdown and Rebalancing: Potential Growth and Poverty Impacts on Sub-Saharan Africa.” Unpublished Paper, World Bank, Washington, DC.
Lam, R., X. Liu, and A. Schipke. “China’s Labor Market in the “New Normal.” IMF Working Paper 15/151, International Monetary Fund, Washington, DC.
Lederman, D., W. F. Maloney, and L. Servén. 2005. Lessons from NAFTA for Latin America and the Caribbean. The World Bank and Stanford University Press.
Loayza, N., H. Lopez, A. Ubide. 2001. “Comovements and Sectoral Interdependence: Evidence for Latin America, East Asia, and Europe.” IMF Staff Papers 48 (2): 367–96.
Lopez, J. H., and R. Shankar. 2011. Getting the Most Out of Free Trade Agreements in Central America. Washington, DC: World Bank.
Mejía-Reyes, P. 2004. “Classical Business Cycles in America: Are National Business Cycle Synchronised?” International Journal o f Applied Econometrics and Quantitative Studies 1 (3): 75–102.
Moreira, M. M., and E. Mendoza. 2007.

REFERENCES GLOBAL ECONOMIC PROSPECTS | JANUARY 2016 175
American Journal of Economics and Finance 14 (3): 319–342.
UNCTAD. 2015. World Investment Report 2015: Reforming International Investment Governance. United Nations Conference on Trade and Development. Geneva: United Nations Publications.
United Nations Conference on Trade and Development (UNCTAD). 2013. Economic Development in Africa—Intra-African Trade: Unlocking Private Sector Dynamism. New York: United Nations.
USTR (United States Trade Representative). 2015. USTR website. https://ustr.gov/trade-agreements/free-trade-agreements/cafta-dr-dominican-republic-central-america-fta.
Villarreal, M. A. 2012. “Mexico’s Free Trade Agreements.” CRS Report for Congress 7-5700, Congressional Research Service, Washington, DC.
Vivek, A., and A. Vamvakidis. 2010. “China’s Economic Growth: International Spillovers.” IMF Working Paper 10/165, International Monetary Fund, Washington, DC.
Wilson, J. S., and T. Ostuki. 2005. “Trade Facilitation and Regional Integration in South Asia: Accelerating the Gains to Trade with Capacity Building.” South Asia Region, World Bank, Washington DC.
World Bank. 2005. Global Economic Prospects: Trade, Regionalism, and Development. Washington, DC: World Bank.
______. 2012a. “Road Freight in Central America: Five Explanations to High Costs of Service Provision.” Background Paper, World Bank, Washington, DC.
______. 2012b. “Africa Can Help Feed Africa: Removing Barriers to Regional Trade in Food Staples.” World Bank, Washington, DC.
______. 2013a. “Trends and Determinants of Foreign Direct Investment in South Asia.” World Bank, Washington, DC.
______. 2013b. “South Asia Economic Focus, Fall 2013: A Wake Up Call.” World Bank, Washington, DC.
Cooperation. Mandaluyong City, Philippines: Asian Development Bank.
Rouis, M., S. Tabor, S. Migliorisi, E. Neumayer, and K. R. Kounetsron. 2010. Arab Development Assistance: Four Decades of Cooperation. Washington, DC: World Bank.
Rouis, M. 2013. “Response of the Arab Donors to the Global Financial Crisis and the Arab Spring.” MENA Quick Note Series 112, World Bank, Washington, DC.
Scholvin, S., and A. Malamud. 2014. “Is There a Geoeconomic Node in South America? Geography, politics and Brazil’s Role in Regional Economic Integration.” Working Paper 2014/2, Instituto de Ciências Sociais da Universidade de Lisboa, Spain.
Schiffbauer, M., A. Sy, S. Hussain, H. Sahnoun, and P. Keefer. 2015. Jobs or Privileges: Unleashing the Employment Potential of the Middle East and North Africa. Washington, DC: World Bank.
Shiells, C. R., M. Pani, and E. Jafarov. 2005. “Is Russia Still Driving Regional Economic Growth?” IMF Working Paper 05/192, International Monetary Fund, Washington, DC.
Stepanyan, A., A. Roitman, G. Manasyan, D. Ostojic, and N. Epstein. 2015. “The Spillover Effects of Russia’s Economic Slowdown on Neighboring Countries.” Departmental Paper, International Monetary Fund, Washington, DC.
Swiston, A. 2010. “Spillovers to Central America in Light of the Crisis: What a Difference a Year Makes.” IMF Working Paper 10/35, International Monetary Fund, Washington, DC.
Talani, L. S. 2014. The Arab Spring in the Global Political Economy. Basingstoke, UK: Palgrave Macmillan.
Taneja, N., and S. Pohit. 2005. “Informal Trade in India, Nepal, and Sri Lanka.” In Economic Development in South Asia, edited by Mohsin Khan. Noida, India: Tata McGraw-Hill.
Torres, A., and O. Vela. 2003. “Trade Integration and Synchronization Between the Business Cycles of Mexico and the United States.” North

CHAPTER 2 GLOBAL ECONOMIC PROSPECTS | JANUARY 2016 176
______. 2015k. “Europe and Central Asia Economic Update, October 2015: Low Commodity Prices and Weak Currencies.” World Bank, Washington, DC.
______. 2015l. “Migration and Development Brief 25.” World Bank, Washington, DC.
______. 2015m. “Sustaining Recovery, Improving Living Standards.” EU Regular Economic Report (2), Fall 2015, World Bank, Washington, DC.
______. 2015n. Global Economic Prospects: Having Fiscal Space and Using It. Washington, DC: World Bank.
______. 2015o. “Commodity Markets Outlook, October 2015: Understanding El Niño.” World Bank, Washington, DC.
______. 2015p. “MENA Economic Monitor, October 2015: Inequality, Uprisings, and Conflict in the Arab World.” World Bank, Washington, DC.
______. 2015q. “MENA Economic Monitor, April 2015: Towards a New Social Contract.” World Bank, Washington, DC.
______. 2015r. “Africa’s Pulse. Volume 12.” World Bank, Washington, DC.
______. 2016. Global Economic Prospects: Spillovers amid Weak Growth. Washington, DC: World Bank.
World Economic Forum. 2015. World Travel and Tourism Competitiveness Index 2015. World Economic Forum.
World Tourism Organization (UNWTO). 2015. “UNWTO Tourism Highlights, 2015 Edition.” World Tourism Organization, Madrid.
______. 2014a. “Costa Rica: Five Years After CAFTA-DR Assessing Early Results for the Costa Rican Economy.” World Bank, Washington, DC.
______. 2014b. Over the Horizon: A New Levant. Washington, DC: World Bank.
______. 2014c. “The Republic of Benin Diagnostic Trade Integration Study (DTIS) Update: From Rents to Competitiveness.” World Bank, Washington, DC.
______. 2015a. Global Economic Prospects: The Global Economy in Transition. Washington, DC: World Bank.
______. 2015b. “China Economic Update, June 2015.” World Bank, Washington, DC.
______. 2015c. “East Asia and Pacific Economic Update, October 2015: Staying the Course.” World Bank, Washington, DC.
______. 2015d. “Malaysia Economic Monitor, June 2015: Transforming Urban Transport.” World Bank. Washington, DC.
______. 2015e. “Indonesia Economic Quarterly, October 2015: In Times of Global Volatility.” World Bank, Washington, DC.
______. 2015f. Doing Business 2016: Measuring Regulatory Quality and Efficiency. Washington, DC: World Bank.
______. 2015g. “Mongolia Economic Update, November 2015.” World Bank, Washington, DC.
______. 2015h. “Taking Stock, July 2015: An Update on Vietnam’s Recent Economic Developments.” World Bank, Washington, DC.
______. 2015i. “Philippines Economic Update, January 2015: Making Growth Work for the Poor.” World Bank, Washington, DC.
_______. 2015j. Global Monitoring Report 2015/2016: Development Goals in an Era of Demographic Change. Washington, DC: World Bank.