Embed Size (px)
Citation preview
RECENT DEVELOPMENTS IN THE ENERGY MODEL TIMES-CANADA:
FOCUS ON THE UNCONVENTIONAL GAS PRODUCTION UNTIL 2050
Energy and Environment (E2G) Team
GERAD Research Center
Montreal, QC, Canada
ETSAP Workshop, November 9th , 2011

TIMES-Canada
Base year: 2007Horizon: 2050 (energy) Horizon: 2100 (climate)
Regions: 13 provinces and territories
Time slices- 4 seasons: Spring, Summer, Fall, Winter- 3 day periods: Day, Night, Peak
Start Mid End Length
1 2007 2007 2007 1
2 2008 2008 2009 2
3 2010 2010 2011 2
4 2012 2012 2013 2
5 2014 2015 2017 4
6 2018 2020 2022 5
7 2023 2025 2027 5
8 2028 2030 2032 5
9 2033 2040 2047 15
10 2048 2050 2052 5

Power & Heat
Cogeneration PlantsThermal, Nuclear
Renewables, Biomass International ExportsCrude oil, RPP, Biomass
Gas, Coal, H2, LNG
Domestic Trades-Pipelines
-Transmission
IND (8) - Tons
Iron & Steel, Cement
Chemicals, Copper
Demand for
Energy Service
End-Use
Technologies
Production / Conversion
Technologies
Primary
Energy
Primary Energy Final Energy Useful Energy
DM 2050Oil prices (3)
Elasticities
DM 2100Growth (2)
Elasticities
COM (7) - PJ/m2
Heating, Cooling
Lighting, Appliances
RSD (20) - PJ/unit
Heating, Cooling
Lighting, Appliances
TRA (16) - Pkm/Tkm
Road: short/long dist.
Rail, Marine, Air
AGR (1) - PJ
IND ProductionFurnaces, Boilers
Machinery
COM ServicesFurnaces, AC,
Fluorescents, Etc.
RSD DwellingsHeat Pumps, Lamps
Freezers, Ranges
TRA VehiclesCars, trucks, buses
Trains, Ships, Planes
-TrucksAGR Process
Refineries
Hydrogen Plants
Biomass PlantsSolid: pellet, wood
Liquid: biofuels
Gaseous: biogas
Coke Plants
Renewable PotentialsHydro, Wave, Tidal
Wind, Solar, Geo
Ocean Thermal & Salinity
Biomass PotentialsCrops: Starch, Oilseeds
Greasy residues
Lignocellulosic sources
Dedicated crops
Waste, Biogas, Algae
Fossil Fuel ReservesConventional & Oil sands
Crude oil, Gas, Coal
Uranium & Lithium
Reserves
ScenariosEnergy policies
Climate policies
International ImportsCrude oil, RPP, Biomass
Gas, Coal, H2
GHG Emissions
Combustion, Process
CCS
LNG Regasification
CAC Emissions
Extraction Oil, Gas, Coal
LNG Liquefaction
LNG Imports
CCS
Carbon sequestration
EOR, Aquifers, Afforestation

Oil prices for 4 base cases, 2000-2050
0
50
100
150
200
250
300
350
2007 2014 2021 2028 2035 2042 2049
$U
S 2
008 / b
arr
el
New Plus
NEB 2009 Central
NEB 2009 Low
NEB 2009 High
CEO 2006 Central
IEO 2010 Central
IEO 2010 Low
IEO 2010 High
WEO 2010 Reference
WEO 2010 Policy
WEO 2010 Policy
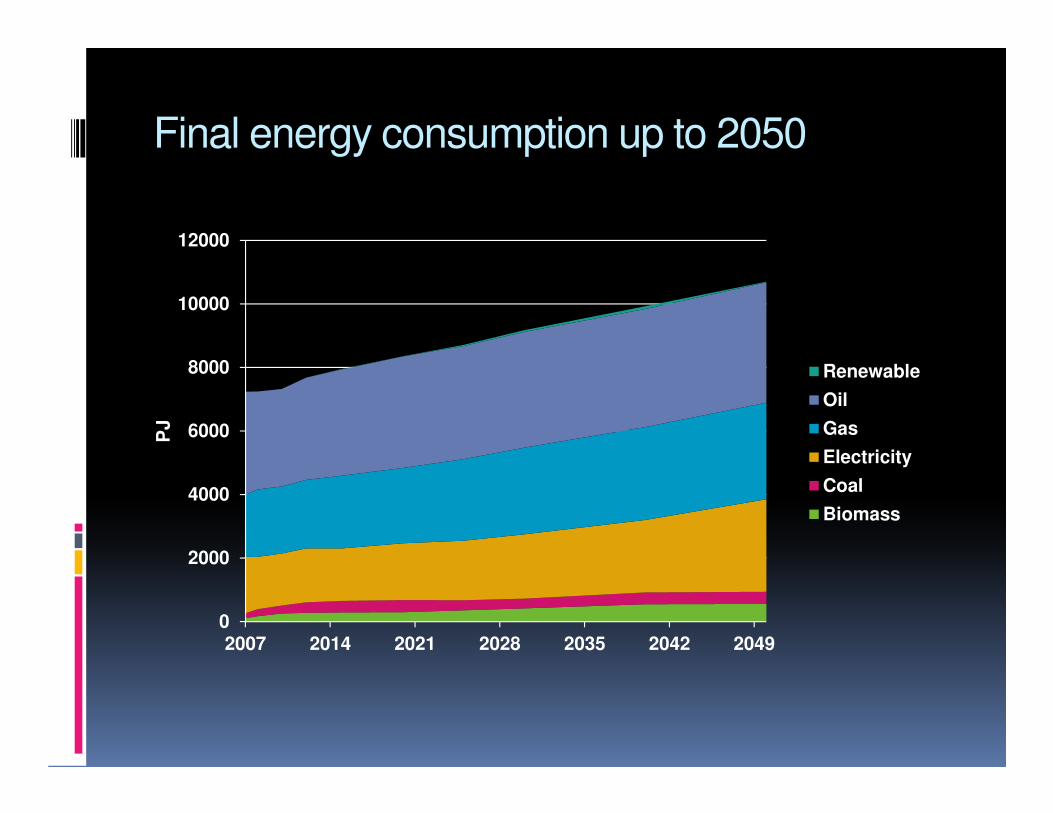
Final energy consumption up to 2050
0
2000
4000
6000
8000
10000
12000
2007 2014 2021 2028 2035 2042 2049
PJ
Renewable
Oil
Gas
Electricity
Coal
Biomass
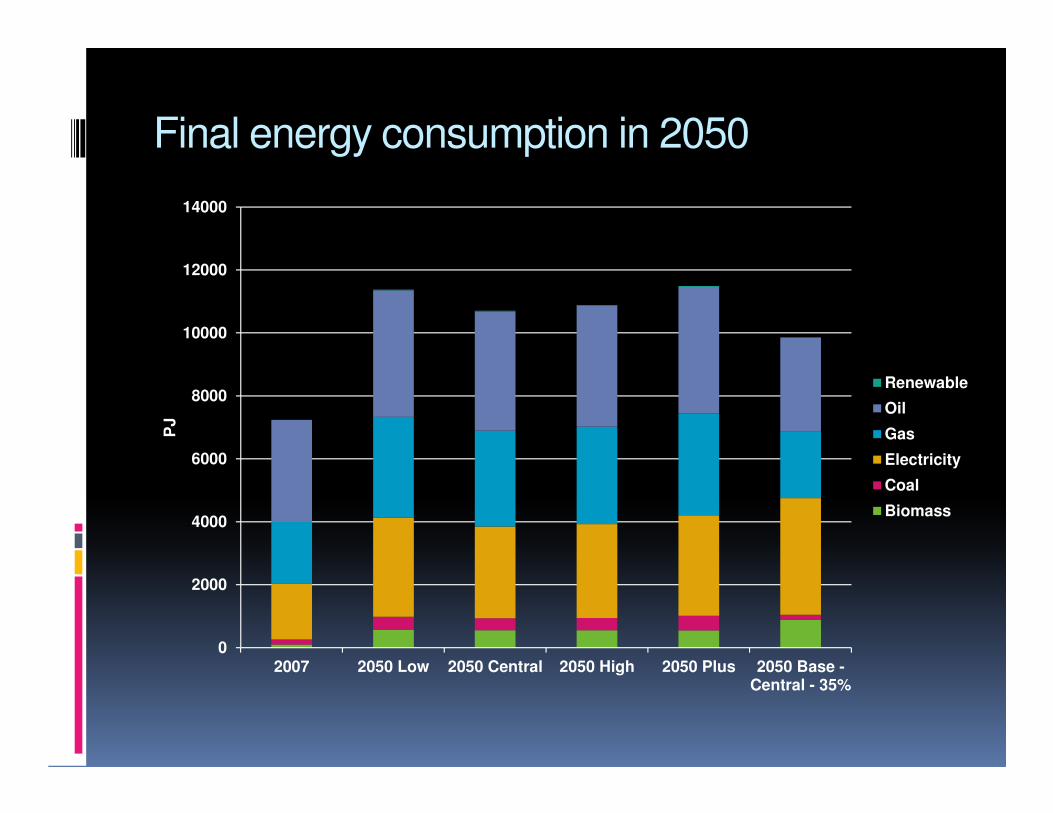
Final energy consumption in 2050
0
2000
4000
6000
8000
10000
12000
14000
2007 2050 Low 2050 Central 2050 High 2050 Plus 2050 Base -Central - 35%
PJ
Renewable
Oil
Gas
Electricity
Coal
Biomass
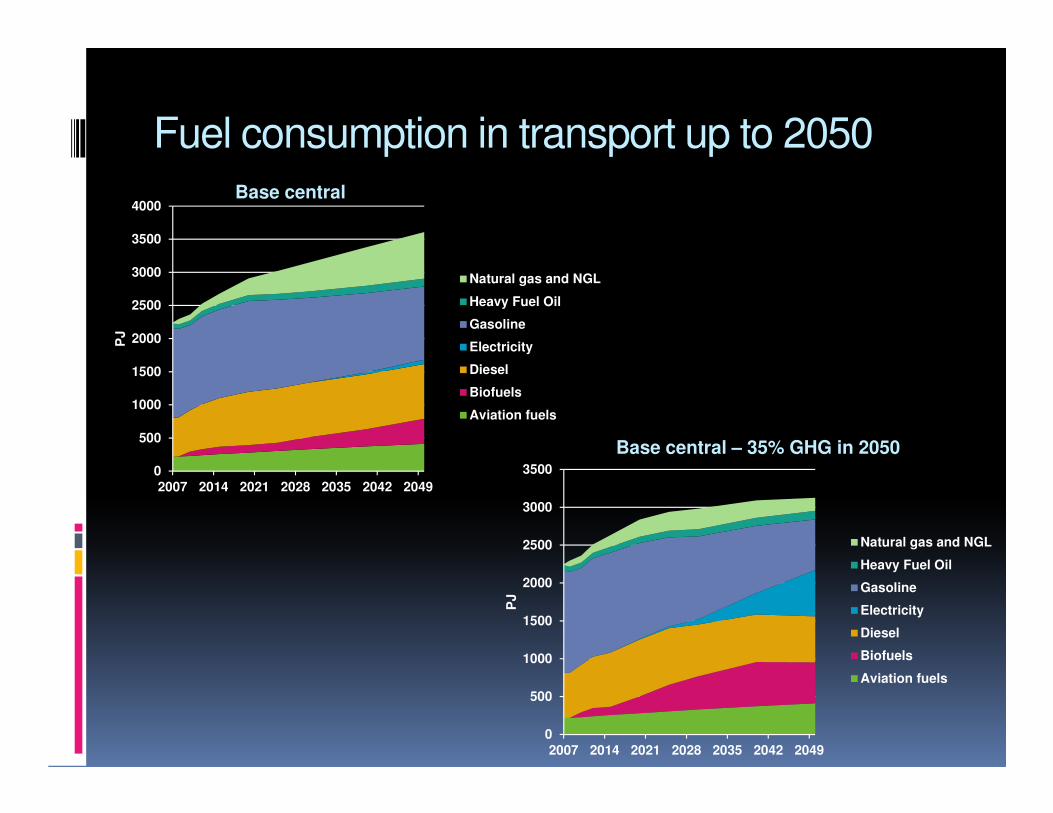
Fuel consumption in transport up to 2050
0
500
1000
1500
2000
2500
3000
3500
4000
2007 2014 2021 2028 2035 2042 2049
PJ
Natural gas and NGL
Heavy Fuel Oil
Gasoline
Electricity
Diesel
Biofuels
Aviation fuels
0
500
1000
1500
2000
2500
3000
3500
2007 2014 2021 2028 2035 2042 2049
PJ
Natural gas and NGL
Heavy Fuel Oil
Gasoline
Electricity
Diesel
Biofuels
Aviation fuels
Base central
Base central – 35% GHG in 2050
CARBON CAPTURE AND SEQUESTRATION (CCS) MODULE
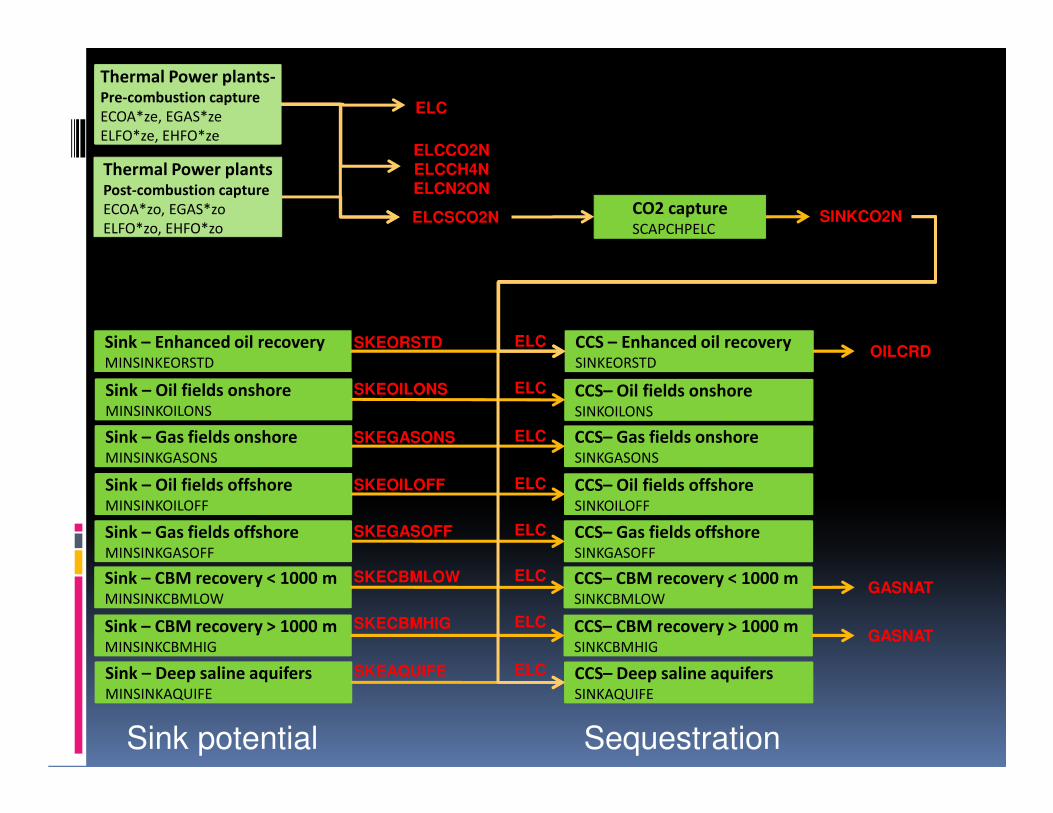
SKEORSTD
ELC
Thermal Power plantsPost-combustion capture
ECOA*zo, EGAS*zo
ELFO*zo, EHFO*zo
Thermal Power plants-Pre-combustion capture
ECOA*ze, EGAS*ze
ELFO*ze, EHFO*ze
GASNAT
ELCCO2NELCCH4NELCN2ON
ELCSCO2NCO2 captureSCAPCHPELC
SINKCO2N
OILCRD
Sink – Oil fields onshoreMINSINKOILONS
Sink – Gas fields onshoreMINSINKGASONS
Sink – Oil fields offshoreMINSINKOILOFF
Sink – Gas fields offshoreMINSINKGASOFF
Sink – Deep saline aquifersMINSINKAQUIFE
Sink – CBM recovery < 1000 mMINSINKCBMLOW
Sink – CBM recovery > 1000 mMINSINKCBMHIG
Sink – Enhanced oil recovery MINSINKEORSTD
CCS– Oil fields onshoreSINKOILONS
CCS– Gas fields onshoreSINKGASONS
CCS– Oil fields offshoreSINKOILOFF
CCS– Gas fields offshoreSINKGASOFF
CCS– Deep saline aquifersSINKAQUIFE
CCS– CBM recovery < 1000 mSINKCBMLOW
CCS– CBM recovery > 1000 mSINKCBMHIG
CCS – Enhanced oil recovery SINKEORSTD
Sink potential Sequestration
GASNAT
SKEOILONS
SKEGASONS
SKEOILOFF
SKEGASOFF
SKECBMLOW
SKECBMHIG
SKEAQUIFE
ELC
ELC
ELC
ELC
ELC
ELC
ELC
ELC
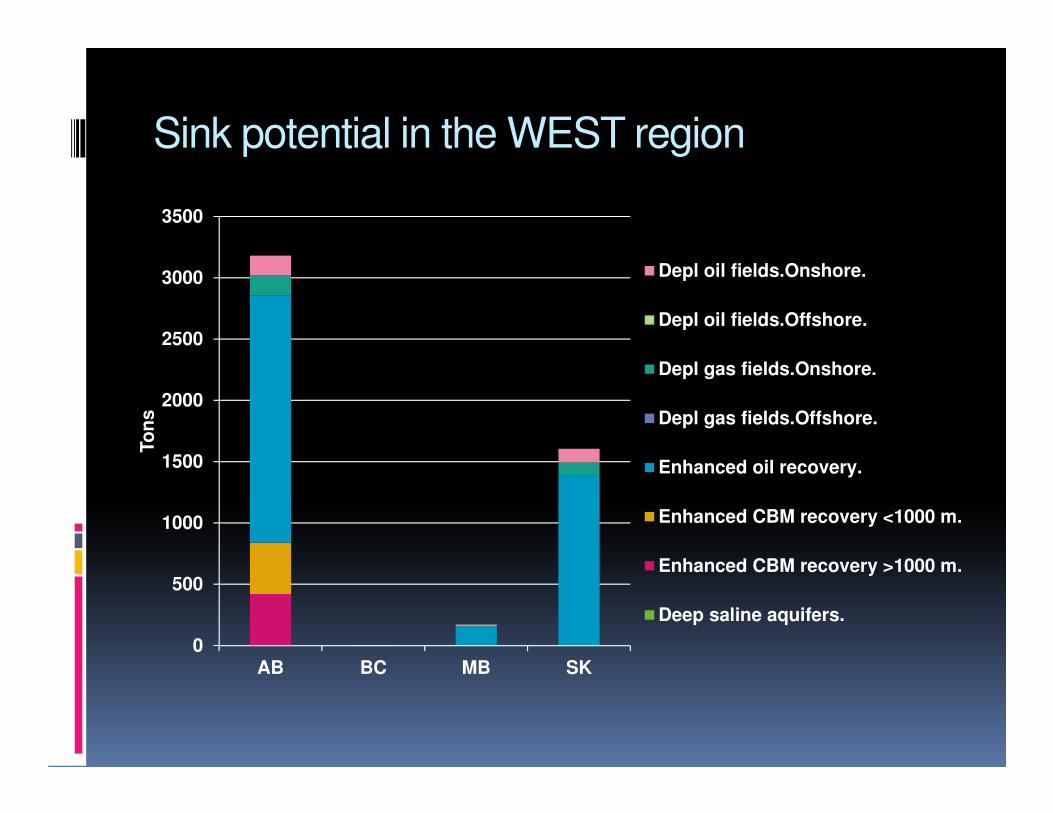
Sink potential in the WEST region
0
500
1000
1500
2000
2500
3000
3500
AB BC MB SK
To
ns
Depl oil fields.Onshore.
Depl oil fields.Offshore.
Depl gas fields.Onshore.
Depl gas fields.Offshore.
Enhanced oil recovery.
Enhanced CBM recovery <1000 m.
Enhanced CBM recovery >1000 m.
Deep saline aquifers.
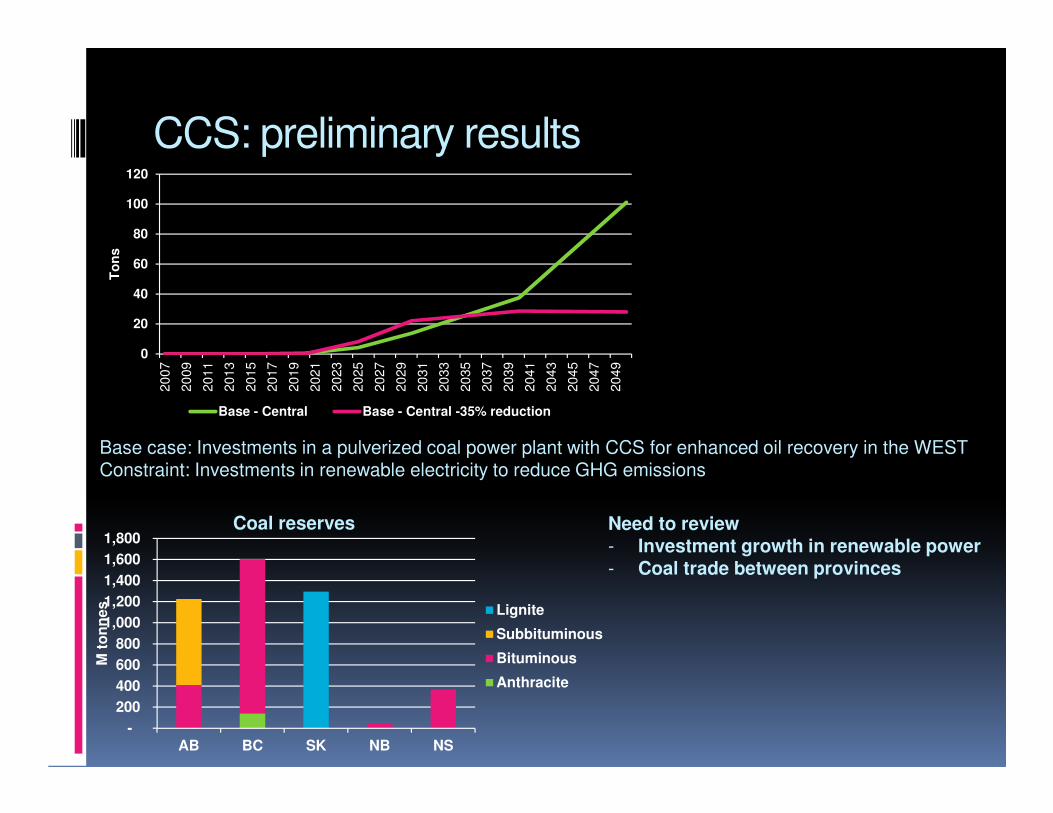
CCS: preliminary results
Base case: Investments in a pulverized coal power plant with CCS for enhanced oil recovery in the WESTConstraint: Investments in renewable electricity to reduce GHG emissions
-
200
400
600
800
1,000
1,200
1,400
1,600
1,800
AB BC SK NB NS
M t
on
nes Lignite
Subbituminous
Bituminous
Anthracite
Coal reserves Need to review - Investment growth in renewable power- Coal trade between provinces
0
20
40
60
80
100
12020
07
20
09
20
11
20
13
20
15
20
17
20
19
20
21
20
23
20
25
20
27
20
29
20
31
20
33
20
35
20
37
20
39
20
41
20
43
20
45
20
47
20
49
To
ns
Base - Central Base - Central -35% reduction

LIQUEFIED NATURAL GAS (LNG) MODULE
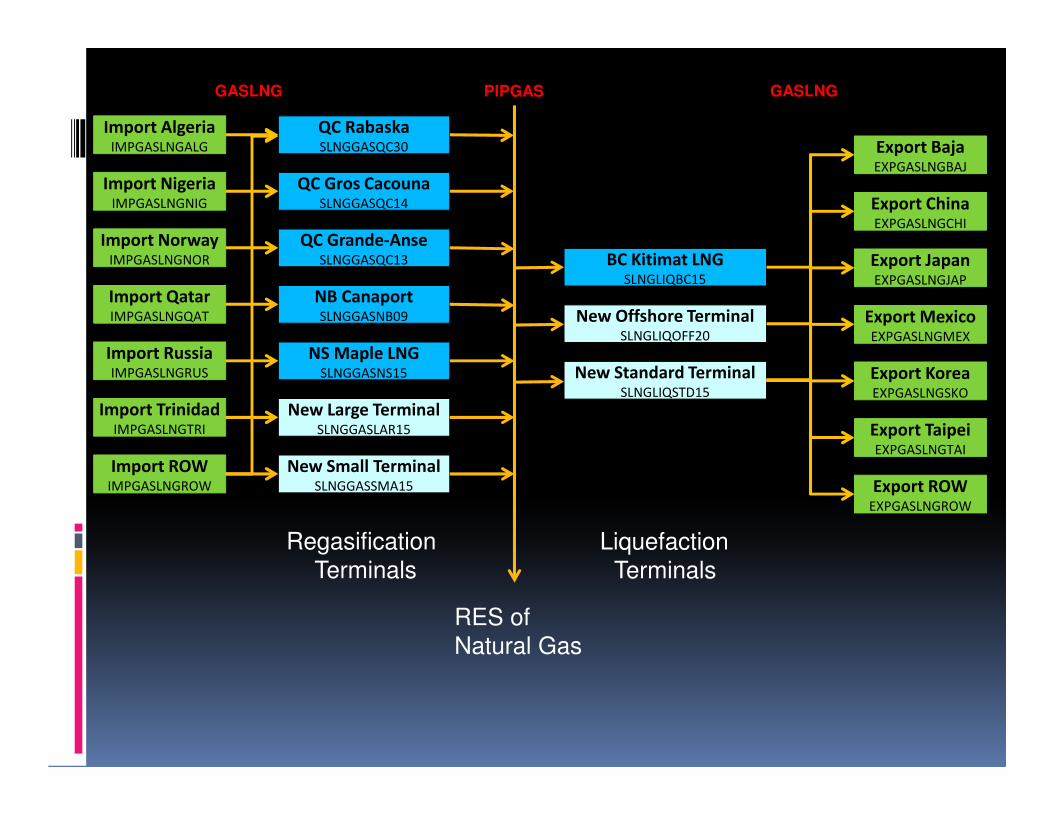
QC RabaskaSLNGGASQC30
New Large TerminalSLNGGASLAR15
New Small TerminalSLNGGASSMA15
Import AlgeriaIMPGASLNGALG
Import NigeriaIMPGASLNGNIG
Import ROWIMPGASLNGROW
Import TrinidadIMPGASLNGTRI
Import RussiaIMPGASLNGRUS
Import QatarIMPGASLNGQAT
Import NorwayIMPGASLNGNOR
NS Maple LNGSLNGGASNS15
NB CanaportSLNGGASNB09
QC Grande-AnseSLNGGASQC13
QC Gros CacounaSLNGGASQC14
BC Kitimat LNGSLNGLIQBC15
New Offshore TerminalSLNGLIQOFF20
New Standard TerminalSLNGLIQSTD15
Export BajaEXPGASLNGBAJ
Export ChinaEXPGASLNGCHI
Export ROWEXPGASLNGROW
Export TaipeiEXPGASLNGTAI
Export KoreaEXPGASLNGSKO
Export MexicoEXPGASLNGMEX
Export JapanEXPGASLNGJAP
GASLNG
Regasification
Terminals
PIPGAS
Liquefaction
Terminals
GASLNG
RES of
Natural Gas
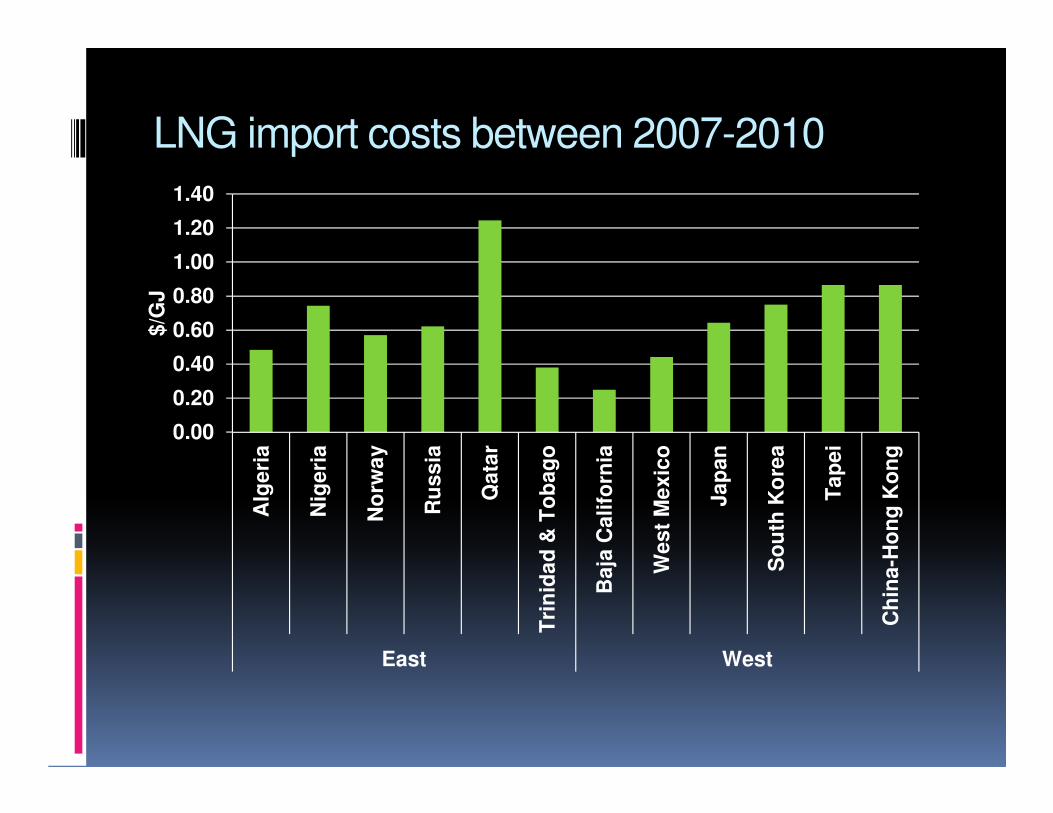
LNG import costs between 2007-2010
0.00
0.20
0.40
0.60
0.80
1.00
1.20
1.40
Alg
eri
a
Nig
eri
a
No
rwa
y
Ru
ss
ia
Qa
tar
Tri
nid
ad
& T
ob
ag
o
Ba
ja C
ali
forn
ia
We
st
Me
xic
o
Ja
pa
n
So
uth
Ko
rea
Ta
pe
i
Ch
ina
-Ho
ng
Ko
ng
East West
$/G
J

LNG imports: preliminary results
0
100
200
300
400
500
600
700
800
900
200
7
200
9
201
1
201
3
201
5
201
7
201
9
202
1
202
3
202
5
202
7
202
9
203
1
203
3
203
5
203
7
203
9
204
1
204
3
204
5
204
7
204
9
PJ
Low
Central
High
Plus
Central - 35%
UNCONVENTIONAL GAS MODULE
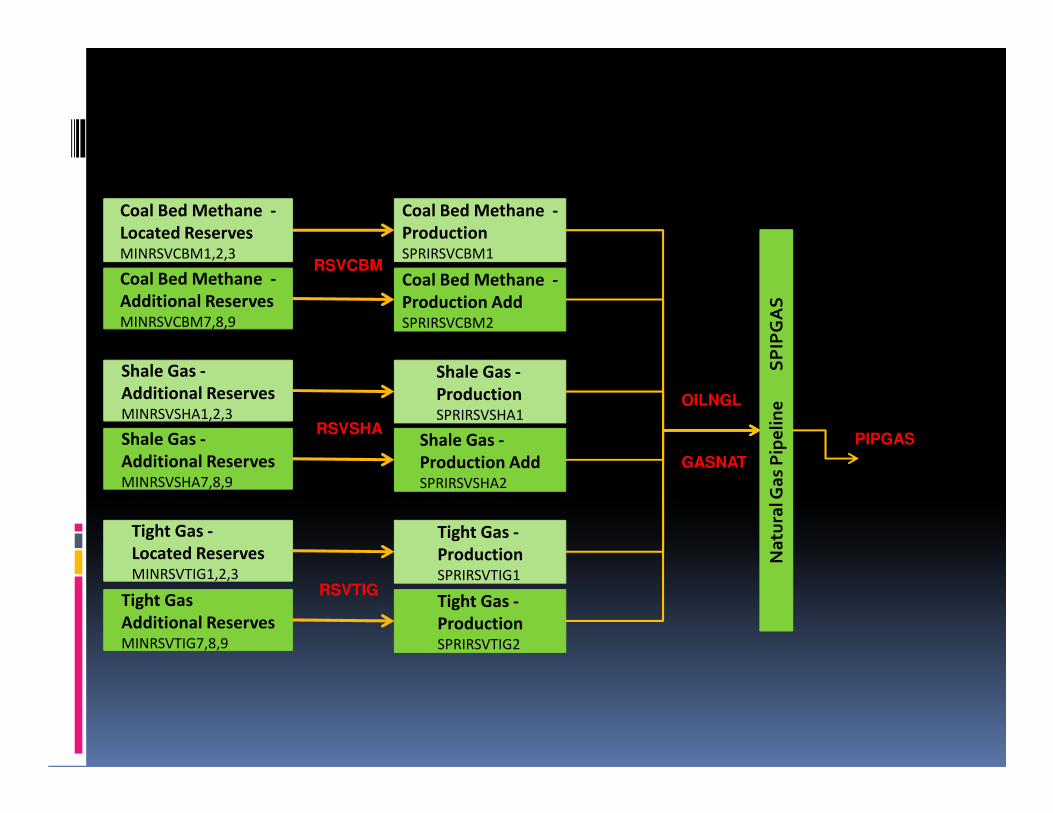
Coal Bed Methane -
Located ReservesMINRSVCBM1,2,3
Tight Gas -
Located ReservesMINRSVTIG1,2,3
Tight Gas
Additional ReservesMINRSVTIG7,8,9
Shale Gas -
Additional ReservesMINRSVSHA7,8,9
Shale Gas -
Additional Reserves MINRSVSHA1,2,3
Coal Bed Methane -
Additional Reserves MINRSVCBM7,8,9
RSVCBM
Coal Bed Methane -
ProductionSPRIRSVCBM1
RSVSHA
Shale Gas -
ProductionSPRIRSVSHA1
RSVTIG
Tight Gas -
ProductionSPRIRSVTIG1
Coal Bed Methane -
Production AddSPRIRSVCBM2
Shale Gas -
Production AddSPRIRSVSHA2
Tight Gas -
ProductionSPRIRSVTIG2
Na
tura
l Ga
s P
ipe
lin
e
S
PIP
GA
S
GASNAT
PIPGAS
OILNGL

Cumulative gas reserves
-
200,000
400,000
600,000
800,000
1,000,000
1,200,000
1,400,000
1,600,000
1,800,000
Natural Gas Shale Gas Tight Gas CBM
PJ
NORTH
EAST
CENT
WEST
-
500,000
1,000,000
1,500,000
2,000,000
2,500,000
3,000,000
3,500,000
WEST CENT EAST NORTH
PJ
CBM
Tight Gas
Shale Gas
Natural Gas
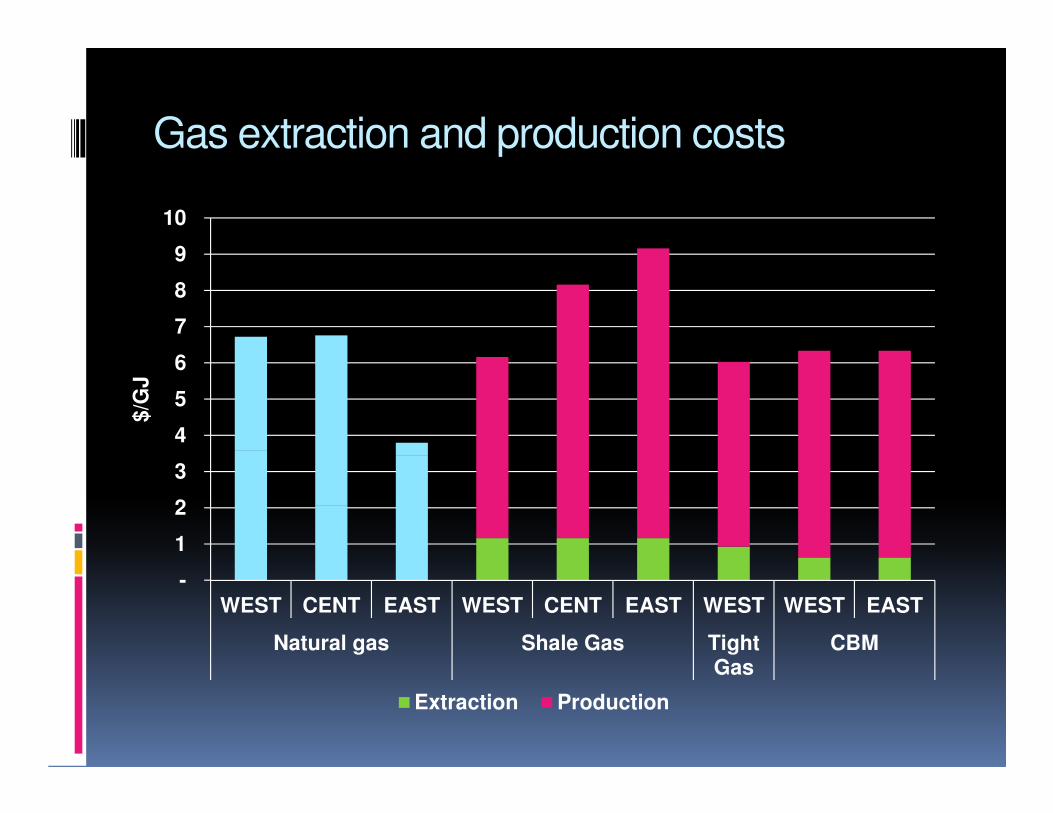
Gas extraction and production costs
-
1
2
3
4
5
6
7
8
9
10
WEST CENT EAST WEST CENT EAST WEST WEST EAST
Natural gas Shale Gas TightGas
CBM
$/G
J
Extraction Production
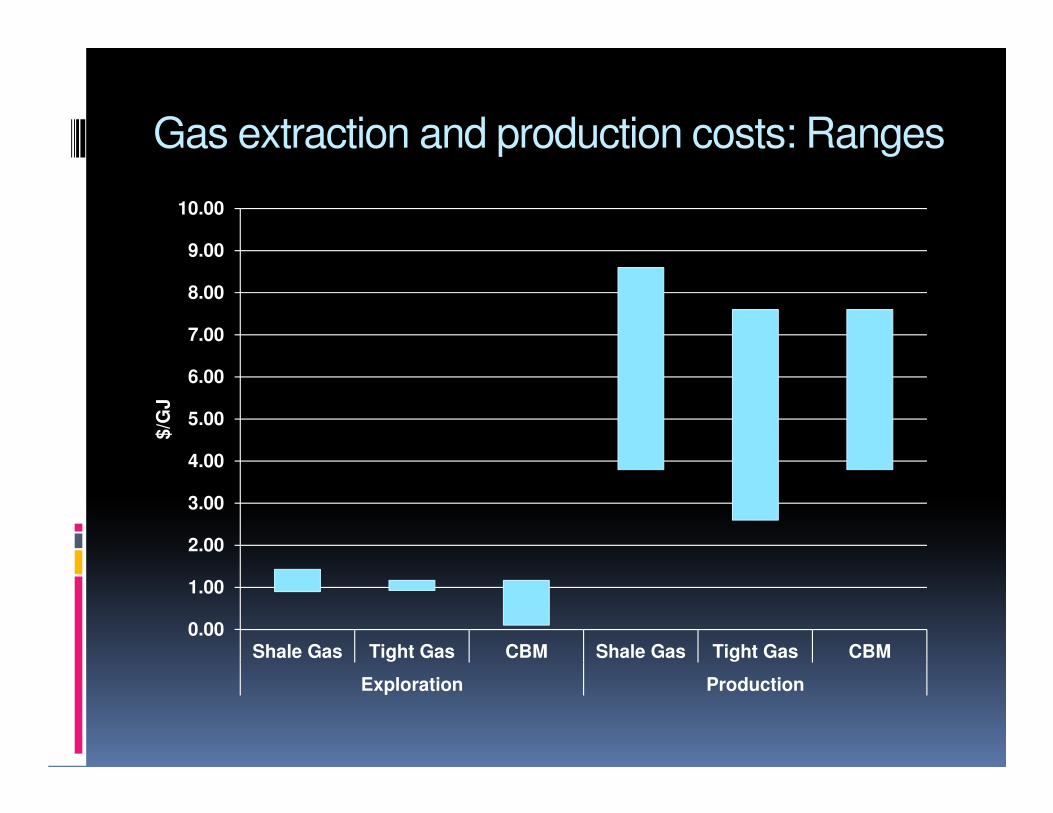
Gas extraction and production costs: Ranges
0.00
1.00
2.00
3.00
4.00
5.00
6.00
7.00
8.00
9.00
10.00
Shale Gas Tight Gas CBM Shale Gas Tight Gas CBM
Exploration Production
$/G
J

Gas production scenarios
� Reference: Central case
� Alternate cases
Shale gas CBM
A Min Min
B Min Max
C Max Max
D Max Min
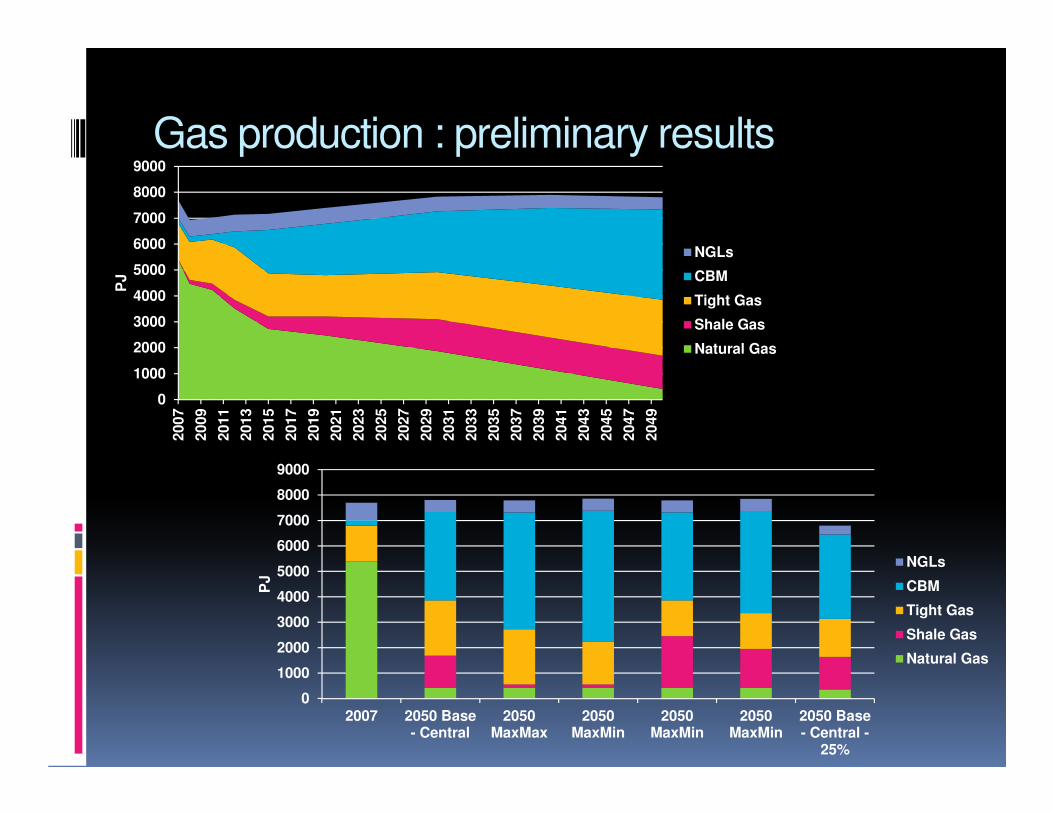
Gas production : preliminary results
0
1000
2000
3000
4000
5000
6000
7000
8000
90002007
2009
2011
2013
2015
2017
2019
2021
2023
2025
2027
2029
2031
2033
2035
2037
2039
2041
2043
2045
2047
2049
PJ
NGLs
CBM
Tight Gas
Shale Gas
Natural Gas
0
1000
2000
3000
4000
5000
6000
7000
8000
9000
2007 2050 Base- Central
2050MaxMax
2050MaxMin
2050MaxMin
2050MaxMin
2050 Base- Central -
25%
PJ
NGLs
CBM
Tight Gas
Shale Gas
Natural Gas
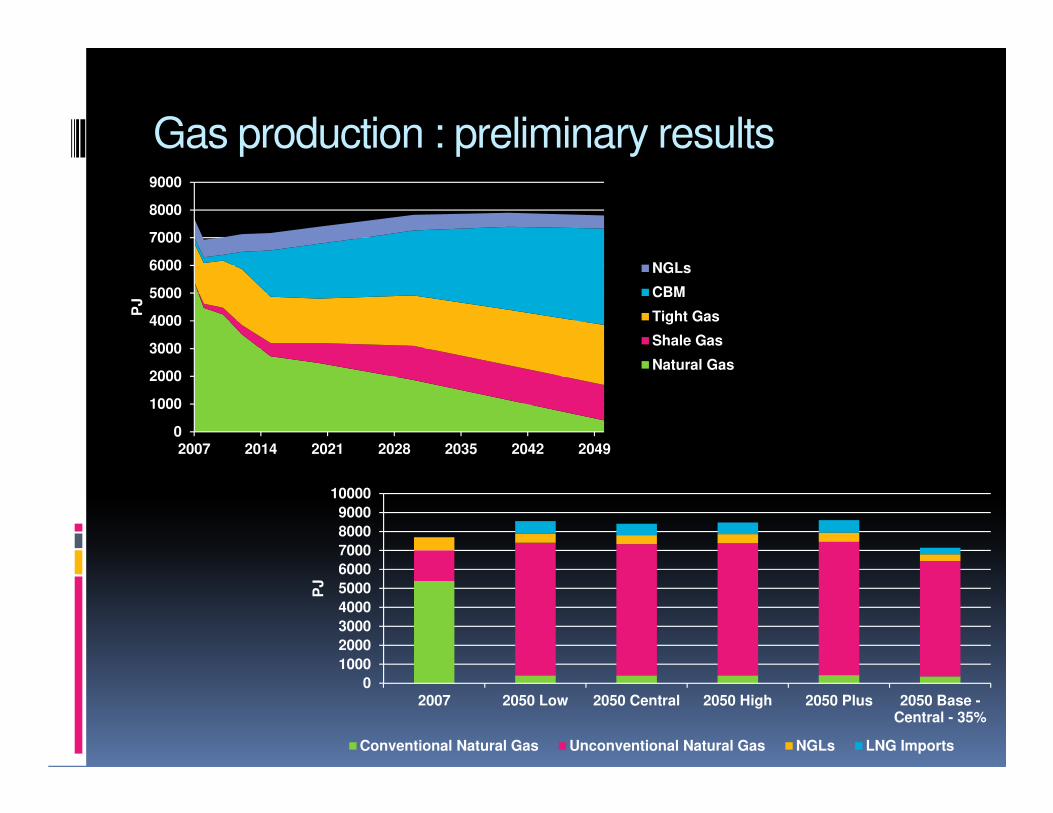
Gas production : preliminary results
0
1000
2000
3000
4000
5000
6000
7000
8000
9000
2007 2014 2021 2028 2035 2042 2049
PJ
NGLs
CBM
Tight Gas
Shale Gas
Natural Gas
0
1000
2000
3000
4000
5000
6000
7000
8000
9000
10000
2007 2050 Low 2050 Central 2050 High 2050 Plus 2050 Base -Central - 35%
PJ
Conventional Natural Gas Unconventional Natural Gas NGLs LNG Imports
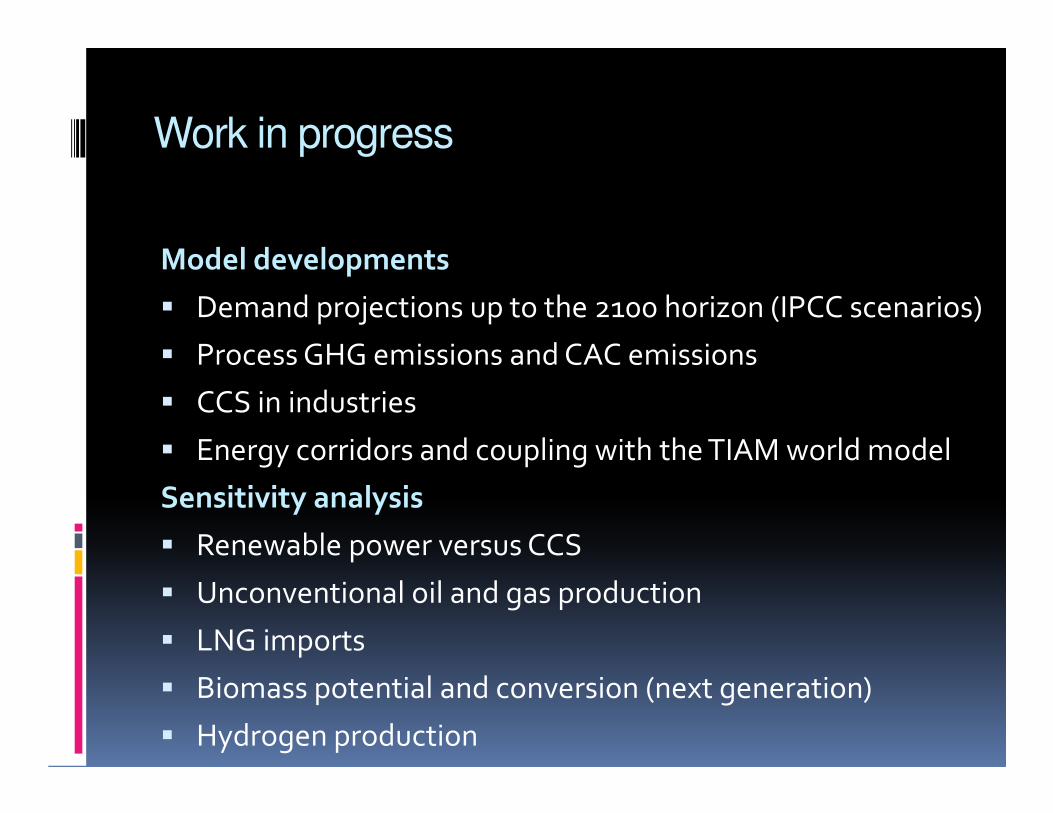
Work in progress
Model developments
� Demand projections up to the 2100 horizon (IPCC scenarios)
� Process GHG emissions and CAC emissions
� CCS in industries
� Energy corridors and coupling with the TIAM world model
Sensitivity analysis
� Renewable power versus CCS
� Unconventional oil and gas production
� LNG imports
� Biomass potential and conversion (next generation)
� Hydrogen production
Thank you from the team
Students
Yuri Alcocer
Camille Fertel
Erik Frenette
Hichem Garbouj
Mathilde Marcy
Yosra Neji
Noushin Reisi
Researchers
• Kathleen Vaillancourt
• Olivier Bahn
• Amit Kanudia
• Maryse Labriet
• Richard Loulou
• Jean-Philippe Waaub
Research project funded by the NSERC of CanadaResearch project funded by the MDEIE of Quebec (link with REACCESS 7th FP-EU)Partners: Resources Natural Canada, Environment Canada, Hydro-Quebec