Embed Size (px)
Citation preview

Recent Cross-border Financial Activity
Working Party on Trade on Goods and Services
November 2009

Cross-border financial activity increased in recent years…
Increased liberalization of international flows (online brokers, mergers and acquisitions activity)
Increased use of new investment vehicles (Asset-backed securities, derivatives)
Increased number of participants in the market (small investors, public pension plans)
Regulatory changes Increased outward direct investment; increased M&A
activity
Canada’s exposure to foreign financial markets has increased
-400
-300
-200
-100
0
100
200
300
400
500
600
700
800
Portfolio liabilities
Portfolio assets
Net portfolio position
Canada's international portfolio investment position at market value
billions of dollars
1990 1992 1996 1998 20081994 2000 2002 2004 2006

Impact of regulatory changes on foreign investment
-30
-15
0
15
30
45
60
75
1990 1992 1994 1996 1998 2000 2002 2004 2006 2008
Debt securities Stocks
billions of dollars
1. Reverse of Balance of Payments signs.
20%FPR 12% - 18% 25%-30% No restriction
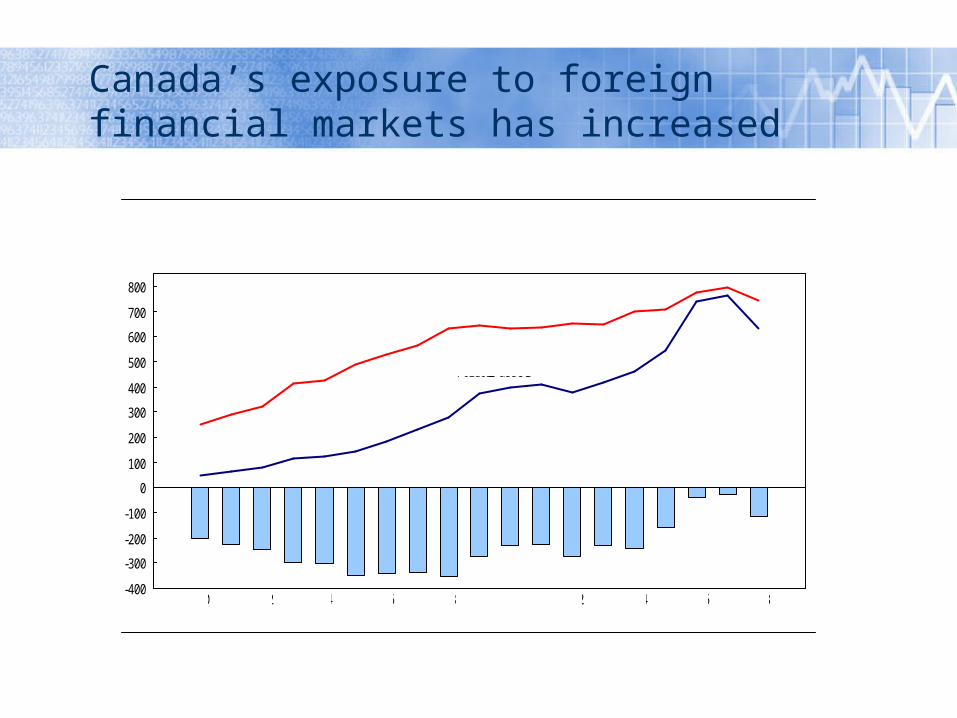
Canadian holdings of foreign securities: a country perspective
30
35
40
45
50
55
60
65
70
1997 1999 2001 2003 2005 2007
Holdings of foreign securities: Geographical distribution
United States
Europe and Asia
%

Concentration of investment in foreign equities: % Share for selected countries
0
25
50
75
100
2001 2002 2003 2004 2005 2006 2007 2008
Canada
Australia
US
UK
Japan
World
%

Increased outward FDI activity and geographical diversification
Canadian direct investment abroadGeographical distribution
0%
10%
20%
30%
40%
50%
60%
70%
80%
90%
100%
1988 2008
Othercountries
Asia/Oceania
Caribbean
Europe
United States
$79.8 B. $637.3 B.

Less geographical diversification for inward FDI
Foreign direct investment in CanadaGeographical distribution
0%
10%
20%
30%
40%
50%
60%
70%
80%
90%
100%
1988 2008
Othercountries
Asia/Oceania
Caribbean
Europe
United States
$114.2 B. $504.9 B.

Higher Canadian demand for foreign securities:• Increased exposure to global financial markets• Increased exposure to markets’ volatility• Increased exposure to currency fluctuations• Increased exposure to financial shocks
Higher Canadian direct investment abroad:• Increased exposure to foreign economies
Summary

Recent financial events evidenced by the international accounts program
Key issue: Canadian institutional investors’ reactions to deteriorating global credit conditions in 2007
● Immediate
● Marked
● Sustained

Rapid-sustained change in Canadian portfolio investment at outset of global credit concerns
-25
-20
-15
-10
-5
0
5
10
15
20
25
30
I II III IV I II III IV I II III IV I II III IV I II
Foreign debt instruments Foreign stocks
billions of dollars
1. Reverse of Balance of Payments signs.
2005 2006 2007 2008 2009
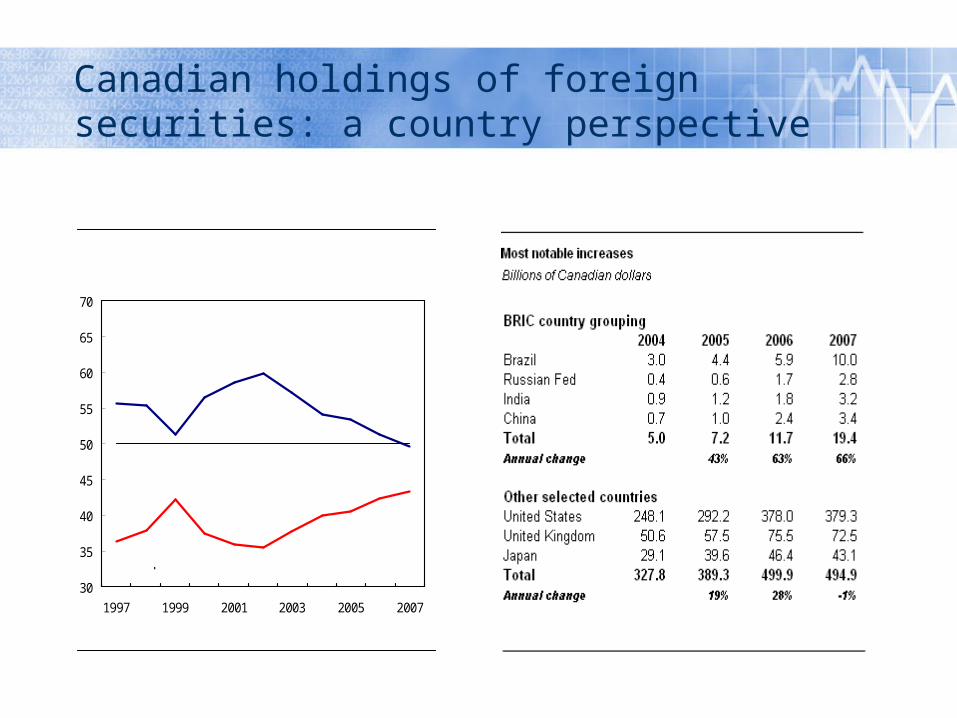
Reduction in holdings of foreign debt in response to global credit concerns
-10
-8
-6
-4
-2
0
2
4
6
8
10
J J J J J
Foreign debt
billions of dollars
1. Reverse of Balance of Payments signs.
2006 2007 2008 2009

Holdings of foreign short-term paper reduced drastically in August 2007
-12
-10
-8
-6
-4
-2
0
2
4
6
III IV I II III IV I II III IV I II III IV I II
Government Corp Fin Corp Non-fin
billions of dollars
1. Reverse of Balance of Payments signs.
2005 2006 2007 2008 2009

Investment in foreign long-term debt instruments also declined
-15
-9
-3
3
9
15
21
III IV I II III IV I II III IV I II III IV I II
Maple Bonds Other Bonds
billions of dollars
1. Reverse of Balance of Payments signs.

Canadians repatriated funds for the first time in 30 years
-20
-10
0
10
20
30
40
50
60
70
80
90
1981 1984 1987 1990 1993 1996 1999 2002 2005 2008
Foreign securities
billions of dollars
1. Reverse of Balance of Payments signs.
1979
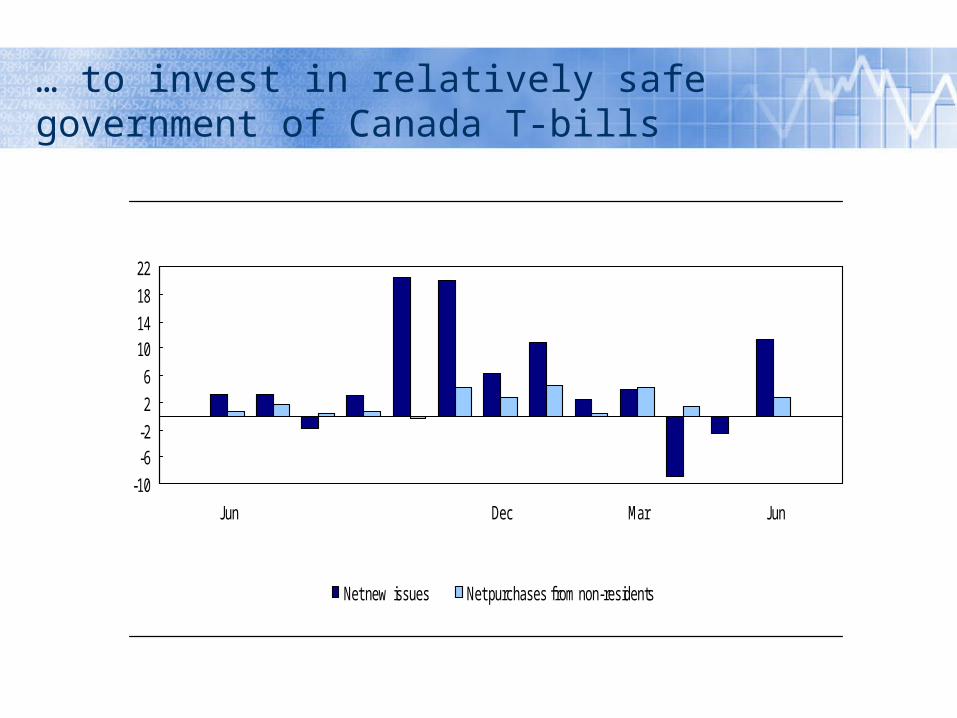
… to invest in relatively safe government of Canada T-bills
-10
-6-2
2
6
1014
18
22
J un Dec Mar J un
Net new issues Net purchases from non-residents
2008 2009
billions of dollars

Foreign demand for T-bills continued in 2009 and expanded to federal bonds
Foreign portfolio investment in Canada
-15
-10
-5
0
5
10
15
20
25
30
35
I II III IV I II III IV I II III IV I II III IV I II
bonds money market
billions of dollars
2005 2006 2007 2008 2009
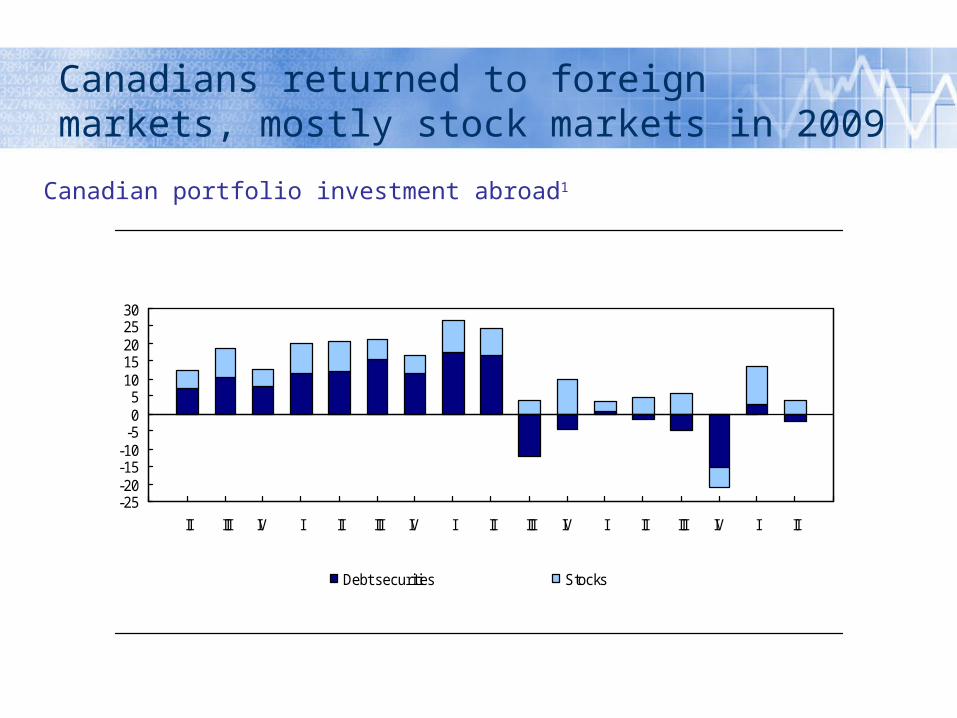
Canadians returned to foreign markets, mostly stock markets in 2009
Canadian portfolio investment abroad1
-25-20-15-10-505
1015202530
II III IV I II III IV I II III IV I II III IV I II
Debt securities Stocks
billions of dollars
20092005 2006 2007
1. Reverse of Balance of Payments signs.
2008

Foreign direct investment lost steam as of 2008
-10
0
10
20
30
40
50
60
II III IV I II III IV I II III IV I II III IV I II
Foreign direct investment in CanadaCanadian direct investment abroad
Foreign direct investment¹
billions of dollars
2006 2007 2008 2009
1. Reverse of Balance of P ayments signs for Canadian direct investment abroad.
2005

Mergers and acquisitions mostly explained the reduced inward activity
-100
102030405060708090
100
I II III IV I II III IV I II III IV I II III IV I II
Acquisitions Other
Foreign direct investment in Canada
billions of dollars
2006 2007 2008 20092005
Survey vehicles for the measurement of portfolio investment
Canada’s international transactions in securities (monthly)• Foreign investment in Canadian securities• Canadian investment in foreign securities
Other position surveys – Annual• Inward • Outward - CPIS• Book and market value

Summary
Immediate, marked and sustained reaction of Canadian institutional investors in mid-2007 with respect to their holdings of foreign securities … prelude to financial crisis that erupted in the late summer and fall of 2008?
Current reluctance of these same investors to rebuild holdings of foreign securities, especially debt instruments … sending a signal about perception of some degree of fragility in global financial markets?
Comments/questions?