Embed Size (px)
Citation preview
ARTICLE
Received 17 Apr 2014 | Accepted 24 Oct 2014 | Published 4 Dec 2014
Real-time earthquake monitoring using a searchengine methodJie Zhang1, Haijiang Zhang1, Enhong Chen2, Yi Zheng2, Wenhuan Kuang1 & Xiong Zhang1
When an earthquake occurs, seismologists want to use recorded seismograms to infer its
location, magnitude and source-focal mechanism as quickly as possible. If such information
could be determined immediately, timely evacuations and emergency actions could be
undertaken to mitigate earthquake damage. Current advanced methods can report the initial
location and magnitude of an earthquake within a few seconds, but estimating the source-
focal mechanism may require minutes to hours. Here we present an earthquake search
engine, similar to a web search engine, that we developed by applying a computer fast search
method to a large seismogram database to find waveforms that best fit the input data. Our
method is several thousand times faster than an exact search. For an Mw 5.9 earthquake on
8 March 2012 in Xinjiang, China, the search engine can infer the earthquake’s parameters in
o1 s after receiving the long-period surface wave data.
DOI: 10.1038/ncomms6664 OPEN
1 Laboratory of Seismology and Physics of Earth’s Interior, School of Earth and Space Sciences, University of Science and Technology of China, Hefei, Anhui230026, P.R. China. 2 School of Computer Science and Technology, University of Science and Technology of China, Hefei, Anhui 230027, P.R. China.Correspondence and requests for materials should be addressed to J.Z. (email: [email protected]).
NATURE COMMUNICATIONS | 5:5664 | DOI: 10.1038/ncomms6664 | www.nature.com/naturecommunications 1
& 2014 Macmillan Publishers Limited. All rights reserved.

Reporting earthquakes in real time has long been asignificant research effort in the seismological commu-nity1–3. In recent years, such efforts have been further
refined towards developing earthquake early warning systemsthat can issue warnings to the public within a few seconds toslightly 41 min after the event occurs4. Several earthquake earlywarning systems have been implemented around the world,including REIS in Japan5, SAS in Mexico6, VSN in Taiwan7 andIERREWS in Turkey8. In the United States, significant researchefforts have been put into the development of the ElarmS earlywarning system in California, which has been shown to beeffective in offline tests but has not been fully implemented yet4.Seismologists have developed robust algorithms to estimate thesource information from earthquakes automatically9,10. Forexample, in Japan, the REIS system allows the estimation of theearthquake’s location and magnitude within 5 s after the P-wavearrival by using data from a dense monitoring network5.However, it still takes several minutes or more to derive thesource-focal mechanism, even with the recently published newmethods that invert moment tensors with Green’s functionscalculated in advance for potential earthquake locations over agrid11–13. Similar efforts using GPS data can also determine thecentroid moment tensors of large earthquakes in minutes14,15.
In addition to the location and magnitude, it is important toderive the source-focal mechanism for earthquakes in real time.For example, tsunami prediction requires complete sourceparameters, including source depth, magnitude, slip and orienta-tion of the fault16. A shallow earthquake with a seismic momentmagnitude of Mw 7.7 occurred off the west coast of Sumatra on 25October 2010, generating a local tsunami that reached a height of3 m and hit the islands in minutes. More than 400 fatalities werereported17. A focal mechanism study revealed that thisearthquake had a thrust-faulting mechanism, causing significantseawater movement. By contrast, a large Indian Oceanearthquake on 11 April 2012, with a magnitude of Mw 8.6 andfollowed B2 h later by a large (Mw 8.2) aftershock, did not causea tsunami, although warnings were issued across the IndianOcean. The focal mechanism solutions suggest that bothearthquakes were caused by strike-slip motion18; thus, themovement displaced relatively little seawater and was less likelyto cause a tsunami. The real-time estimation of source-focalmechanism is also important for monitoring fault activities. Forexample, Bouchon et al.19 analysed the extended nucleation of the1999 Mw 7.6 Izmit earthquake and found a sequence offoreshocks whose source-focal mechanisms indicate similarfault slips before accelerating to dynamic rupture. Obtaining thefocal mechanisms of earthquake swarms in real time may helpcharacterise fault activities. Such information could immediatelyattract our attention to the seismically active area and delineatethe fault movement in real time.
The challenge lies in the automatic and rapid estimation of theearthquake source mechanism in a few seconds after receiving theseismic data from a few stations. We develop an image-basedearthquake search engine, similar to web search engines, toestimate earthquake parameters within 1 s by searching forsimilar seismograms from a large database on a single AMDOpteron processor 6136. Significant advances in computer searchtechnology have helped the search industry to retrieve words,images, videos and voices from Internet-sized data sets20–32.Similar to voice recording or a one-dimensional (1D) image, aseismogram is a graph record of the ground motion at a recordingstation as a function of time. It contains information about boththe earthquake source and the earth medium through which thewaves propagated. By assuming that the earth velocity model isknown, we apply a forward modelling approach to build adatabase of waveforms for scenario earthquakes over possible
source mechanisms and locations on a discretised grid. Ourobjective is to find the best matches to any new earthquake recordfrom the database. This approach is fully automatic and requiresno parameter input or human interference. Therefore, it could beapplied for routinely reporting earthquake parameters.
We test our earthquake search engine using three realearthquakes in a test site in Xinjiang, China. An area 5� by 5�in latitude and longitude is selected to create a fast-searchdatabase. The search results can be obtained by the search enginein o1 s in all three cases after receiving the long-period surfacewave data. For an event within the database coverage area, thedetermined earthquake source parameters are sufficiently accu-rate. If an event is outside the database coverage area, or multipleevents are closely spaced in time, the search engine canautomatically invalidate the results using a predefined cross-correlation threshold.
ResultsSearch engine database for the Xinjiang test site. Figure 1 showsa test area of 5� by 5� in Southern Xinjiang, China, where threepermanent seismic stations (dark red triangles) can recordearthquakes from the area within a range of B5� to 15�.These stations include MAKZ (46.8�N, 82.0�E in Makanchi,Kazakhstan), KBL (34.5�N, 69.0�E in Kabul, Afghanistan) andLSA (29.7�N, 91.1�E in Lhasa, China). From 1 January 2000 topresent, 51 earthquakes with magnitudes 4Mw 4.0 occurred inthe test site according to the United States Geological Survey—National Earthquake Information Centre (NEIC). In this study,we focus on the real-time analysis of small-to-moderate earth-quakes to determine their hypocentres and double-couple focalmechanisms in this area. Our approach includes the followingsteps: (1) the construction of a synthetic database with Green’s
70˚
70˚
75˚
75˚
80˚
80˚
85˚
85˚
90˚
90˚
95˚
95˚
30˚ 30˚
35˚ 35˚
40˚ 40˚
45˚ 45˚
MAKZ
KBL
LSA
Figure 1 | The locations of the seismic stations and the virtual test site.
A large synthetic data set from virtual sources in the area of three seismic
stations denoted by dark red triangles (MAKZ—46.8�N, 82.0�E in
Makanchi, Kazakhstan; KBL—34.5�N, 69.0�E in Kabul, Afghanistan;
LSA—29.7�N, 91.1�E in Lhasa, China) is generated to create a fast search
database and three earthquakes denoted by stars (locations from the
United States Geological Survey (USGS)—NEIC) are used to test different
situations. The purple star denotes an earthquake of a magnitude of Mw
5.9 that occurred on 8 March 2012; the blue star denotes an earthquake
of a magnitude of Mw 5.3 on 15 September 2011; and the green star
denotes an earthquake of a magnitude of Mw 5.3 on 30 April 2014.
ARTICLE NATURE COMMUNICATIONS | DOI: 10.1038/ncomms6664
2 NATURE COMMUNICATIONS | 5:5664 | DOI: 10.1038/ncomms6664 | www.nature.com/naturecommunications
& 2014 Macmillan Publishers Limited. All rights reserved.
functions calculated using a laterally homogeneous medium for‘virtual sources’ on discretised grid nodes in the study region andconvolved with all possible double-couple source solutions;(2) reduction of the number of time samples in the databaseby principal components analysis; (3) use of the fast searchalgorithm developed in the internet industry to quickly find thebest-matching ‘virtual sources;’ and (4) validation of the solutionsand quantification of the resolution of the search results.
To design an earthquake search engine specifically for themonitoring of this test site, we create a database consisting of alarge number of synthetic seismograms corresponding toevery virtual source point in the 3D grid within the test site.Our three-component seismogram calculation applies the elasticwave modelling of a point earthquake source in a multilayeredhalf-space using the Thompson–Haskell propagator matrixtechnique33. In this study, we primarily focus on the shallowearthquakes within the test site recorded at distances of 5� to 15�.We tested the PREM earth model34 by modelling a few historicevents for the area of interest. It is reasonable to use this modelto simulate the long-period seismic wavefield (0.01–0.05 Hz)propagating in the area. We also tested the search engine with realearthquakes inside and outside the test site, as well as with a‘hypothesised’ double-event earthquake constructed from tworeal earthquakes.
As shown in Fig. 1, the test area is gridded in 0.2� intervals inlatitude from 36�N to 41�N and in longitude from 79�E to 84�E.The depth grid is from 5 to 60 km, with an interval of 5 km. Thus,there are 8,112 virtual source points in the 3D grid. The source-focal mechanism at each grid point is discretised as follows: strikeranging from 10� to 350� with an interval of 20�, dip rangingfrom 5� to 80� with an interval of 15� and rake ranging from� 170� to 170� with an interval of 20�. This leads to a total of1,944 different events at each virtual source point. Therefore, weshould generate three-component seismograms for 15,789,168(8,122� 1,944) earthquakes in the 3D grid for every seismicstation, that is, a total of 47,367,504 three-component seismo-grams for the three seismic stations. To create the searchdatabase, we merge the three-component seismograms from allthe three seismic stations and produce a long super-trace foreach virtual earthquake. Hence, there are a total of 15,789,168super-traces in the search database.
For any virtual source position, the greatest computationaleffort is the calculation of the Green’s function between sourceand receiver before convolving it with a focal solution. For a 1DEarth model, there should be nine sets of Green’s functions andeight of them contribute to the calculation of the three-component seismogram for a double-couple source13,33.Fortunately, the Green’s function is independent of the source-focal mechanism; thus, we only need to calculate one set ofGreen’s function for each grid point.
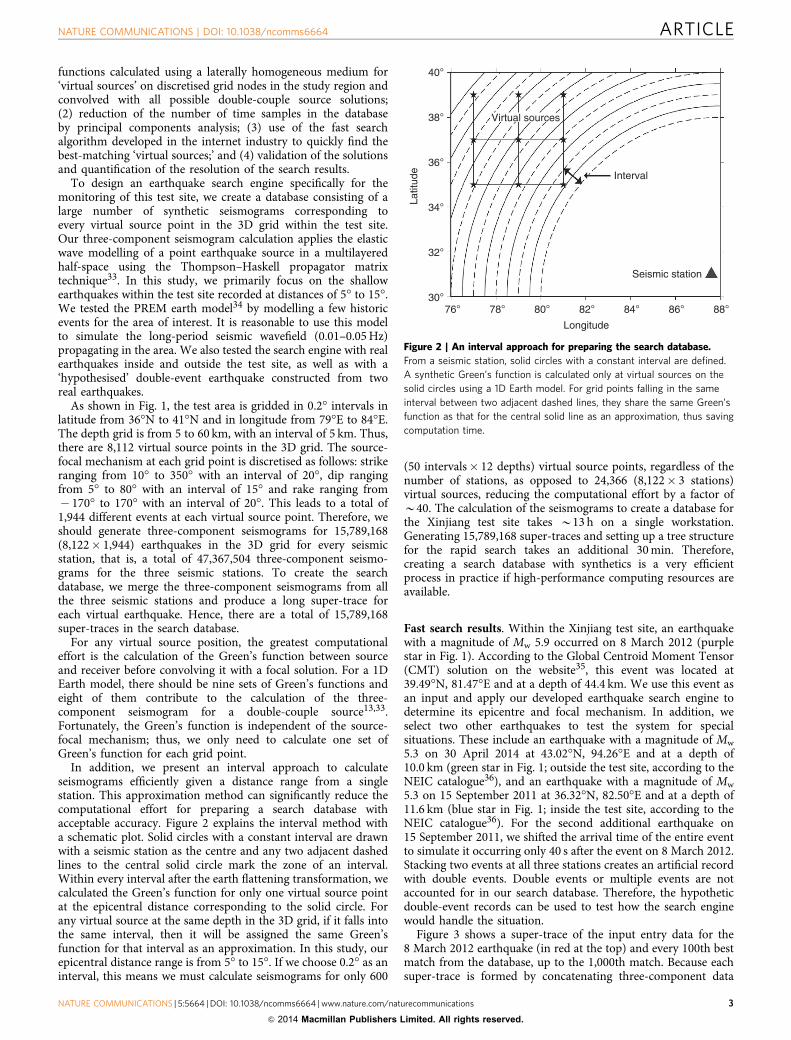
In addition, we present an interval approach to calculateseismograms efficiently given a distance range from a singlestation. This approximation method can significantly reduce thecomputational effort for preparing a search database withacceptable accuracy. Figure 2 explains the interval method witha schematic plot. Solid circles with a constant interval are drawnwith a seismic station as the centre and any two adjacent dashedlines to the central solid circle mark the zone of an interval.Within every interval after the earth flattening transformation, wecalculated the Green’s function for only one virtual source pointat the epicentral distance corresponding to the solid circle. Forany virtual source at the same depth in the 3D grid, if it falls intothe same interval, then it will be assigned the same Green’sfunction for that interval as an approximation. In this study, ourepicentral distance range is from 5� to 15�. If we choose 0.2� as aninterval, this means we must calculate seismograms for only 600
(50 intervals� 12 depths) virtual source points, regardless of thenumber of stations, as opposed to 24,366 (8,122� 3 stations)virtual sources, reducing the computational effort by a factor ofB40. The calculation of the seismograms to create a database forthe Xinjiang test site takes B13 h on a single workstation.Generating 15,789,168 super-traces and setting up a tree structurefor the rapid search takes an additional 30 min. Therefore,creating a search database with synthetics is a very efficientprocess in practice if high-performance computing resources areavailable.
Fast search results. Within the Xinjiang test site, an earthquakewith a magnitude of Mw 5.9 occurred on 8 March 2012 (purplestar in Fig. 1). According to the Global Centroid Moment Tensor(CMT) solution on the website35, this event was located at39.49�N, 81.47�E and at a depth of 44.4 km. We use this event asan input and apply our developed earthquake search engine todetermine its epicentre and focal mechanism. In addition, weselect two other earthquakes to test the system for specialsituations. These include an earthquake with a magnitude of Mw
5.3 on 30 April 2014 at 43.02�N, 94.26�E and at a depth of10.0 km (green star in Fig. 1; outside the test site, according to theNEIC catalogue36), and an earthquake with a magnitude of Mw
5.3 on 15 September 2011 at 36.32�N, 82.50�E and at a depth of11.6 km (blue star in Fig. 1; inside the test site, according to theNEIC catalogue36). For the second additional earthquake on15 September 2011, we shifted the arrival time of the entire eventto simulate it occurring only 40 s after the event on 8 March 2012.Stacking two events at all three stations creates an artificial recordwith double events. Double events or multiple events are notaccounted for in our search database. Therefore, the hypotheticdouble-event records can be used to test how the search enginewould handle the situation.
Figure 3 shows a super-trace of the input entry data for the8 March 2012 earthquake (in red at the top) and every 100th bestmatch from the database, up to the 1,000th match. Because eachsuper-trace is formed by concatenating three-component data
40°
38°
36°
34°
32°
30°76° 78° 80° 82° 84° 86° 88°
Longitude
Latit
ude
Seismic station
Interval
Virtual sources
Figure 2 | An interval approach for preparing the search database.
From a seismic station, solid circles with a constant interval are defined.
A synthetic Green’s function is calculated only at virtual sources on the
solid circles using a 1D Earth model. For grid points falling in the same
interval between two adjacent dashed lines, they share the same Green’s
function as that for the central solid line as an approximation, thus saving
computation time.
NATURE COMMUNICATIONS | DOI: 10.1038/ncomms6664 ARTICLE
NATURE COMMUNICATIONS | 5:5664 | DOI: 10.1038/ncomms6664 | www.nature.com/naturecommunications 3
& 2014 Macmillan Publishers Limited. All rights reserved.
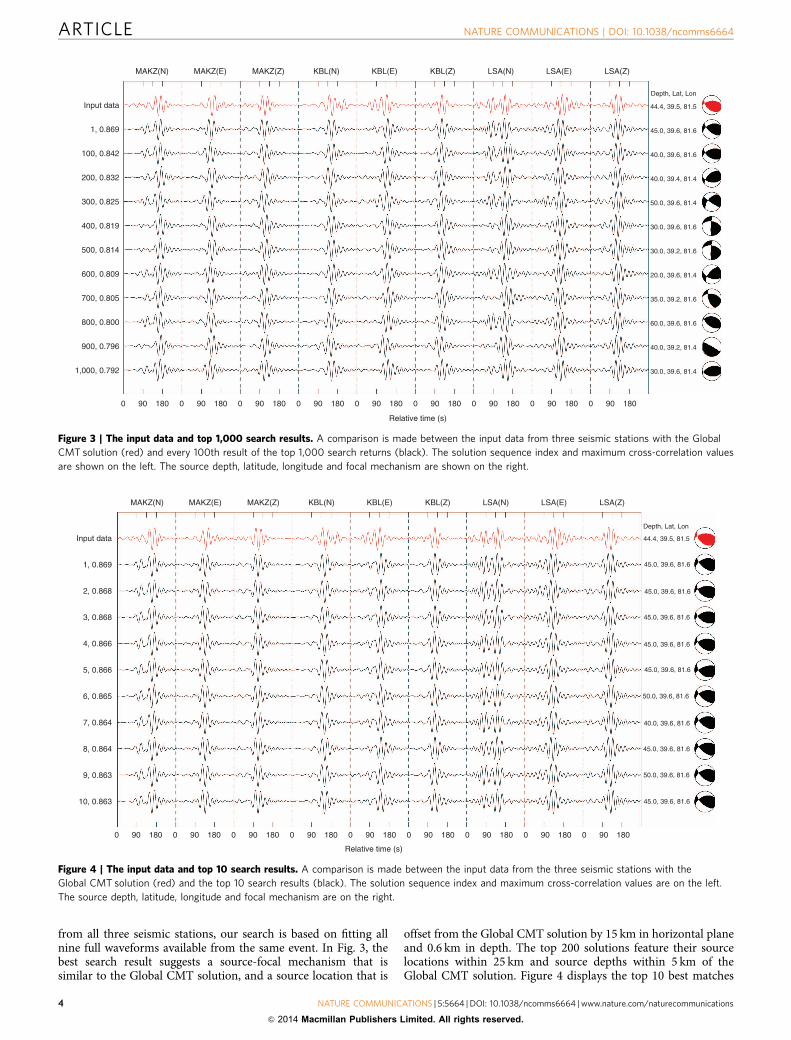
from all three seismic stations, our search is based on fitting allnine full waveforms available from the same event. In Fig. 3, thebest search result suggests a source-focal mechanism that issimilar to the Global CMT solution, and a source location that is
offset from the Global CMT solution by 15 km in horizontal planeand 0.6 km in depth. The top 200 solutions feature their sourcelocations within 25 km and source depths within 5 km of theGlobal CMT solution. Figure 4 displays the top 10 best matches
Input data
MAKZ(N) MAKZ(E) MAKZ(Z) KBL(N) KBL(E) KBL(Z) LSA(N) LSA(E) LSA(Z)
Depth, Lat, Lon
44.4, 39.5, 81.5
45.0, 39.6, 81.6
40.0, 39.6, 81.6
40.0, 39.4, 81.4
50.0, 39.6, 81.4
30.0, 39.6, 81.6
30.0, 39.2, 81.6
20.0, 39.6, 81.4
35.0, 39.2, 81.6
60.0, 39.6, 81.6
40.0, 39.2, 81.4
30.0, 39.6, 81.4
1, 0.869
100, 0.842
200, 0.832
300, 0.825
400, 0.819
500, 0.814
600, 0.809
700, 0.805
800, 0.800
900, 0.796
1,000, 0.792
0 90 180 0 90 180 0 90 180 0 90 180 0 90
Relative time (s)
180 0 90 180 0 90 180 0 90 180 0 90 180
Figure 3 | The input data and top 1,000 search results. A comparison is made between the input data from three seismic stations with the Global
CMT solution (red) and every 100th result of the top 1,000 search returns (black). The solution sequence index and maximum cross-correlation values
are shown on the left. The source depth, latitude, longitude and focal mechanism are shown on the right.
Input data
MAKZ(N) MAKZ(E) MAKZ(Z) KBL(N) KBL(E) KBL(Z) LSA(N) LSA(E) LSA(Z)
Depth, Lat, Lon
44.4, 39.5, 81.5
45.0, 39.6, 81.6
45.0, 39.6, 81.6
45.0, 39.6, 81.6
45.0, 39.6, 81.6
45.0, 39.6, 81.6
50.0, 39.6, 81.6
40.0, 39.6, 81.6
45.0, 39.6, 81.6
50.0, 39.6, 81.6
45.0, 39.6, 81.6
1, 0.869
2, 0.868
3, 0.868
4, 0.866
5, 0.866
6, 0.865
7, 0.864
8, 0.864
9, 0.863
10, 0.863
0 90 180 0 90 180 0 90 180 0 90 180 0 90
Relative time (s)
180 0 90 180 0 90 180 0 90 180 0 90 180
Figure 4 | The input data and top 10 search results. A comparison is made between the input data from the three seismic stations with the
Global CMT solution (red) and the top 10 search results (black). The solution sequence index and maximum cross-correlation values are on the left.
The source depth, latitude, longitude and focal mechanism are on the right.
ARTICLE NATURE COMMUNICATIONS | DOI: 10.1038/ncomms6664
4 NATURE COMMUNICATIONS | 5:5664 | DOI: 10.1038/ncomms6664 | www.nature.com/naturecommunications
& 2014 Macmillan Publishers Limited. All rights reserved.
among the 1,000 solutions. The source-focal mechanisms in all10 search results are clearly close to the Global CMT solution.Within the best 10 solutions, the maximum cross-correlationvalue decreases from 0.8695 to 0.8626; thus, their variations aresmall. This suggests a certain non-uniqueness of the results,which may be due to the limited data and observation geometry.It is important to understand this issue for any solution, becauseit defines the confidence level for that solution. Regardless, theresults indicate that source location, depth and focal mechanism
are reasonably well constrained in this case. The source-depthand -focal mechanism estimates seem more reliable than thelocation estimate in this particular case.
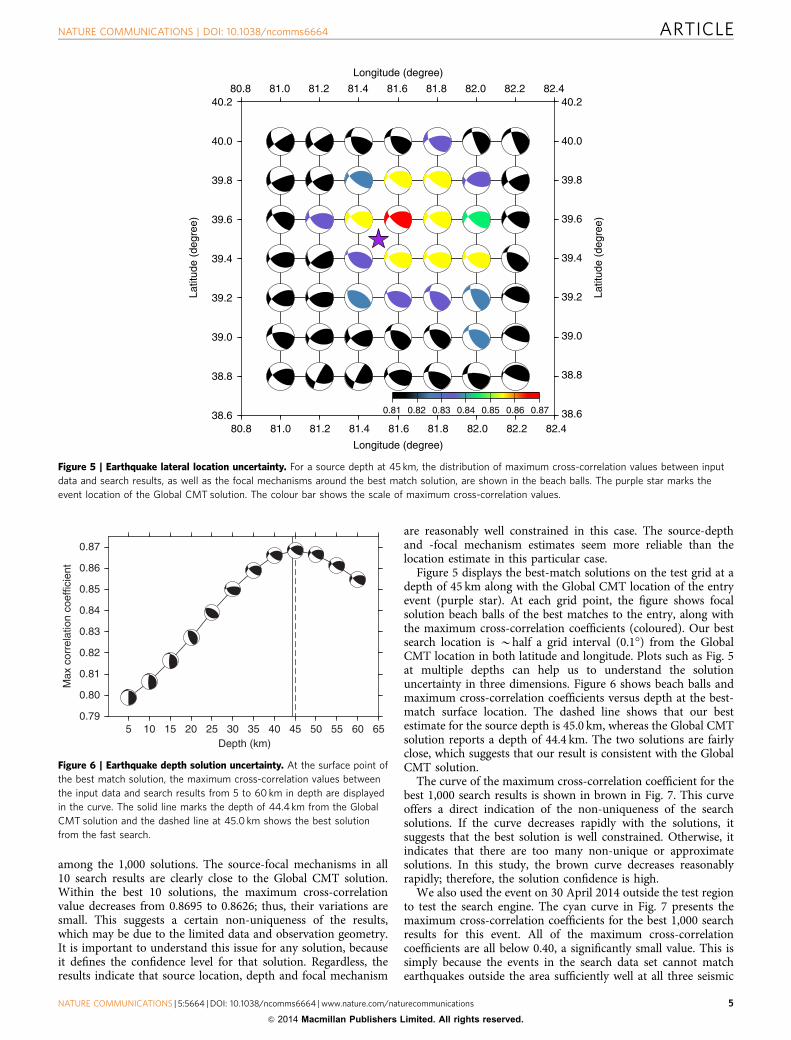
Figure 5 displays the best-match solutions on the test grid at adepth of 45 km along with the Global CMT location of the entryevent (purple star). At each grid point, the figure shows focalsolution beach balls of the best matches to the entry, along withthe maximum cross-correlation coefficients (coloured). Our bestsearch location is Bhalf a grid interval (0.1�) from the GlobalCMT location in both latitude and longitude. Plots such as Fig. 5at multiple depths can help us to understand the solutionuncertainty in three dimensions. Figure 6 shows beach balls andmaximum cross-correlation coefficients versus depth at the best-match surface location. The dashed line shows that our bestestimate for the source depth is 45.0 km, whereas the Global CMTsolution reports a depth of 44.4 km. The two solutions are fairlyclose, which suggests that our result is consistent with the GlobalCMT solution.
The curve of the maximum cross-correlation coefficient for thebest 1,000 search results is shown in brown in Fig. 7. This curveoffers a direct indication of the non-uniqueness of the searchsolutions. If the curve decreases rapidly with the solutions, itsuggests that the best solution is well constrained. Otherwise, itindicates that there are too many non-unique or approximatesolutions. In this study, the brown curve decreases reasonablyrapidly; therefore, the solution confidence is high.
We also used the event on 30 April 2014 outside the test regionto test the search engine. The cyan curve in Fig. 7 presents themaximum cross-correlation coefficients for the best 1,000 searchresults for this event. All of the maximum cross-correlationcoefficients are all below 0.40, a significantly small value. This issimply because the events in the search data set cannot matchearthquakes outside the area sufficiently well at all three seismic
38.6
38.8
39.0
39.2
39.4
39.6
39.8
40.0
40.2
Latit
ude
(deg
ree)
38.6
38.8
39.0
39.2
39.4
39.6
39.8
40.0
40.2
Latit
ude
(deg
ree)
82.4
Longitude (degree)
Longitude (degree)
0.81 0.82 0.83 0.84 0.85 0.86 0.87
80.8 81.0 81.2 81.4 81.6 81.8 82.0 82.2
82.480.8 81.0 81.2 81.4 81.6 81.8 82.0 82.2
Figure 5 | Earthquake lateral location uncertainty. For a source depth at 45 km, the distribution of maximum cross-correlation values between input
data and search results, as well as the focal mechanisms around the best match solution, are shown in the beach balls. The purple star marks the
event location of the Global CMT solution. The colour bar shows the scale of maximum cross-correlation values.
0.79
0.80
0.81
0.82
0.83
0.84
0.85
0.86
0.87
Max
cor
rela
tion
coef
ficie
nt
65Depth (km)
5 10 15 20 25 30 35 40 45 50 55 60
Figure 6 | Earthquake depth solution uncertainty. At the surface point of
the best match solution, the maximum cross-correlation values between
the input data and search results from 5 to 60 km in depth are displayed
in the curve. The solid line marks the depth of 44.4 km from the Global
CMT solution and the dashed line at 45.0 km shows the best solution
from the fast search.
NATURE COMMUNICATIONS | DOI: 10.1038/ncomms6664 ARTICLE
NATURE COMMUNICATIONS | 5:5664 | DOI: 10.1038/ncomms6664 | www.nature.com/naturecommunications 5
& 2014 Macmillan Publishers Limited. All rights reserved.
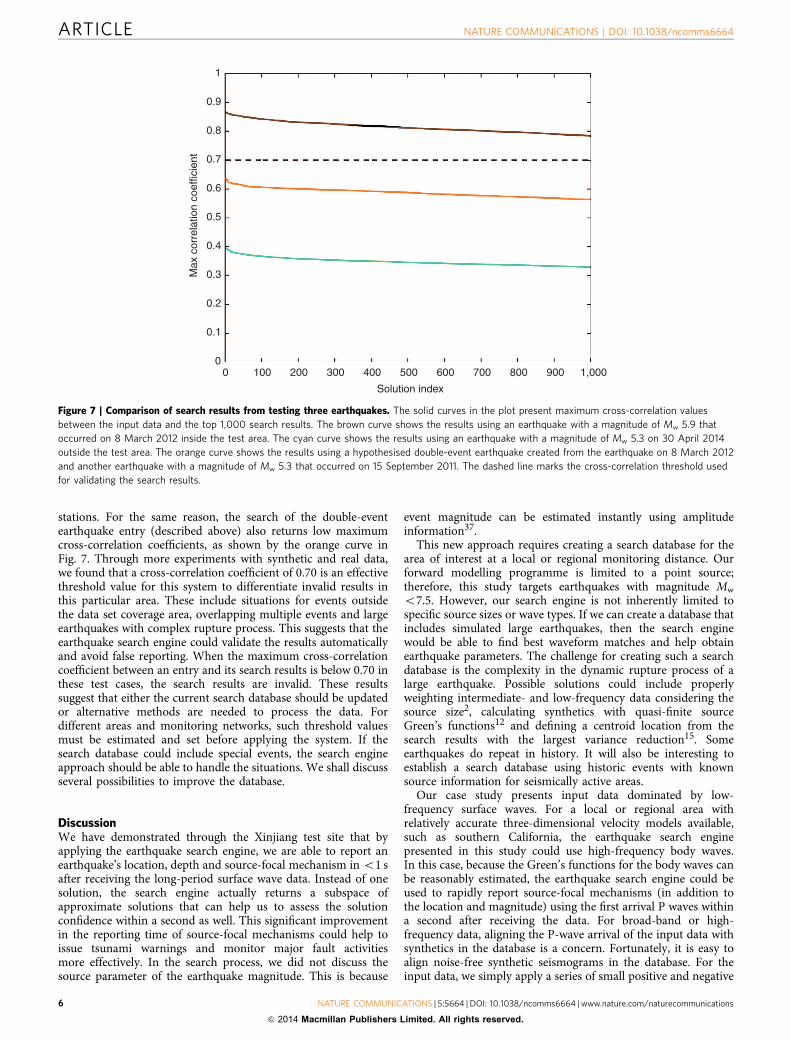
stations. For the same reason, the search of the double-eventearthquake entry (described above) also returns low maximumcross-correlation coefficients, as shown by the orange curve inFig. 7. Through more experiments with synthetic and real data,we found that a cross-correlation coefficient of 0.70 is an effectivethreshold value for this system to differentiate invalid results inthis particular area. These include situations for events outsidethe data set coverage area, overlapping multiple events and largeearthquakes with complex rupture process. This suggests that theearthquake search engine could validate the results automaticallyand avoid false reporting. When the maximum cross-correlationcoefficient between an entry and its search results is below 0.70 inthese test cases, the search results are invalid. These resultssuggest that either the current search database should be updatedor alternative methods are needed to process the data. Fordifferent areas and monitoring networks, such threshold valuesmust be estimated and set before applying the system. If thesearch database could include special events, the search engineapproach should be able to handle the situations. We shall discussseveral possibilities to improve the database.
DiscussionWe have demonstrated through the Xinjiang test site that byapplying the earthquake search engine, we are able to report anearthquake’s location, depth and source-focal mechanism in o1 safter receiving the long-period surface wave data. Instead of onesolution, the search engine actually returns a subspace ofapproximate solutions that can help us to assess the solutionconfidence within a second as well. This significant improvementin the reporting time of source-focal mechanisms could help toissue tsunami warnings and monitor major fault activitiesmore effectively. In the search process, we did not discuss thesource parameter of the earthquake magnitude. This is because
event magnitude can be estimated instantly using amplitudeinformation37.
This new approach requires creating a search database for thearea of interest at a local or regional monitoring distance. Ourforward modelling programme is limited to a point source;therefore, this study targets earthquakes with magnitude Mw
o7.5. However, our search engine is not inherently limited tospecific source sizes or wave types. If we can create a database thatincludes simulated large earthquakes, then the search enginewould be able to find best waveform matches and help obtainearthquake parameters. The challenge for creating such a searchdatabase is the complexity in the dynamic rupture process of alarge earthquake. Possible solutions could include properlyweighting intermediate- and low-frequency data considering thesource size2, calculating synthetics with quasi-finite sourceGreen’s functions12 and defining a centroid location from thesearch results with the largest variance reduction15. Someearthquakes do repeat in history. It will also be interesting toestablish a search database using historic events with knownsource information for seismically active areas.
Our case study presents input data dominated by low-frequency surface waves. For a local or regional area withrelatively accurate three-dimensional velocity models available,such as southern California, the earthquake search enginepresented in this study could use high-frequency body waves.In this case, because the Green’s functions for the body waves canbe reasonably estimated, the earthquake search engine could beused to rapidly report source-focal mechanisms (in addition tothe location and magnitude) using the first arrival P waves withina second after receiving the data. For broad-band or high-frequency data, aligning the P-wave arrival of the input data withsynthetics in the database is a concern. Fortunately, it is easy toalign noise-free synthetic seismograms in the database. For theinput data, we simply apply a series of small positive and negative
1
0.9
0.8
0.7
0.6
0.4
Max
cor
rela
tion
coef
ficie
nt
0.5
0.3
0.2
0.1
00 100 200 300 400 500 600
Solution index
700 800 900 1,000
Figure 7 | Comparison of search results from testing three earthquakes. The solid curves in the plot present maximum cross-correlation values
between the input data and the top 1,000 search results. The brown curve shows the results using an earthquake with a magnitude of Mw 5.9 that
occurred on 8 March 2012 inside the test area. The cyan curve shows the results using an earthquake with a magnitude of Mw 5.3 on 30 April 2014
outside the test area. The orange curve shows the results using a hypothesised double-event earthquake created from the earthquake on 8 March 2012
and another earthquake with a magnitude of Mw 5.3 that occurred on 15 September 2011. The dashed line marks the cross-correlation threshold used
for validating the search results.
ARTICLE NATURE COMMUNICATIONS | DOI: 10.1038/ncomms6664
6 NATURE COMMUNICATIONS | 5:5664 | DOI: 10.1038/ncomms6664 | www.nature.com/naturecommunications
& 2014 Macmillan Publishers Limited. All rights reserved.
shifts to the P-wave arrival and simultaneously conduct a fastsearch with all the shifted entries, along with the original entry.We pick the results associated with the smallest misfit for the finalsolutions. This method helps remove the effect of an incorrectP-wave arrival.
In this study, we select an area with a size of 5� by 5� and asource depth from 5 to 60 km in Xinjiang, China and test ourearthquake search engine on a single CPU computer. If weincrease the size of the interest zone in any dimension or decreasethe gridding intervals for virtual source locations and focalsolutions, the search database will increase as well. Our intervalapproach for calculating Green’s functions suggests that thecomputation time for the synthetic data set is only associated withdistance between the hypocentre and a seismic station; thus,having more seismic stations or networks involved does notsignificantly increase the computation time. Considering theprofound and unique data information associated with bodywaves and surface waves at different frequencies, we could designmultiple parallel search processes with different data information
from the same earthquake to ensure reliable results. We may alsobe able to apply the search engine approach to streamingwaveform data in real time and keep updating the results as wereceive more data from the same earthquake. These ideas warrantfurther study.
MethodsComputer fast search technology. The earthquake search engine presented inthis study uses fast search methods that are similar to those that have been appliedin web search engines, which are designed primarily to find text-based informationon the web, and the bulk of the search effort is in indexing and ranking a largedatabase20. An image search engine is similar but is based on image content, inwhich the content similarity assessment, along with other supplementaryinformation, is used to retrieve the best matches to an entry image21–23. Internettechnologies have also inspired research in other areas. For example, Aguiar and
1
2
3
4
Variance
0 90 180 270 360 450 540Relative time (s)
D=864M=0.176Max V=0.143
D=852M=0.019
D=623M=0.061
ID=1 ID=2 ID=3 ID=4
D=797M=0.036
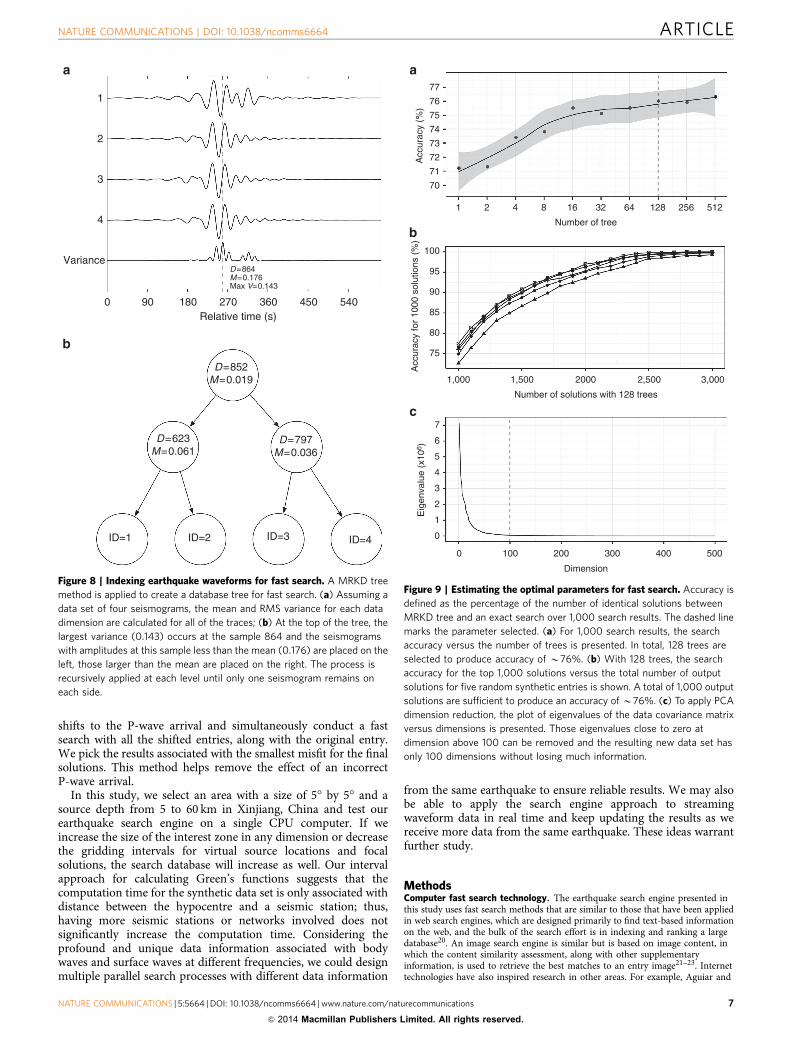
Figure 8 | Indexing earthquake waveforms for fast search. A MRKD tree
method is applied to create a database tree for fast search. (a) Assuming a
data set of four seismograms, the mean and RMS variance for each data
dimension are calculated for all of the traces; (b) At the top of the tree, the
largest variance (0.143) occurs at the sample 864 and the seismograms
with amplitudes at this sample less than the mean (0.176) are placed on the
left, those larger than the mean are placed on the right. The process is
recursively applied at each level until only one seismogram remains on
each side.
77
Acc
urac
y (%
)
76
75
74
73
72
71
70
100
95
90
85
80
75
Acc
urac
y fo
r 10
00 s
olut
ions
(%
)E
igen
valu
e (x
106 )
1,000
7
6
5
4
3
2
1
0
0 100 200 300 400 500
Dimension
1,500 2000 2,500
1
3,000
Number of solutions with 128 trees
2 4 8 16 32
Number of tree
64 128 256 512
Figure 9 | Estimating the optimal parameters for fast search. Accuracy is
defined as the percentage of the number of identical solutions between
MRKD tree and an exact search over 1,000 search results. The dashed line
marks the parameter selected. (a) For 1,000 search results, the search
accuracy versus the number of trees is presented. In total, 128 trees are
selected to produce accuracy of B76%. (b) With 128 trees, the search
accuracy for the top 1,000 solutions versus the total number of output
solutions for five random synthetic entries is shown. A total of 1,000 output
solutions are sufficient to produce an accuracy of B76%. (c) To apply PCA
dimension reduction, the plot of eigenvalues of the data covariance matrix
versus dimensions is presented. Those eigenvalues close to zero at
dimension above 100 can be removed and the resulting new data set has
only 100 dimensions without losing much information.
NATURE COMMUNICATIONS | DOI: 10.1038/ncomms6664 ARTICLE
NATURE COMMUNICATIONS | 5:5664 | DOI: 10.1038/ncomms6664 | www.nature.com/naturecommunications 7
& 2014 Macmillan Publishers Limited. All rights reserved.
Beroza38 applied an Internet ranking method to analyse earthquake waveformsimilarity.
In the computer search field, the number of sampling points in data is regardedas its ‘dimension.’ A seismogram similarity search is a high-dimensional problemthat requires a substantial effort to search for a true solution from a large data set.Dimension-reduction methods can reduce the problem size by decreasing thenumber of time samples necessary to represent the data while maintaining theessential data characteristics39. In addition to dimension reduction, an importantapproach is the development of approximate nearest-neighbour search methodsthat can be orders of magnitude faster than the exact search, while still providingnear-optimal accuracy24.
Existing fast search methods are either hash- or tree-based, such as Locality-Sensitive Hashing25 and the multiple randomized K-dimensional (MRKD) treemethod26,27. After comparing the two approaches for dealing with seismograms,we found that the MRKD-tree method is consistently faster for various sizes ofhigh-dimensional seismogram data sets. Both Silpa-Anan and Hartley26 and Mujaand Lowe24 reported that the MRKD-tree method provides the best performance incomputer vision problems for processing high-dimensional data as well. Therefore,we shall focus our effort on the MRKD-tree method in this study. This methodinvolves creating multiple tree structures from data sets by splitting the waveformdata in half at each level of the tree for the time sample in which the data exhibitthe greatest variance in amplitude. The database captures the most prominentcharacteristics in the earthquake data with limited samples. We then search the bestmatches following the tree structure when an entry arrives. The method requireslog2N comparisons to find the first candidate for the best match from one tree,where N is the number of seismograms in the database28. Additional backtrackingeffort is needed if more search returns are required.
Indexing and ranking seismograms by MRKD trees. Figure 8 illustrates how aK-dimensional tree is created with an example of four seismograms assumed in thedatabase. The first arrivals of the four seismograms are picked and aligned. At eachtime sample (dimension), the amplitude mean across four seismograms iscalculated. The bottom curve in Fig. 8a shows the amplitude variance relative to themean at each time sample. The largest amplitude variance (0.143) relative to themean (0.176) is found at time sample 864, which is selected to start a tree. At thesame selected time sample, seismograms with amplitudes lower than the mean(ID¼ 1, 4) are placed on the left of a dimension node, while those with amplitudesgreater than the mean (ID¼ 2, 3) are placed on the right. The above process isrecursively applied to seismograms on the left and right separately, until only oneseismogram (leaf node) remains below any dimension node.
Figure 8b shows a two-level tree established following the above process. Inreality, multiple randomised K-D trees should be created from the same data set forthe search. To create multiple trees, we follow the approach by Muja and Lowe24
and choose another split dimension randomly from the first m dimensions inwhich the data have the greatest variance. In our applications, we used the fixedvalue m¼ 5 and created 128 trees from a large earthquake data set. When a queryseismogram comes in, its amplitude variance relative to the mean of the data set atthe same dimension (time sampling point) will be compared with the partitioningvalue to determine to which half of the data the query data belong. This searching
process is performed among all the trees separately. At each dimension node, anaccumulated L2 distance between the input amplitude value and the mean of thedata set is calculated, and a single priority queue across all the randomised trees ismaintained by increasing the L2 distance. At each leaf node where a seismogram IDis available on the tree, the L2 norm distance between the entry and the syntheticseismogram is also calculated and placed in a candidate queue with increasingdistance. It requires an iterative search to find multiple approximate solutions. Thepriority queue determines the seismogram to be picked for comparison in the nextiteration, and the candidate queue returns a number of results in the order ofdecreasing similarity to the entry seismogram26. The idea behind this searchapproach is to settle for an approximate nearest neighbour to an entry with thehighest probability, and it may not always return the exact nearest neighbours.That principle is acceptable in seismogram matching because an exact matchto a real seismogram essentially does not exist due to our incomplete knowledgeof the 3D Earth’s structure and limited ability to accurately reproduce realwave-propagation effects.
Optimising fast search performance. Dimension reduction is another importanteffort to further speed up the search process. Its goal is to identify patterns in thedata and express the data in a compact form to highlight their similarities anddifferences. Among dimension-reduction methods, principal components analysis(PCA) has proved to be reliable for embedding the data into a linear subspace oflower dimensionality39. To apply PCA, we first calculate the covariance matrix forthe data set and then solve its eigenvectors and eigenvalues. For a data set withn dimensions, there should be n eigenvectors and eigenvalues. If we choose only thefirst p eigenvectors associated with the top p large eigenvalues, then the final dataset has only p dimensions, without losing much information. In practice, we needto examine the eigenvalue distribution and determine an optimal value for p.
It is important to select optimal parameters for applying a fast search method.Figure 9 illustrates how we select the number of trees, the number of search resultsand the PCA output dimensions for dealing with over 15 million syntheticseismograms in a data set. Figure 9a shows a plot of the search accuracy versus thenumber of trees applied in the MRKD-tree method for returning 1,000 results. Thesearch accuracy is defined as the ratio of identical solutions between the MRKDtree and exact search over the total 1,000 search results. For 128 trees, its accuracyis B76%, which means that out of the given 1,000 results, 760 fast search solutionsare identical to those from the exact search. This accuracy should be sufficient toselect the best waveform matches. Figure 9b presents a plot of the search accuracyfor the top 1,000 solutions versus the number of search solution candidates basedon the testing of five different synthetic earthquake entries. More search returnsyield more accurate results among the top 1,000 solutions, but it requires morecomputation. Selecting 1,000 solutions and 128 trees seem to reach a good balancebetween accuracy and computational effort. For the above testing data, an originaltrace consists of 3,072 time samples (dimensions). Figure 9c displays a plot of theeigenvalues versus the dimensions derived from the data covariance matrix. Thisplot is needed to determine the optimal p for applying the PCA dimensionreduction discussed above. The plot suggests that the eigenvalues at dimensionsabove 100 are close to zero. Thus, those eigenvectors associated with smalleigenvalues can be removed without losing much information. An optimal p of 100is selected and the dimensions of the new data set are reduced to 100.
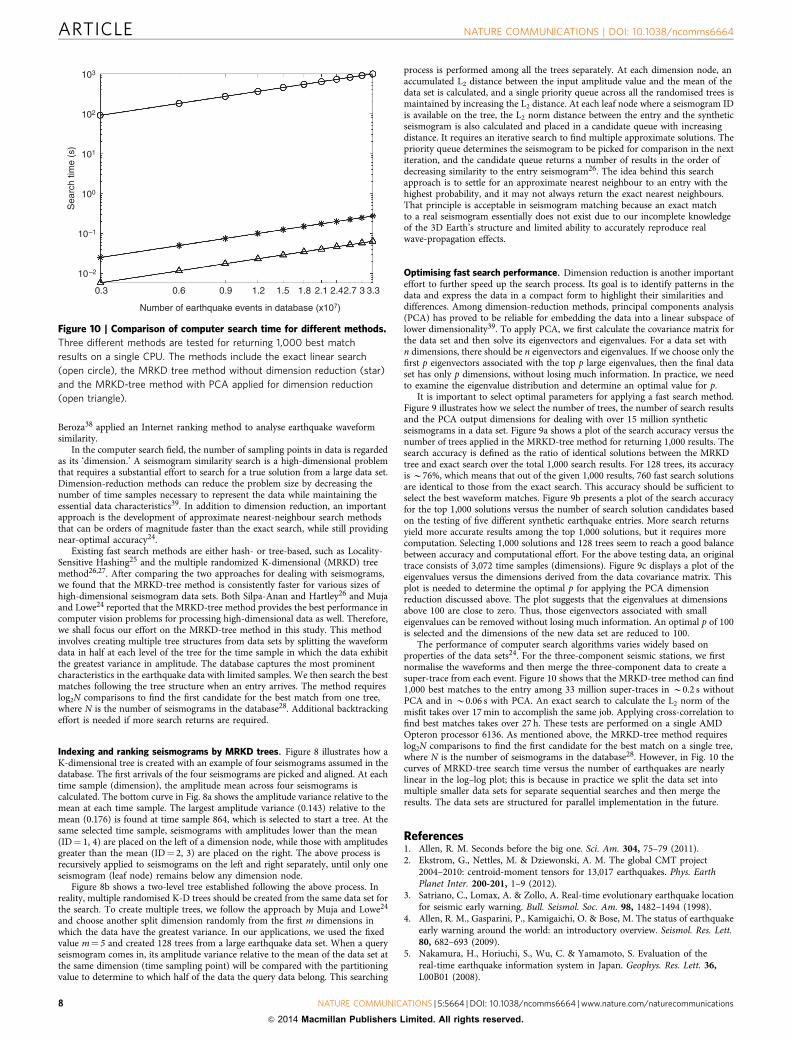
The performance of computer search algorithms varies widely based onproperties of the data sets24. For the three-component seismic stations, we firstnormalise the waveforms and then merge the three-component data to create asuper-trace from each event. Figure 10 shows that the MRKD-tree method can find1,000 best matches to the entry among 33 million super-traces in B0.2 s withoutPCA and in B0.06 s with PCA. An exact search to calculate the L2 norm of themisfit takes over 17 min to accomplish the same job. Applying cross-correlation tofind best matches takes over 27 h. These tests are performed on a single AMDOpteron processor 6136. As mentioned above, the MRKD-tree method requireslog2N comparisons to find the first candidate for the best match on a single tree,where N is the number of seismograms in the database28. However, in Fig. 10 thecurves of MRKD-tree search time versus the number of earthquakes are nearlylinear in the log–log plot; this is because in practice we split the data set intomultiple smaller data sets for separate sequential searches and then merge theresults. The data sets are structured for parallel implementation in the future.
References1. Allen, R. M. Seconds before the big one. Sci. Am. 304, 75–79 (2011).2. Ekstrom, G., Nettles, M. & Dziewonski, A. M. The global CMT project
2004–2010: centroid-moment tensors for 13,017 earthquakes. Phys. EarthPlanet Inter. 200-201, 1–9 (2012).
3. Satriano, C., Lomax, A. & Zollo, A. Real-time evolutionary earthquake locationfor seismic early warning. Bull. Seismol. Soc. Am. 98, 1482–1494 (1998).
4. Allen, R. M., Gasparini, P., Kamigaichi, O. & Bose, M. The status of earthquakeearly warning around the world: an introductory overview. Seismol. Res. Lett.80, 682–693 (2009).
5. Nakamura, H., Horiuchi, S., Wu, C. & Yamamoto, S. Evaluation of thereal-time earthquake information system in Japan. Geophys. Res. Lett. 36,L00B01 (2008).
103
102
101
Sea
rch
time
(s)
100
10–1
10–2
0.3 0.6
Number of earthquake events in database (x107)
0.9 1.2 1.5 1.8 2.1 2.42.7 3 3.3
Figure 10 | Comparison of computer search time for different methods.
Three different methods are tested for returning 1,000 best match
results on a single CPU. The methods include the exact linear search
(open circle), the MRKD tree method without dimension reduction (star)
and the MRKD-tree method with PCA applied for dimension reduction
(open triangle).
ARTICLE NATURE COMMUNICATIONS | DOI: 10.1038/ncomms6664
8 NATURE COMMUNICATIONS | 5:5664 | DOI: 10.1038/ncomms6664 | www.nature.com/naturecommunications
& 2014 Macmillan Publishers Limited. All rights reserved.
6. Espinosa-Aranda, J. et al. Mexico City seismic alert system. Seismol. Res. Lett.66, 42–53 (1995).
7. Wu, Y. M. & Teng, T. L. A virtual sub-network approach to earthquake earlywarning. Bull. Seismol. Soc. Am. 92, 2008–2018 (2002).
8. Erdik, M. et al. Istanbul earthquake rapid response and the early warningsystem. Bull. Earthquake Eng. 1, 157–163 (2003).
9. Horiuchi, S., Negishi, H., Abe, K., Kamimura, A. & Fujinawa, Y. An automaticprocessing system for broadcasting earthquake alarms. Bull. Seismol. Soc. Am.95, 708–718 (2005).
10. Kanamori, H. Real-time seismology and earthquake damage mitigation. Annu.Rev. Earth Planet. Sci. 33, 195–214 (2005).
11. Lee, J., Friederich, W. & Meier, T. Real time monitoring of moment magnitudeby waveform inversion. Geophys. Res. Lett. 39, L02309 (2012).
12. Guilhem, A. & Dreger, D. S. Rapid detection and characterization of largeearthquakes using quasi-finite-source Green’s functions in continuous momenttensor inversion. Geophys. Res. Lett. 38, L13318 (2011).
13. Tsuruoka, H., Kawakatsu, H. & Urabe, T. GRiD MT (grid-based real-timedetermination of moment tensors) monitoring the log-period seismic wavefield.Phys. Earth Planet. Inter 175, 8–16 (2009).
14. Melgar, D., Bock, Y. & Crowell, B. W. Real-time centroid moment tensordetermination for large earthquakes from local and regional displacementrecords. Geophys. J. Int. 188, 703–718 (2012).
15. Crowell, B. W., Bock, Y. & Melgar, D. Real-time inversion of GPS data for finitefault modeling and rapid hazard assessment. Geophys. Res. Lett. 39, L09305(2012).
16. Papazachos, B. C. & Dimitriu, P. P. Tsunamis in and near Greece and theirrelation to the earthquake focal mechanisms. Natural Hazards 4, 161–170(1991).
17. Ismoyo, B. Indonesia battles disasters on two fronts. The Jakarta Globe 1.http://thejakartaglobe.beritasatu.com/archive/indonesia-battles-disasters-on-two-fronts/404050/ (2010).
18. Yue, H., Lay, T. & Koper, K. D. En echelon and orthogonal fault ruptures of the11 April 2012 great intraplate earthquakes. Nature 490, 245–249 (2012).
19. Bouchon, M. et al. Extended nucleation of the 1999 Mw 7.6 Izmit earthquake.Science 331, 877–880 (2011).
20. Henzinger, M. Search technologies for the Internet. Science 317, 468–471 (2007).21. Bach, J. R. et al. Virage image search engine: an open framework for image
management. In Storage and Retrieval for Still Image and Video Databases IV.2670, 76–87 (eds Sethi, I. K. & Jain, R. C.) (SPIE, 1996).
22. Sahami, M., Mittal, V., Baluja, S. & Rowley, H. The Happy Searcher: Challengesin Web Information Retrieval. Proc. 8th Pacific Rim Int. Conf. ArtificialIntelligence 3157, 3–12 (eds Zhang, C., Guesgen, H. W. & Yeap, W. K.)(Springer, 2004).
23. Zhou, W., Li, H., Lu, Y. & Tian, Q. Large scale image retrieval with geometriccoding. ACM International Conference on Multimedia (MM) 1349–1352(2011).
24. Muja, M. & Lowe, D. G. Fast approximate nearest neighbors with automaticalgorithm configuration. Proc. International Conf. Computer Vision Theory andApplications (VISAPP’09) Vol. 1, 331 (2009).
25. Slaney, M. & Casey, M. Locality-sensitive hashing for finding nearest neighbors.IEEE Signal Process. Mag. 25, 128–131 (2008).
26. Silpa-Anan, C. & Hartley, R. Optimised KD-trees for fast image descriptormatching. Computer Vision and Pattern Recognition 1–8 (Institute of Electricaland Electronics Engineers (IEEE), 2008).
27. Wu, P., Hoi, S. C. H., Nguyen, D. D. & He, Y. Randomly Projected KD-Treeswith Distance Metric Learning for Image Retrieval. Proc. 17th Int. Conf. Adv.Multi. Model. 371–382 (Springer, 2011).
28. Friedman, J. H., Bentley, J. L. & Finkel, R. A. An algorithm for finding bestmatches in logarithmic expected time. ACM Trans. Math. Softw. 3, 209–226(1977).
29. Berchtold, S., Bohm, C., Keim, D. A. & Kriegel, H. P. A cost model for nearestneighbor search in high-dimensional data space. Proc. 16th ACM SIGACT-SIGMOD-SIGART Symp. Principles of Database Systems 78–86 (ACM Press,1997).
30. Yianilos, P. N. Data structure and algorithms for nearest neighbor search ingeneral metric spaces. Proc. 5th ACM-SIAM Symp. Discr. Algorithms 311–321(Society for Industrial and Applied Mathematics, 1993).
31. Seidl, T. & Kriegel, H. P. Optimal multi-step k-nearest neighbor search. Proc. ACMSIGMOD Int. Conf. on Management of Data 27, 154–165 (SIGMOD, 1998).
32. Arya, S., Mount, D. M., Netanyahu, N. S., Silverman, R. & Wu, A. Y. in Proc.of the Fifth Annual ACM-STAM Symp. on Discrete Algorithms 573–582(Association for Computing Machinery (ACM), 1994).
33. Zhu, L. & Rivera, L. A. A note on the dynamic and static displacements from apoint source in multilayered media. Geophys. J. Int. 148, 619–627 (2002).
34. Dziewonski, A. M. & Anderson, D. L. Preliminary reference Earth model. Phys.Earth Planet Inter. 25, 297–356 (1981).
35. Ekstrom, G. & Nettles, M. Global CMT Web Page. http://www.globalcmt.org/(2014).
36. National Earthquake Information Center—NEIC. http://earthquake.usgs.gov/regional/neic/ (2014).
37. Shearer, P. M. Introduction to Seismology (Cambridge Univ. Press, 1999).38. Aguiar, A. C. & Beroza, G. C. PageRank for earthquakes. Seismol. Res. Lett. 85,
344–350 (2014).39. Jolliffe, I. T. Principal Component Analysis (Springer-Verlag, 1986).
AcknowledgementsWe thank Lupei Zhu for offering earthquake modelling programs used in this study. Thisstudy benefits from discussion with Cliff Thurber, Mark Zoback, Greg Beroza, Lupei Zhu,Xiaofei Chen, Weiping Li and Oz Yilmaz. We thank the National Basic ResearchProgram (985) of China for funding support with the grant number ZC9850290137,the National Earthquake Reporting Research Program of China Earthquake Adminis-tration with the grant number 201408018 and the National Science Foundation forDistinguished Young Scholars of China with the grant number 61325010.
Author contributionsJ.Z. designed the project, analysed the data and wrote the manuscript. H.J.Z. and E.H.C.also analysed the results and helped in writing the manuscript. Y.Z. and X.Z. tested themethod. Y.Z. and W.H.K. processed and analysed the data.
Additional informationCompeting financial interests: The authors declare no competing financial interests.
Reprints and permission information is available online at http://npg.nature.com/reprintsandpermissions/
How to cite this article: Zhang, J. et al. Real-time earthquake monitoring using a searchengine method. Nat. Commun. 5:5664 doi: 10.1038/ncomms6664 (2014).
This work is licensed under a Creative Commons Attribution 4.0International License. The images or other third party material in this
article are included in the article’s Creative Commons license, unless indicated otherwisein the credit line; if the material is not included under the Creative Commons license,users will need to obtain permission from the license holder to reproduce the material.To view a copy of this license, visit http://creativecommons.org/licenses/by/4.0/
NATURE COMMUNICATIONS | DOI: 10.1038/ncomms6664 ARTICLE
NATURE COMMUNICATIONS | 5:5664 | DOI: 10.1038/ncomms6664 | www.nature.com/naturecommunications 9
& 2014 Macmillan Publishers Limited. All rights reserved.